1
Optical remote sensing applications in viticulture - a review
A HALL1,2,3, DW LAMB1,2, B HOLZAPFEL1,2 and J LOUIS1,2
Abridged Title: Optical remote sensing applications in viticulture
1Cooperative Research Centre for Viticulture, PO Box 154, Glen Osmond, SA 5064
2National Wine and Grape Industry Centre, Charles Sturt University, Locked Bag 588,
Wagga Wagga, NSW 2678
3Corresponding author: Andrew Hall, [email protected], Fax: 02 6933 2737
Abstract
The emergence of precision agriculture technologies and an increasing demand for higher
quality grape products has led to a growing interest in the practice of precision viticulture;
monitoring and managing spatial variations in productivity-related variables within single
vineyards. Potentially, one of the most powerful tools in precision viticulture is the use of
remote sensing through its ability to rapidly provide a synoptic view of grapevine shape, size
and vigour over entire vineyards. Its potential for improving viticultural practice is evident
by the relationships that are known to exist between these canopy descriptors and grape
quality and yield. This paper introduces the reader to remote sensing and reviews its recent,
and potential, applications in viticulture.
Abbreviations
EM electromagnetic; GPS global positioning system; GIS geographical information system;
NDVI normalised difference vegetation index
Key words: remote sensing, precision viticulture, multispectral imaging, grapevine,
vegetative vigour

2
Introduction
Grapevine (Vitis vinifera) health and productivity are influenced by numerous physical,
biological and chemical factors, including spatial variations in topography, physical and
chemical characteristics of soils and the incidence of pests and diseases. The spatial variation
in these factors effects a spatial variation in grape quality and yield within vineyards leading
to an overall reduction in wine quality and volume. With the likelihood of increased
differentiation in pricing between grapes based on measured quality attributes (Winemakers
Federation 1996), vineyard management decisions must account for spatial variability in
quality and yield in order to produce a higher-quality higher-value product. However, these
decisions rely on the availability of accurate and reliable data that describe spatial variability
in relevant vine descriptors.
The emergence of global positioning systems (GPS) technology means traditional on-site
measurements of physical, chemical and biological parameters associated with vine
productivity can now be linked to specific locations within vineyards. This information,
when used in conjunction with computer-based geographical information systems (GIS),
provides viticulturists with the capability to process and map spatial relationships between
attributes and make management decisions based on numerous layers of information (Taylor,
2000). The process of modulating cultural practices as a function of spatial and temporal
variation within agricultural fields is known as precision agriculture (Cook and Bramley
1998, Moran et al. 1997). In the context of the grape and wine industry, precision viticulture
may be defined as monitoring and managing spatial variation in productivity-related
variables (yield and quality) within single vineyards (Lamb and Bramley 2001).
In recent years, yield maps produced by grape-yield monitors in Australia have shown up to
eight-fold differences in yield can occur within a single vineyard block (Bramley and Proffitt
1999). Furthermore, there are considerable spatial variations in quality indicators such as
colour and baume (Bramley and Proffitt 2000). Relationships between yield and quality

3
indicators are often inferred, however these relationships do vary significantly between
vineyards (Holzapfel et al. 1999, Holzapfel et al. 2000), and possibly within vineyards.
Moreover, preliminary data suggest regions of high and low-yielding vines in a vineyard
tend to remain stable in time, inferring that soils play a significant role in such variability
(Bramley et al. 2000). The accurate characterisation of spatial variations in those parameters
that influence vineyard productivity requires a considerable amount of data. Traditional
methods of generating such data are generally time consuming and expensive. For example,
measuring basic fruit quality and yield parameters of sixty sample sites in a one hectare
block requires more than thirty work-hours. The move toward on-the-go sensing of yield and
quality parameters by combining the latest sensor technology with GPS-equipped vehicles is
slow and currently limited to grape yield. However, rapid sensing techniques such as
measurement of baume using near infrared (NIR) spectroscopy (Williams 2000) and grape-
phenolic composition using visible-NIR spectroscopy (Celotti et al. 2001) are potential
candidates for on-the-go sensing. The use of rapid electromagnetic induction or EM-survey
techniques to accurately characterise soil structure is also becoming more widely used in the
grape and wine industry (Lamb and Bramley 2001).
The use of remote sensing as a means of monitoring crop growth and development is
attracting interest from researchers and commercial organisations alike. This interest is
primarily driven by the opportunities for cost-effective generation of spatial data amenable to
support precision agriculture activities (Lamb 2000). To date, limited use is being made of
this technology in the grape and wine industry, either for research support or as a
commercial monitoring tool. This paper presents some of the key principles of remote
sensing, reviews the current status of remote sensing in viticulture, and discusses the
potential of remote sensing as part of an integrated management tool for vineyards.
4
How does remote sensing work?
Remote sensing involves measuring features on the earth's surface using remote satellite or
aircraft-mounted sensors. In terms of optical remote sensing, sensors detect and record
sunlight reflected from the surface of objects on the ground. The ability of a sensor to detect
these objects is quantified in terms of the sensor's spatial, radiometric, spectral and temporal
resolution.
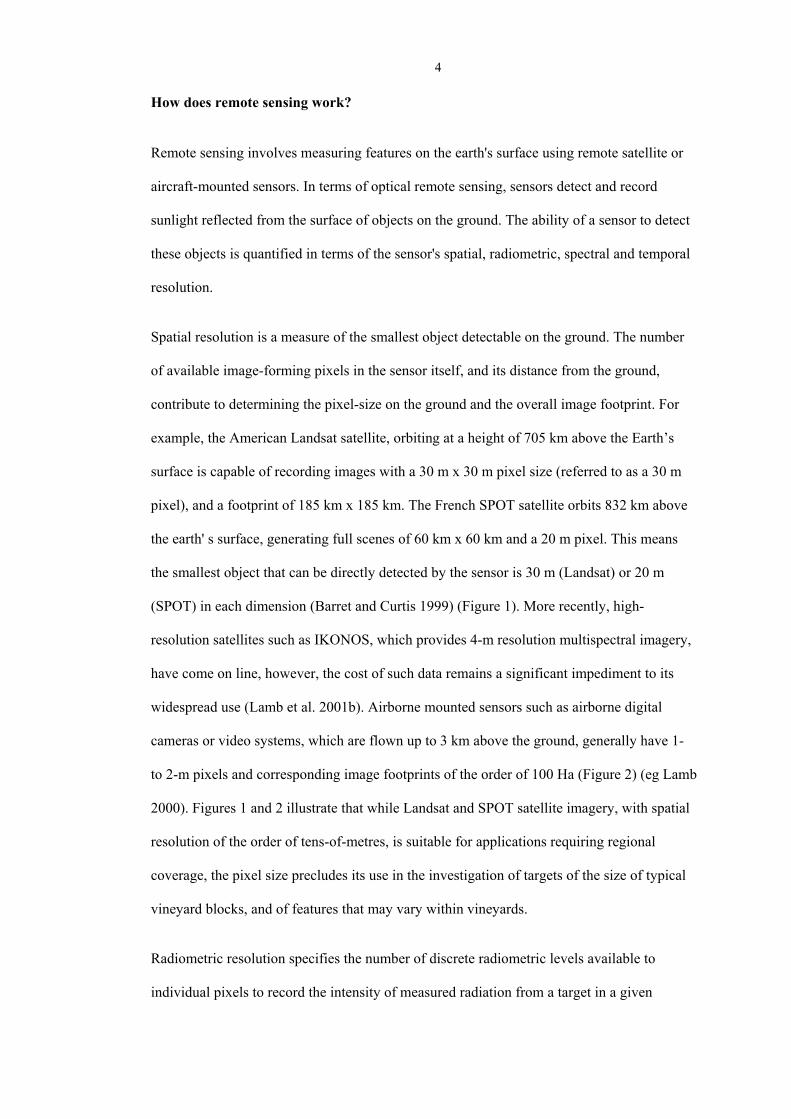
Spatial resolution is a measure of the smallest object detectable on the ground. The number
of available image-forming pixels in the sensor itself, and its distance from the ground,
contribute to determining the pixel-size on the ground and the overall image footprint. For
example, the American Landsat satellite, orbiting at a height of 705 km above the Earth’s
surface is capable of recording images with a 30 m x 30 m pixel size (referred to as a 30 m
pixel), and a footprint of 185 km x 185 km. The French SPOT satellite orbits 832 km above
the earth' s surface, generating full scenes of 60 km x 60 km and a 20 m pixel. This means
the smallest object that can be directly detected by the sensor is 30 m (Landsat) or 20 m
(SPOT) in each dimension (Barret and Curtis 1999) (Figure 1). More recently, high-
resolution satellites such as IKONOS, which provides 4-m resolution multispectral imagery,
have come on line, however, the cost of such data remains a significant impediment to its
widespread use (Lamb et al. 2001b). Airborne mounted sensors such as airborne digital
cameras or video systems, which are flown up to 3 km above the ground, generally have 1-
to 2-m pixels and corresponding image footprints of the order of 100 Ha (Figure 2) (eg Lamb
2000). Figures 1 and 2 illustrate that while Landsat and SPOT satellite imagery, with spatial
resolution of the order of tens-of-metres, is suitable for applications requiring regional
coverage, the pixel size precludes its use in the investigation of targets of the size of typical
vineyard blocks, and of features that may vary within vineyards.
Radiometric resolution specifies the number of discrete radiometric levels available to
individual pixels to record the intensity of measured radiation from a target in a given

5
waveband. For example, 8-bit radiometric resolution means there are 28 = 256 levels
available (0 = darkest, 255 = brightest) while 10-bit sensors have 210 = 1024 levels available
to each image pixel. In practise, however, n-bit systems tend to only have (n-2)-bits of
information in image pixels as usually the lowest 2-bits of data carries the system noise,
including dark-current and thermal noise (King 1992, Louis et al. 1995).
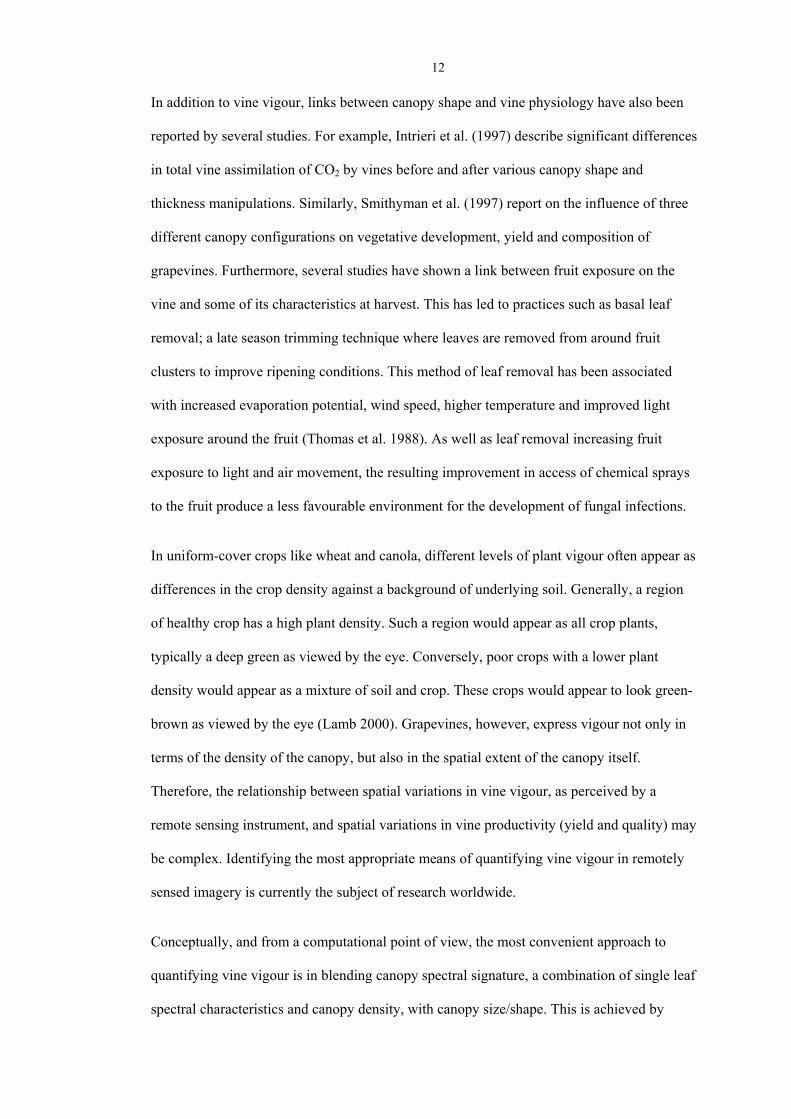
Temporal resolution or, more simply, revisit-frequency is an important attribute of any
sensor when used for commercial monitoring or management purposes. Typical commercial
satellites like the American Landsat and French SPOT satellites have revisit intervals of 16
and 26 days, respectively. In the case of SPOT imagery, a target-pointing capability during
different overpasses could reduce this interval to as low as 2 days (Barrett and Curtis 1999).
Aircraft mounted sensors, on the other hand, are more amenable to user-defined visitations,
and have the added advantage of being able to operate under a high-cloud base (Figure 3).
The spectral resolution is the number of wavebands of data that can be simultaneously
recorded at each pixel. The amount of sunlight reflected off a target is described in terms of
the target's reflectance profile. The spectral reflectance profiles for Cabernet Sauvignon
vines, underlying covercrop (chick-peas) and bare soil are given in Figure 4. These profiles
indicate the amount of sunlight these targets reflect as a function of the wavelength (or
colour). All photosynthesising plants, including vine canopies and covercrops, do not reflect
much light in blue or red wavelengths because chlorophylls (and related pigments) absorb
much of the incident energy in these wavelengths for the process of photosynthesis.
However, these targets reflect a higher proportion of light in the green wavelengths, again
due to chlorophylls and related pigments, and this is why such targets appear green when
viewed by the human eye. However, in the near infrared wavelengths (wavelengths greater
than about 700 nm) photosynthesising plants reflect large proportions of the incident sunlight
(in excess of 65%). These wavelengths, to which the human eye is insensitive, can be
detected by appropriate instruments. The amount of sunlight reflected in these wavelengths
is very sensitive to leaf cell structure and this is influenced by water content (Campbell 1996,

6
pp. 456-459). Figures 5(a) and (b) show the reflectance profile of a typical vegetated target.
Superimposed on these profiles are a set of wavebands corresponding to the sensitivity of a
hypothetical instrument and the reflectance profile that would be inferred from the response
of that instrument to the ground target. In Figure 5(a), the hypothetical instrument measures
the spectral signature of the target in four wavebands. While an accurate measure of the
target reflectance would be extracted at the four specified wavebands, the shape of the
reflectance profile of the vegetated target is only poorly described. Using thirteen closely
spaced wavebands (Figure 5(b)), the reflectance of the target is recorded for each waveband
and the shape of the entire spectral profile is more accurately described. In an application
where fine detail in the shape of the spectral profile is required, the higher spectral-resolution
instrument (Figure 5(b)) would be appropriate.
A consequence of the upper limit on the amount of data that can be processed and stored in
real-time by any remote sensing system is the compromise between spatial, radiometric and
spectral resolution. In general, this equates to a trade-off between spatial and spectral
resolution. The terms multispectral and hyperspectral are often interchanged, although they
usually define instruments according to the number of wavebands of information that is
recorded for each image pixel. The more general adjective ‘multispectral’ is used to describe
instruments that record information in only a small number of wavebands; typically 2-10.
Hyperspectral instruments record information in a large number of wavebands, typically
greater than 10.
Spectral vegetation indices reduce the multiple-waveband data at each image pixel to a
single numerical value (index), and many have been developed to highlight changes in
vegetation condition (eg Wiegand et al. 1991, Price and Bausch 1995). Vegetation indices
utilise the significant differences in reflectance of vegetation at green, red and near infrared
wavelengths. For example, Normalised Difference Vegetation Index (NDVI) images are
created by transforming each multi-waveband image pixel according to the relation:

7
)( + )()( - )(
redrednear infraredrednear infraNDVI = (Equation 1)
where ‘near infrared’ and ‘red’ are respectively the reflectances in each band (Rouse et al.
1973). The NDVI, a number between –1 and +1, quantifies the relative difference between
the near infrared reflectance ‘peak’ and red reflectance ‘trough’ in the spectral signature
(refer to Figure 4 for an example). This index is the most widely used indicator of plant
vigour or relative biomass. For highly vegetated targets, the NDVI value will be close to
unity, while for non-vegetated targets the NDVI will be close to zero. Negative values of
NDVI rarely occur in natural targets.
One important advantage of ratio indices such as the NDVI is that the intensity of the total
light reflected from a target does not influence the calculation. An object under shadow will
reflect light reduced by approximately the same amount across the entire spectrum. Although
there is a reduction in the precision of NDVI for areas in shadow, because of a reduction in
the total range of reflectance levels, the ratio of two spectrally similar features should be the
same. Through the use of vegetation indices, shadows, which may otherwise be a significant
problem in imaging a vineyard with closely spaced rows, are effectively removed.
Airborne imaging systems
The use of airborne colour and colour-infrared photography for monitoring crops in
Australia was established in the early 1970’s (eg Harris and Haney 1973). These techniques
were later extended to detect weeds in crops and pastures (Barrett and Leggett 1979, Arnold
et al. 1985). However, limitations of aerial photography for crop monitoring include the
absence of a quantitative data acquisition capability, the high cost and availability of colour
infrared film and processing, and the requirement for manual scanning or digitising. The
intrinsic analogue nature of the imagery results in significant additional processing and delay
prior to incorporating the imagery into a GIS.

8
Airborne imaging systems, incorporating in-flight or post-flight image digitisation can
provide sub-metre resolution images of crops at any revisit frequency and in a timely and
cost-effective manner. Multispectral imaging systems provide user-selectable spectral bands,
some as narrow as 10 nm bandwidth. These bands are commonly available in the visible and
near infrared (NIR) (eg Manzer and Cooper 1982, Louis et al. 1995, Anderson and Yang
1996, Sun et al. 1997), and the mid-infrared bands (SWIR) (Everitt et al. 1986, Everitt et al.
1987). Hyperspectral imaging systems also provide user-selectable wavebands. Systems such
as the Compact Airborne Spectrographic Imager (CASI-2) offers up to 288 wavebands with
approximately a 2.2 nm bandwidth in the range of 400 - 900 nm (ITRES 2001). By
comparison, Hymap imagery offers up to 200 wavebands in the visible, NIR, SWIR and
thermal infrared (TIR) (Intspec 2001). However, due to power and stability requirements,
airborne hyperspectral imaging systems are confined to operation in larger twin-engine
aircraft and this makes them significantly more expensive to operate than multispectral
imaging systems which can be deployed in single-engine aircraft. Airborne multispectral and
hyperspectral systems are ideal for quantification of crop growth in agricultural research
applications. These systems have spectral bands in the visible green (555-580 nm) and red
(665-700 nm) wavelengths, and in the near-infrared (740-900 nm) wavelengths, and provide
the high temporal and spatial resolution needed for agricultural research plot evaluation
(Clevers 1986, Clevers 1988a, Clevers 1988b, Lamb 2000). Insights provided by such
research and the increasing affordability of multispectral imaging systems have resulted in
them becoming more widely used over a wide variety of Australian crops (Lamb 2000).
Remote sensing as a tool for precision viticulture
Remote sensing of soils
Along with climate and topography, soil is a key factor influencing vineyard productivity
(Jackson 2000). At the regional or between-vineyard scale, soil has been described as having
the least significant effect on grape wine and quality (eg Rankine et al. 1971, Wahl 1988).

9
However, at the scale of individual vineyards, soil and topography are often strongly
connected (Jackson 2000, Yule et al. 2001, Taylor and McBratney 2001), as are topography
and climate, in particular microclimate (Percival et al. 1994, Hutchinson 2001). On-ground
physical measurements of soil structure and condition in vineyards have demonstrated
significant variations can exist within single vineyards. For example, using EM-surveying to
measure soil electrical conductivity in two contrasting Australian vineyards demonstrated up
to three-fold differences in conductivity existed within each. In the case of the 7 hectare
Coonawarra vineyard used in this study, conductivity was highly correlated to soil depth and
the latter varied by a factor of two (Bramley et al. 2000). Similarly, large variations in petiole
nutrient levels in the same vineyard suggested large spatial differences in soil mineral
content (Bramley 2001a). Spatially referenced grape yield maps acquired from a number of
Australian vineyards over the past three years suggest regions of high- and low-yielding
vines tend to remain stable in time. This suggests that soils, and their association with
topography and microclimate, play an important role in characterising the spatial
characteristics of within-vineyard variability. Therefore, it is no surprise that considerable
effort in precision viticulture research is targeting measuring and mapping spatial variability
in soils at the single vineyard scale.
Often, different soils, because of differences in intrinsic colour, moisture levels and organic
and mineral constituents, have different optical reflectance characteristics (Condit 1970,
Colwell 1983, Escadafal et al. 1989). However, care must be taken when using optical
remote sensing for mapping soil structure on the basis of surface reflectance as visible and
near infrared radiation penetrates only to within a few millimetres of the soil surface (Lee
1978). Numerous studies have reported varying levels of agreement in comparing bare-soil
images with other on-ground soil data such as EM survey (Pitcher-Campbell et al. 2001) and
traditional soil sampling (Grierson and Bolt 1995, Ryan and Lewis 2001). In a situation
where the ground has been ploughed, as in the preparation of a new vineyard site, the soil
surface may more accurately reflect soil variations in the vicinity of the vine root-zone.

10
Imagery, highlighting differences in the vigour of the pre-existing pasture or crop, may also
be useful in identifying different soil zones in a potential vineyard site before cultivation,
(for example, see figure 2 in Lamb 1999). Recent work, involving the Hymap hyperspectral
sensor demonstrated the enormous potential of high-order image processing of many
wavebands of spectral information (Ryan and Lewis 2001). Ryan and Lewis contended that
using 128 spectral wavebands of Hymap allowed them to discriminate numerous soil zones
underneath mature vines. However, the extent to which these soil analyses relied on direct
soil spectral information versus indirect measurements of the subtle variations in vine vigour
was not established.
By identifying regions of similar soils and matching suitable varieties and clones to the
particular soil types, remotely sensed images can be a valuable tool at the planning stage of
vineyard development. Soil-related effects in a given field will vary from season to season,
and may completely reverse under different rainfall conditions (eg Lamb 2000). However,
positioning varietal blocks so that they are contained within only one soil type with its own
irrigation system allows easy management and a more consistent product (Grierson and Bolt
1995). Although physical soil sampling will remain an essential requirement of ground-
truthing, the major advantage of remote sensing is in reducing the amount of soil sampling
required to adequately characterise and delineate soil zones. A single imaging mission, with
a view to segregating a site into homogeneous blocks has potential to characterise variability
and increase overall quality and productivity of a vineyard development. The economic
benefits of planning in this way are considerable, as the cost of imaging at this stage can be
inexpensive (Grierson and Bolt 1995) yet beneficial to a vineyard over its entire lifetime.
Remote sensing of vines
Despite its increasing level of application usage in the analysis of broadacre agriculture
crops, airborne imaging is yet to be fully evaluated over established vineyards with respect to
quantifying attributes of the vines themselves. Two distinct functions of imaging established

11
vineyards have so far been identified. The first is the general mapping of vines to accurately
establish numbers of different varietals within vineyards, and the second is the mapping of
levels of relative vigour to establish spatial differences in vine performance within single
varietal blocks.
In terms of general mapping, accurate information concerning the location and size of blocks
containing different varietals allows for more accurate forecasting of regional productivity
and the allocation of resources for subsequent winemaking (Bramley 2001b). Subtle
differences in leaf spectral signature and phenology, and vine shape/size, suggest that it may
be possible to discriminate and map different varietals using remote sensing. However, such
differences may be quite small and would likely require a sensor with a combination of
metre-resolution imagery and a large number of spectral wavebands. To date, only
hyperspectral instruments such as CASI have been successfully used to discriminate
different varietals within vineyards and to identify mis-planting of one variety within a block
containing another (eg Bradey and Wiley 2000).
Information regarding relative vigour levels has many applications for improving
management at the precision scale, such as the early detection of certain vine diseases or the
identification of discrete management zones. Spatial differences in environmental factors
result in significant spatial variations in vigour throughout a vineyard. Vine vigour is
reported to have a considerable effect on fruit yield and quality (Dry 2000, Haselgrove et al.
2000, Petrie et al. 2000, Tisseyre et al. 1999, Iland et al. 1994). For example, in a single
block of Cabernet Sauvignon, researchers demonstrated that yields of vigorous vines were
nearly double that of stressed vines (Clingeleffer and Sommer 1995). In the same study,
considerable delays in fruit maturation were also associated with the more-vigorous and
higher-yielding vines. Three levels of vine vigour used in the study produced significant
differences in juice and wine parameters; higher-yielding vines produced grapes of lower
quality. Based on such observations, vine vigour could be used as surrogate indicators of
vine yield and grape quality.
12
In addition to vine vigour, links between canopy shape and vine physiology have also been
reported by several studies. For example, Intrieri et al. (1997) describe significant differences
in total vine assimilation of CO2 by vines before and after various canopy shape and
thickness manipulations. Similarly, Smithyman et al. (1997) report on the influence of three
different canopy configurations on vegetative development, yield and composition of
grapevines. Furthermore, several studies have shown a link between fruit exposure on the
vine and some of its characteristics at harvest. This has led to practices such as basal leaf
removal; a late season trimming technique where leaves are removed from around fruit
clusters to improve ripening conditions. This method of leaf removal has been associated
with increased evaporation potential, wind speed, higher temperature and improved light
exposure around the fruit (Thomas et al. 1988). As well as leaf removal increasing fruit
exposure to light and air movement, the resulting improvement in access of chemical sprays
to the fruit produce a less favourable environment for the development of fungal infections.
In uniform-cover crops like wheat and canola, different levels of plant vigour often appear as
differences in the crop density against a background of underlying soil. Generally, a region
of healthy crop has a high plant density. Such a region would appear as all crop plants,
typically a deep green as viewed by the eye. Conversely, poor crops with a lower plant
density would appear as a mixture of soil and crop. These crops would appear to look green-
brown as viewed by the eye (Lamb 2000). Grapevines, however, express vigour not only in
terms of the density of the canopy, but also in the spatial extent of the canopy itself.
Therefore, the relationship between spatial variations in vine vigour, as perceived by a
remote sensing instrument, and spatial variations in vine productivity (yield and quality) may
be complex. Identifying the most appropriate means of quantifying vine vigour in remotely
sensed imagery is currently the subject of research worldwide.
Conceptually, and from a computational point of view, the most convenient approach to
quantifying vine vigour is in blending canopy spectral signature, a combination of single leaf
spectral characteristics and canopy density, with canopy size/shape. This is achieved by

13
using remotely sensed imagery with a spatial resolution comparable to the inter-row spacing
of the target vines (Figure 6). Assuming the background covercrop is uniform, or at the least
shaded by vines, this process produces image pixels that are a local average of vine and
inter-row space (non-vine) spectral signatures. Changes in leaf spectral signature or the
proportion of vine and non-vine area within single image pixels will change the average
pixel value (Figure 7).
Johnson et al. (1996) have successfully used this technique to identify broad areas of
vineyard infested with the highly damaging vine aphid, phylloxera (Daktulosphaira
vitifoliae). This was achieved by relating the level of phylloxera incidence to the level of
vine vigour. The level of vine vigour on the ground was quantified in terms of pruning
weight where the largest or most dense vines yielded the greatest weight of vegetation during
subsequent pruning. Correlations established between the NDVI values extracted from
imagery and canopy pruning weights were used to indicate areas subject to phylloxera
infestation. Significant correlations have also been achieved between NDVI and canopy leaf
area index (m2 leaf area per m2 of ground) and leaf area per vine (m2 per vine). These
correlations have been established over multiple vineyards using 4 metre-resolution
IKONOS satellite imagery (Johnson et al. 2001).
A consequence of the link between canopy vigour and grape yield is that significant
correlations between image-derived NDVI values and subsequent grape yield is possible
(Baldy et al. 1996, Lamb et al. 2001a). These relationships remain valid regardless of
whether the driving influence behind the spatial variation is water and nutrient status (eg
Clingeleffer and Sommer 1995) or pests and diseases (eg Baldy et al. 1996, Munkvold et al.
1994). Similarly, studies involving assessment of the effect of canopy morphology on fruit
characteristics have suggested some qualities of the fruit may also be inferable from vine
size/shape or vigour. Where it can be established from remotely sensed imagery that vines
within a block have, for example a more open canopy, it could be expected that the fruit
character and other biophysical properties of the vine are being influenced. Numerous

14
researchers worldwide have indicated that links between remotely sensed imagery and grape
quality indices are being investigated (eg Vintage 2001, CRCV 2001). However, outcomes
have yet to be reported in the scientific literature.
Separation of leaf spectral signature from vine size/shape characteristics in remotely sensed
imagery can only be achieved through using more complex data-extraction procedures.
Furthermore, extraction of vine size/shape descriptors requires images of spatial resolution
of tens of centimetres, as large numbers of image pixels must be covered by individual vines.
Hall et al. (2001) have reported developing a "vinecrawler" algorithm for extracting both
spectral-signature and canopy dimension information from ultra-high (25-cm) resolution
multispectral images of vines. This process first involves the classification of vine and non-
vine pixels. The inter-row space, which would otherwise confound vine shape/size
measurement, can be eliminated from the analysis (Figure 8). The vinecrawler algorithm
progressively moves along the centre of the classified vine rows and records spectral
signature parameters as well as size/shape descriptors such as the width of the canopy cross-
section (number of pixels), skew and kurtosis (Figure 9). Importantly, this technique has
allowed the identification of individual vines, which allows the generation of a row-vine
coordinate system from vineyard imagery. This has an immediate application in terms of
directing on-ground field visitations to regions identified from remotely sensed imagery
(Hall et al. 2001). Work on linking these complex vine descriptors with grape quality indices
is reported to be in progress.
The way ahead
Although it is undergoing rapid growth on the heels of precision viticulture, the application
of remote sensing in viticulture is in its infancy. With the proliferation of newer, more
advanced remote sensing technologies, growers are being tempted by the promise of value-
added products such as yield and quality maps. Scientific investigations are only now in
progress to evaluate the capability and utility of remote sensing to directly estimate yield and

15
quality parameters. In the meantime, research has demonstrated the ability of remote sensing
for simply monitoring and mapping vine-canopy vigour within vineyards. The link between
remotely sensed imagery and simple canopy spectral signature and size/shape descriptors is
more clearly understood. The ability of remote sensing to provide a synoptic snapshot of
vineyard variability could be used for directing in-vineyard sampling to ascertain causes of
variability, or as a means of detecting changes in spatial variations of vine vigour during or
between seasons. It is recommended that such information be used as part of a greater
management strategy.
Acknowledgments
This work is supported by the Commonwealth Cooperative Research Centres Program and is
conducted by the CRC for Viticulture. The authors appreciate ongoing support provided by
Charles Sturt University’s Spatial Analysis Unit (CSU-SPAN).
References
Anderson, G.L. and Yang, C. (1996) Multispectral videography and geographical
information systems for site-specific farm management. Proceedings of the 3rd International
Conference on Precision Agriculture. Eds. R.C. Robert, R.H. Rust, W.E. Larsen (ASA,
CSSA, SSSA: Madison, WI, USA). pp. 681-692.
Arnold, G.W., Ozanne, P.G., Galbraith, K.A. and Dandridge, F. (1985) The capeweed
content of pastures in south-west Western Australia. Australian Journal of Experimental
Agriculture 25, 117-23.
Baldy, R., DeBenedictis, J., Johnson, L., Weber E., Baldy M., Osborn, B. and Burleigh, J.
(1996) Leaf colour and vine size are related to yield in a phylloxera-infested vineyard. Vitis
35, 201-5.
Barrett, E.C. and Curtis, L.F. (1999) ‘Introduction to environmental remote sensing’ (Stanley
Thornes: Cheltenham).

16
Barrett, M.W. and Leggett, E.K. (1979) The development of aerial infrared photography to
detect Echinochloaspecies in rice. Proceedings of the 7th Asia-Pacific Weed Science Society
Conference. (APWSS: Melbourne, Australia). pp 41-44.
Brady, J. and Wiley, S. (2000) Taking AIMS amongst the vines. The Australian
Grapegrower and Winemaker 441, 73-5.
Bramley, R. (2001a) Progress in the development of Precision Viticulture - Variation in
Yield, Quality and Soil Properties in Contrasting Australian Vineyards (3.3M). In: Precision
tools for improving land management. Occasional report No. 14. Eds L.D. Currie and P.
Loganathan. (Fertilizer and Lime Research Centre: Massey University, Palmerston North,
unpublished). In press.
Bramley, R.G.B (2001b). Vineyard sampling for more precise targeted management
Proceedings 1st National Conference on Geospatial Information & Agriculture,
Sydney (Causal Productions: Sydney) pp. 417-27.
Bramley R., and Proffitt, A.P.B. (1999) Managing variability in viticultural production. The
Australian Grapegrower and Winemaker 427, 11-6.
Bramley, R.G.V. and Proffitt, A.P.B. (2000) Variation in grape yield and quality in a
Coonawarra vineyard. Proceedings of the 5th International Symposium on Cool Climate
Viticulture & Oenology, Melbourne, Australia. In press.
Bramley, R.G.V., Proffitt, A.P.B., Corner, R.J. and Evans, T.D. (2000) Variation in grape
yield and soil depth in two contrasting Australian vineyards. Soil 2000 - New Horizons for a
New Century, Australian & New Zealand 2nd Joint Soils Conference, 2: Oral Papers. Eds
J.A. Adams and A.K. Metherell, (NZSSS) pp. 29-30.
Campbell, J.B. (1996) ‘Introduction to Remote Sensing’ (The Guildford Press: New York,
London).

17
Celotti, E., De Prati, G.C. and Cantoni, S. (2001) Rapid evaluation of the phenolic potential
of red grapes at winery delivery: application to mechanical harvesting. Australian
Grapegrower & Winemaker 449a, 151-9.
Clevers, J.G.P.W. (1986). The Use of Multispectral Photography in Agricultural Research.
Proceedings 7th ISPRS Commission Symposium, Remote Sensing for Resources
Development and Environmental Management, Enschede, 1, 227-32.
Clevers, J.G.P.W. (1988a). Multispectral Aerial Photography as a New Method in
Agricultural Field Trial Analysis. International Journal of Remote Sensing 9, 319-32.
Clevers, J.G.P.W. (1988b). Multispectral Aerial Photography as a Supplemental Technique
in Agricultural Research. Netherlands Journal of Agricultural Science 36, 75-90.
Clingeleffer, P.R. and Sommer, K.J. (1995) Vine Development and Vigour Control.
Proceedings ASVO Viticulture Seminar (Australian Society of Viticulture and Oenology)
(Winetitles: Adelaide, Australia).
Colwell, R.N. (1983) 'Manual of remote sensing. Vol. II. Interpretation and applications'
(Sheridan Press: Virginia, USA).
Condit, H.R. (1970) The spectral reflectance of American soils. Photogrammetric
Engineering 36, 955.
Cook, S. E., and Bramley, R. G. V. (1998). Precision agriculture - opportunities, benefits
and pitfalls of site-specific crop management in Australia. Australian Journal of
Experimental Agriculture 38, 753-63.
CRCV (2001) Cooperative Research Centre for Viticulture, Project 1.1.1. Precision
viticulture - Investigating the utility of precision agriculture technologies for monitoring and
managing variability in vineyards. http://www.crcv.com.au/index_pr.html

18
Dry, P.R. (2000) Canopy management for fruitfulness. Australian Journal of Grape and
Wine Research 6, 109-15.
Escadafal, R., Girard, M-C, Couralt, D. (1989) Munsel soil color and soil reflectance in the
visible spectral bands of Landsat MSS and TM data. Remote Sensing of Environment 27,
37-46.
Everitt, J. H., Escobar, D. E., Blazquez, C. H., Hussey, M. A, and Nixon, P. R. (1986).
Evaluation of the mid-infrared (1.45 - 2.0 µm) with a black-and-white infrared video camera.
Photogrammetric Engineering and Remote Sensing 52, 1655-60.
Everitt, J. H., Escobar, D. E., Alaniz, M. A., and Davis, M. R. (1987). Using airborne
middle-infrared (1.45 - 2.0 µm) video imagery for distinguishing plant species and soil
conditions. Remote Sensing of Environment 22, 423-8.
Grierson, I. and Bolt, S. (1995) Aerial video: A new effective method for vineyard planning.
The Australian Grapegrower & Winemaker May 1995, 8-9.
Hall, A. Louis J.P. and Lamb, D.W. (2001). A method for extracting detailed information
from high resolution multispectral images of vineyards. Proceedings of the 6th International
Conference on Geocomputation, University of Queensland, Brisbane. In Press.
Harris, J. R., and Haney, T. G. (1973). Techniques of oblique aerial photography of
agricultural field trials. Division of Soils Technical Paper 19 (CSIRO: Melbourne,
Australia).
Haselgrove, L., Botting, D., van Heeswijck, R., Høj, P.B., Dry, P.R., Ford, C. and Iland, P.G.
(2000) Canopy microclimate and berry composition: The effect of bunch exposure on the
phenolic composition of Vitis vinifera L. cv. Shiraz grape berries. Australian Journal of
Grape and Wine Research 6, 141-9.

19
Holzapfel, B., Rogiers, S., Degaris, K. and Small, G. (1999). Ripening grapes to
specification: effect of yield on colour development of Shiraz grapes in the Riverina. The
Australian Grapegrower & Winemaker 428, 24-8.
Holzapfel, B., Rogiers, S., Degaris, K. and Small, G. (2000). Identifying factors effecting
grape berry ripening and berry colour development. Proceedings 5th International
Symposium on Cool Climate Viticulture & Oenology, Melbourne, Australia. In Press.
Hutchinson, G.K. (2001) Getting mud on the boots (and the lap-top !) - The topoclimate
process and providing credible resource information for farmers. Proceedings 1st National
Conference on Geospatial Information & Agriculture, Sydney (Causal Productions:
Sydney) pp. 136-150.
Iland, P.G., Botting, D.G., Dry, P.R., Giddings, J. and Gawel, R. (1994) Grapevine canopy
performance. Proceedings ASVO Viticulture Seminar: Canopy Management (Winetitles:
Adelaide).
Intrieri, C., Poni, S., Rebucci, B. and Magnanini, E. (1997) Effects of canopy manipulations
on whole-vine photosynthesis: Results from pot and field experiments. Vitis 36, 167-73.
Intspec (2001) Hymap- airborne hyperspectral scanner.
http://www.intspec.com/hymap.htm#specs
ITRES (2001) Hyperspectral CASI mode. http://www.itres.com/docs/hyper.html
Jackson, R.S. (2000) ‘Wine Science: Principles, Practice, Perception’ (Academic Press: San
Diago).
Johnson, L., Lobitz, B., Armstrong, R., Baldy, R., Weber, E., DeBenedictis, J. and Bosch, D.
(1996) Airborne imaging aids vineyard canopy evaluation. California Agriculture 50, 14-8.

20
Johnson, L., Roczen, D. and Youkhana, S. (2001) Vineyard canopy density mapping with
IKONOS satellite imagery. Proceedings 3rd International Conference on Geospatial
Information in Agriculture and Forestry, Denver, Clorado (ERIM International Inc.: Ann
Arbor, MI, USA). In Press.
King, D. (1992) Evaluation of radiometric quality, statistical characteristics and spatial
resolution of multispectral videography. Journal of Imaging Science & Technology 36, 394-
404.
Lamb, D.W. (1999) Monitoring vineyard variability from the air. Australian Viticulture 3,
22-23.
Lamb, D.W. (2000) The use of qualitative airborne multispectral imaging for managing
agricultural crops – a case study in south-eastern Australia. Australian Journal of
Experimental Agriculture 40, 725-38.
Lamb, D.W. and Bramley, R.G.V. (2001) Managing and monitoring spatial variability in
vineyard productivity. Natural Resource Management 4, 25-30.
Lamb, D., Hall, A. and Louis, J. (2001a) Airborne remote sensing of vines for canopy
variability and productivity. Australian Grapegrower & Winemaker 449a, 89-92.
Lamb, D.W., Hall, A. and Louis, J.P. (2001b) Airborne/spaceborne remote sensing for the
grape and wine industry Proceedings 1st National Conference on Geospatial Information &
Agriculture, Sydney (Causal Productions: Sydney) pp. 600-8.
Lee, R. (1978) ‘Forest microclimatology’ (Columbia University Press: New York).
Louis, J., Lamb, D. W., McKenzie, G., Chapman, G., Edirisinghe, A., McCloud I. and
Pratley, J. (1995). Operational use and calibration of airborne video imagery for agricultural
and environmental land management. Proceedings 15th Biennial American Workshop on

21
Colour Photography and Videography in Resource Assessment. Ed P.W. Mausel (ASPRS:
Bethesda, MD, USA). pp 326-33.
Manzer, F.E. and Cooper, G.R. (1982) Use of portable videotaping for aerial infrared
detection of potato diseases. Plant Disease 66, 665-667.
Moran, M. S., Vidal, A., Troufleau, D., Qi, J., Clarke, T. R., Pinter, P. J., Mitchel, T. A.,
Inoue, Y., and Neale, C. M. U. (1997) Combining multifrequency microwave and optical
data for crop management. Remote Sensing of Environment 61, 96-109.
Munkvold, G.P., Duthie, J.A. and Marios, J.J. (1994) Reductions in yield and vegetative
growth of grapevines due to Eutypa dieback. Phytopathology 84,186-92.
Percival, D.C., Fisher, K.H. and Sullivan, J.A. (1994) Use of fruit zone leaf removal with
Vitis vinifera L. cv. Riesling. American Journal of Enology and Viticulture 45, 123-32.
Petrie, R.P., Trought, M.C.T. and Howell, G.S. (2000), Fruit composition and ripening of
Pinot Noir (Vitis vinifera L.) in relation to leaf area. Australian Journal of Grape and Wine
Research 6, 40-5.
Pitcher-Campbell, S., Tuohy, M. and Yule, I.J. (2001) The application of remote sensing and
GIS for improving vineyard management. Proceedings 1st National Conference on
Geospatial Information & Agriculture, Sydney (Causal Productions: Sydney) pp.
573-585.
Price, J.C. and Bausch, W.C. (1995) Leaf area index estimation from visible and near-
infrared reflectance data. Remote Sensing of Environment 52, 55-65.
Rankine, B.C., Fornachon, J.C.M., Boehm, E.W. and Cellier, K.M. (1971) Influence of grape
variety, climate and soil on grape composition and quality of table wines. Vitis 10, 33-50.

22
Rouse, J. W. Jr., Haas, R. H., Schell, J. A., and Deering, D. W. (1973). Monitoring
vegetation systems in the great plains with ERTS, Proceedings of the 3rd ERTS Symposium,
NASA SP-351 1, (U.S. Government Printing Office: Washington DC.) pp. 309-17.
Ryan, S. and Lewis, M. (2001) Mapping soils using high resolution airborne imagery,
Barossa Valley, SA. Proceedings 1st National Conference on Geospatial Information
& Agriculture, Sydney (Causal Productions: Sydney) pp. 801-12.
Smithyman, R.P., Howell, G.S. and Miller, D.P. (1997) Influence of canopy configuration on
vegetative development, yield and fruit composition of Seyval blanc grapevines. American
Journal of Enology and Viticulture 48, 482-91.
Sun, X., Baker, J., and Hordon, R. (1997). Computerized airborne multicamera imaging
system (CAMIS) and its 4-camera applications. Proceedings of the 3rd International
Airborne Remote Sensing Conference and Exhibition, Copenhagen, Denmark (ERIM
International Inc.: Ann Arbor, MI, USA) pp. 799-806.
Taylor, J. (2000) Geographic information systems – a step into the information age. The
Australian Grapegrower and Winemaker 435, 19-21.
Taylor, J.A. and McBratney, A.B. (2001) Environmental management of a viticultural
irrigation district. A "top-down bottom-up" model. Proceedings 1st National Conference
on Geospatial Information & Agriculture, Sydney (Causal Productions: Sydney) pp.
609-19.
Thomas, C.S., Marios, J.J. and English, J.T. (1988) The effects of wind speed, temperature,
and relative humidity on development of aerial mycelium and conidia of Botrytis cinera on
grape. Phytopathology 78, 260-65.

23
Tisseyre, B., Ardoin, N. and Sevila, F. (1999) Precision viticulture: Precise location and
vigour mapping aspects. Proceedings 2nd European Conference on Precision Agriculture
(Sheffield Academic Press, Sheffield, UK). pp. 319-30.
Vintage (2001) Viticultural Integration of NASA Technologies for Assessment of the
Grapevine Environment. http://geo.arc.nasa.gov/sge/vintage/vintage.html.
Wahl, K. (1988) Climate and soil effects on grapevine and wine: The situation on the
northern border of viticulture - the example Franconia. Proceedings Second International
Cool Climate Viticulture and Oenology Symposium, Auckland (New Zealand Society for
Viticulture and Oenology: Auckland) pp. 1-5.
Wiegend, C.L., Richardson, A.J., Escobar, D.E., Gerbermann, A.H. (1991) Vegetation
indices in crop assessments. Remote Sensing of Environment 35, 105-19.
Williams, B. (2000) GPS Applications in Viticulture. Proceeding 5th International
Symposium on Cool Climate Viticulture & Oenology, Melbourne, Australia. In Press.
Winemaker’s Federation of Australia (1996) ‘Strategy 2025 - The Australian Wine Industry’
(Magill: South Australia).
Yule, I.J., Woodgyer, W.R. and Murray, R. (2001) RTK DGPS and Autodesk Land
Development Desktop; a powerful combination for rapid accurate surveying and land
development planning. Proceedings 1st National Conference on Geospatial Information &
Agriculture, Sydney (Causal Productions: Sydney) pp. 315-21.

24

25
(a) (b)
(c) (d)

26
(a) (b)

27
0
0.1
0.2
0.3
0.4
0.5
0.6
0.7
0.8
400 450 500 550 600 650 700 750 800 850 900
Wavelength (nm)
Rel
ativ
e re
flect
ance
Cabernet SauvignonCovercropSoil

28
0102030405060708090
100
407 456 506 555 605 654 703 752 800 849 898
Wavelength (nm)
% R
efle
ctan
ce
actual spectrumselected wavebandsinferred spectrum
(a)
0102030405060708090
100
407 456 506 555 605 654 703 752 800 849 898
Wavelength (nm)
% R
efle
ctan
ce
actual spectrumselected wavebandsinferred spectrum
(b)

29
(a) (b) (c)

30

31

32

33
Figure 1 Satellite image (French SPOT) of the Wagga Wagga region, SE NSW, acquired on
October 1998. Pixel size = 20 m. (a) 60 km x 60 km Full scene, (b) magnified, 13 km x 13
km, sub-scene of Wagga Wagga, (c) magnified, 3 km x 3 km, sub-scene of Charles Sturt
University Wagga Wagga Campus, (d) magnified, 400 m x 600 m (24 Ha), sub-scene of
Charles Sturt University Vineyard Stages IIA & IV.
Figure 2 Multispectral airborne image (false-colour) of Charles Sturt University Wagga
Wagga Vineyard acquired January, 2001. (a) Altitude = 2.25 km, pixel size = 1.5 m, area
coverage = 110 Ha, (b) Altitude = 1.5 km, pixel size = 1.0 m, area coverage = 49 Ha, (c)
Altitude = 750 m, pixel size = 50 cm, area coverage = 12 Ha (d) Altitude = 300 m, pixel size
= 20 cm, area coverage = 2 Ha.
Figure 3 Multispectral airborne image (false-colour) of Charles Sturt University Wagga
Wagga Vineyard acquired late February, 2001 under (a) full cloud-cover with cloudbase at
2.4 km, imaging altitude = 1.5 km, pixel size = 1.0 m, (b) clear skies, imaging altitude = 1.5
km, pixel size = 1.0 m. Note the absence of shadows in 3(a).
Figure 4 Spectral reflectance profiles for Cabernet Sauvignon, covercrop (chick-peas) and
exposed red-brown soil. (Percentage of reflected sunlight = 100 x Relative reflectance). Data
acquired from Charles Sturt University's vineyard in Wagga Wagga, NSW.
Figure 5 Comparison between an actual vegetation reflectance profile and an inferred
reflectance profile using (a) 4 wavebands (multispectral), and (b) 13 wavebands
(hyperspectral).

34
Figure 6 NDVI images of a Cabernet Sauvignon block with different spatial resolutions. (a)
20 cm, (b) 1 m, and (c) 3m. Vine row spacing = 3 m. Extracted from Lamb et al (2001).
Figure 7 Synthetic NDVI image of a block of vines having the same spatial characteristics
and vigour. Pixels with dimensions equal to the vine-row spacing will give the same
combined signature regardless of where they lie relative to vines or inter-row space.
Modified from Lamb et al (2001).
Figure 8 Pseudo-colour NDVI image of CSU vineyard with fully developed canopy, January
1999. With the inter-row space eliminated from this image, a good indication of vine size as
well as overall vigour is conveyed.
Figure 9 Grey-scale representation of a single vine-canopy unit extracted from high-
resolution (25 cm) imagery. Light grey areas represent a high NDVI and dark grey represent
low NDVI.
Recommended