Operational issues surrounding the use of towing
tanks for performance quantification of marine
current energy converters Luke Myers, Pascal Galloway
Sustainable energy Research Group, Faculty of Engineering and the Environment
University of Southampton, SO171BJ, UK.
Abstract— Towing tanks are being utilised far more frequently
for the performance quantification of Marine Current Energy
Converters (MCECs) due to their relatively low cost and ease of
use. In this paper a number of issues are addressed that arose
during a series of experimental campaigns investigating the
performance of both static and dynamic MCEC models. These
include the lack of ambient turbulence, carriage vibration,
repeatability, carriage advance speed, vortex-induced-vibration
and blockage. Results of experiments are also compared to those
in circulating flumes and the relative merits of each type of
facility are presented. Recommendations are that specific types
of experiments such as wake measurements, power capture etc.
are better suited to a specific type of facility although it is
acknowledged that facility availability is often the overriding
factor. It is difficult to judge previous published and ongoing
work but the authors believe that many of the issues quantified
in the paper through real world MCEC experimental studies are
easy to overlook and could lead to less accurate experimental
results. Recommendations for measurement of experimental
parameters through the various stages of experimentation are
given in order that future studies can be more comprehensive
and accurate.
Keywords— Towing tank, Measurement, Accuracy, Error
I. INTRODUCTION
Despite the seeming advanced nature of many Marine
Current Energy Converters smaller-scale experimental studies
are still highly valued for concept, device design and even for
testing deployment and operational actions. Small-scale
testing offers lower risk and lower cost testing that can
generally be conducted in a shorter time period than at sea [1].
A key difference between tank or flume work compared to
in-situ ocean testing is that of control and acceptance. At
smaller indoor facilities conditions can be accurately
controlled such that steady state experimental work can be
conducted. Quantification of performance across a pre-defined
envelope of operating conditions can be planned and executed
in minimal time. Both water conditions and device operational
parameters can be modified in relatively short time. At sea the
testing regime is governed by acceptance. The resource varies
in both a spatial and temporal manner. You must wait for a
specific metocean condition to occur and whilst this is
predictable for velocity and direction other issues such as
wave conditions might not be. Therefore small-scale testing is
still seen as a valuable proving ground for a wide range of
design concepts, parameters and processes.
II. CHARACTERISTICS OF TOWING TANKS AND FLUMES
In order to characterize the performance of small-scale
marine current energy converters (MCECs) there are two
potential methods; a) move the device through a static fluid
field or b) keep the device static and move the fluid. Both
concepts are depicted in Fig. 1.
Towing tanks have been used extensively in scale MCEC
studies [2-5]. The facilities generally have relatively low
operating costs with the largest proportion of this associated
with the towing mechanism and wave-maker. All towing
tanks have an intrinsic ‘working’ length characterized by the
distance that can be maintained at a steady, set towing speed.
Buffer zones at either end are for safety and for
acceleration/deceleration of the carriage. This working length
is reduced for faster towing speeds to enable safe acceleration
and braking. Most wave makers are capable of generating
regular and irregular waves. The most basic tanks have the
wave makers situated at the downstream end with varying
carriage velocity only ‘into’ the waves. Following waves can
be generated if the reverse carriage speed is also variable.
For MCEC experiments the generation of waves whist
towing is advantageous although a true-combined wave-
current interaction is not observed. Turbulence in towing
tanks is zero as the water is still hence downstream wakes
observed by any other flow structures will not be as
representative as flumes or water channels. Data acquisition is
also more cumbersome with time lost accelerating, slowing,
reversing the carriage and waiting for the tank to settle
between towing runs. However the lower costs of towing
tanks compared to water channels, wave-making facilities and
good cross sectional area properties ensure that they are
utilised for aspects of MCEC research.

Fig. 1 - Side elevation of towing tank (a), circulating water channel (b) and circulating flume (c)
Flumes can be forced loops or an ‘open’ gravity driven
design herein defined as ‘water channel’ or ‘flume’
respectively. Circulating water channels are permanently
flooded and so can move large volumes of water easily thus
working sections can be wide and deep. Disadvantages
include installation of equipment (due to difficulty associated
with draining down the flume) and varying water depth (again
requires drainage). Gravity-fed flumes lift water from a sump
and deposit at the upstream end of the working section. Flow
rates and depths are often controlled via valves and a weir
located at the end of the working section to create a backwater
profile. These flumes are often long in length and the working
section is dry when not in use so installation of equipment is
simple. However, volumetric flow rates and cross sectional
areas are generally significantly lower than circulating
channels.
III. TYPES OF MEASUREMENT REQUIRED FOR QUANATIFICATION
OF MARINE CURENT ENERGY CONVERTER PERFORMANCE
ASSESSMENT
Measurements can be divided in a number of arbitrary
ways. For the purpose of this work they will be classified as:
1) Inflow / natural environment
2) Device
3) Device-affected flow field
Herein we will principally address item 1 which shares
some common issues with item 3. Measurements addressed
herein include the quantification of towing speed, wave
climates and the general flow field around the model MCEC.
Other practical issues such as repeatability, ambient noise and
base line condition are also addressed.
Due to the wide range of MCEC devices, modes of
operation and device parameters that can be measured the
reader is referred to Part IIB of the EquiMar protocols [6].
This gives valuable guidance on device measurement in
addition to measurement of other test parameters. This paper
shares the common aim with EquiMar to ensure the highest
quality of small-scale testing possible and to this end some of
the work addressed in this paper is represented in part IIB of
the protocols.
IV. EXPERIMENTAL SETUP
The experiments presented in this paper were carried out at
Solent University’s wave/towing tank (60m long x 3.7m wide
x 1.8m deep – see Fig 2). A full-spanning motorised carriage
can traverse down the tank at a maximum speed of 4m/s;
Reversing speed is fixed at approximately 0.46m/s. a mid-
depth-hinged wave maker is situated at the downstream end of
the tank with the capability of generating both regular and
irregular waves. The experimental issues addressed in the
paper arose during a series of experiments involving a 1/15th
-
scale tidal turbine model (see Fig.3) was equipped with the
capability to measure rotor thrust and torque (utilising a
dynamometer) and rate of rotation (via optical sensors). The
parameters of the model varied included: TSR (tip-speed-
ratio), turbine yaw and turbine submergence depth. Testing
was conducted over a range of tow speeds and wave climates.

Fig. 2 - Towing tank facility
V. ISSUES RELEVANT TO ACCURATE PERFORMANCE
ASSESSMENT IN TOWING TANKS
A. Verification of Carriage Speed
The repeatability of the towing carriage was verified.
Sample 1 in Table 1 was omitted since the carriage motor and
gearbox would need to be warm before the results could be
representative. The variance in speed for subsequent runs was
far lower. The standard error of the mean;
Nσ= (1)
for the carriage speed was essentially zero (to three decimal
places) where σ is the standard deviation and N is the number
of samples. Care must also be taken when towing models that
impose a significant drag force upon the carriage. A brief
check that the carriage set speed remains the same for towing
with/without the model is recommended. Speed can be
measured simply by timing the carriage over the working
section (Fig. 1) or by using a device which has been
independently verified i.e. a Doppler velocimeter or pitot tube.
TABLE I
VERIFICATION OF TOWING CARRIAGE SPEEDS
B. Flow field measurement
There are a number of instruments that can be employed to
characterize the flow field around a model MCEC. Pitot tubes,
propeller meters, Doppler devices and wave probes will be
addressed herein. In all cases the effective length of the
towing tank and the rate of data acquisition will determine the
quantity of data that can be collected. A sound judgement
should be made as to the number of towing runs required to
produce a robust and accurate data set. Repeatability of
measurements is addressed in section V.D.
1) Pitot tubes
Pitot tubes offer a robust method of acquiring velocity data.
Used in parallel several can be employed in a rake or array to
facilitate fast data collection. They can only acquire in the
principal direction of flow and at a single point. The
determination of the forward velocity is based upon solid
physical principals; the tube head has two tappings that
measure the dynamic and static pressures.
)(2 hgV ∆= (2)
Where g is the acceleration due to gravity and ∆h is the
differential pressure (dynamic to static) measured at the
manometer or pressure transducer. If ∆h is large enough then
the accuracy of a pitot tube is very high assuming pressure
measurements can be read to a good degree of precision.
Generally in steady flow the height of fluid in a monometer
can be read to ±1mm. If the pitot tube is situated upstream of a
model then this should be the case. In the wake of the device
the damping caused by the inertia of water in the tubes may
manifest as an oscillating value read by the transducer or a
slowly oscillating column of fluid in the manometer. An
average value should be recorded and the repeatability should
ideally be checked with further towing runs.
Fig. 3 - Pitot tube installed upstream of 1/15th – scale MCEC for verification
of inflow velocity
Sample
Forward average speed
(m/s)
Reverse average
speed (m/s)
1 0.460 0.463
2 0.455 0.459
3 0.453 0.457
4 0.453 0.458
5 0.455 0.457
6 0.454 0.458
7 0.453 0.455
8 0.456 0.456
9 0.455 0.457
10 0.456 0.456

There are a number of issues surrounding the setup of pitot
tubes. The first is that all air is removed or bled from the
flexible tubing between the pitot tube and the equipment used
to measure the differential pressures (generally a manometer).
The water in the tubes will lead to small changes in velocity
being damped out due to the inertia of the water in the tubes
and therefore pitot tubes can only really be employed to
measure mean flow velocity over a towing run; faster
sampling will not resolve rapidly changing flow structures.
Ideally the manometer should be placed below the level of the
tubes or as close as possible. This is often difficult as the tank
is generally recessed below the carriage or general working
area. At higher carriage speeds the pressures in the pitot tubes
should be sufficient to overcome small differential heights
between the tube heads and manometer. However, a
calibration check against the set carriage speed or another
device capable of measuring velocity should be conducted.
2) Propeller meters:
Propeller meters are simple devices that rotate in a plane
orthogonal to the flow direction. The propeller creates a low
voltage DC voltage output that varies linearly with flow
speed. Implementation in towing tanks holds few practical
issues. A recent calibration of the instrument should always be
conducted before and after the testing period. Propeller meters
often have an appreciable size meaning that use upstream of
small models sensitive to disturbance is not advisable when
acquiring other data. Voltage outputs can be acquired using a
number of means but care should be taken not to sample at
high frequency and expect coherent resolution of higher order
flow effects such as turbulence. As with pitot tubes propeller
meters are best employed for mean flow measurements. Their
strength lies in having a simple output, low cost and ability to
deploy in an array for multiple point measurement.
3) Doppler Velocimenters
Doppler velocimeters utilize the phase shift of light or
sound as it is emitted from an instrument and is reflected from
particles in the water back to a receiver. Measurements are
taken in a small finite volume of fluid displaced below the
sensor head. Generally at least 2 and usually 3 axes are
resolved at high frequency allowing the quantification of both
mean velocity and higher order flow effects. The principles of
operation and accuracy issues are well documented for general
use [7-9]. A key issue for the use of Doppler velocimeters is
the amount of backscattering material suspended in the water.
As the water in a towing tank is not regularly disturbed or
circulated nearly all suspended matter will settle to the
bottom. Therefore it is necessary to seed the water with small
particles to provide strong return acoustic or light signals back
to the Doppler velocimeter. Failure to seed the water will
result in the acquisition of incoherent data as the device
struggles to achieve sufficiently high return signal strengths.
Circulating water channels and flumes generally return good
results without the need for seeding; however results can
normally be improved with a relatively small amount of
seeding material.
Fig. 4 - Acoustic Doppler Velocimeter head unit (left) and installed in
turbulent flow (right)
Fig. 5 illustrates the reduction in data variability with even
a modest amount of seeding material added to the tank. Data
is shown for a steady towing speed over a period of 20
seconds sampling at 50Hz. The percentage occurrence is
expressed as a decimal fraction.
Fig. 5 – Increasing measurement accuracy for velocity for a single towing run
by use of seeding particles (20 seconds data at 50Hz)
It can be seen that the variability in the received data is
much reduced when more suspended matter is added to the
tank. Aliasing errors and spiking prevalent in the clean water
condition are removed. Seeding material should have a
specific gravity close to 1. In the case of this work 13 micron
hollow glass spheres were used with a specific gravity of 1.1.
During testing it was necessary to partly re-seed the tank each
morning. Seeding was added until instrument measurement
quality parameters rose to acceptable levels. The amount of
seeding required will vary depending upon:
• the size of the tank
• frequency of the emitted sound/light pulse
• any internal instrument data processing
• manufacturer recommended data quality

The first point is quite obvious. A useful mixing aid to
distribute seeding throughout a static body of water is the
operating model MCEC itself. The second issue pertaining to
frequency is important as higher emitted frequencies will
attenuate more rapidly in water according to Stokes’ law and
thus may require higher concentrations of backscattering
material compared to a lower frequency instrument. Many
devices return data quality indicators such as received signal
strength (transmit signal divided by ambient noise level) and
correlation scores. Some are more useful than others in
defining data quality. For example the correlation score can
often appear low in turbulent flows despite the data being
good quality [10]. Other instruments perform internal data
quality assessments and only output data above a specific
threshold of accuracy. Users of Doppler devices should fully
understand the working of the instrument before use. Some
device manufacturers indicate lower bound values of
parameters such as instrument signal to noise ratio or
correlation to ensure good quality data. In the authors’
experience this is not a definitive limit and should be
exceeded to ensure maximum data quality. Often data requires
further post processing but by maximising parameters such as
device signal to noise ratio and correlation scores any data
loss due to processing should be minimal.
Post processing can increase the data quality by removing
spurious points. The precise method of filtering can
sometimes appear quite arbitrary. There are a number of
statistical methods and filtering techniques based upon
physical phenomenon and the choice and inter-comparison is
best left to the individual. Statistical methods include simple
minimum/maximum thresholds. Fig. 5 above is a good
example as the data can be seen to hold a roughly normal
distribution. An example filtering criterion could be based
upon the fact that 99.7% of data should lie within 3 standard
deviations from the mean. Often significant spikes reach far
beyond this limit so removal is sound.
Physical filters can be employed such as deleting sample
points where the acceleration from or to the surrounding
points is greater than g. The authors’ preference is the velocity
cross-correlation filter as proposed by Cea et. al [11]. This
works by defining an ellipsoid around the varying velocity
components of the sample in 3 dimensions. Data outside the
ellipsoid is removed as shown in Fig 6. This filter works
especially well when towing into waves and thus has been
employed during studies of the 1/15th
- scale model MCEC.
Data shown is for wave amplitude of 0.088m, Period 1.34 sec,
forward velocity 0.67m/s and depth 0.4m.
Fig. 6 - Effect of filtering Doppler velocimeter data. Raw sample set (left) and
filtered data (right)
Fig 7. shows the time series data corresponding to that
shown in Fig 6. Removed data points were replaced using
shape-preserving cubic interpolation.
Fig. 7 - Time series velocity data for unfiltered and filtered conditions
Again it must be stressed that adequate seeding of towing
tanks will facilitate the use of Doppler velocimeters and the
multiple axis, rapid sampling that they can achieve with an
associated reduction or even eliminating of post processing. In
other cases more simple instruments are often better employed
to measure axial mean velocities.
4) Wave probes
It is good practice to verify the input to the wave maker
with a separate wave probe measurement and not to solely
rely upon the settings stated on the driving software. A simple
resistive wave probe can be employed a reasonable distance
upstream of the wave maker to verify the output wave
parameters. Wave probes should be regularly calibrated. Fig.
8 shows a typical wave series propagating up the towing tank.
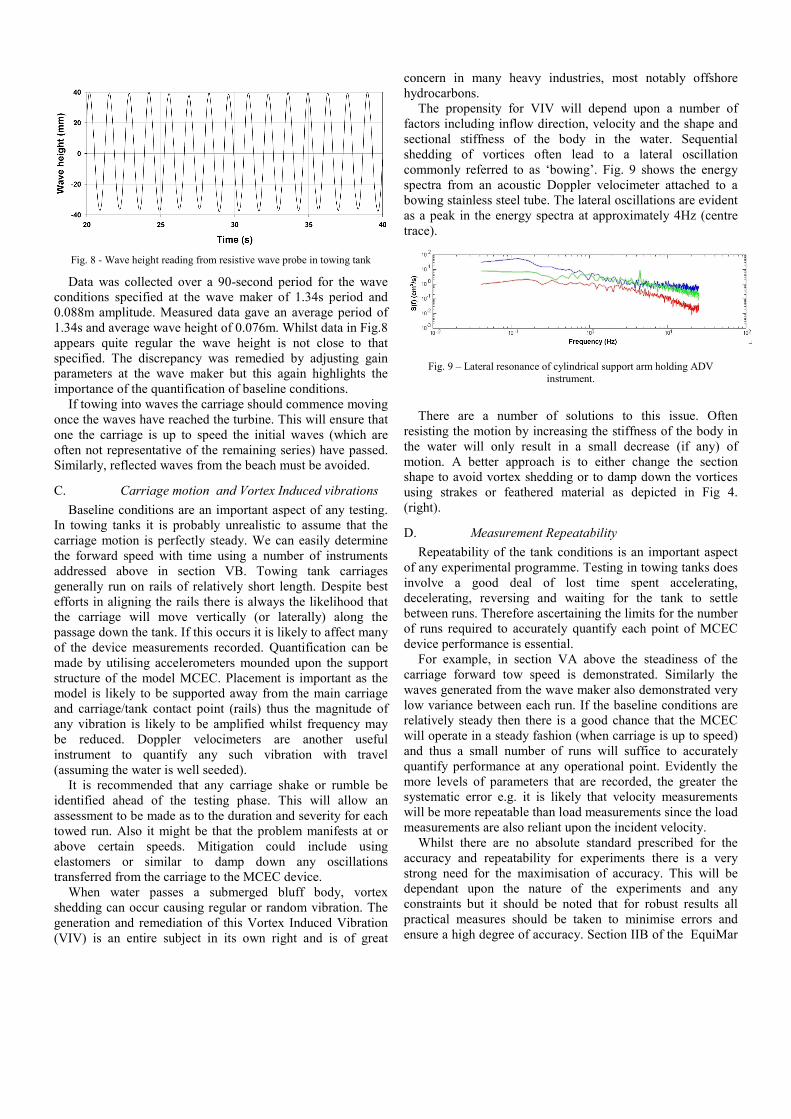
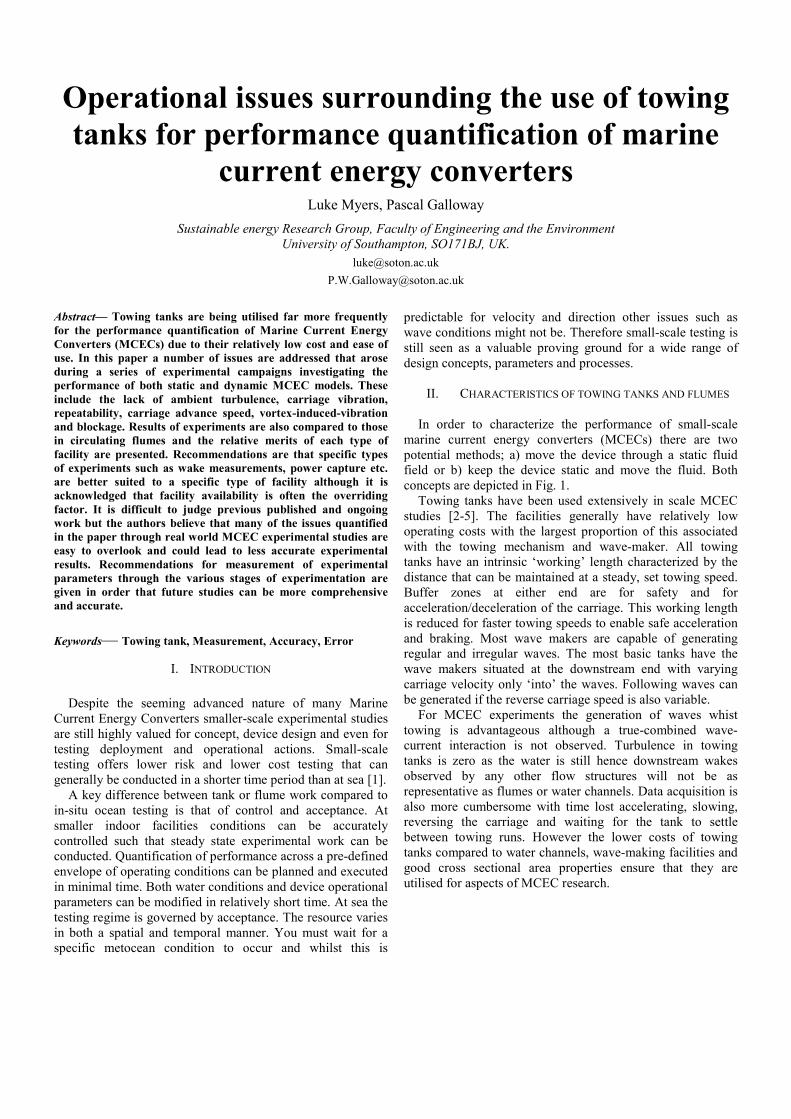
Fig. 8 - Wave height reading from resistive wave probe in towing tank
Data was collected over a 90-second period for the wave
conditions specified at the wave maker of 1.34s period and
0.088m amplitude. Measured data gave an average period of
1.34s and average wave height of 0.076m. Whilst data in Fig.8
appears quite regular the wave height is not close to that
specified. The discrepancy was remedied by adjusting gain
parameters at the wave maker but this again highlights the
importance of the quantification of baseline conditions.
If towing into waves the carriage should commence moving
once the waves have reached the turbine. This will ensure that
one the carriage is up to speed the initial waves (which are
often not representative of the remaining series) have passed.
Similarly, reflected waves from the beach must be avoided.
C. Carriage motion and Vortex Induced vibrations
Baseline conditions are an important aspect of any testing.
In towing tanks it is probably unrealistic to assume that the
carriage motion is perfectly steady. We can easily determine
the forward speed with time using a number of instruments
addressed above in section VB. Towing tank carriages
generally run on rails of relatively short length. Despite best
efforts in aligning the rails there is always the likelihood that
the carriage will move vertically (or laterally) along the
passage down the tank. If this occurs it is likely to affect many
of the device measurements recorded. Quantification can be
made by utilising accelerometers mounded upon the support
structure of the model MCEC. Placement is important as the
model is likely to be supported away from the main carriage
and carriage/tank contact point (rails) thus the magnitude of
any vibration is likely to be amplified whilst frequency may
be reduced. Doppler velocimeters are another useful
instrument to quantify any such vibration with travel
(assuming the water is well seeded).
It is recommended that any carriage shake or rumble be
identified ahead of the testing phase. This will allow an
assessment to be made as to the duration and severity for each
towed run. Also it might be that the problem manifests at or
above certain speeds. Mitigation could include using
elastomers or similar to damp down any oscillations
transferred from the carriage to the MCEC device.
When water passes a submerged bluff body, vortex
shedding can occur causing regular or random vibration. The
generation and remediation of this Vortex Induced Vibration
(VIV) is an entire subject in its own right and is of great
concern in many heavy industries, most notably offshore
hydrocarbons.
The propensity for VIV will depend upon a number of
factors including inflow direction, velocity and the shape and
sectional stiffness of the body in the water. Sequential
shedding of vortices often lead to a lateral oscillation
commonly referred to as ‘bowing’. Fig. 9 shows the energy
spectra from an acoustic Doppler velocimeter attached to a
bowing stainless steel tube. The lateral oscillations are evident
as a peak in the energy spectra at approximately 4Hz (centre
trace).
Fig. 9 – Lateral resonance of cylindrical support arm holding ADV
instrument.
There are a number of solutions to this issue. Often
resisting the motion by increasing the stiffness of the body in
the water will only result in a small decrease (if any) of
motion. A better approach is to either change the section
shape to avoid vortex shedding or to damp down the vortices
using strakes or feathered material as depicted in Fig 4.
(right).
D. Measurement Repeatability
Repeatability of the tank conditions is an important aspect
of any experimental programme. Testing in towing tanks does
involve a good deal of lost time spent accelerating,
decelerating, reversing and waiting for the tank to settle
between runs. Therefore ascertaining the limits for the number
of runs required to accurately quantify each point of MCEC
device performance is essential.
For example, in section VA above the steadiness of the
carriage forward tow speed is demonstrated. Similarly the
waves generated from the wave maker also demonstrated very
low variance between each run. If the baseline conditions are
relatively steady then there is a good chance that the MCEC
will operate in a steady fashion (when carriage is up to speed)
and thus a small number of runs will suffice to accurately
quantify performance at any operational point. Evidently the
more levels of parameters that are recorded, the greater the
systematic error e.g. it is likely that velocity measurements
will be more repeatable than load measurements since the load
measurements are also reliant upon the incident velocity.
Whilst there are no absolute standard prescribed for the
accuracy and repeatability for experiments there is a very
strong need for the maximisation of accuracy. This will be
dependant upon the nature of the experiments and any
constraints but it should be noted that for robust results all
practical measures should be taken to minimise errors and
ensure a high degree of accuracy. Section IIB of the EquiMar

protocols [6] gives guidance on the reporting of data accuracy
and this should always be provided so that independent
assessment of the experimental accuracy can be made.
VI. CONCLUSIONS
This paper has addressed a number of issues pertaining to
the accuracy and repeatability of experiments to quantify
MCEC device performance in towing tanks. Such facilities
generally have lower operational expenditure compared to
large circulating flumes hence they are commonly utilised for
the quantification of performance parameters of Marine
Current Energy Converters (MCECs).
Whilst towing tanks offer a lower cost and wave-making
capabilities this has to be balanced against the lack of ambient
turbulence and a greater time required for data acquisition
due to the discrete length of a towing run compared to the
time required for acceleration, deceleration, reversing and
tank settlement.
This paper has highlighted a number of issues that should
always be considered in any towing tank to assess the baseline
conditions. These include verification of carriage speed, wave
properties and carriage shake (unsteady motion). Once the
Model MCEC is in place measurement systems and
instruments should also be carefully checked for setup
parameters and signal feedback strengths/accuracy. These
include onboard systems (e.g. rotor thrust/torque) and any
peripheral measurements such as those used to quantify the
characteristics of the surrounding flow field. Care should be
taken with Doppler instruments to ensure strong return signals
and pitot tubes require a careful setup and may be
inappropriate for some tanks or for low advance speeds.
Once the setup and baseline conditions have been verified
an assessment of the accuracy and repeatability of
measurments associated with the operation of the model
MCEC should be conducted. Whilst there are no absolute
limits the operator should ensure that the highest practical
level of accuracy is achieved and that this is quantified in any
reporting. Examples are given in this paper and also in part
IIB of the EquiMar protocols [6].
Post processing of data can be employed to further increase
accuracy of results. Once again details should be provided in
any experimental report and the operator must ensure that
both the raw acquired data is always saved and that any
filtering/post processing techniques are understood and fit for
purpose. If the above techniques and actions are employed
then the quality of work conducted in towing tanks for the
performance quantification of MCECs should be enhanced
benefitting both the person(s) conducting the testing, the
wider marine energy community and any further
development/up-scaling of the MCEC device in question.
REFERENCES [1] Department for Energy and Climate Change (2008). Tidal-current
Energy Device Development and Evaluation Protocol. URN 08/1317.
Available at: http://www.berr.gov.uk/files/file48401.pdf
[2] Barltrop, N., Grant, A., Varyani, K.S. & Pham, X.P. (2005) Wave-current interactions in marine current turbines. In Proc. 6th European
Wave and Tidal Conference, Glasgow, UK, 2005. pp. 33-38.
[3] Galloway, P.W., Myers, L.E. & Bahaj, A.S., (2010). Studies of a scale tidal turbine in close proximity to waves. In 3rd International
Conference on Ocean Energy, Bilbao, Spain.
[4] Bahaj, A.S., Batten, W.M.J. & McCann, G. (2007) Experimental verifications of numerical predictions for the hydrodynamic
performance of horizontal axis marine current turbines. In Renewable Energy, 15(32), pp. 2479-2490.
[5] Grant, A. & Johnstone, C., (2010). Contra Rotating Marine Turbines
Tank Tests to Analyse System Dynamic Response. In 3rd International Conference on Ocean Energy.
[6] D. Ingram, G. Smith, C. Bittencourt-Ferreira and H. Smith,
Protocols for the Equitable Assessment of Marine Energy Converters, University of Edinburgh, School of Engineering,
Edinburgh, United Kingdom, 2011.
ISBN: 978-0-9508920-2-3 [7] Voulgaris G., Trowbridge J.H. (1998) Evaluation of the acoustic
Doppler velocimeter (ADV) for turbulence measurements. J Atmos
Ocean Technol Vol. 15, pp. 272–289. [8] Lohrmann A., Cabrera R., Kraus N.C. (1994) Acoustic Doppler
velocimeter (ADV) for laboratory use. In: Proceedings of symposium
on fundamentals and advancements on hydraulic measurements and experimentation. ASCE, pp 351–365.
[9] Skeivalas, J., Giniotis, V., (2003) Analysis of accuracy of measurement
by Doppler laser meters, Optical Engineering, Vol. 42, no. 7, pp. 2025-2028.
[10] Myers, L.E. & Bahaj, A.S., (2010). Experimental Experimental
analysis of the flowfield around horizontal axis tidal turbines by use of scale mesh disk rotor simulators, Ocean Engineering, Vol. 37, pp. 218-
227.
[11] Cea, L., Puertas, J. & Pena, L. (2006) Velocity measurements on a highly turbulent free surface flow using ADV. In Experimental Fluids,
vo. 42, pp. 333-348.
Recommended