Jørn Braa
Open Source and Capacity in the HISP Network 17.09.2018
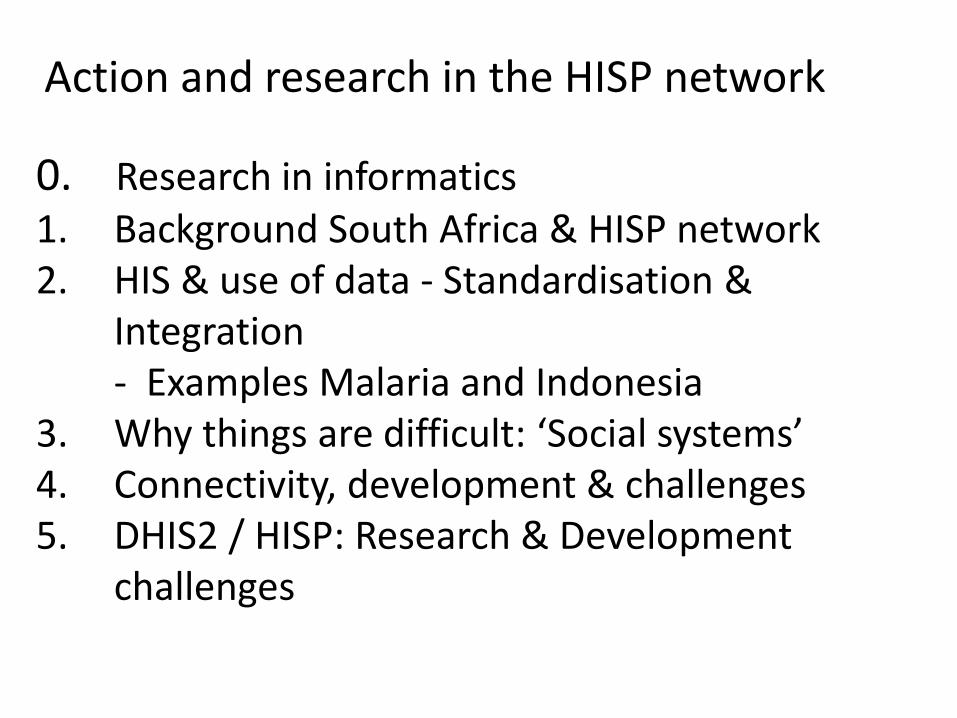
0. Research in informatics 1. Background South Africa & HISP network 2. HIS & use of data - Standardisation &
Integration - Examples Malaria and Indonesia
3. Why things are difficult: ‘Social systems’ 4. Connectivity, development & challenges 5. DHIS2 / HISP: Research & Development
challenges
Action and research in the HISP network
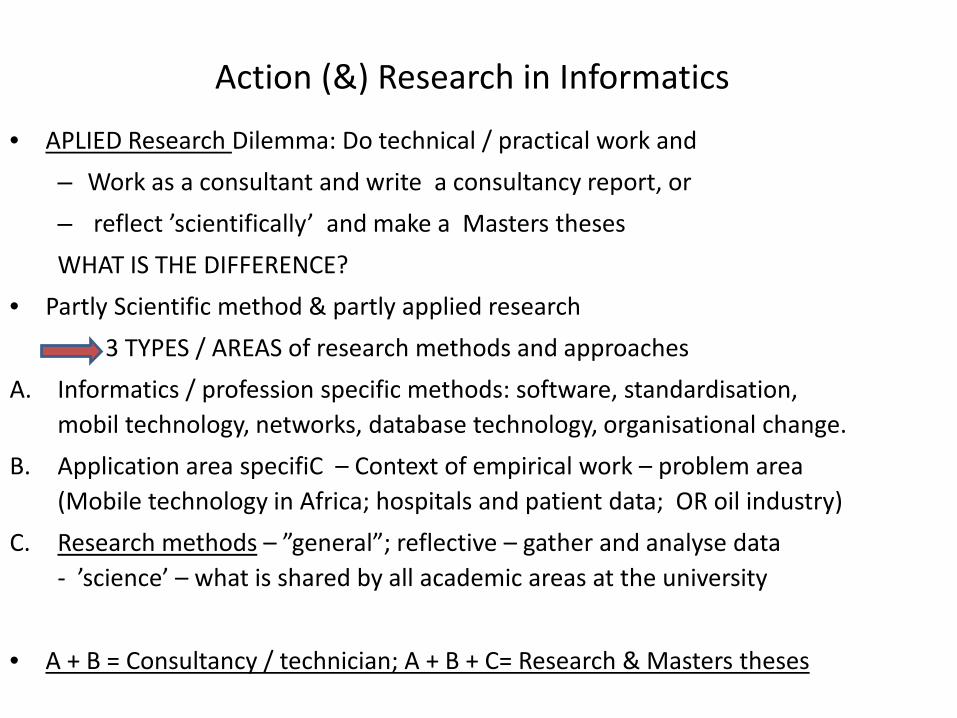
Action (&) Research in Informatics
• APLIED Research Dilemma: Do technical / practical work and – Work as a consultant and write a consultancy report, or – reflect ’scientifically’ and make a Masters theses WHAT IS THE DIFFERENCE?
• Partly Scientific method & partly applied research 3 TYPES / AREAS of research methods and approaches A. Informatics / profession specific methods: software, standardisation,
mobil technology, networks, database technology, organisational change. B. Application area specifiC – Context of empirical work – problem area
(Mobile technology in Africa; hospitals and patient data; OR oil industry) C. Research methods – ”general”; reflective – gather and analyse data
- ’science’ – what is shared by all academic areas at the university • A + B = Consultancy / technician; A + B + C= Research & Masters theses
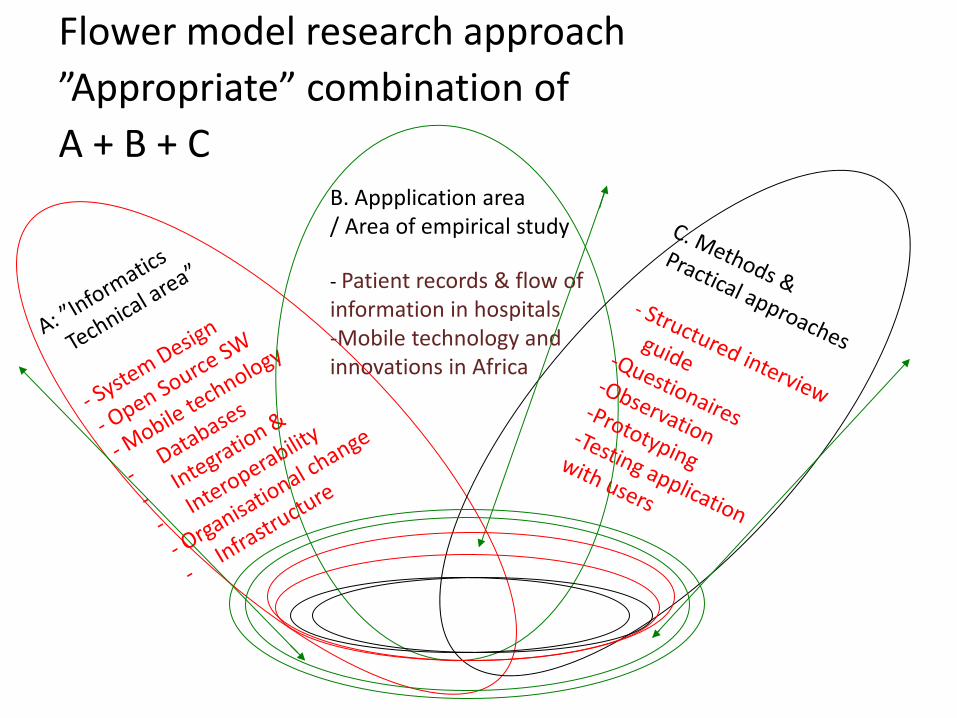
Flower model research approach ”Appropriate” combination of A + B + C
B. Appplication area / Area of empirical study - Patient records & flow of information in hospitals -Mobile technology and innovations in Africa
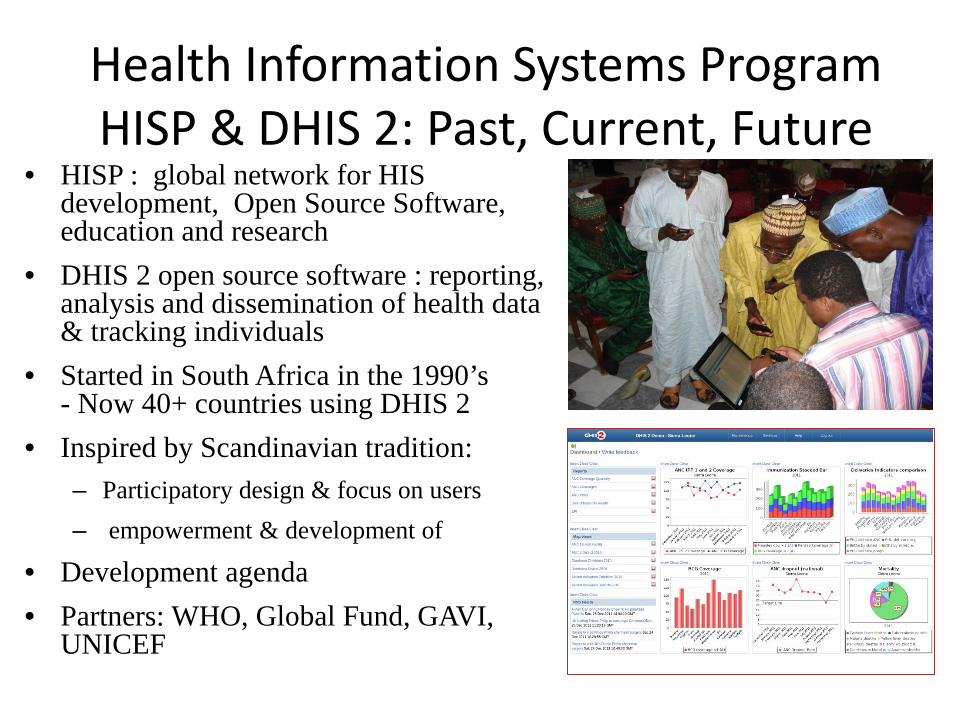
Health Information Systems Program HISP & DHIS 2: Past, Current, Future
• HISP : global network for HIS development, Open Source Software, education and research
• DHIS 2 open source software : reporting, analysis and dissemination of health data & tracking individuals
• Started in South Africa in the 1990’s - Now 40+ countries using DHIS 2
• Inspired by Scandinavian tradition: – Participatory design & focus on users – empowerment & development of
• Development agenda • Partners: WHO, Global Fund, GAVI,
UNICEF
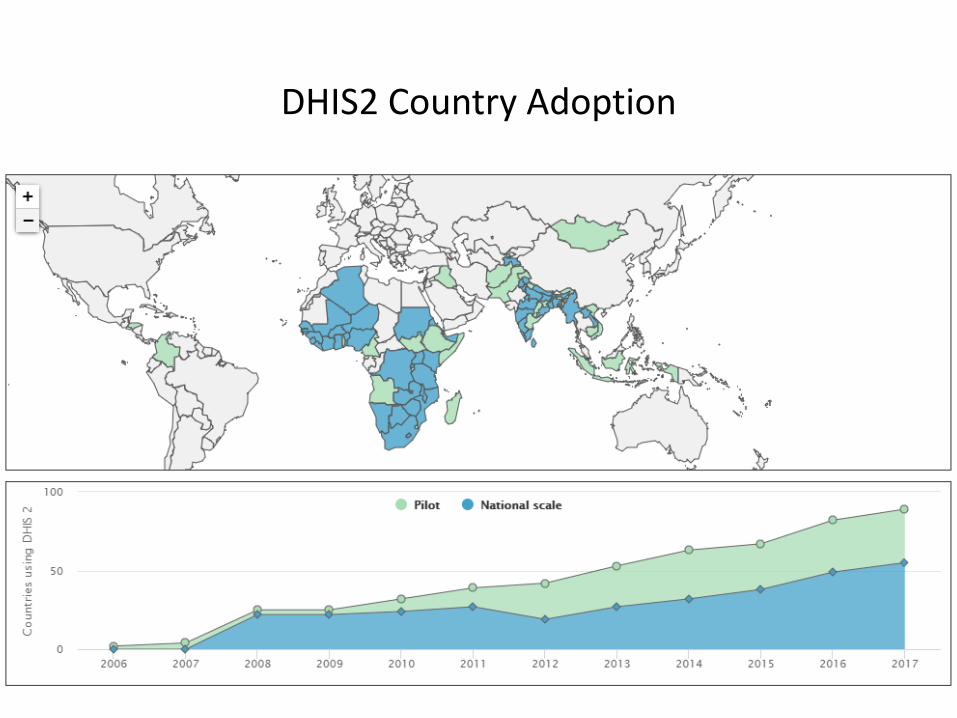
DHIS2 Country Adoption
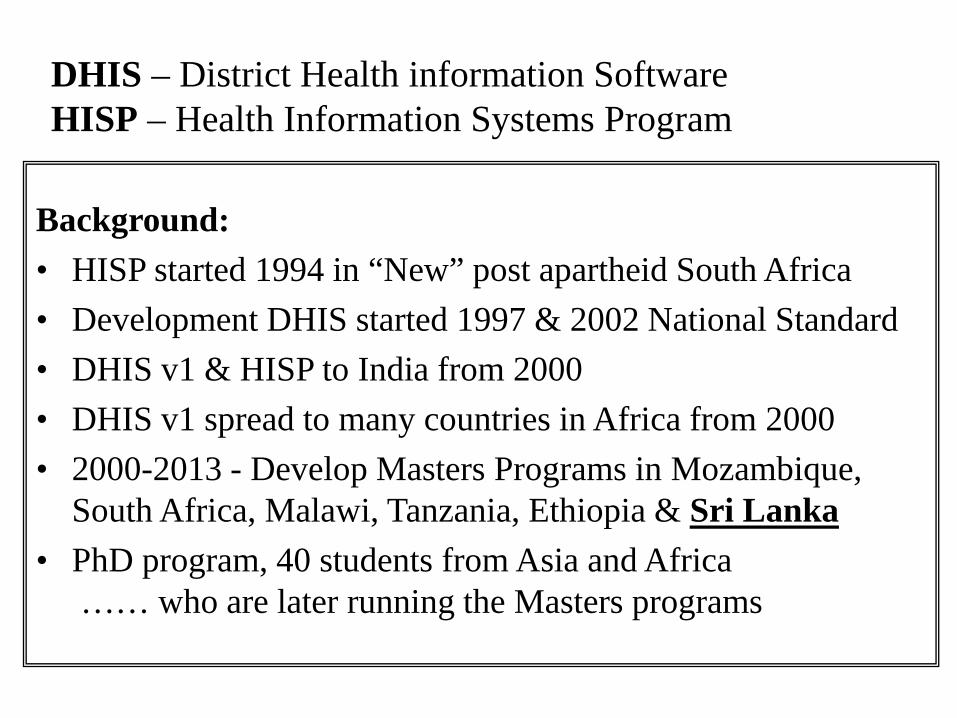
DHIS – District Health information Software HISP – Health Information Systems Program
Background: • HISP started 1994 in “New” post apartheid South Africa • Development DHIS started 1997 & 2002 National Standard • DHIS v1 & HISP to India from 2000 • DHIS v1 spread to many countries in Africa from 2000 • 2000-2013 - Develop Masters Programs in Mozambique,
South Africa, Malawi, Tanzania, Ethiopia & Sri Lanka • PhD program, 40 students from Asia and Africa
…… who are later running the Masters programs
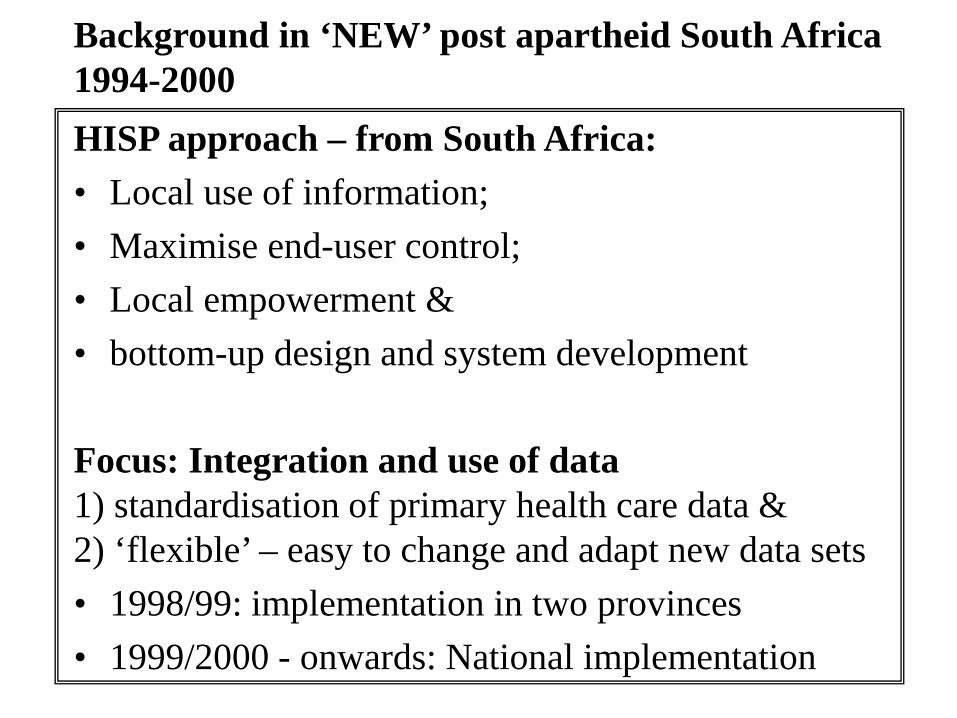
Background in ‘NEW’ post apartheid South Africa 1994-2000
HISP approach – from South Africa: • Local use of information; • Maximise end-user control; • Local empowerment & • bottom-up design and system development Focus: Integration and use of data 1) standardisation of primary health care data & 2) ‘flexible’ – easy to change and adapt new data sets • 1998/99: implementation in two provinces • 1999/2000 - onwards: National implementation
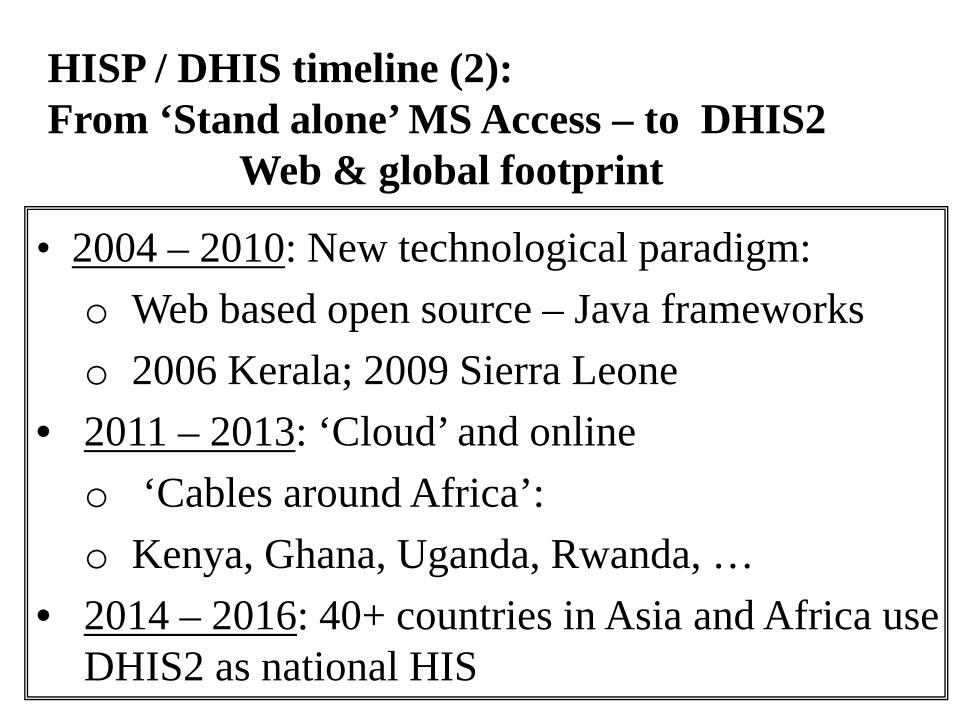
• 2004 – 2010: New technological paradigm: o Web based open source – Java frameworks o 2006 Kerala; 2009 Sierra Leone
• 2011 – 2013: ‘Cloud’ and online o ‘Cables around Africa’: o Kenya, Ghana, Uganda, Rwanda, …
• 2014 – 2016: 40+ countries in Asia and Africa use DHIS2 as national HIS
HISP / DHIS timeline (2): From ‘Stand alone’ MS Access – to DHIS2 Web & global footprint
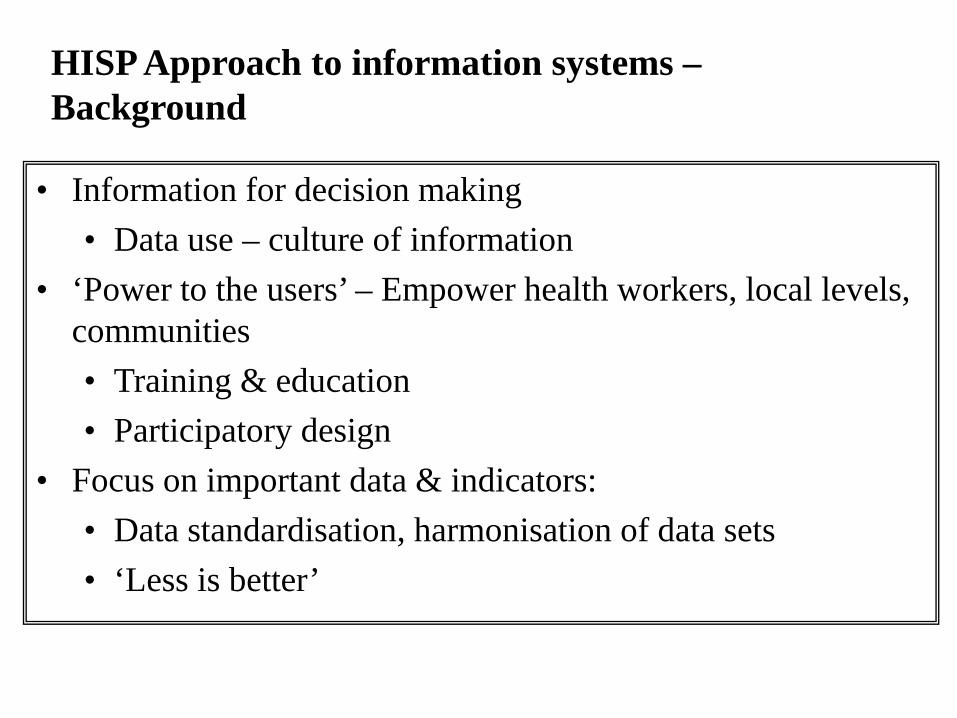
HISP Approach to information systems – Background
• Information for decision making • Data use – culture of information
• ‘Power to the users’ – Empower health workers, local levels, communities • Training & education • Participatory design
• Focus on important data & indicators: • Data standardisation, harmonisation of data sets • ‘Less is better’
South Africa
Nigeria
Vietnam
Sri Lanka
Uganda
India Norway
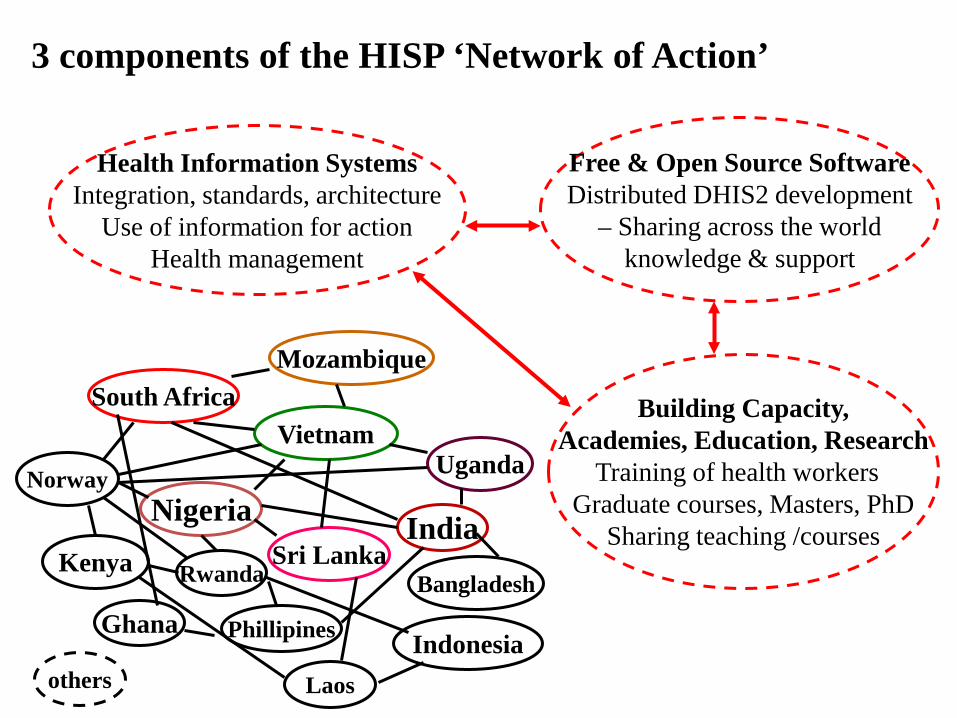
3 components of the HISP ‘Network of Action’
Health Information Systems Integration, standards, architecture
Use of information for action Health management
Free & Open Source Software Distributed DHIS2 development
– Sharing across the world knowledge & support
Building Capacity, Academies, Education, Research
Training of health workers Graduate courses, Masters, PhD
Sharing teaching /courses
Mozambique
Kenya Rwanda
others
Ghana Phillipines
Laos
Indonesia
Bangladesh
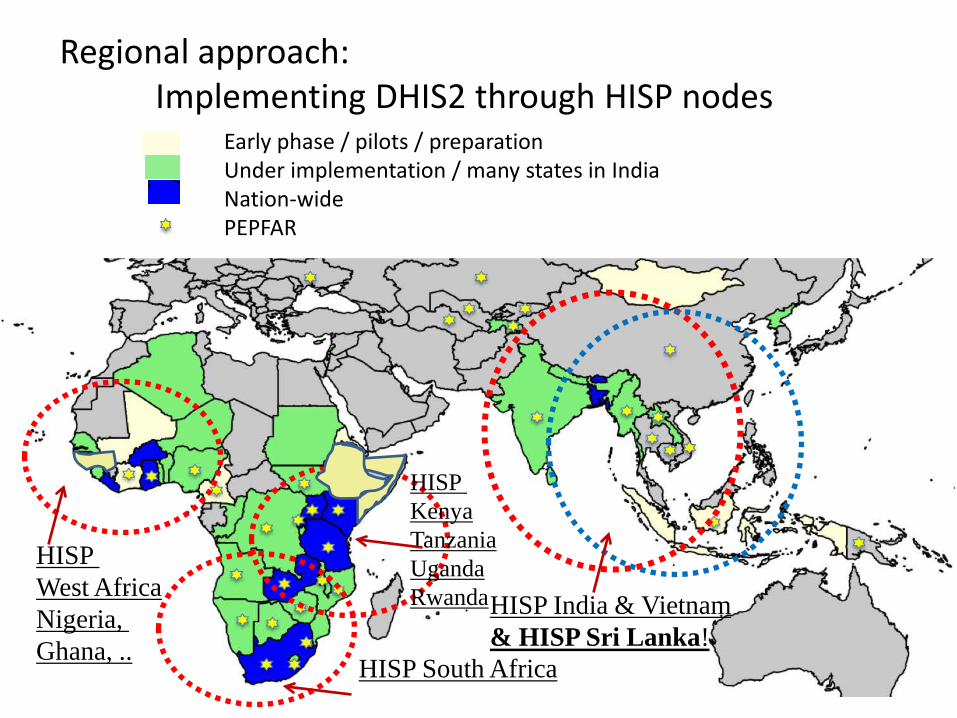
Regional approach: Implementing DHIS2 through HISP nodes
Early phase / pilots / preparation Under implementation / many states in India Nation-wide PEPFAR
HISP India & Vietnam & HISP Sri Lanka!
HISP Kenya Tanzania Uganda Rwanda
HISP South Africa
HISP West Africa Nigeria, Ghana, ..
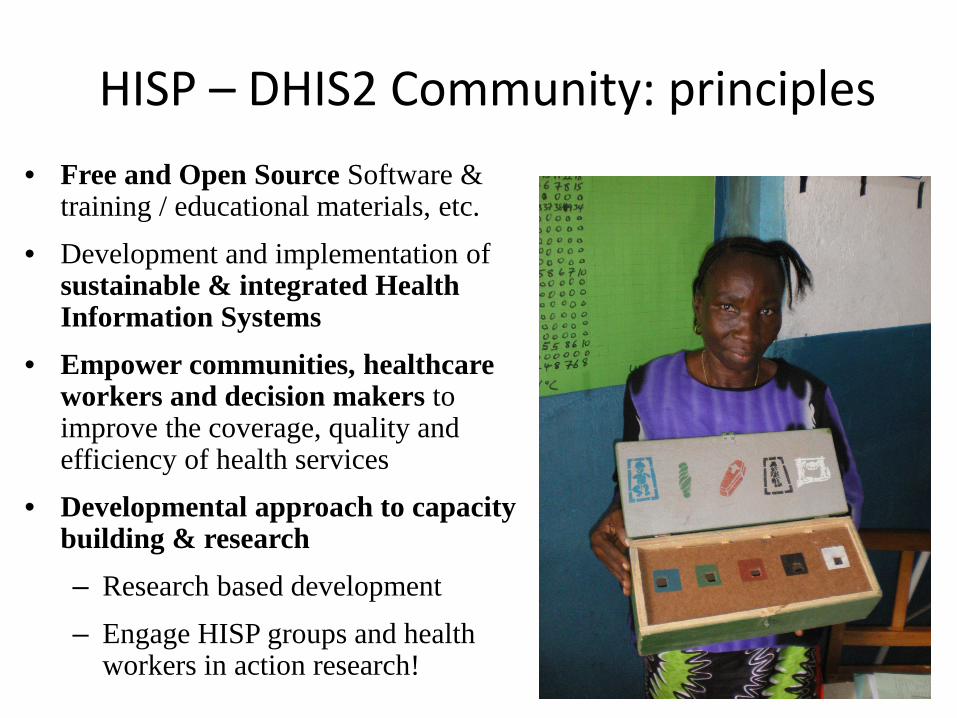
HISP – DHIS2 Community: principles • Free and Open Source Software &
training / educational materials, etc. • Development and implementation of
sustainable & integrated Health Information Systems
• Empower communities, healthcare workers and decision makers to improve the coverage, quality and efficiency of health services
• Developmental approach to capacity building & research – Research based development – Engage HISP groups and health
workers in action research!
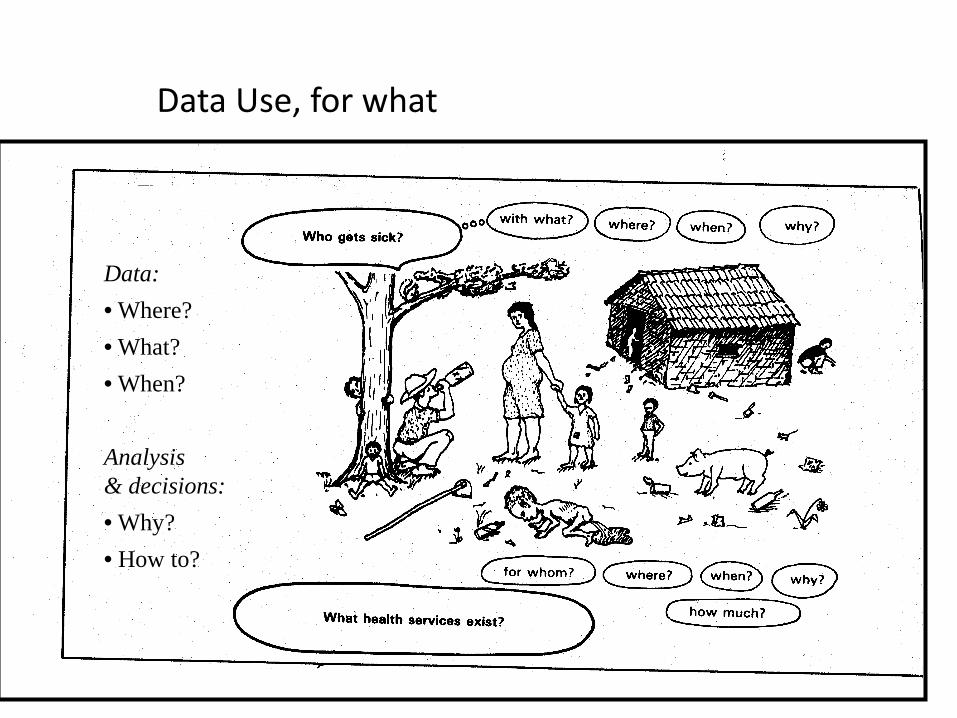
Data: • Where? • What? • When? Analysis & decisions: • Why? • How to?
Data Use, for what
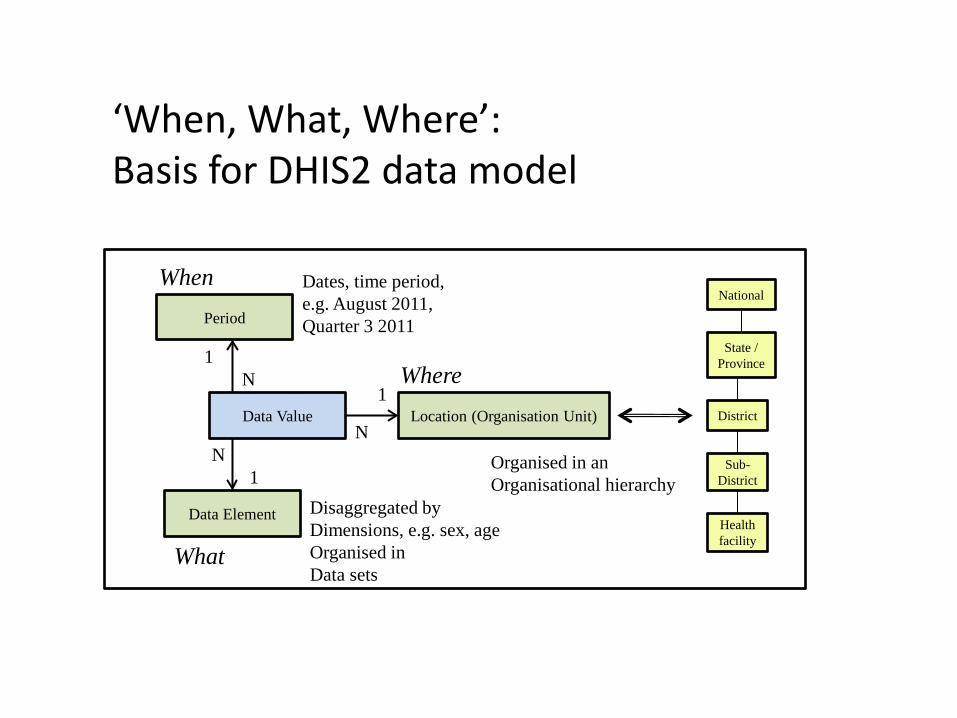
Data Element
Period
Location (Organisation Unit) Data Value
1
1
1 N
N N
When
Where
What
National
State / Province
District
Sub-District
Health facility
Organised in an Organisational hierarchy
Disaggregated by Dimensions, e.g. sex, age Organised in Data sets
Dates, time period, e.g. August 2011, Quarter 3 2011
‘When, What, Where’: Basis for DHIS2 data model
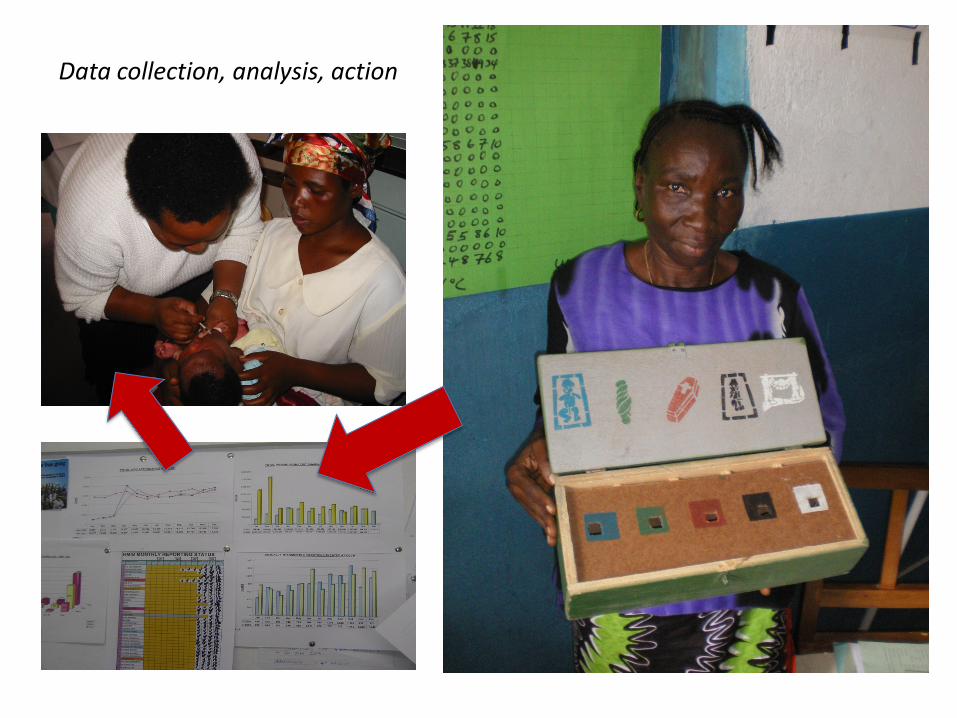
Data collection, analysis, action
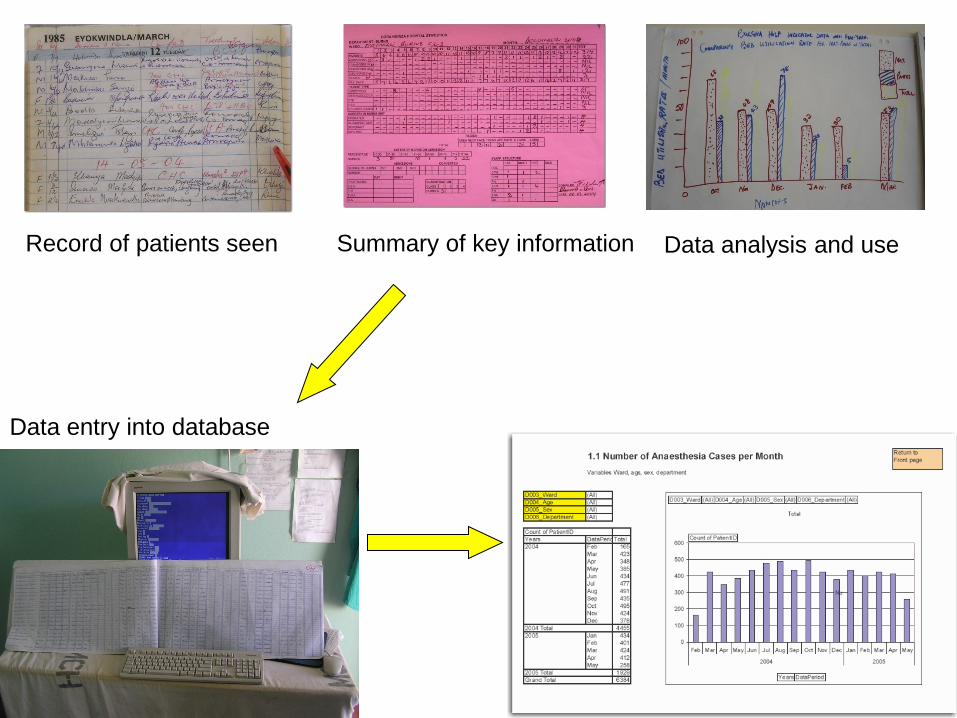
Record of patients seen Summary of key information
Data entry into database
Data analysis and use
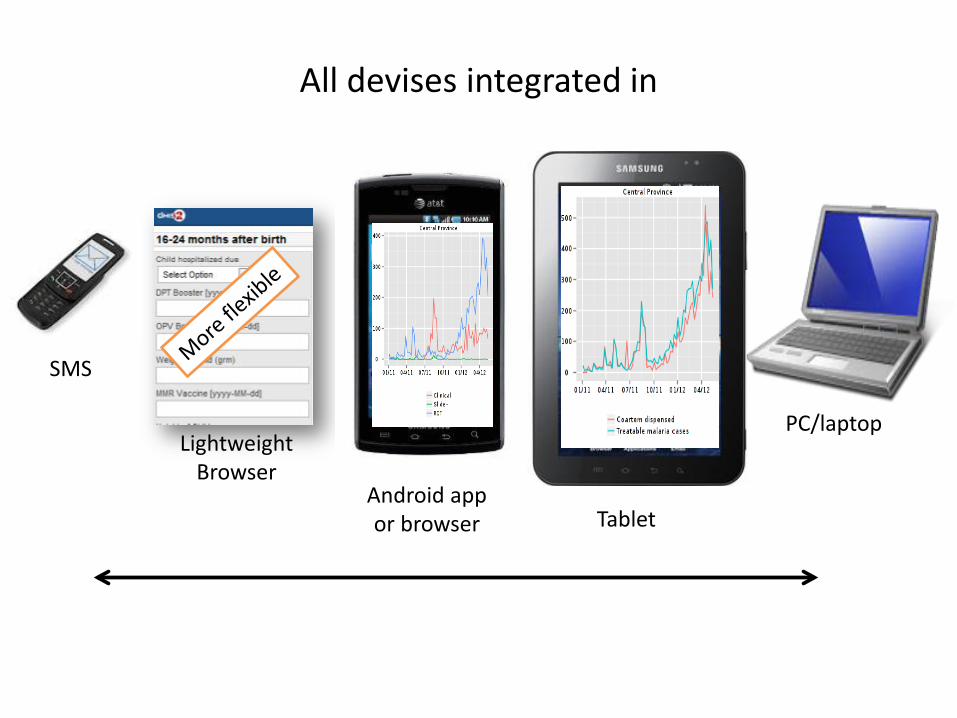
All devises integrated in
Lightweight Browser
SMS
Android app or browser Tablet
PC/laptop
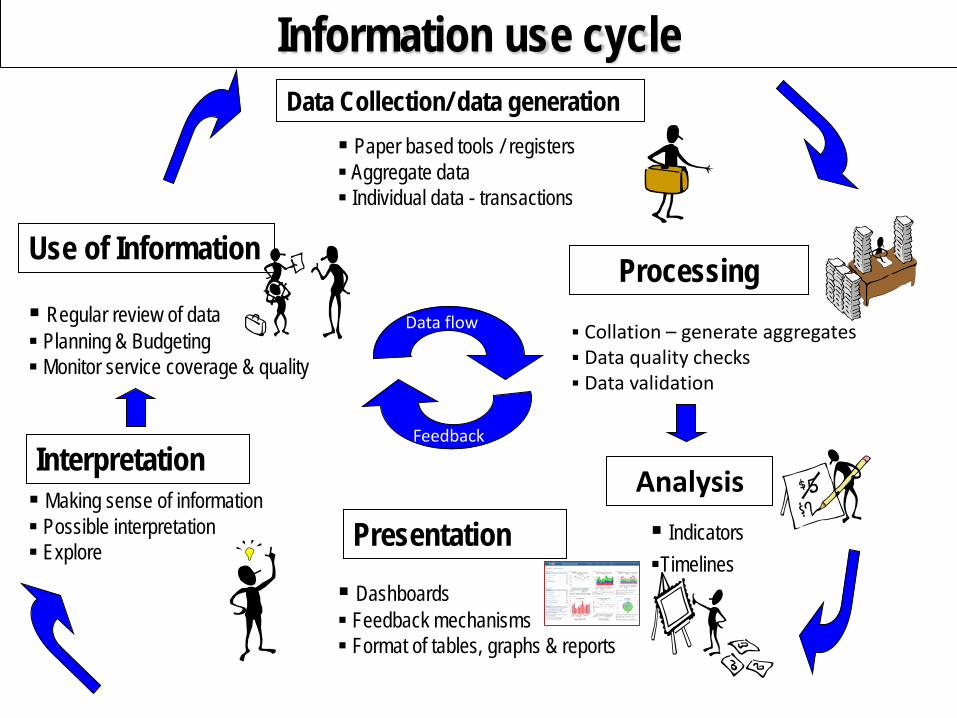
Information use cycle Data Collection/ data generation
Processing
Presentation
Use of Information
Dashboards Feedback mechanisms Format of tables, graphs & reports
Collation – generate aggregates Data quality checks Data validation
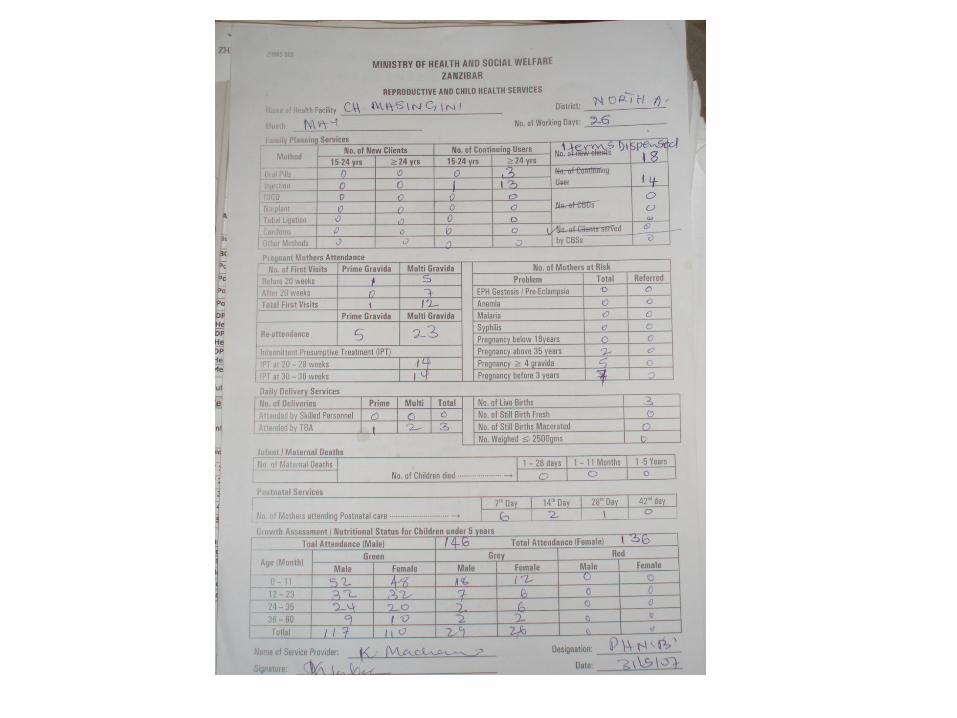
Paper based tools / registers Aggregate data Individual data - transactions
Regular review of data Planning & Budgeting Monitor service coverage & quality
Data flow
Feedback
Analysis Indicators Timelines
Interpretation Making sense of information Possible interpretation Explore
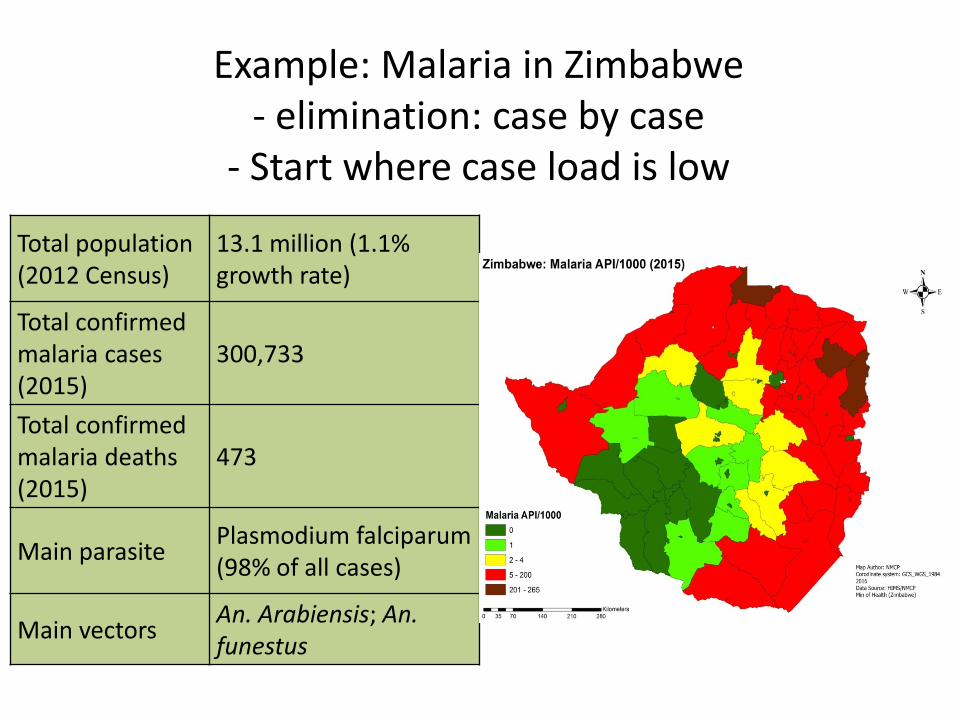
Example: Malaria in Zimbabwe - elimination: case by case
- Start where case load is low
Total population (2012 Census)
13.1 million (1.1% growth rate)
Total confirmed malaria cases (2015)
300,733
Total confirmed malaria deaths (2015)
473
Main parasite Plasmodium falciparum (98% of all cases)
Main vectors An. Arabiensis; An. funestus
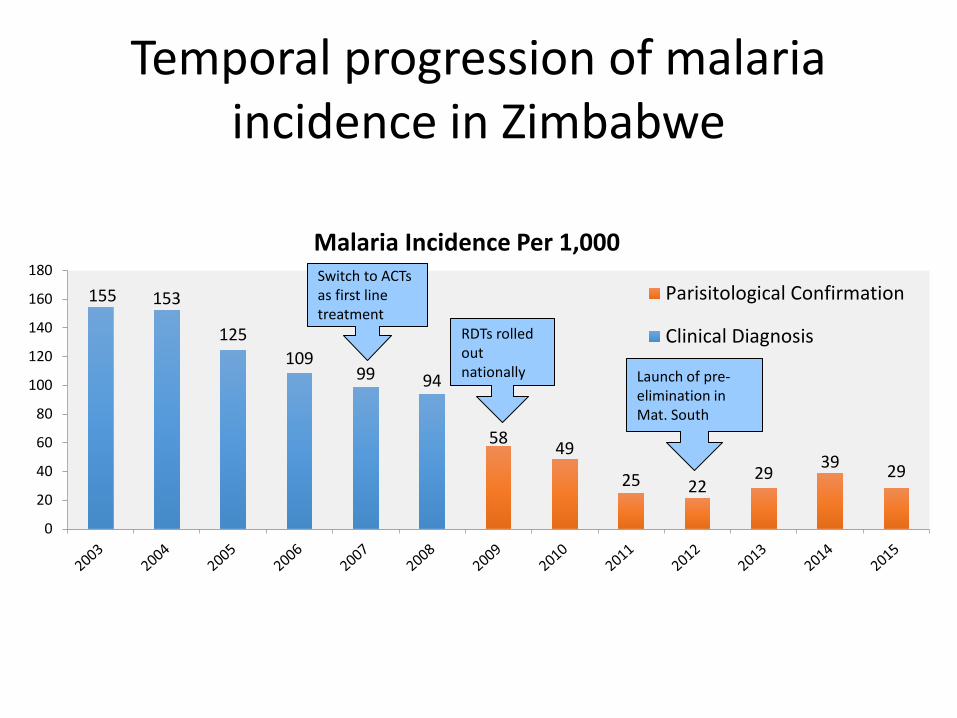
Temporal progression of malaria incidence in Zimbabwe
155 153
125 109
99 94
58 49
25 22 29 39 29
0
20
40
60
80
100
120
140
160
180Malaria Incidence Per 1,000
Parisitological Confirmation
Clinical DiagnosisRDTs rolled out nationally
Switch to ACTs as first line treatment
Launch of pre-elimination in Mat. South
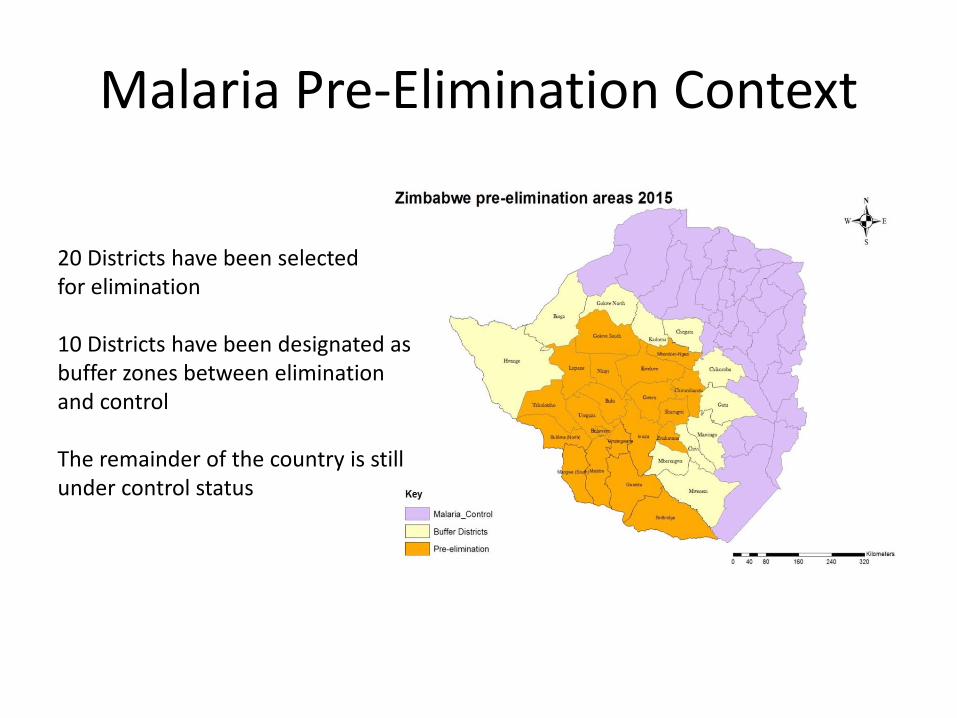
Malaria Pre-Elimination Context
20 Districts have been selected for elimination 10 Districts have been designated as buffer zones between elimination and control The remainder of the country is still under control status
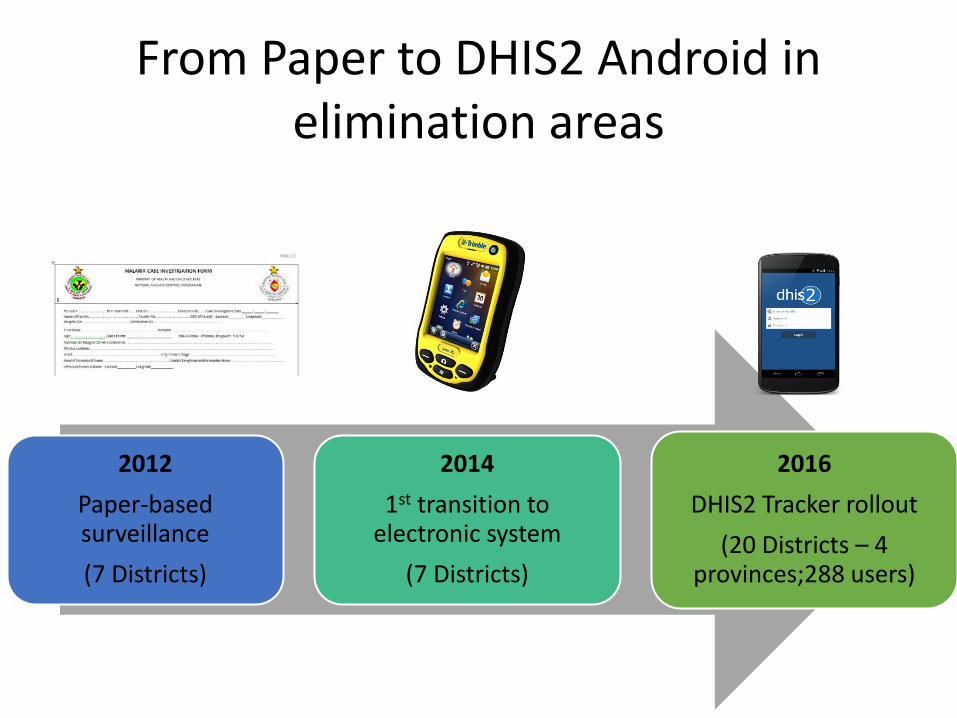
From Paper to DHIS2 Android in elimination areas
2012 Paper-based surveillance (7 Districts)
2014 1st transition to
electronic system (7 Districts)
2016 DHIS2 Tracker rollout
(20 Districts – 4 provinces;288 users)
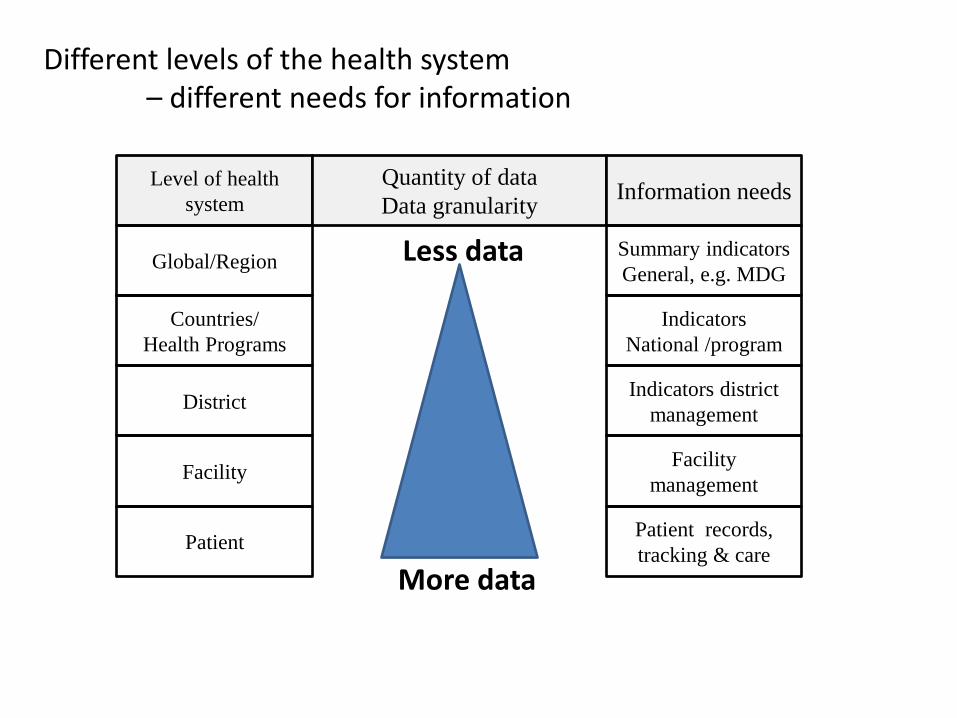
Level of health system
Global/Region
Countries/ Health Programs
Facility
Patient
District
Quantity of data Data granularity Information needs
Summary indicators General, e.g. MDG
Indicators district management
Indicators National /program
Facility management
Patient records, tracking & care
More data
Less data
Different levels of the health system – different needs for information
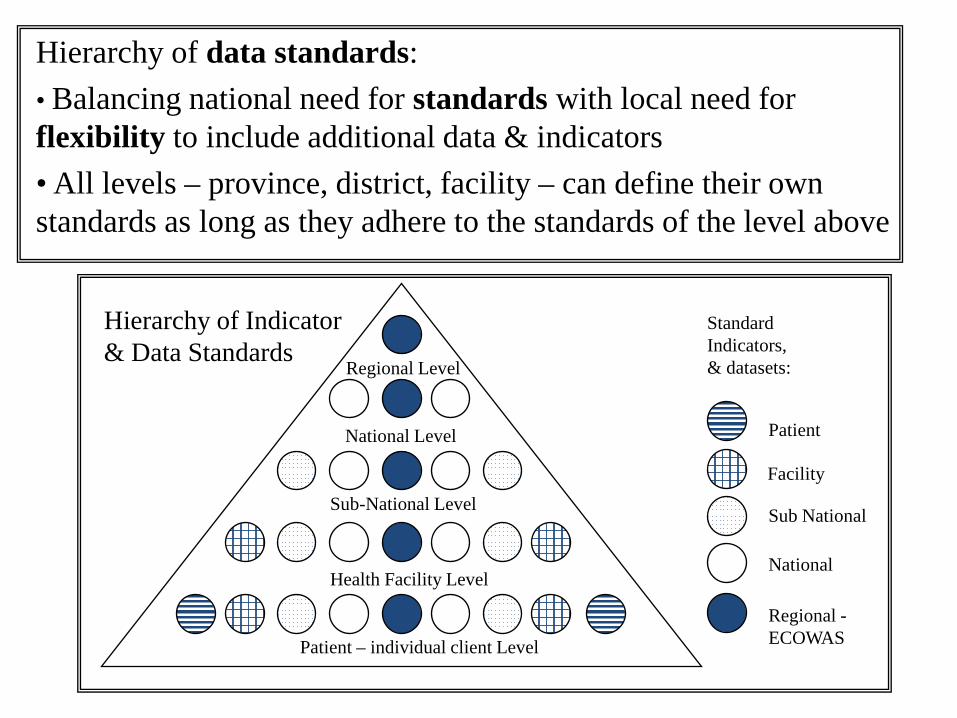
Hierarchy of data standards: • Balancing national need for standards with local need for flexibility to include additional data & indicators • All levels – province, district, facility – can define their own standards as long as they adhere to the standards of the level above
Patient – individual client Level
Health Facility Level
Sub-National Level
National Level
Regional Level
Standard Indicators, & datasets:
Patient
Facility
Sub National
National
Regional - ECOWAS
Hierarchy of Indicator & Data Standards
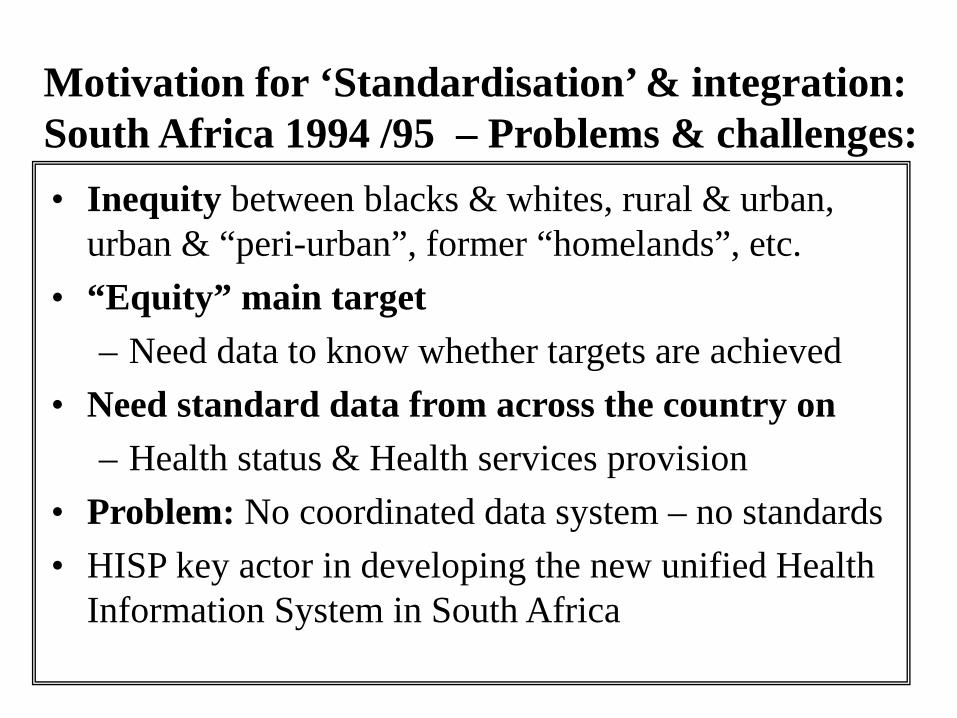
• Inequity between blacks & whites, rural & urban, urban & “peri-urban”, former “homelands”, etc.
• “Equity” main target – Need data to know whether targets are achieved
• Need standard data from across the country on – Health status & Health services provision
• Problem: No coordinated data system – no standards • HISP key actor in developing the new unified Health
Information System in South Africa
Motivation for ‘Standardisation’ & integration: South Africa 1994 /95 – Problems & challenges:
Hospital PAWC
Clinic RSC
Clinic RSC
Clinic PAWC
Private
Private
NGO
Cape Town RSC
Cape Town PAWC
Malmesbury PAWC
DNHPD Western Cape
Family Planning
MOU PAWC
School Health Hospital
Clinic
Private NGO
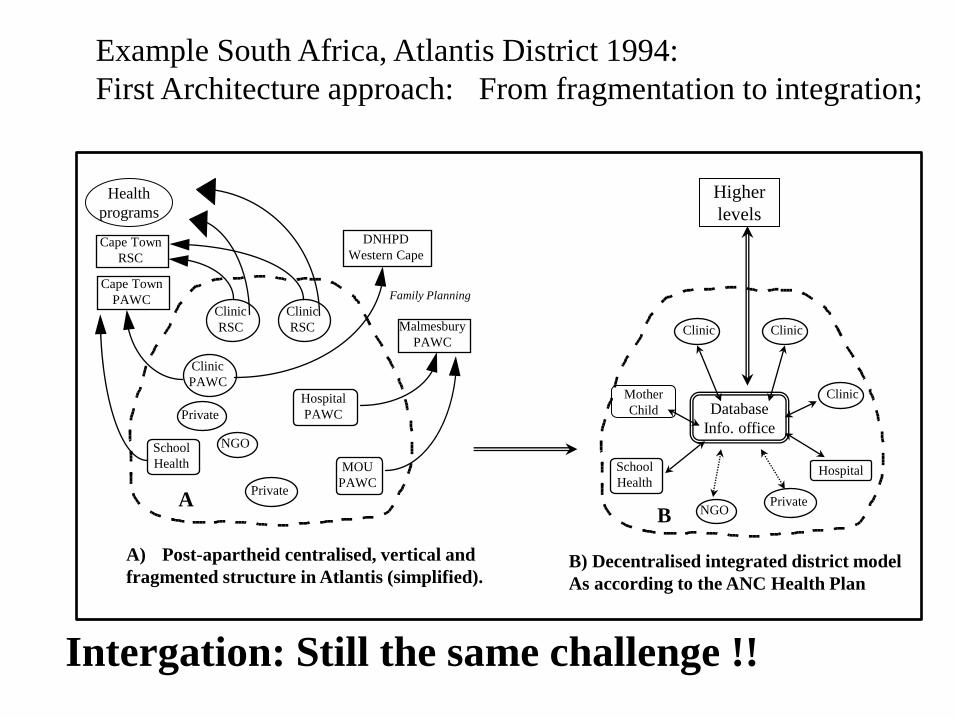
A) Post-apartheid centralised, vertical and fragmented structure in Atlantis (simplified).
School Health
Clinic
Clinic
A B
B) Decentralised integrated district model As according to the ANC Health Plan
Database Info. office
Higher levels
Health programs
Mother Child
Example South Africa, Atlantis District 1994: First Architecture approach: From fragmentation to integration;
Intergation: Still the same challenge !!
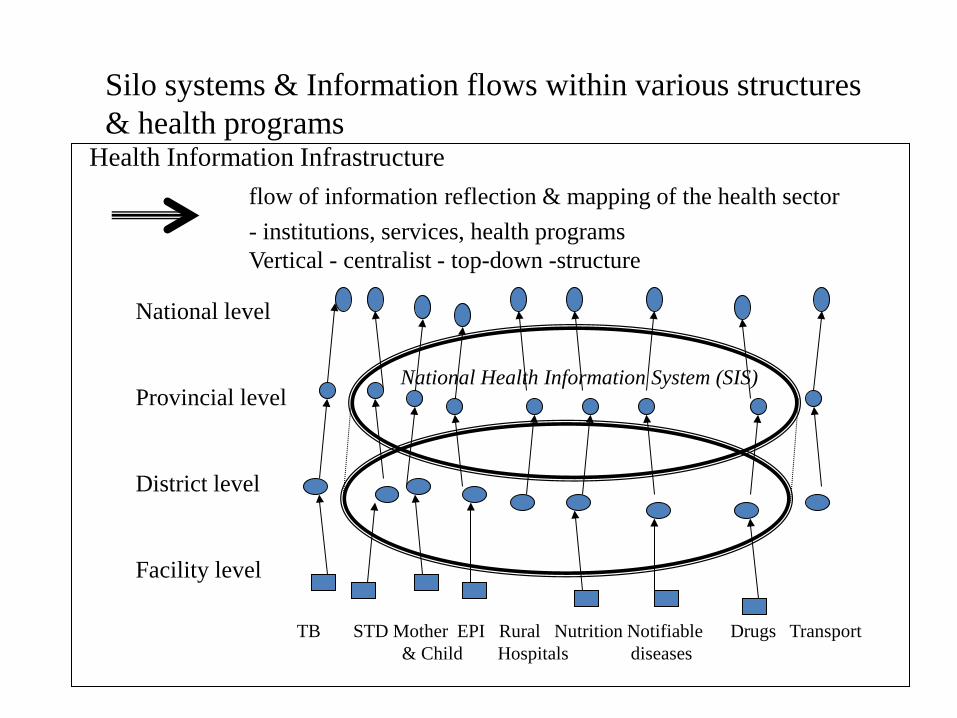
Silo systems & Information flows within various structures & health programs Health Information Infrastructure
flow of information reflection & mapping of the health sector - institutions, services, health programs
Vertical - centralist - top-down -structure
National level Provincial level District level Facility level
TB STD Mother EPI Rural Nutrition Notifiable Drugs Transport & Child Hospitals diseases
National Health Information System (SIS)
TB MCH
Vaccine
IDSR
Malaria
AIDS
Others
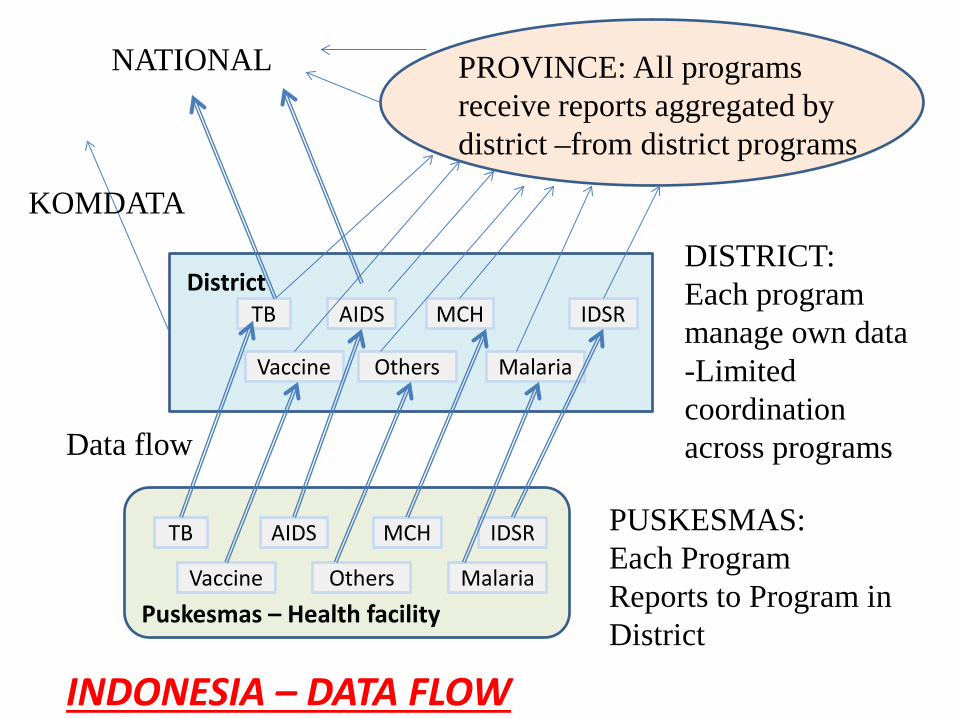
TB
Vaccine
AIDS
Others
MCH
Malaria
IDSR
PUSKESMAS: Each Program Reports to Program in District
DISTRICT: Each program manage own data -Limited coordination across programs
Puskesmas – Health facility
District
Data flow
NATIONAL PROVINCE: All programs receive reports aggregated by district –from district programs
KOMDATA
INDONESIA – DATA FLOW
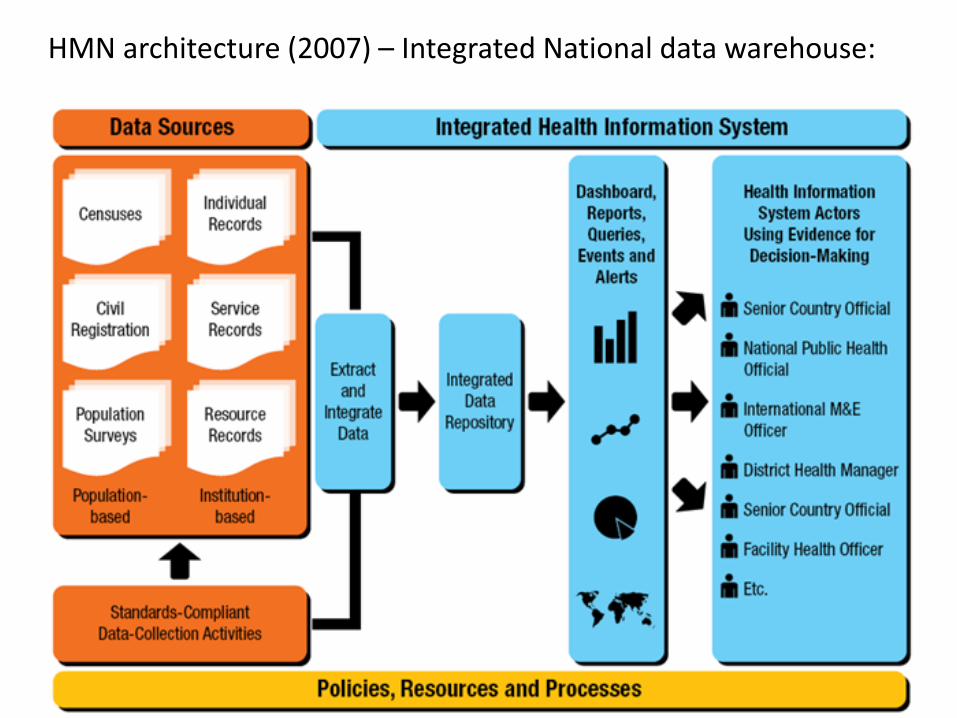
HMN architecture (2007) – Integrated National data warehouse:
Data warehouse
DHIS 2 LMIS
HR EMR
Measles under 1 year coverage by district 2006(Measles doses given to children < 1 year / total population < 1 year)
74.781.3 79.0 80.7
89.594.4
80.0 79.9
93.6 93.8
0.0
10.0
20.0
30.0
40.0
50.0
60.0
70.0
80.0
90.0
100.0
ChakeChakeDistrict
Michew eniDistrict
MkoaniDistrict
WeteDistrict
CentralDistrict
North ADistrict
North BDistrict
SouthDistrict
UrbanDistrict
WestDistrict
Pemba Zone Unguja Zone
District
Annu
al m
easl
es c
over
age
%
Data from Mobile devises
-Data mart -Meta data -Visualising tools
Dashboard
Graphs
Maps
Getting data in - Data warehousing Getting data out - Decision support systems – ‘Business intelligence (BI)
Web Portal
Mobile
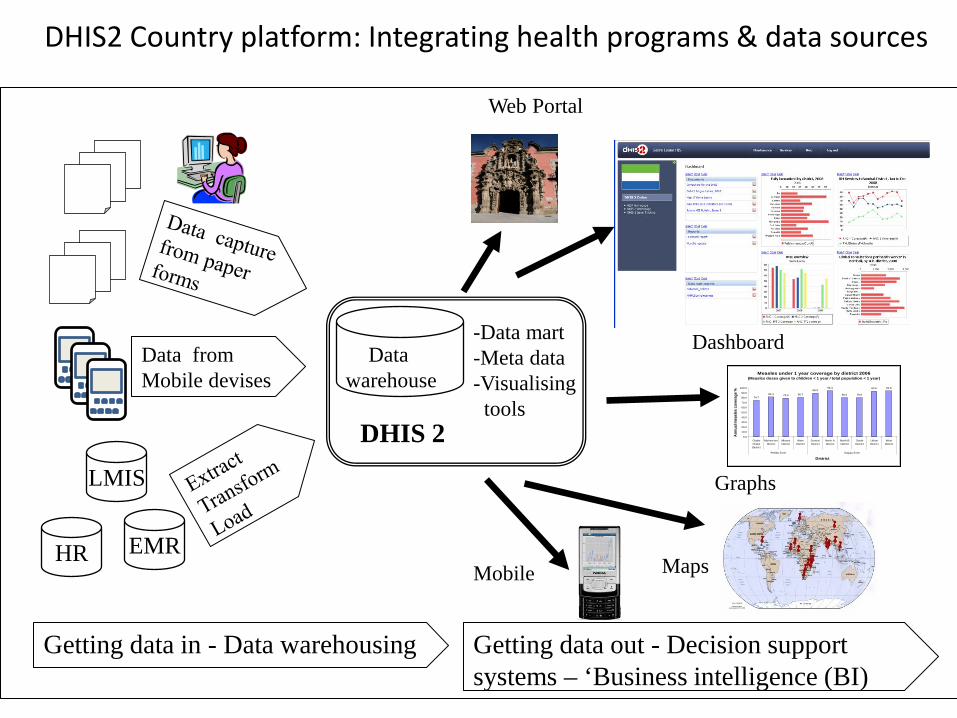
DHIS2 Country platform: Integrating health programs & data sources
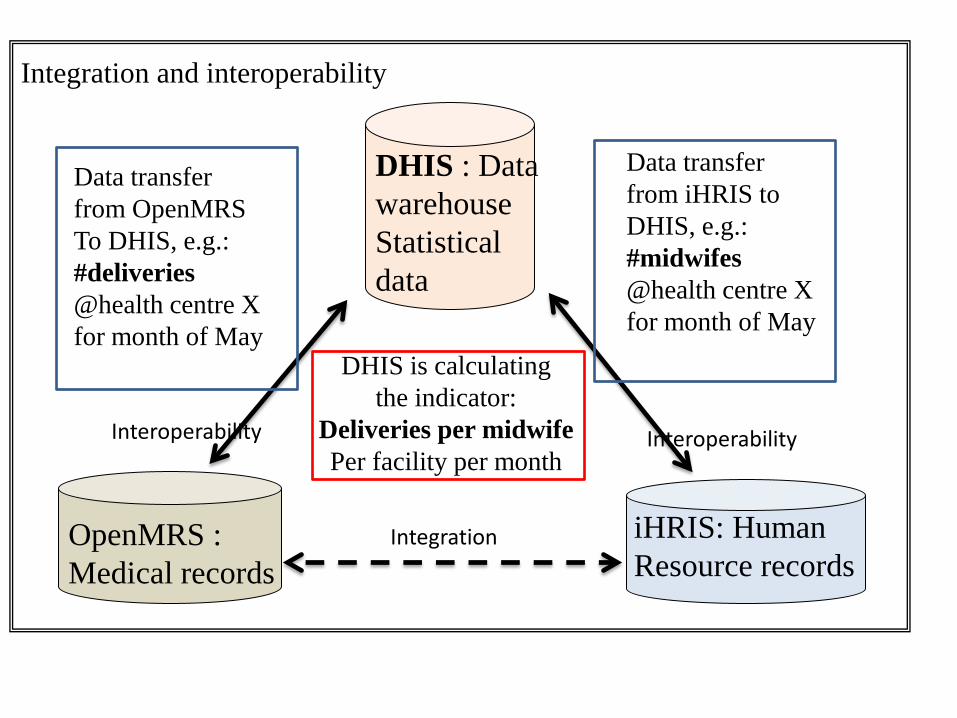
Integration and interoperability
DHIS : Data warehouse Statistical data
OpenMRS : Medical records
iHRIS: Human Resource records
Data transfer from OpenMRS To DHIS, e.g.: #deliveries @health centre X for month of May
Data transfer from iHRIS to DHIS, e.g.: #midwifes @health centre X for month of May
DHIS is calculating the indicator:
Deliveries per midwife Per facility per month
Integration
Interoperability Interoperability
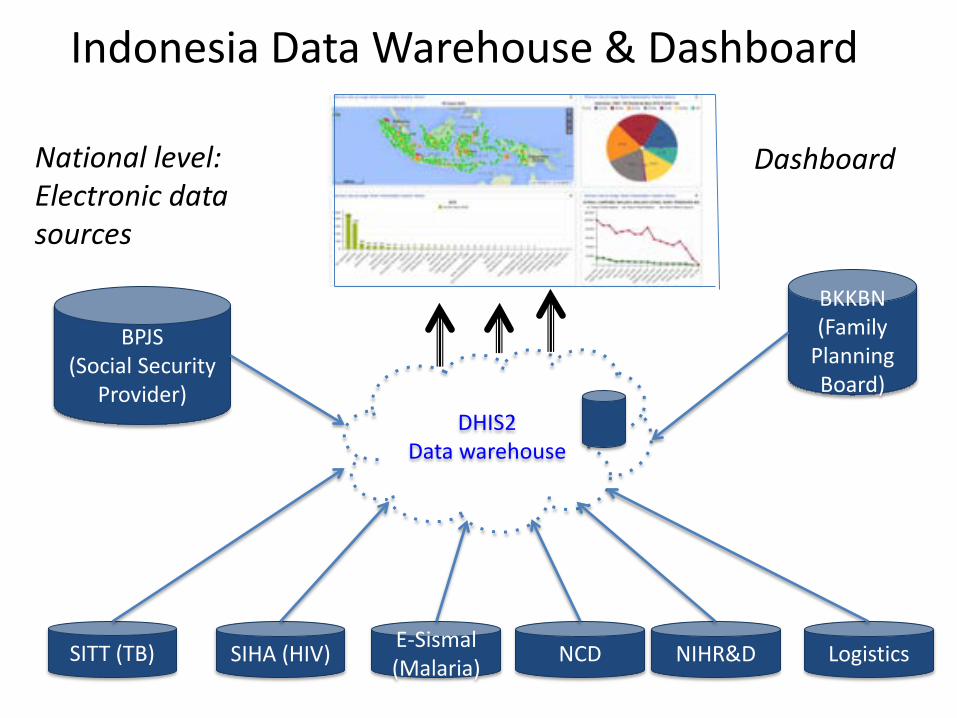
Indonesia Data Warehouse & Dashboard
DHIS2 Data warehouse
SITT (TB) SIHA (HIV) E-Sismal (Malaria) NCD Logistics
BKKBN (Family
Planning Board)
BPJS (Social Security
Provider)
NIHR&D
National level: Electronic data sources
Dashboard
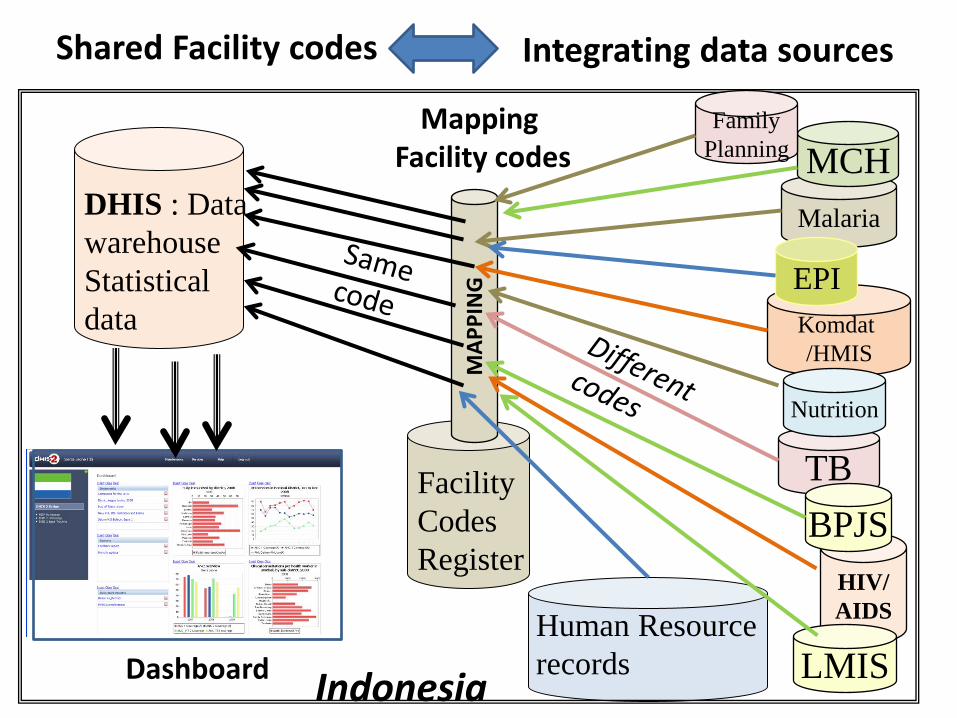
DHIS : Data warehouse Statistical data
Human Resource records Dashboard
TB
Malaria
HIV/ AIDS
Komdat /HMIS
Facility Codes Register
MAP
PIN
G
Mapping Facility codes MCH
Shared Facility codes Integrating data sources
Nutrition
Family Planning
EPI
BPJS
LMIS Indonesia
MCH
Nuttrition
Immunisatio
n
Overlapping & repetitive Puskesmas data collection forms
MCH
Nuttrition
Immunisation
Create standardised Puskesmas data sets
DHIS2
SIKDA EMR
Lainnya Other EMR
Implemented in DHIS2 -> Data elements
EMRs Push standardise Data sets to DHIS2
Exccel Templates
Standardised data sets: Key to Integration (Data Dictionary)
Other EMR HR,
etc.
Other Nationa lsystems
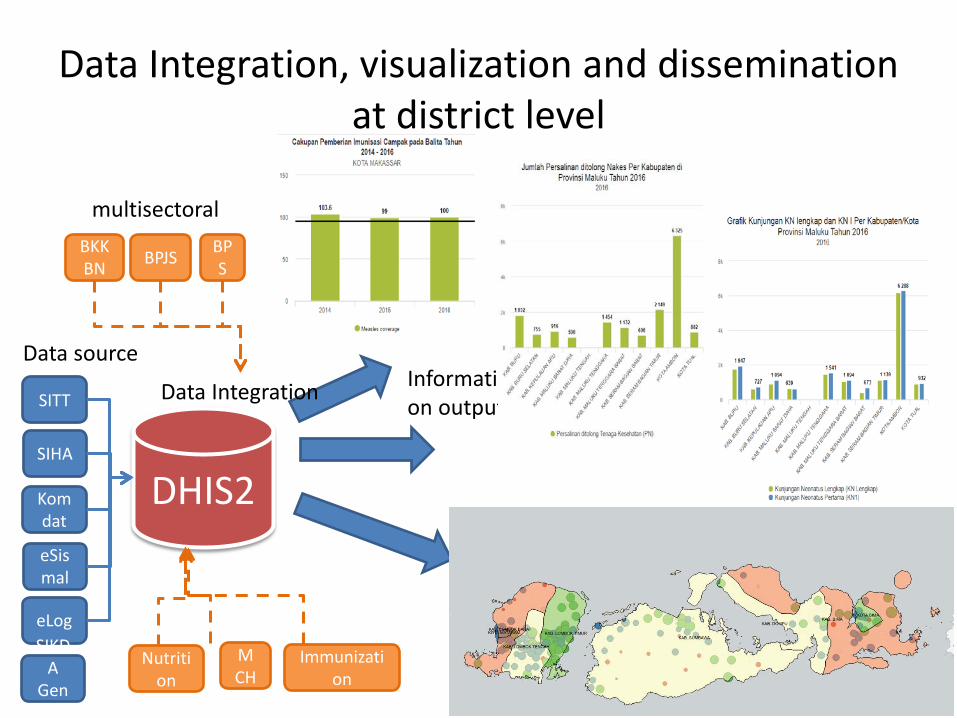
Data Integration, visualization and dissemination at district level
SITT
SIHA
Komdat
eSismal
eLog
DHIS2
Data source
Nutrition
MCH
Immunization
Data Integration Information output
BKKBN BPJS BP
S
multisectoral
SIKDA
Generik
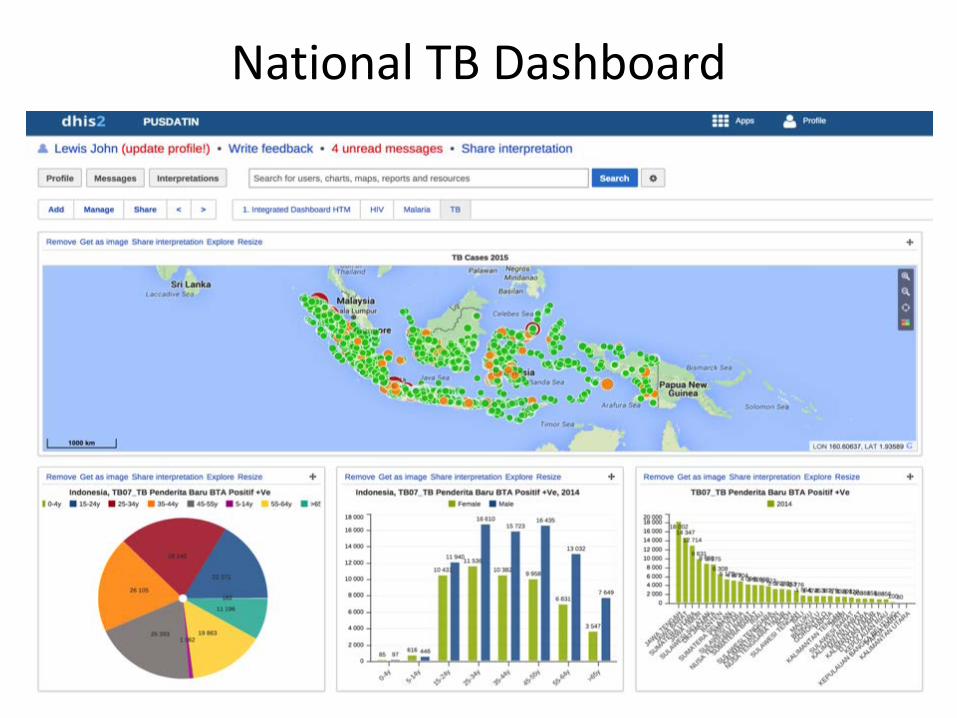
National TB Dashboard
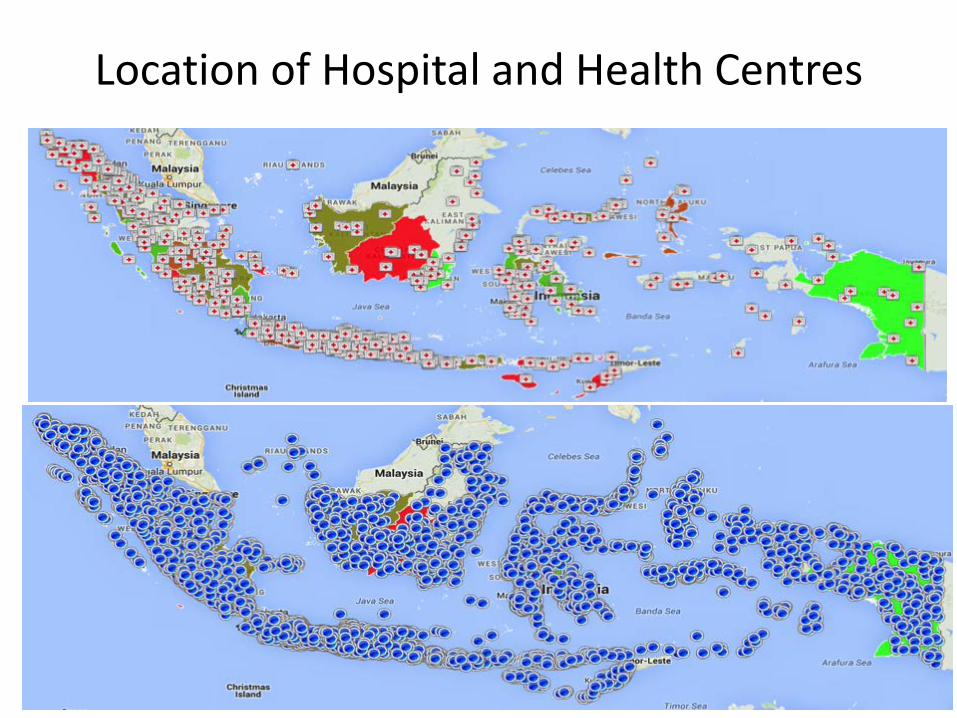
Location of Hospital and Health Centres
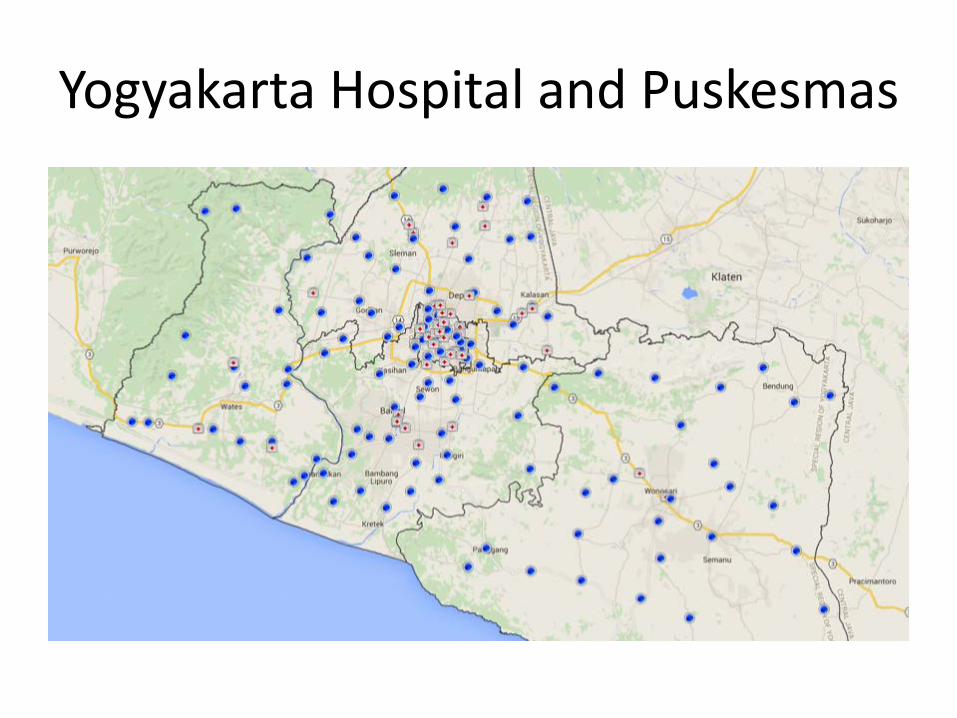
Yogyakarta Hospital and Puskesmas
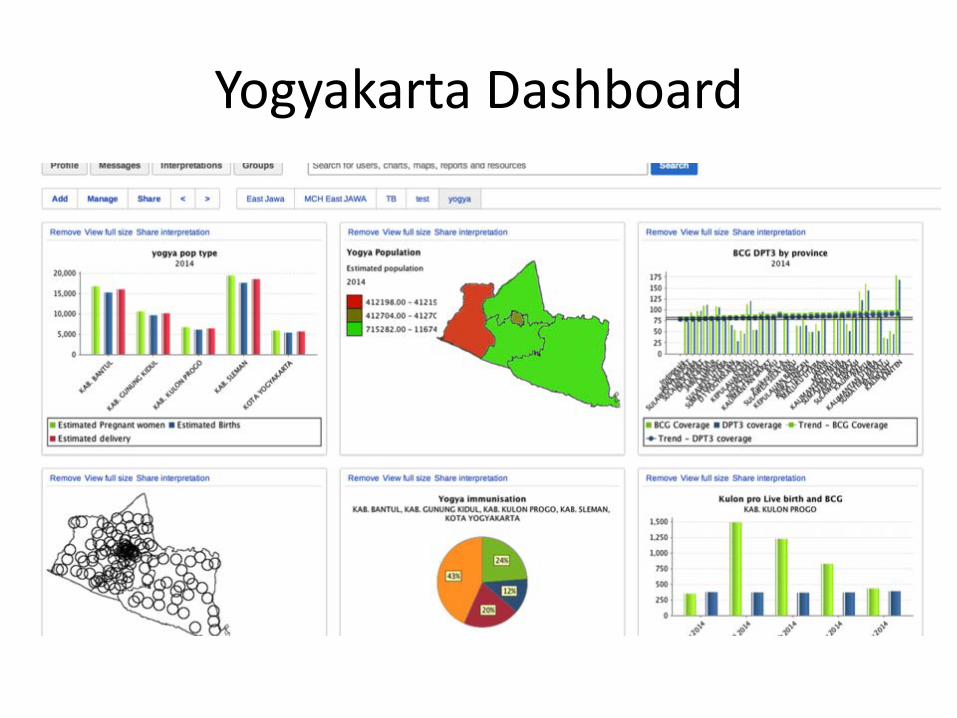
Yogyakarta Dashboard
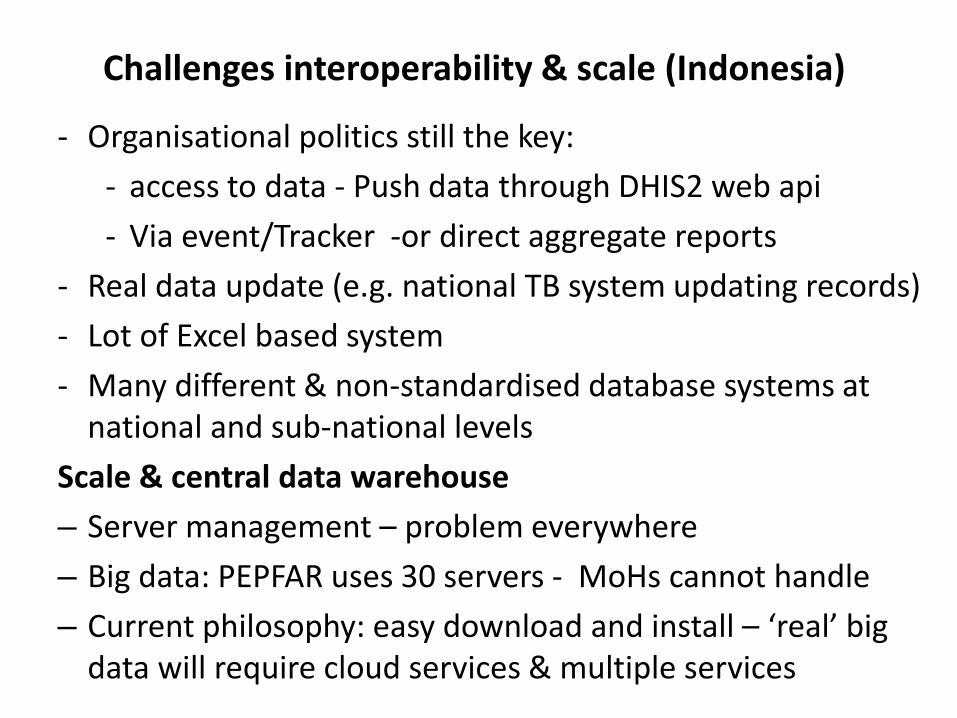
Challenges interoperability & scale (Indonesia)
- Organisational politics still the key: - access to data - Push data through DHIS2 web api - Via event/Tracker -or direct aggregate reports
- Real data update (e.g. national TB system updating records) - Lot of Excel based system - Many different & non-standardised database systems at
national and sub-national levels Scale & central data warehouse – Server management – problem everywhere – Big data: PEPFAR uses 30 servers - MoHs cannot handle – Current philosophy: easy download and install – ‘real’ big
data will require cloud services & multiple services
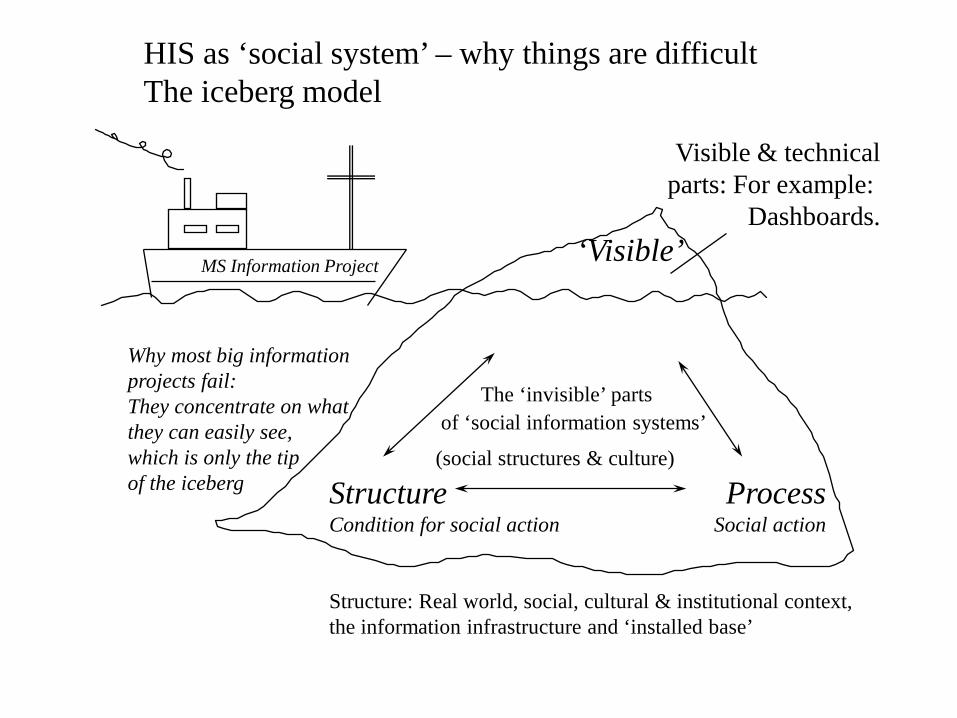
‘Visible’
The ‘invisible’ parts of ‘social information systems’
(social structures & culture) Structure Process Condition for social action Social action Structure: Real world, social, cultural & institutional context, the information infrastructure and ‘installed base’
Visible & technical parts: For example:
Dashboards.
MS Information Project
Why most big information projects fail: They concentrate on what they can easily see, which is only the tip of the iceberg
HIS as ‘social system’ – why things are difficult The iceberg model
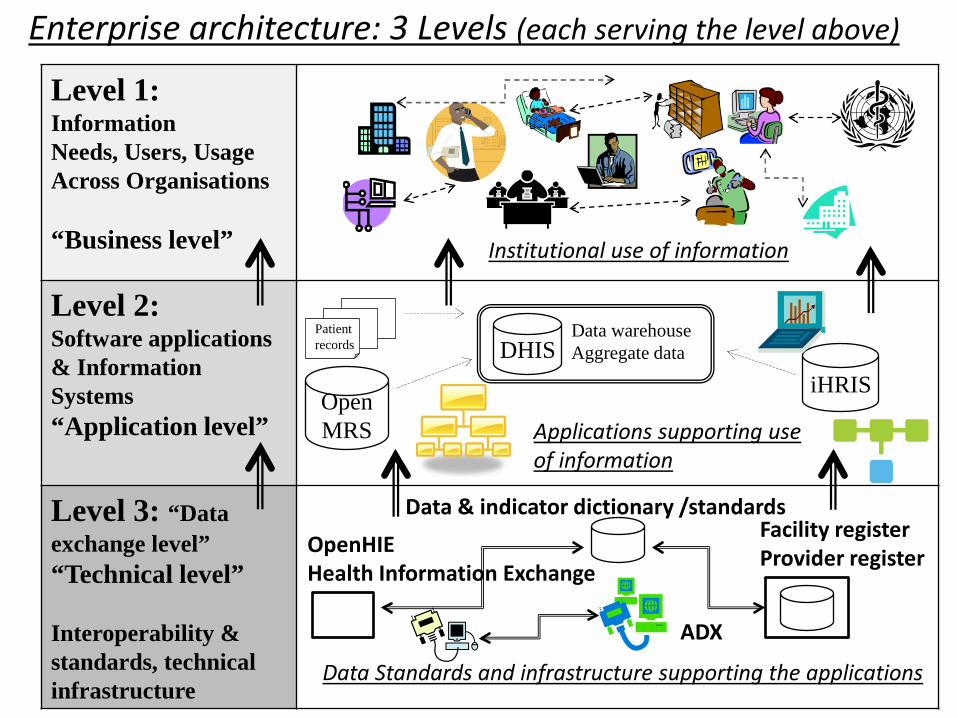
Level 1: Information Needs, Users, Usage Across Organisations “Business level”
Level 2: Software applications & Information Systems “Application level”
Level 3: “Data exchange level” “Technical level” Interoperability & standards, technical infrastructure
Open MRS
DHIS Patient records
iHRIS
Data warehouse Aggregate data
Institutional use of information
Applications supporting use of information
Data Standards and infrastructure supporting the applications
Enterprise architecture: 3 Levels (each serving the level above)
Data & indicator dictionary /standards Facility register Provider register
ADX
OpenHIE Health Information Exchange
Environmental Health
Information officer
Manager
Information responsible
District hospital
district database
Health centre/ Clinic
Clinic
School Health
Local Government
Immunisation program (EPI)
NGO
District management team District
manager
report
Register report
Information officer
Manager
Nurse
Nurse
Patients
Patients
‘Community’ ‘Community’
‘Action’
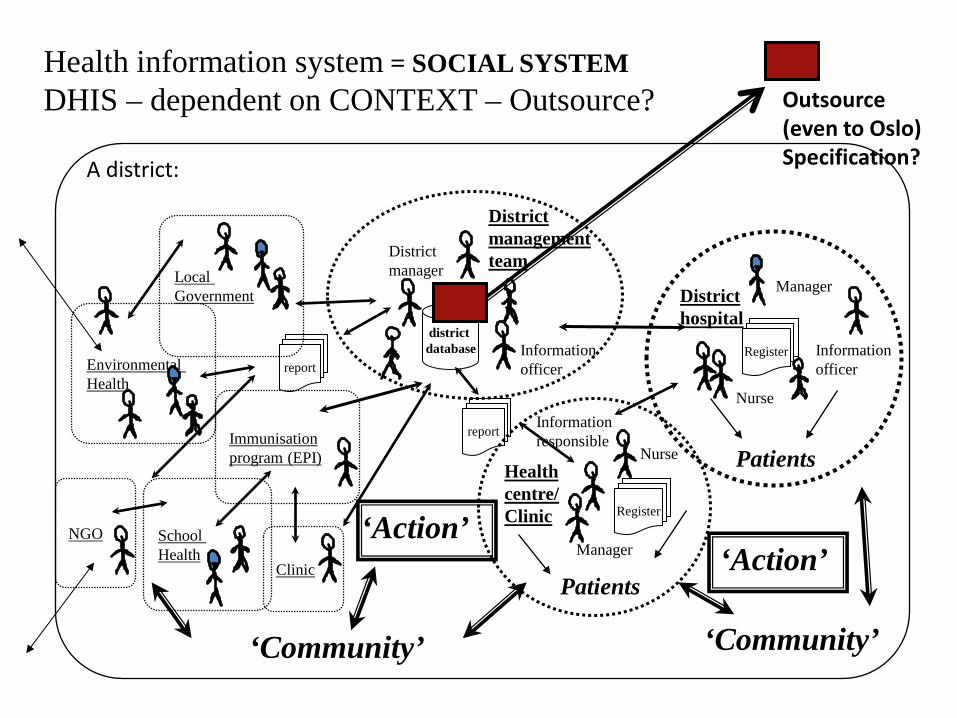
Health information system = SOCIAL SYSTEM DHIS – dependent on CONTEXT – Outsource?
‘Action’
Register
A district:
Outsource (even to Oslo) Specification?
Development: Internet Cnnectivity in Africa WHY SUCH DHIS2 EXPANSION ?
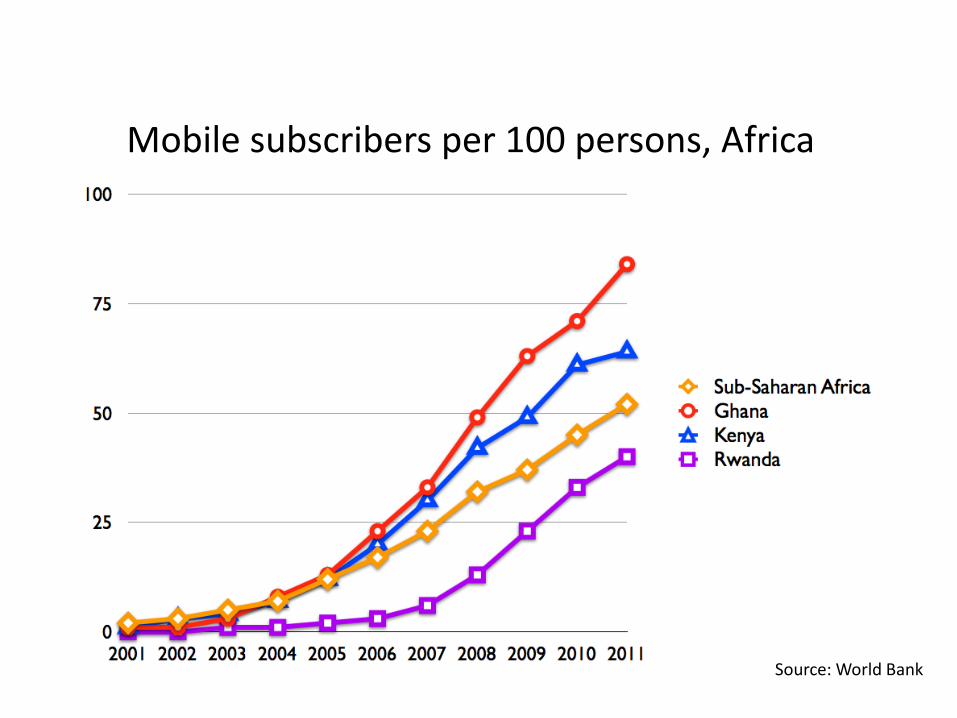
Mobile subscribers per 100 persons, Africa
Source: World Bank
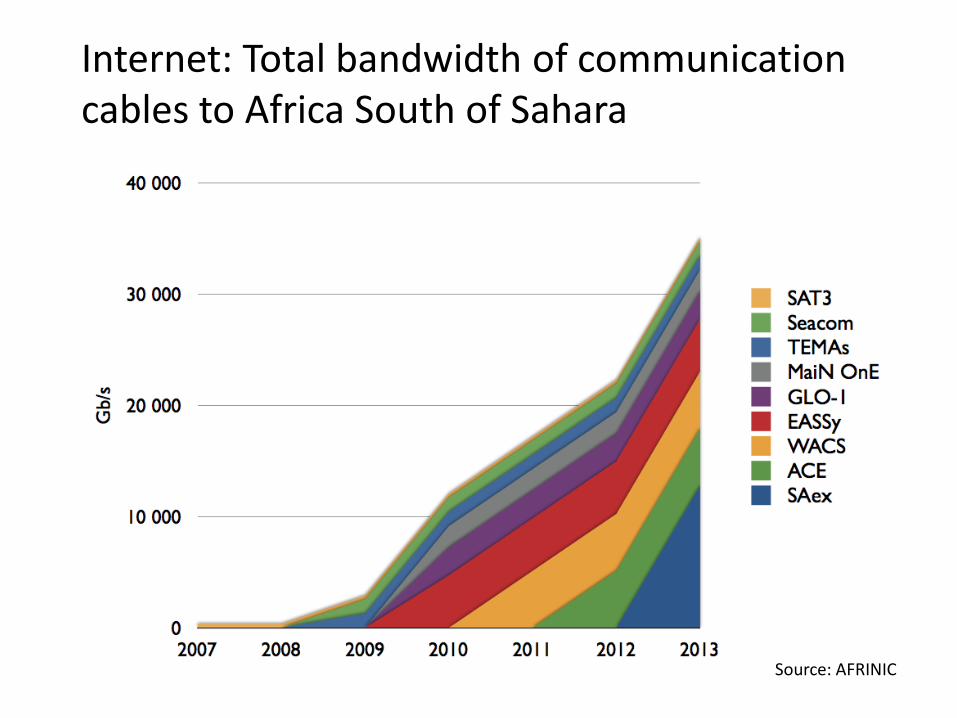
Internet: Total bandwidth of communication cables to Africa South of Sahara
Source: AFRINIC
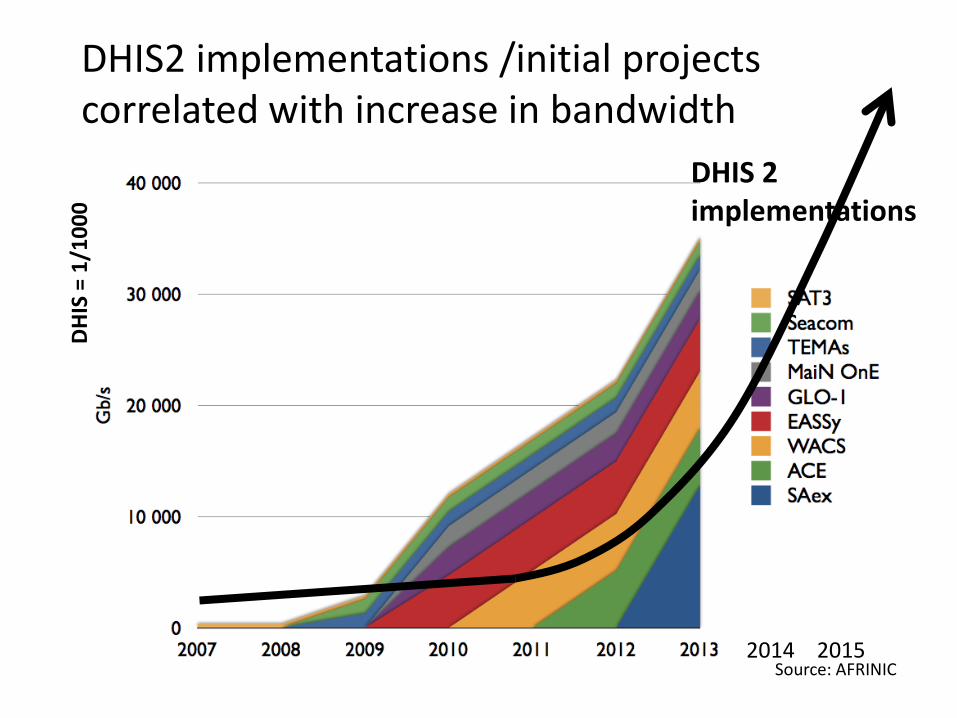
DHIS2 implementations /initial projects correlated with increase in bandwidth
Source: AFRINIC
DHIS 2 implementations
2014 2015
DH
IS =
1/1
000
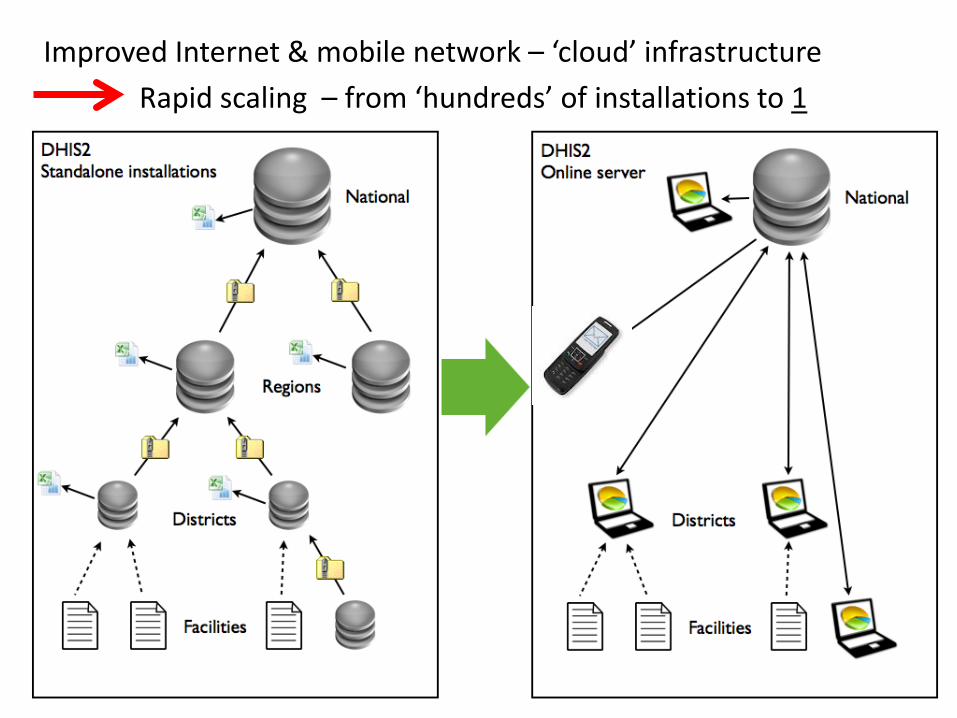
Improved Internet & mobile network – ‘cloud’ infrastructure Rapid scaling – from ‘hundreds’ of installations to 1
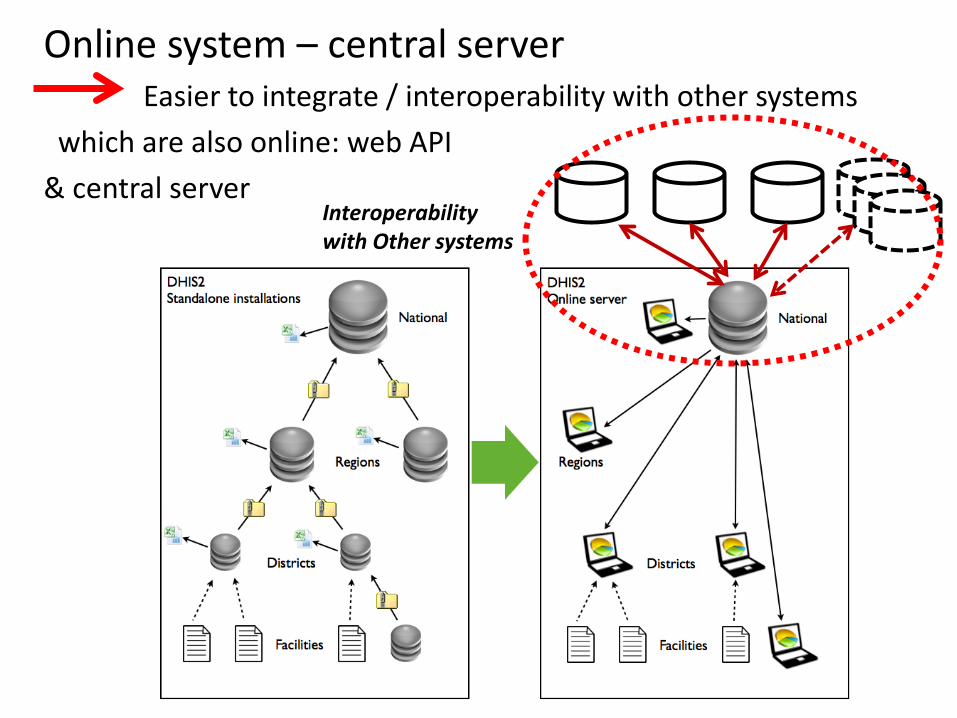
Online system – central server Easier to integrate / interoperability with other systems which are also online: web API & central server
Interoperability with Other systems
DHIS2
Online Data capture Measles under 1 year coverage by district 2006
(Measles doses given to children < 1 year / total population < 1 year)
74.781.3 79.0 80.7
89.594.4
80.0 79.9
93.6 93.8
0.0
10.0
20.0
30.0
40.0
50.0
60.0
70.0
80.0
90.0
100.0
ChakeChakeDistrict
Michew eniDistrict
MkoaniDistrict
WeteDistrict
CentralDistrict
North ADistrict
North BDistrict
SouthDistrict
UrbanDistrict
WestDistrict
Pemba Zone Unguja Zone
District
An
nu
al m
ea
sle
s c
ov
era
ge
%
Online data use; web pivot reports, charts, maps
Datamart - pivot tables Archive -reports, - Charts, maps
Browser
Offline Data Capture
Offline data use application
Online / / Offline
BCG: 12 PENTA1:10 PENTA2: 7 PENTA3:11
Mobile Data Use
Mobile Data Capture
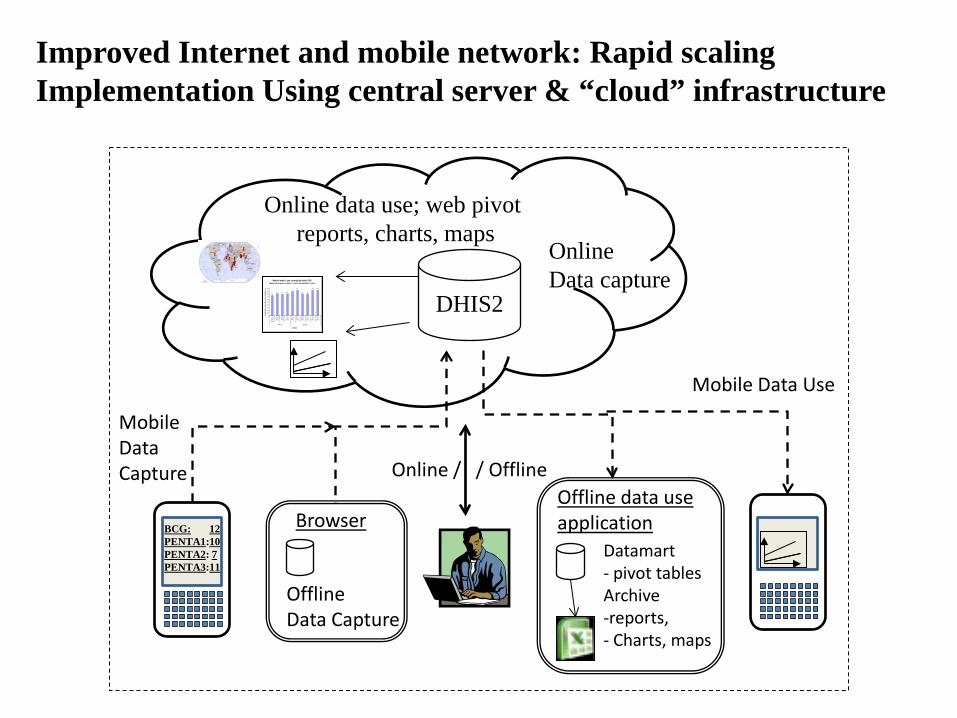
Improved Internet and mobile network: Rapid scaling Implementation Using central server & “cloud” infrastructure
Cloud: New Challenges • From installations everywhere to central server:
– Easier: Less maintenance, form many to one ‘place’, no viruses, etc
– More difficult: New skills – servers – required • Cloud technology and problems: Store patient data
outside the country? • Not enough local hosting providers & server experts
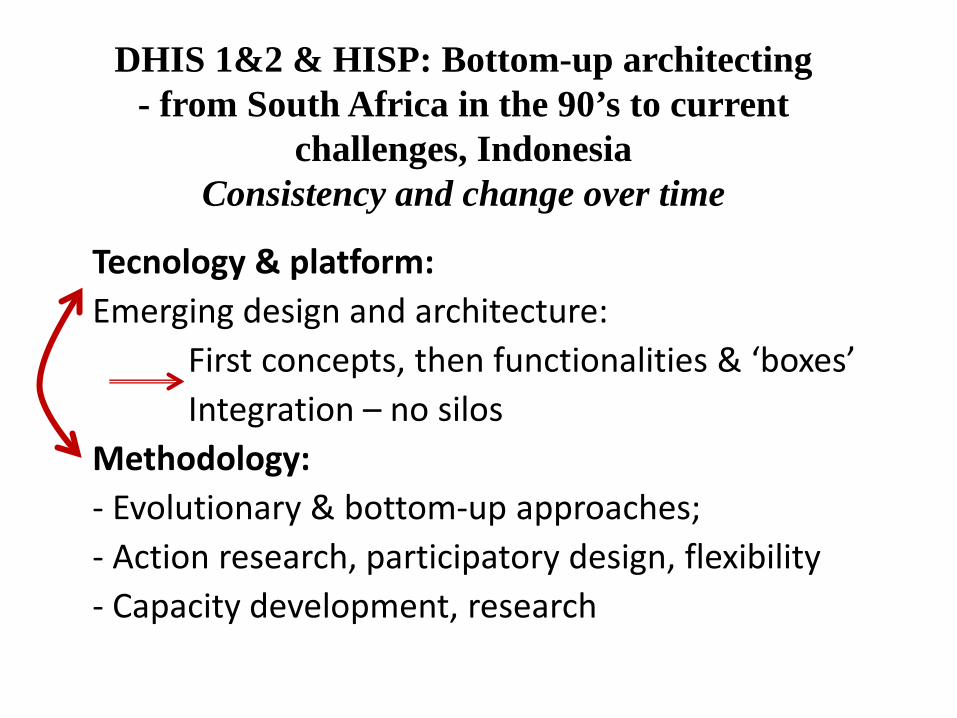
Tecnology & platform: Emerging design and architecture: First concepts, then functionalities & ‘boxes’ Integration – no silos Methodology: - Evolutionary & bottom-up approaches; - Action research, participatory design, flexibility - Capacity development, research
DHIS 1&2 & HISP: Bottom-up architecting - from South Africa in the 90’s to current
challenges, Indonesia Consistency and change over time
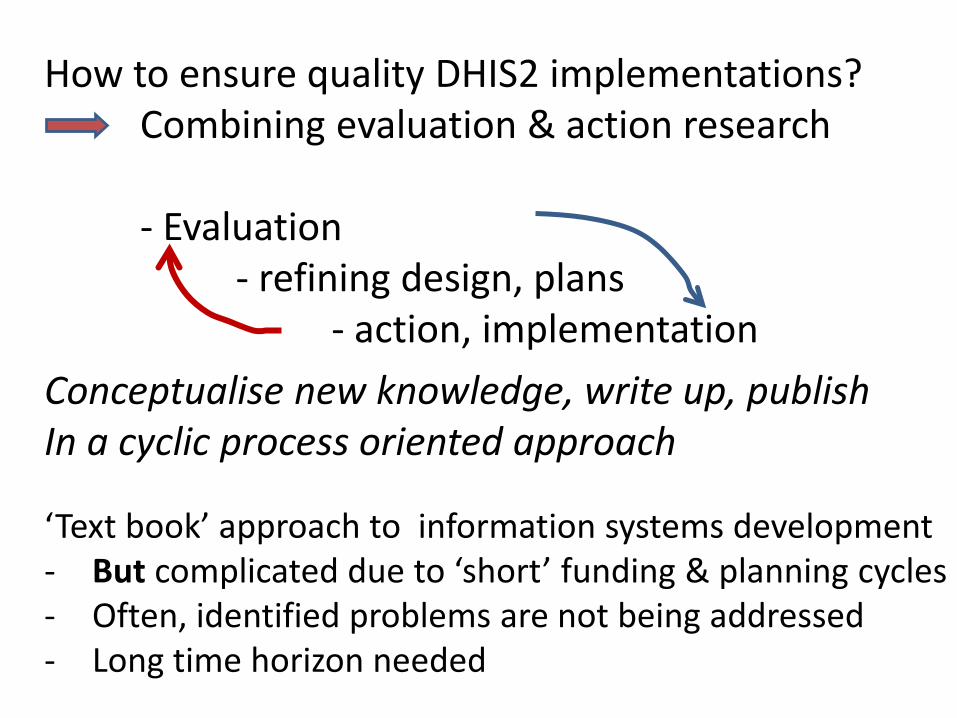
How to ensure quality DHIS2 implementations? Combining evaluation & action research - Evaluation - refining design, plans - action, implementation Conceptualise new knowledge, write up, publish In a cyclic process oriented approach
‘Text book’ approach to information systems development - But complicated due to ‘short’ funding & planning cycles - Often, identified problems are not being addressed - Long time horizon needed
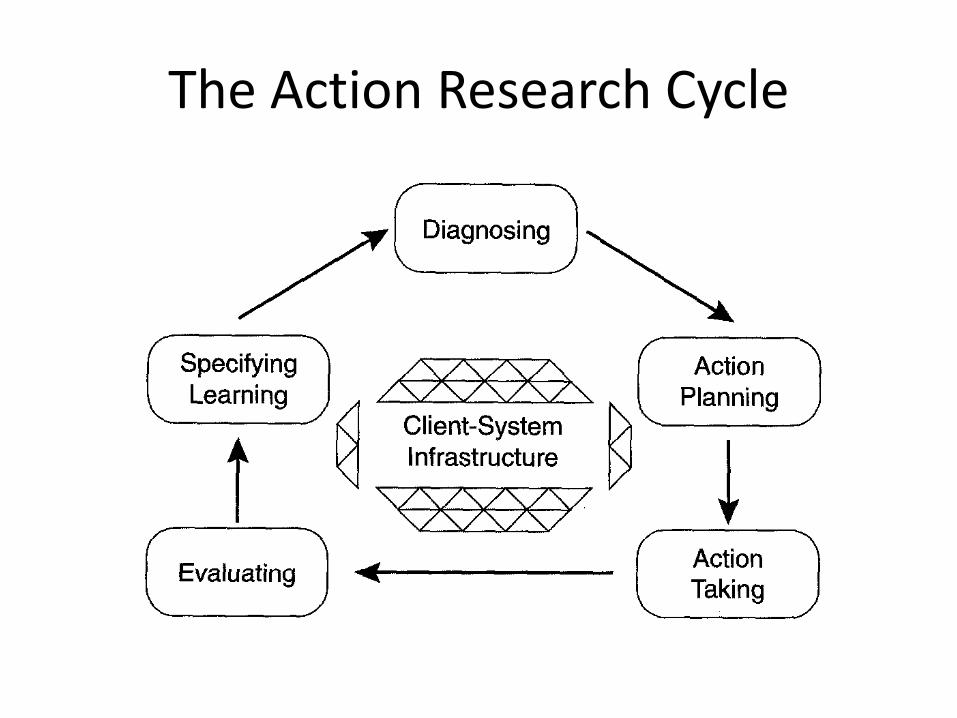
The Action Research Cycle
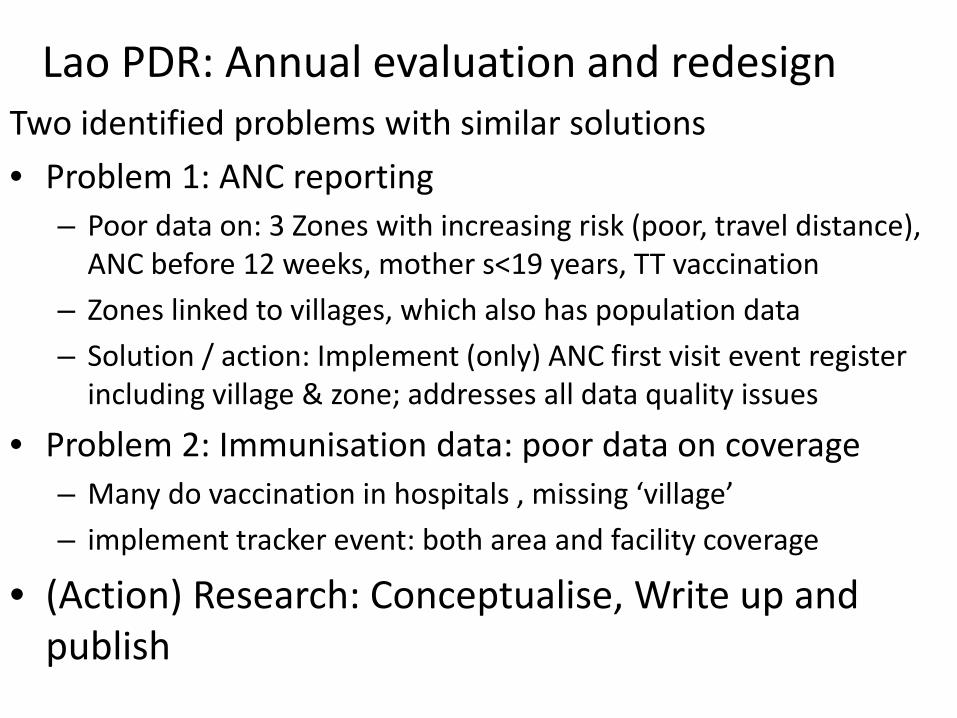
Lao PDR: Annual evaluation and redesign Two identified problems with similar solutions • Problem 1: ANC reporting
– Poor data on: 3 Zones with increasing risk (poor, travel distance), ANC before 12 weeks, mother s<19 years, TT vaccination
– Zones linked to villages, which also has population data – Solution / action: Implement (only) ANC first visit event register
including village & zone; addresses all data quality issues
• Problem 2: Immunisation data: poor data on coverage – Many do vaccination in hospitals , missing ‘village’ – implement tracker event: both area and facility coverage
• (Action) Research: Conceptualise, Write up and publish
Action research & evaluation
• Action Research and participatory design: both cyclic and evolutionary & part of the Ifi ideology – BUT; poor systematic follow-up & continuation
• (Try) make it ‘compulsory’ to evaluate and document all projects and initiatives (warning!!)
• & Systematic follow-up of findings and recommendations
• & Focus on the Research part – publication and dissemination of lessons and findings
EPI – IMMUNISATION - LAOS EXAMPLE: CHECKING DATA QUALITY & DHIS 2 ‘EVENT CAPTURE’ IMPLEMENTTION
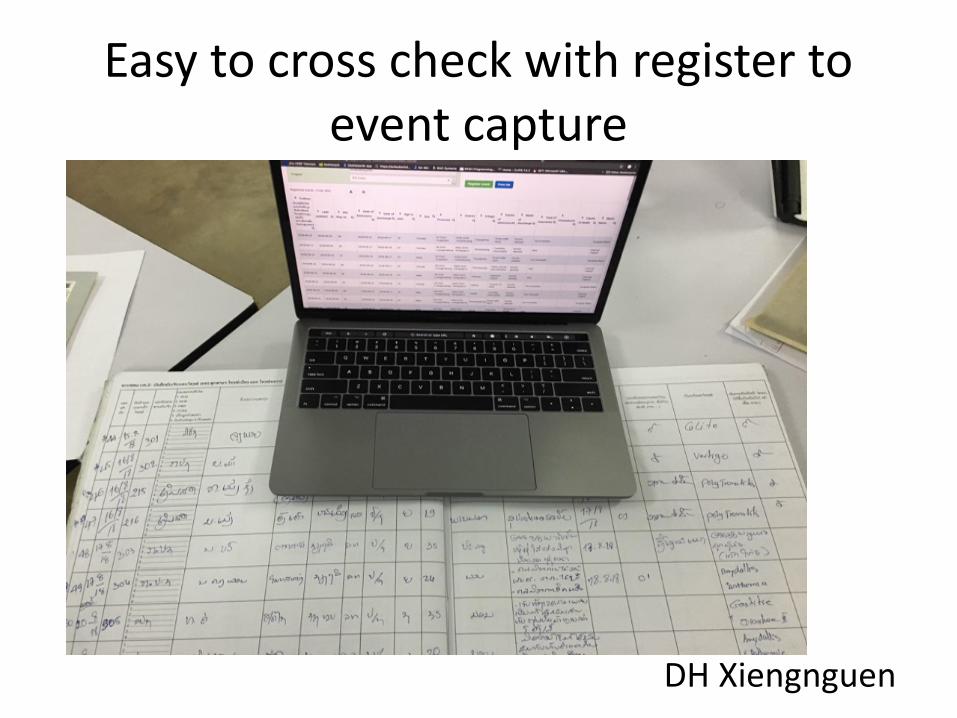
Easy to cross check with register to event capture
DH Xiengnguen
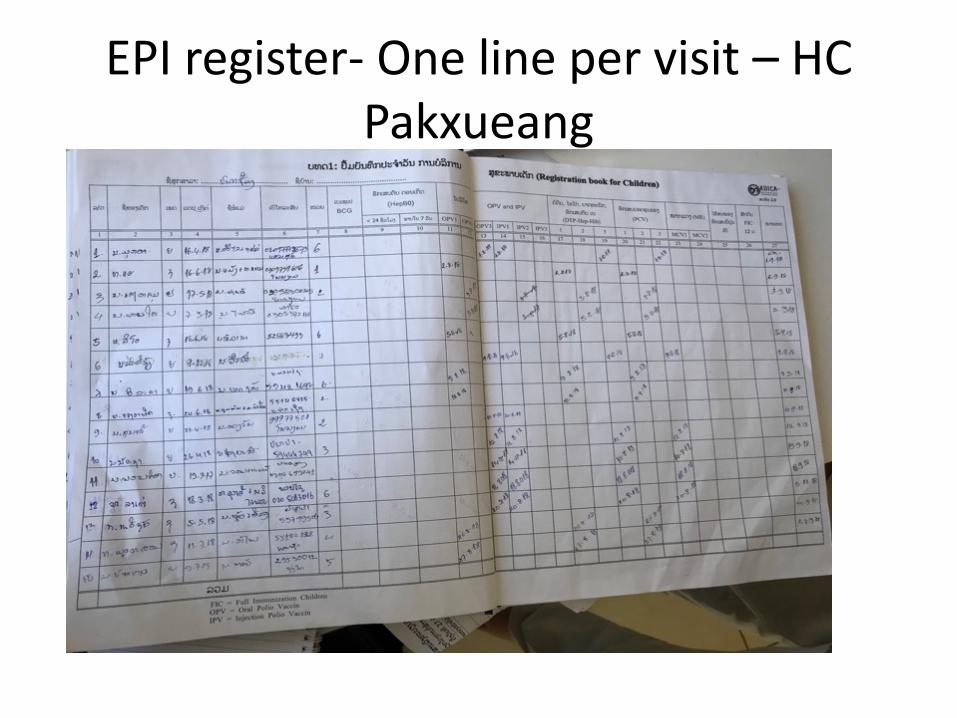
EPI register- One line per visit – HC Pakxueang
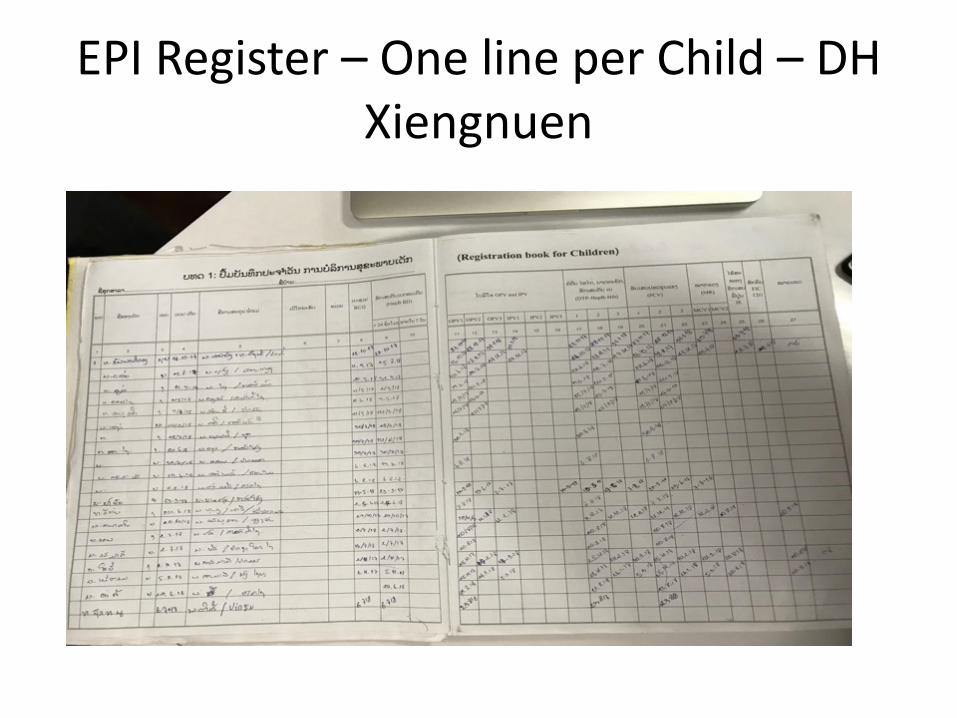
EPI Register – One line per Child – DH Xiengnuen
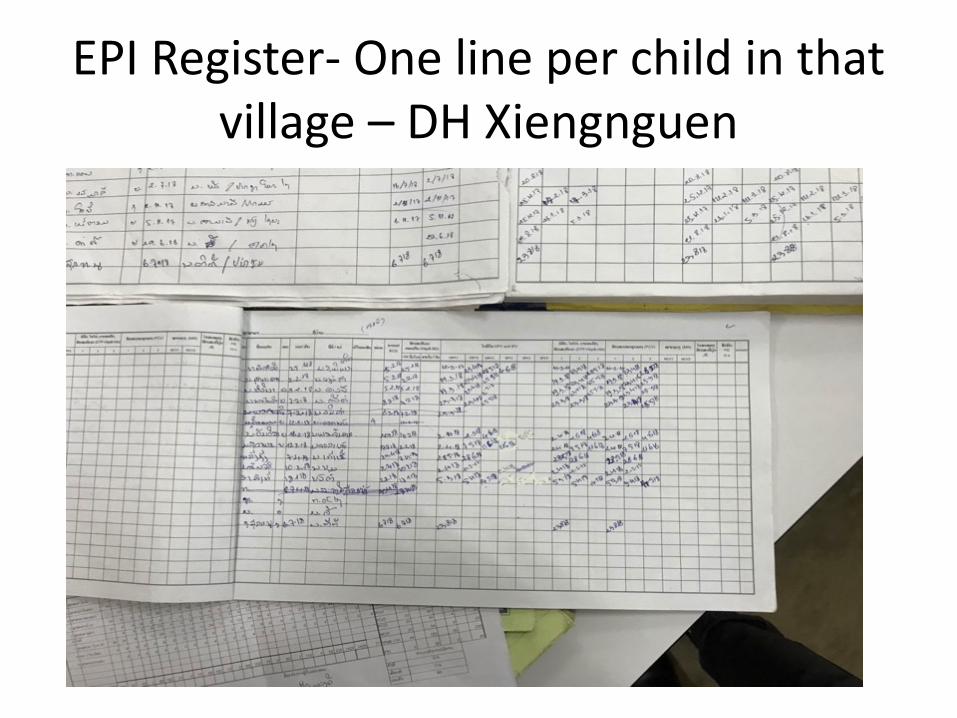
EPI Register- One line per child in that village – DH Xiengnguen
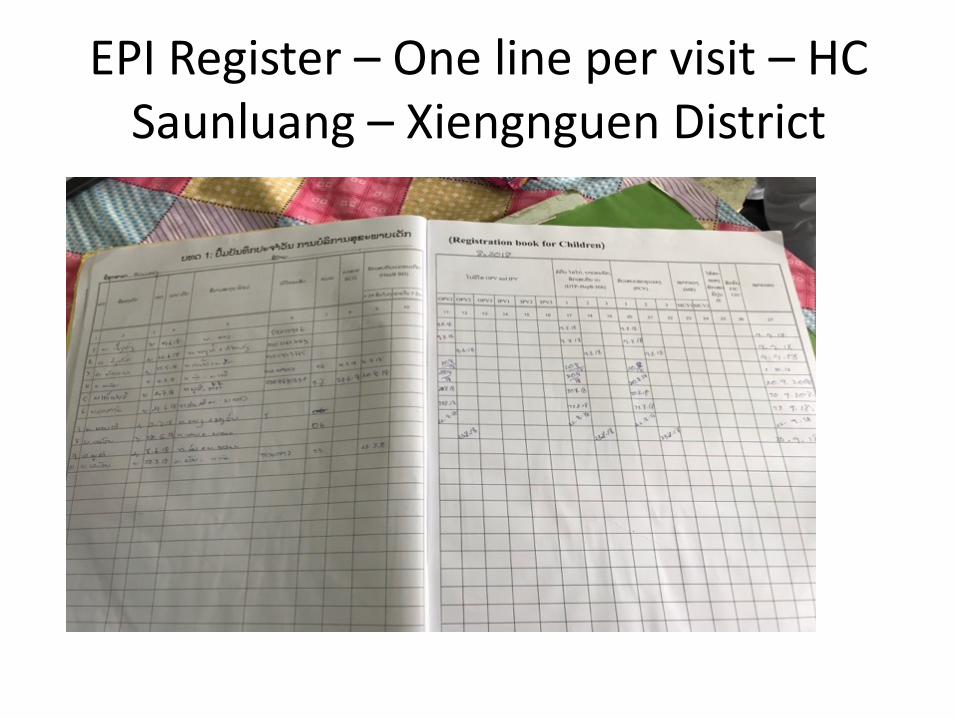
EPI Register – One line per visit – HC Saunluang – Xiengnguen District
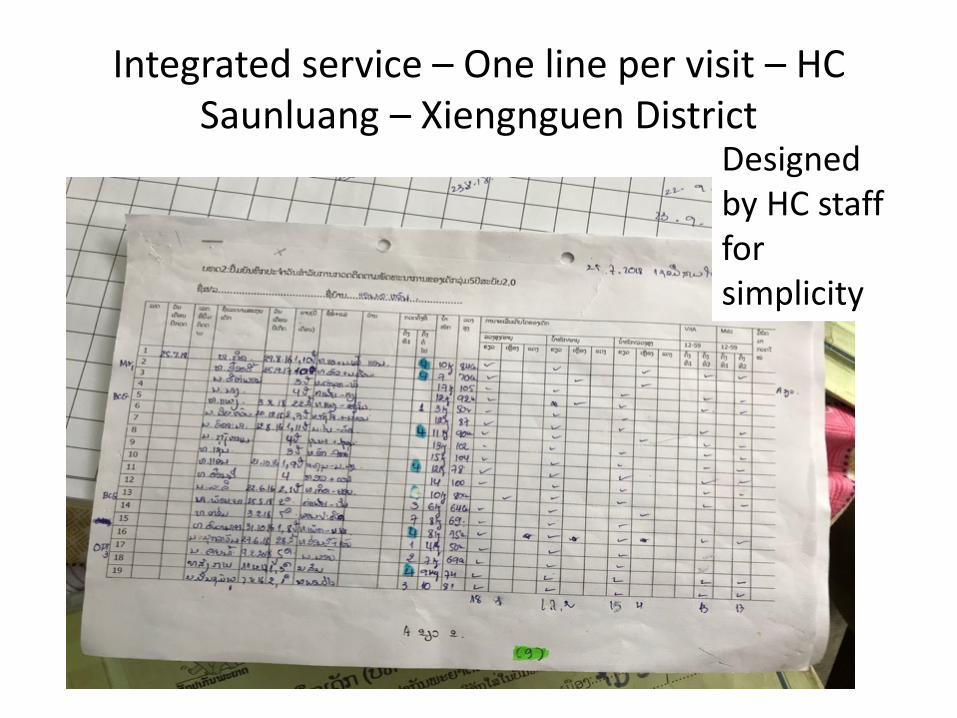
Integrated service – One line per visit – HC Saunluang – Xiengnguen District
Designed by HC staff for simplicity
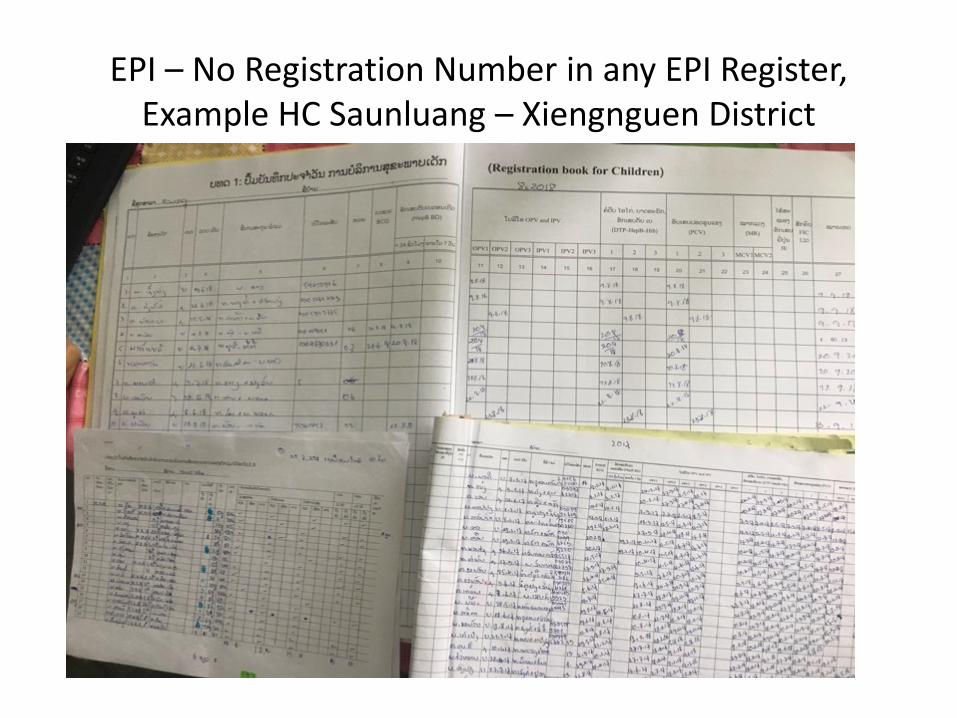
EPI – No Registration Number in any EPI Register, Example HC Saunluang – Xiengnguen District
EPI – All Form for
EPI Child
HC Thapho – Phonexay
District
EPI - Event Capture – Designed by Red Cross
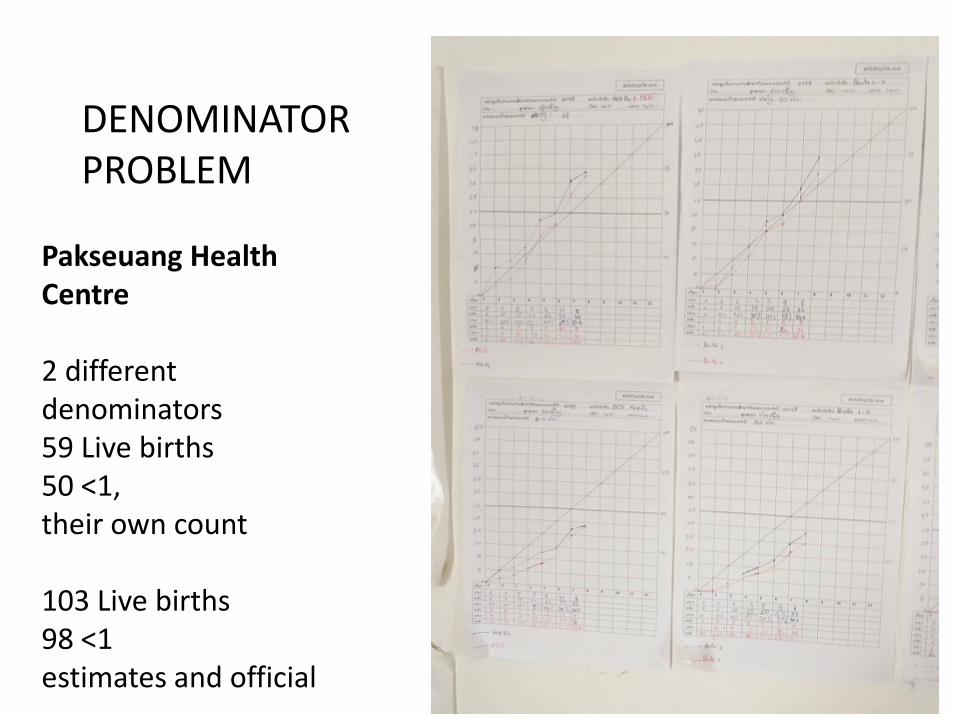
Pakseuang Health Centre 2 different denominators 59 Live births 50 <1, their own count 103 Live births 98 <1 estimates and official
DENOMINATOR PROBLEM
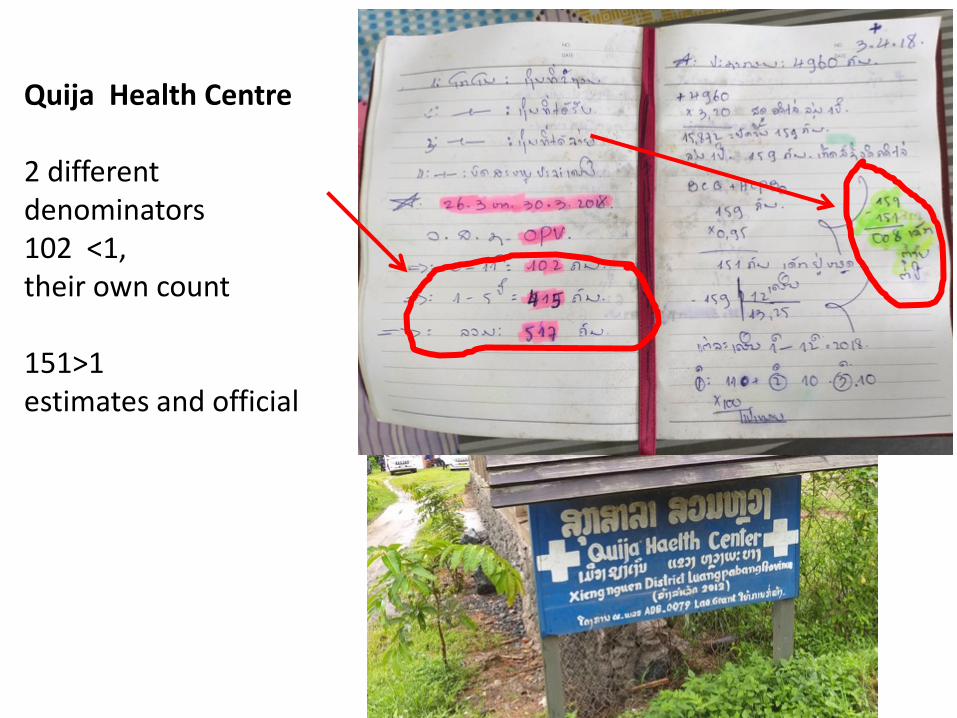
Quija Health Centre 2 different denominators 102 <1, their own count 151>1 estimates and official
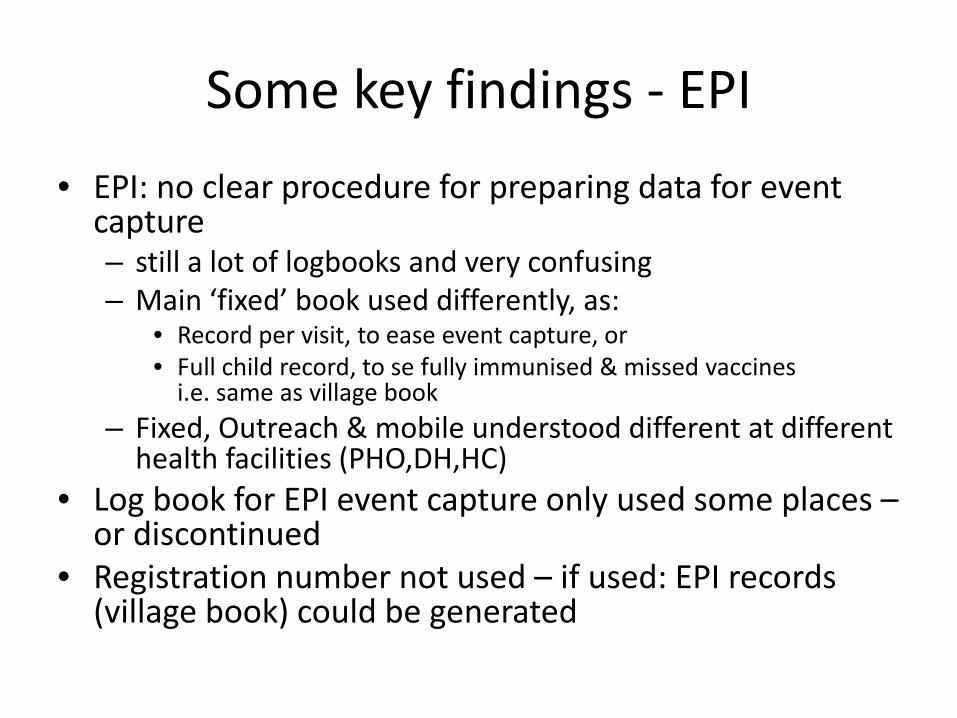
Some key findings - EPI • EPI: no clear procedure for preparing data for event
capture – still a lot of logbooks and very confusing – Main ‘fixed’ book used differently, as:
• Record per visit, to ease event capture, or • Full child record, to se fully immunised & missed vaccines
i.e. same as village book – Fixed, Outreach & mobile understood different at different
health facilities (PHO,DH,HC) • Log book for EPI event capture only used some places –
or discontinued • Registration number not used – if used: EPI records
(village book) could be generated
Recommended