AGRODEP Working Paper 0009
December 2014
Product Standards and Africa’s Agricultural Exports
Olayinka Idowu Kareem
AGRODEP Working Papers contain preliminary material and research results. They have been peer reviewed but have not been subject to a formal external peer review via IFPRI’s Publications Review Committee. They are circulated in order to stimulate discussion and critical comments; any opinions expressed are those of the author(s) and do not necessarily reflect the opinions of AGRODEP.
About the Author
Olayinka Idowu Kareem is a Coordinator at the Trade and Development Policy Research Network in Ibadan, Nigeria
Acknowledgement
I wish to thank IFPRI through the African Growth and Development Policy (AGRODEP) Modeling Consortium for the innovative research grant. Also, I appreciate the constructive comments, suggestions and contributions of Prof. Luca Salvatici. This research has benefitted from the supports of Prof. Antoine Bouet, Betina Dimaranan, Kathryn Pace Kincheloe, and Fousseini Traore.
1
Table of Contents
1. Introduction ...................................................................................................................... 4
2. The Background ............................................................................................................... 6
2.1 Macroeconomic Performance .......................................................................................... 6
2.2 Export Structure and Performance .................................................................................. 9
2.3 An Overview of Product Standards ................................................................................ 22
2.4 EU Standard Requirements: Hurdles to Pass for Selected Products ............................. 25
2.5 EU Import Refusals/Rejections of Foods and Feeds ...................................................... 26
2.5 Reasons for EU Rejections of Foods and Feeds ............................................................ 30
3. Review of the Literature ................................................................................................ 35
3.1 Methodological Review .................................................................................................. 40
3.2 The Data ......................................................................................................................... 42
4. The Empirical Strategy .................................................................................................. 43
5. The Findings .................................................................................................................... 46
6. The Importance of the Findings to CAADP ................................................................. 52
7. Conclusion ....................................................................................................................... 54
References ............................................................................................................................... 57
AGRODEP Working Paper Series ....................................................................................... 62
2
Abstract
The preponderance and stringency of product standards have implications for global trade, especially for developing countries. Despite the importance of this issue to Africa, only a few empirical studies exist in the area. It is on this basis that this study draws its objective, which is to investigate the impact of EU standards on Africa’s exports in relation to the Comprehensive Africa Agricultural Development Programme. A two-step Heckman model is adopted using mostly unexploited standards data from Perinorm. Two high-value commodities were selected, fish and vegetable, as well as a traditional cash crop, coffee, at HS-6 digit level. The findings show that at the extensive margins of export, standards are trade-inhibiting in fish and coffee, while enhancing the export of the vegetable. At the intensive margin, standards are trade-inhibiting in vegetable and coffee exports while trade-enhancing in fish export.
Résumé
La prépondérance et l’exigence des normes de produits ont des implications pour le commerce mondial, en particulier pour les pays en développement. Malgré l'importance de cette question pour l'Afrique, il n y a que peu d'études empiriques dans ce domaine. C’est sur cette base que cette étude que repose l’objectif de cette étude, à savoir étudier l'impact des normes de l'UE sur les exportations de l'Afrique dans le cadre Programme Détaillé de Développement de l'Agriculture Africaine (PDDAA). Une méthode de Heckman à deux étapes est adoptée en utilisant les données de normalisation quasiment inexploitées de Perinorm. Deux produits à forte valeur ont été sélectionnés, le poisson et les légumes ainsi qu'une culture de rente traditionnelle, le café, au niveau HS-6. Les résultats montrent qu’à la marge extensive des exportations, les normes restreignent le commerce du poisson et du café, tout en améliorant l'exportation de légumes. À la marge intensive, les normes freinent le commerce de légumes et les exportations de café tout en améliorant les exportations de poisson.
3
1. Introduction
The developmental aspiration of developing countries, especially African countries, to achieve
sustainable growth and poverty reduction is linked in part to their interaction and integration to the rest
of the world. Integration into global market by the poorer countries offers the opportunity and potential
for rapid growth and reduction in poverty (Martinez and Poole, 2004). It is widely recognised that trade
serves as a veritable channel through which countries can interact or relate economically. Global trade
has been acknowledged by many theorists, especially the orthodox ones, to be beneficial and that
countries could gain from their participation. These theorists based their propositions on the premise
that there will be trade flows among/between participating countries. In reality, however, this is often
not the case, as there are various trade barriers to some key exports, especially those for which
developing countries and Africa in particular have a comparative advantage. As a result of these trade
policies, Africa has found it difficult to take full advantage of the opportunities embedded in global
trade. The gradual and continuous collapse of tariffs in global trade due to the bilateral, regional, and
multilateral trade negotiations and agreements have brought into fore the relevance and the
preponderance of the use of non-tariff measure (NTMs) in regulating international trade (Fugazza,
2013; WTO, 2012). Kareem (2010) finds that the non-tariff barriers constitute the most significant trade
barriers or restrictions that Africa’s exports face in the markets of their trade partners.
To this end, African countries believe that the technical barriers to trade (TBT), standards in particular,
are trade restrictive such that they add to the series of costs faced by their exporters. These types of
NTMs can almost double the trade barriers effects imposed by tariffs for some products (Moise and Le
Bris, 2013). Also, Gourdon and Nicita (2013) present a frequency index which shows that among the
NTMs, the technical measures are often used most. TBTs such as technical regulations and standards
(Sanitary and Phytosanitary measures, or SPS) stand out among other NTMs due to their importance to
human and animal health as well as the protection and safety of the environment. The TBT could also
be used for trade protectionism and/or means of enhancing trade flow.
To mitigate this problem, the African Union (AU) New Partnership for African Development (NEPAD
initiated the Comprehensive Africa Agriculture Development Programme (CAADP) to strengthen and
enhance Africa’s agricultural production through sustainable interventions by African governments in
order to accelerate and promote agricultural production for export. In order to do this, the CAADP has
put in place a policy that ensures that each member countries allocate 10 percent of national budget to
agriculture investment/sector so as to attain 6 percent average annual growth rate of the economy.
This CAADP policy on agricultural investment is yielding dividends: there has been relative increase
in Africa’s agricultural products exports (CAADP Pillar 2 Document). However, the major hindrances
to market access for Africa’s agricultural exports are the trade policies in the continent’s trading
partners’ markets. Specifically, the issue of tariffs and non-tariff barriers is germane to the market access
of Africa’s exports. Out of these trade policies, studies have shown that the magnitude of the impact of
4
tariffs is very minimal due to the fact that most of exports of Africa origin are been granted preferential
tariff rate. The main restriction to Africa’s exports access to developed and developing countries’
markets are the non-tariff barriers, specifically the product standards (Kareem, 2010; Czubala et al.
2009). Most of Africa’s exports do not meet the standards set by these countries for any product coming
to their markets. This is because Africa does not have the technical wherewithal in terms of advanced
technology and sciences to produce products that will meet international product standard requirements.
The imposition of these market access conditions on agricultural exports, especially those that African
countries have comparative advantage in, has hindered the extent to which the sector contribute to
overall income growth in the rural areas and stimulate growth in other sectors of the economy through
the expansion of goods and services demanded from these sectors. Also, it has restricted the degree to
which earnings on agricultural exports could be used to reduce poverty, hunger, and overall malnutrition
levels in the continent. To this end, efforts made by African governments through CAADP to mitigate
these market access barriers are not yielding expected results due to the fact that the already defined
and detailed set of project activities in the programme did not allowed for a decentralised and bottom-
up implementation. Also, its guidelines have not all been adopted yet, while the peer monitoring and
learning among African countries have been minimally utilised. This is because CAADP is sometimes
seen as a parallel to the national policy processes. Furthermore, CAADP procedures for implementation
are still very rudimentary and weak, with inadequate capacities in many ways. As such, CAADP is seen
as being far from fulfilling the expectation that is embedded in it, which is to become the centre of all
"green" policy areas for agriculture-based industrial policy and food security.
It is noteworthy that most studies modelling the actual distortions to trade due to trade barriers have
focused on the impact of tariff barriers on trade flows between developing and developed countries, i.e.
south–north trade, with capital and consumer products flowing in one direction and primary products
in the other (see Mayer and Zignago, 2005). In contrast, there are very few studies that have examined
the effects of non-tariff barriers on trade flows among these trade partners. Additionally, there are scant
specific studies determining the impact of product standards on exports of relative importance to
African countries despite the importance of this issue (Czubala et al. 2009). Moreover, I have not seen
consideration for the impact of the domestically produced commodities that were imported-- that is, the
EU consumption of or demand for their domestically produced products-- in any empirical literature in
this area. This study intends to close these gaps by determining the effects of products standards in the
European Union’s market on Africa’s exports in the light of the CAADP agenda.
This study is motivated by the following research questions: do product standards matter in trade,
especially trade between Africa and the European Union (EU)? Can the CAADP mitigate these
problems, and if so to what extent? From these research questions, this study draws its objective, which
is to investigate the impact of EU standard requirements on Africa’s exports. This study departs from
previous studies (Otsuki et al. 2001; Jun Yang and Findlay, 2008; Xiong and Beghin, 2011), which used
5
only one standard requirement, by considering all the applicable standard requirements for the selected
products. These product safety requirements for the selected exported products are called in this study
‘hurdles to pass’ (HTP) for such products prior to accessing the EU market. While for every product
certain standard requirement might be dominant1 among these requirements, but all the requirements
must be complied with before accessing the market.
In order to investigate the impact of standards on Africa’s exports, I have organised the proceeding
sections of this paper as follows: the second section presents the context within which the study is
situated; section three reviews the literature; the fourth section deals with the empirical strategy adopted;
the research findings are discussed in section five; the importance of the findings to CAADP is
discussed in the sixth section; and the last section presents the conclusions drawn from the study.
2. The Background
This section deals with the context within which the study is situated in terms of evaluation of some
macroeconomic indicators that could have direct or indirect influence on agricultural production for
export. The study also examines trade policies among Africa’s major trade partners, with a view to
ascertain the extent to which these policies have been beneficial or detrimental to the access of the
continent’s access to their markets.
2.1 Macroeconomic Performance
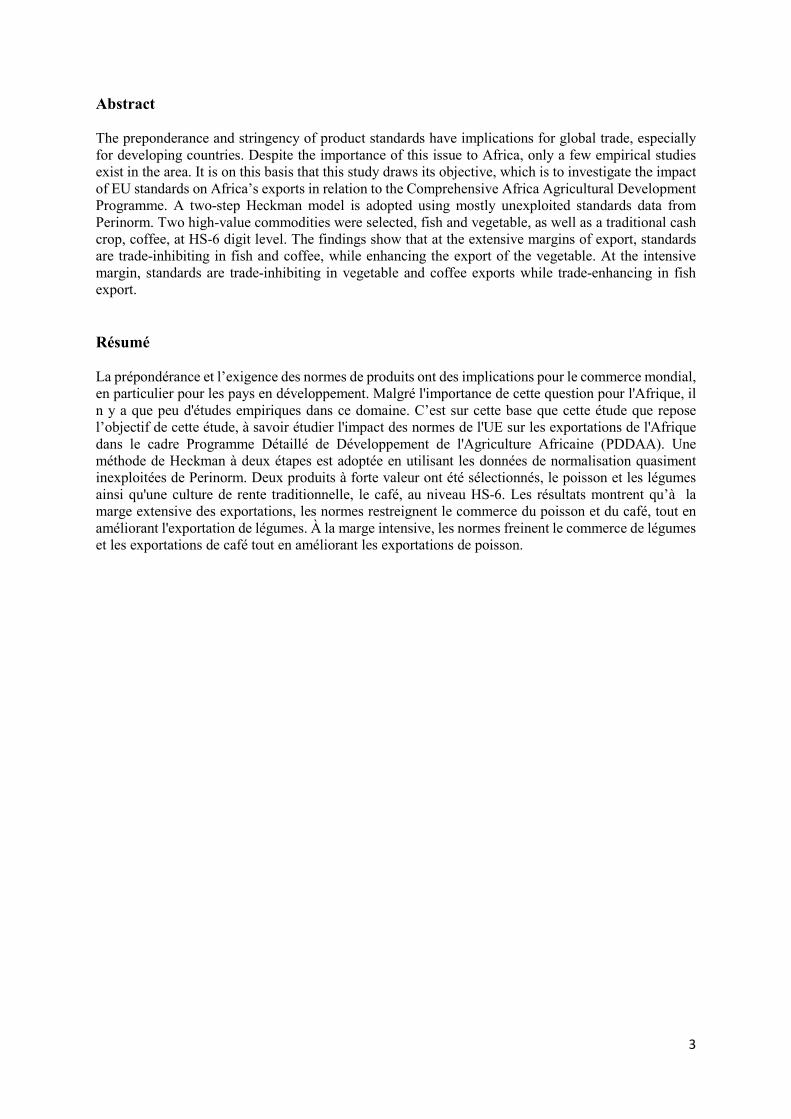
In terms of Africa’s gross domestic products (GDP) growth rate, Chart 1 shows that there has been
oscillation to the point that the continent did not experience a decade of continuous increased growth
rate of the GDP from the 1970s to 2010. In fact, the continent has not recorded continuous positive
GDP growth rate more than ten years. For instance, in 1971 the continent’s GDP grew by about 11
percent and got to its peak in 1974 with about a 31 percent growth rate due to the oil boom during the
period. By 1976, however, the growth rate had reduced to about 10 percent, which later rose to more
than double in 1980 with the growth rate of over 25 percent. The positive double digit growth rate
recorded for Africa’s GDP was due to the boom in the continent’s natural resource exports, especially
that of oil. During the oil boom in the international market, most oil exporting countries in the continent
recorded high increases in their GDPs, particularly Nigeria, Gabon and Libya. This boom was also
complemented by stability in most African countries’ economic and political environments. By 1981,
however, when austerity had set in in most of these countries due to the fall in the international price of
their natural resource exports, the GDP growth rate was negative. For instance, in 1981 the negative
growth rate of the GDP was more than five percent, which later dropped to one percent in 1984 and
rose to about three percent in 1986. These negative GDP growth rates were also due to mismanagement,
misappropriation, and maladministration of public funds by the governments in Africa. This actually
1For instance, aflatoxin in groundnuts, cereal, and other products.
6
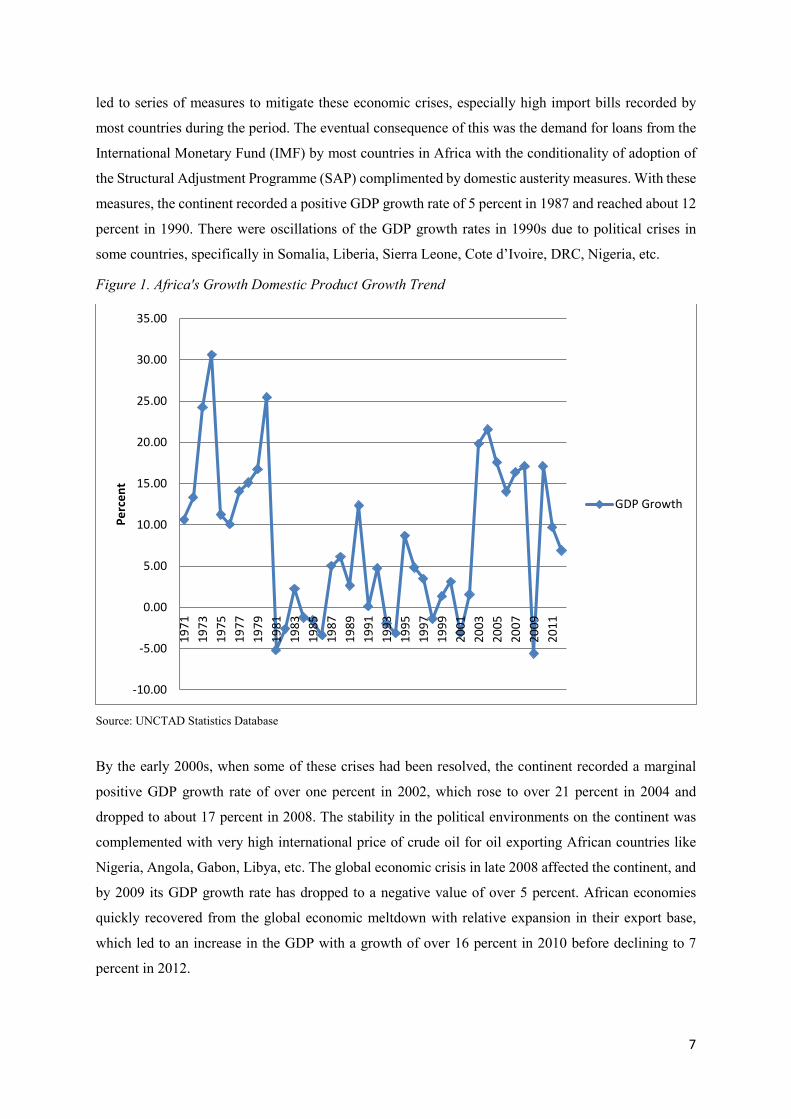
led to series of measures to mitigate these economic crises, especially high import bills recorded by
most countries during the period. The eventual consequence of this was the demand for loans from the
International Monetary Fund (IMF) by most countries in Africa with the conditionality of adoption of
the Structural Adjustment Programme (SAP) complimented by domestic austerity measures. With these
measures, the continent recorded a positive GDP growth rate of 5 percent in 1987 and reached about 12
percent in 1990. There were oscillations of the GDP growth rates in 1990s due to political crises in
some countries, specifically in Somalia, Liberia, Sierra Leone, Cote d’Ivoire, DRC, Nigeria, etc.
Figure 1. Africa's Growth Domestic Product Growth Trend
Source: UNCTAD Statistics Database By the early 2000s, when some of these crises had been resolved, the continent recorded a marginal
positive GDP growth rate of over one percent in 2002, which rose to over 21 percent in 2004 and
dropped to about 17 percent in 2008. The stability in the political environments on the continent was
complemented with very high international price of crude oil for oil exporting African countries like
Nigeria, Angola, Gabon, Libya, etc. The global economic crisis in late 2008 affected the continent, and
by 2009 its GDP growth rate has dropped to a negative value of over 5 percent. African economies
quickly recovered from the global economic meltdown with relative expansion in their export base,
which led to an increase in the GDP with a growth of over 16 percent in 2010 before declining to 7
percent in 2012.
-10.00
-5.00
0.00
5.00
10.00
15.00
20.00
25.00
30.00
35.00
1971
1973
1975
1977
1979
1981
1983
1985
1987
1989
1991
1993
1995
1997
1999
2001
2003
2005
2007
2009
2011
Perc
ent
GDP Growth
7
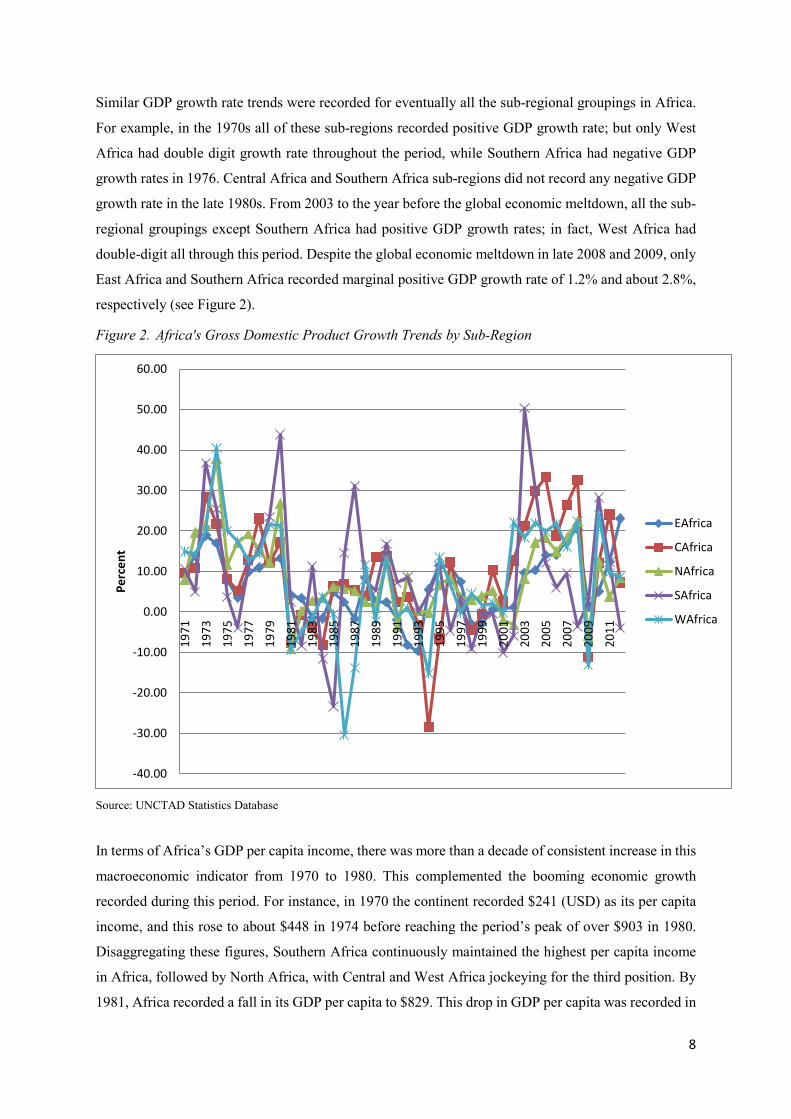
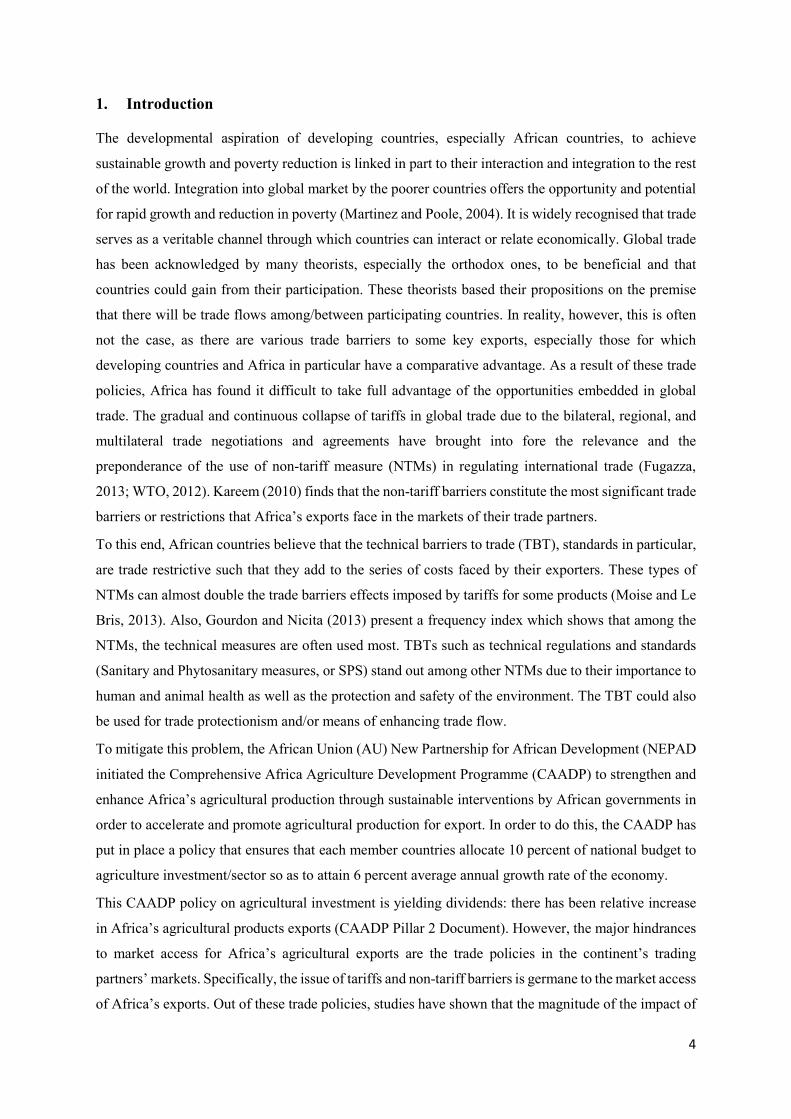
Similar GDP growth rate trends were recorded for eventually all the sub-regional groupings in Africa.
For example, in the 1970s all of these sub-regions recorded positive GDP growth rate; but only West
Africa had double digit growth rate throughout the period, while Southern Africa had negative GDP
growth rates in 1976. Central Africa and Southern Africa sub-regions did not record any negative GDP
growth rate in the late 1980s. From 2003 to the year before the global economic meltdown, all the sub-
regional groupings except Southern Africa had positive GDP growth rates; in fact, West Africa had
double-digit all through this period. Despite the global economic meltdown in late 2008 and 2009, only
East Africa and Southern Africa recorded marginal positive GDP growth rate of 1.2% and about 2.8%,
respectively (see Figure 2).
Figure 2. Africa's Gross Domestic Product Growth Trends by Sub-Region
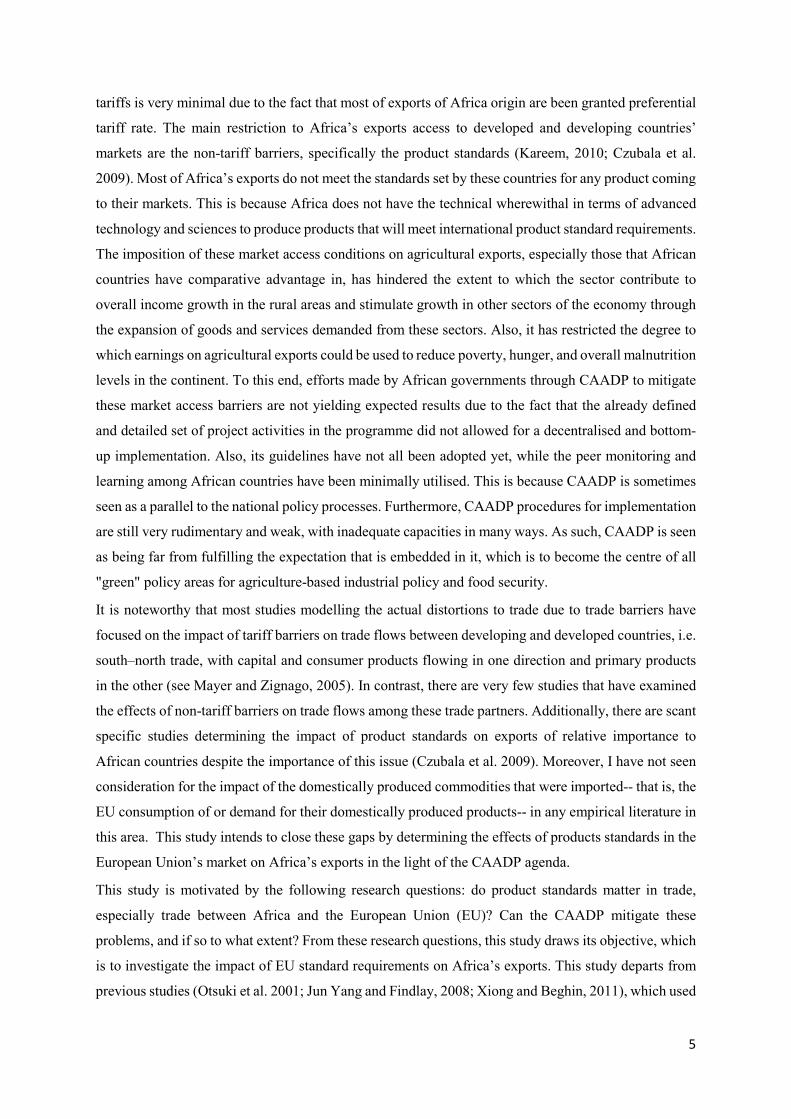
Source: UNCTAD Statistics Database In terms of Africa’s GDP per capita income, there was more than a decade of consistent increase in this
macroeconomic indicator from 1970 to 1980. This complemented the booming economic growth
recorded during this period. For instance, in 1970 the continent recorded $241 (USD) as its per capita
income, and this rose to about $448 in 1974 before reaching the period’s peak of over $903 in 1980.
Disaggregating these figures, Southern Africa continuously maintained the highest per capita income
in Africa, followed by North Africa, with Central and West Africa jockeying for the third position. By
1981, Africa recorded a fall in its GDP per capita to $829. This drop in GDP per capita was recorded in
-40.00
-30.00
-20.00
-10.00
0.00
10.00
20.00
30.00
40.00
50.00
60.00
1971
1973
1975
1977
1979
1981
1983
1985
1987
1989
1991
1993
1995
1997
1999
2001
2003
2005
2007
2009
2011
Perc
ent
EAfrica
CAfrica
NAfrica
SAfrica
WAfrica
8
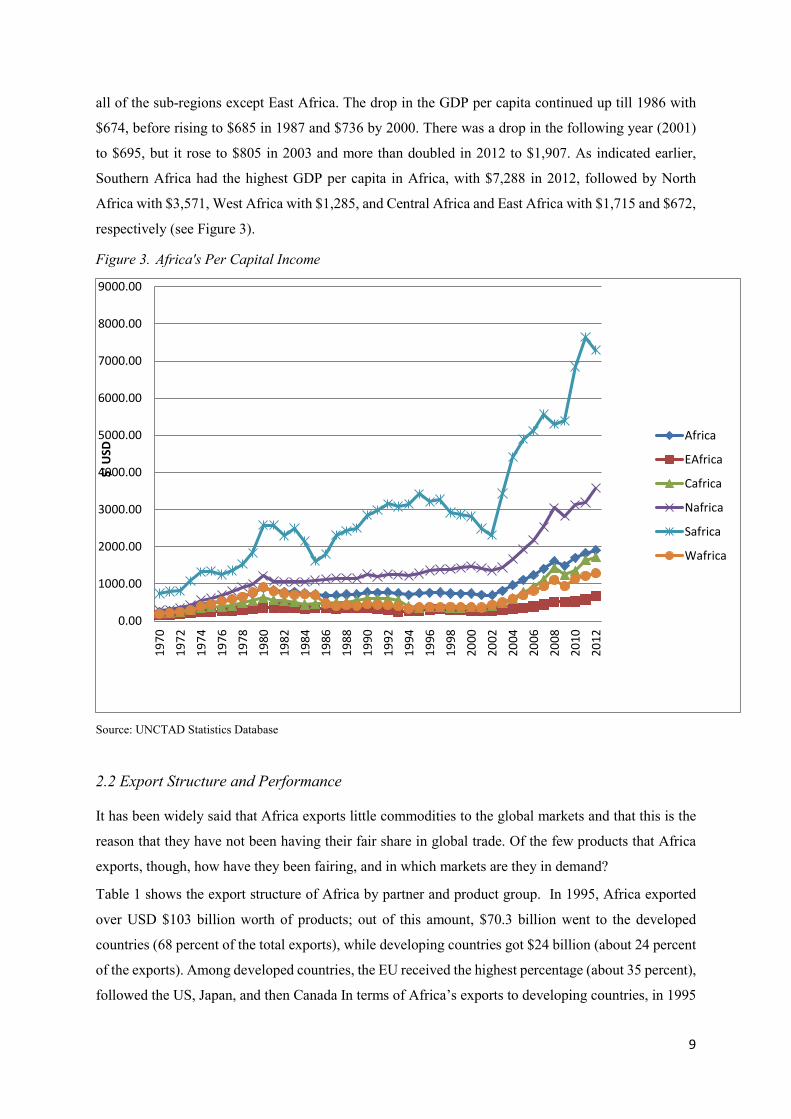
all of the sub-regions except East Africa. The drop in the GDP per capita continued up till 1986 with
$674, before rising to $685 in 1987 and $736 by 2000. There was a drop in the following year (2001)
to $695, but it rose to $805 in 2003 and more than doubled in 2012 to $1,907. As indicated earlier,
Southern Africa had the highest GDP per capita in Africa, with $7,288 in 2012, followed by North
Africa with $3,571, West Africa with $1,285, and Central Africa and East Africa with $1,715 and $672,
respectively (see Figure 3).
Figure 3. Africa's Per Capital Income
Source: UNCTAD Statistics Database
2.2 Export Structure and Performance
It has been widely said that Africa exports little commodities to the global markets and that this is the
reason that they have not been having their fair share in global trade. Of the few products that Africa
exports, though, how have they been fairing, and in which markets are they in demand?
Table 1 shows the export structure of Africa by partner and product group. In 1995, Africa exported
over USD $103 billion worth of products; out of this amount, $70.3 billion went to the developed
countries (68 percent of the total exports), while developing countries got $24 billion (about 24 percent
of the exports). Among developed countries, the EU received the highest percentage (about 35 percent),
followed the US, Japan, and then Canada In terms of Africa’s exports to developing countries, in 1995
0.00
1000.00
2000.00
3000.00
4000.00
5000.00
6000.00
7000.00
8000.00
9000.00
1970
1972
1974
1976
1978
1980
1982
1984
1986
1988
1990
1992
1994
1996
1998
2000
2002
2004
2006
2008
2010
2012
$' U
SD
Africa
EAfrica
Cafrica
Nafrica
Safrica
Wafrica
9
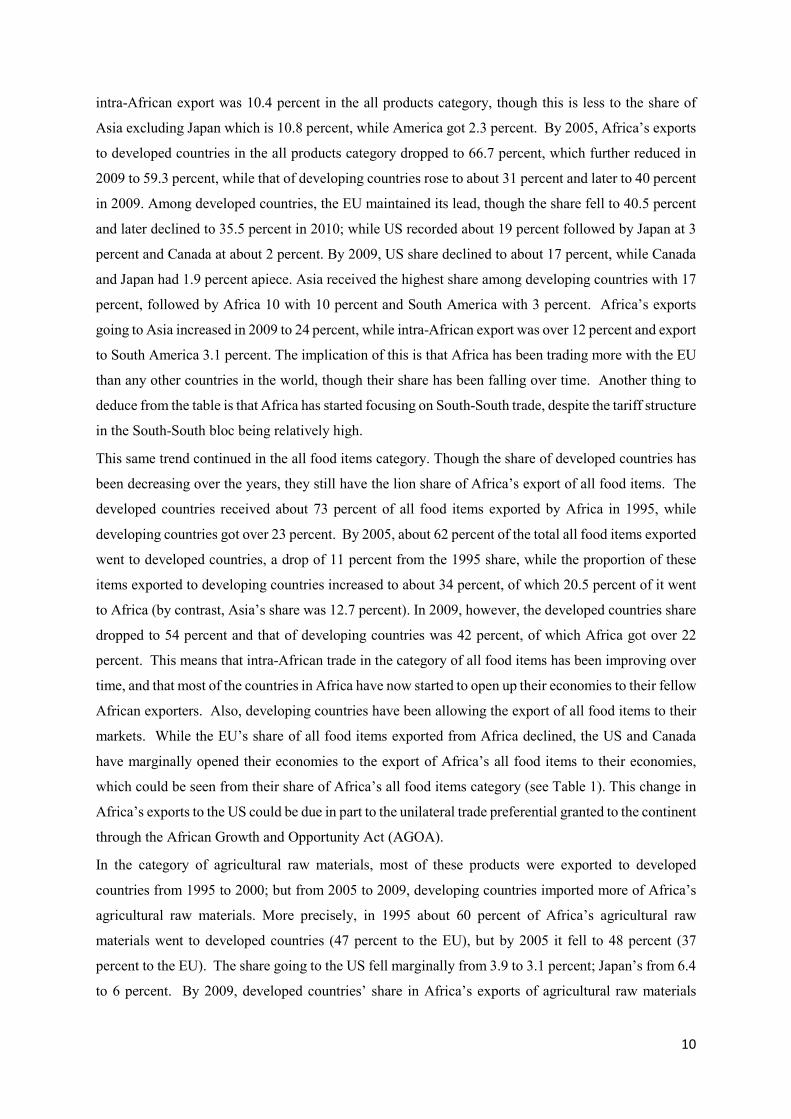
intra-African export was 10.4 percent in the all products category, though this is less to the share of
Asia excluding Japan which is 10.8 percent, while America got 2.3 percent. By 2005, Africa’s exports
to developed countries in the all products category dropped to 66.7 percent, which further reduced in
2009 to 59.3 percent, while that of developing countries rose to about 31 percent and later to 40 percent
in 2009. Among developed countries, the EU maintained its lead, though the share fell to 40.5 percent
and later declined to 35.5 percent in 2010; while US recorded about 19 percent followed by Japan at 3
percent and Canada at about 2 percent. By 2009, US share declined to about 17 percent, while Canada
and Japan had 1.9 percent apiece. Asia received the highest share among developing countries with 17
percent, followed by Africa 10 with 10 percent and South America with 3 percent. Africa’s exports
going to Asia increased in 2009 to 24 percent, while intra-African export was over 12 percent and export
to South America 3.1 percent. The implication of this is that Africa has been trading more with the EU
than any other countries in the world, though their share has been falling over time. Another thing to
deduce from the table is that Africa has started focusing on South-South trade, despite the tariff structure
in the South-South bloc being relatively high.
This same trend continued in the all food items category. Though the share of developed countries has
been decreasing over the years, they still have the lion share of Africa’s export of all food items. The
developed countries received about 73 percent of all food items exported by Africa in 1995, while
developing countries got over 23 percent. By 2005, about 62 percent of the total all food items exported
went to developed countries, a drop of 11 percent from the 1995 share, while the proportion of these
items exported to developing countries increased to about 34 percent, of which 20.5 percent of it went
to Africa (by contrast, Asia’s share was 12.7 percent). In 2009, however, the developed countries share
dropped to 54 percent and that of developing countries was 42 percent, of which Africa got over 22
percent. This means that intra-African trade in the category of all food items has been improving over
time, and that most of the countries in Africa have now started to open up their economies to their fellow
African exporters. Also, developing countries have been allowing the export of all food items to their
markets. While the EU’s share of all food items exported from Africa declined, the US and Canada
have marginally opened their economies to the export of Africa’s all food items to their economies,
which could be seen from their share of Africa’s all food items category (see Table 1). This change in
Africa’s exports to the US could be due in part to the unilateral trade preferential granted to the continent
through the African Growth and Opportunity Act (AGOA).
In the category of agricultural raw materials, most of these products were exported to developed
countries from 1995 to 2000; but from 2005 to 2009, developing countries imported more of Africa’s
agricultural raw materials. More precisely, in 1995 about 60 percent of Africa’s agricultural raw
materials went to developed countries (47 percent to the EU), but by 2005 it fell to 48 percent (37
percent to the EU). The share going to the US fell marginally from 3.9 to 3.1 percent; Japan’s from 6.4
to 6 percent. By 2009, developed countries’ share in Africa’s exports of agricultural raw materials
10
declined to 46 percent, with 38 percent going to the EU, while developing countries recorded an increase
in their import of African agricultural raw materials. It rose to 50 percent in 2005 from 39 percent in
1995, and later increased to over 53 percent. Out of this, Asia the largest share with a rise from about
25 percent in 1995 to 35 percent in 2005 and later 41 percent in 2009, while Africa rose from 13 percent
in 1995 to 14 percent in 2005 before declining to about 10 percent in 2009. The implication of this is
that Japan opened her markets to Africa’s agricultural raw materials more than the US and Canada,
while Asia has been liberalizing her markets to Africa’s agricultural raw materials.
The share of developed countries in the ores and metals category has been increasing over the years.
This might be due to the importance of ores and metals to their industrial sectors and the development
of their various economies. Developed countries imported about 66 percent of Africa’s ores and metal
exports in 1995, and by 2005 it that figure rose to about 68 percent before dropping to 55 percent in
2009; of this the EU received 41.5 percent in 1995 and then 29 percent and 22 percent in 2005 and
2009, respectively. The US share rose from 7.7 percent in 1995 to about 13 percent in 2005, before
declining to 6 percent in 2009, while Japan’s share ranged from 10.6 percent to about 15 percent and
then 7 percent, respectively. The developing countries’ share in 1995 was 32.5 percent, with Asia
receiving 23.5 percent while Africa received 7.7 percent. By 2005, however, the developing countries’
share dropped to about 26 percent, of which Asia got about 18 percent while Africa got 7 percent. In
2009, the share of developing countries rose to 44 percent, with Africa receiving 10 percent of this
category of export. The implication of this is that developing countries were restricting the imports of
ores and metals to their economies until recent years, while developed countries such as the US and
Japan have relatively opened up their borders to Africa’s exports of this category of products.
11
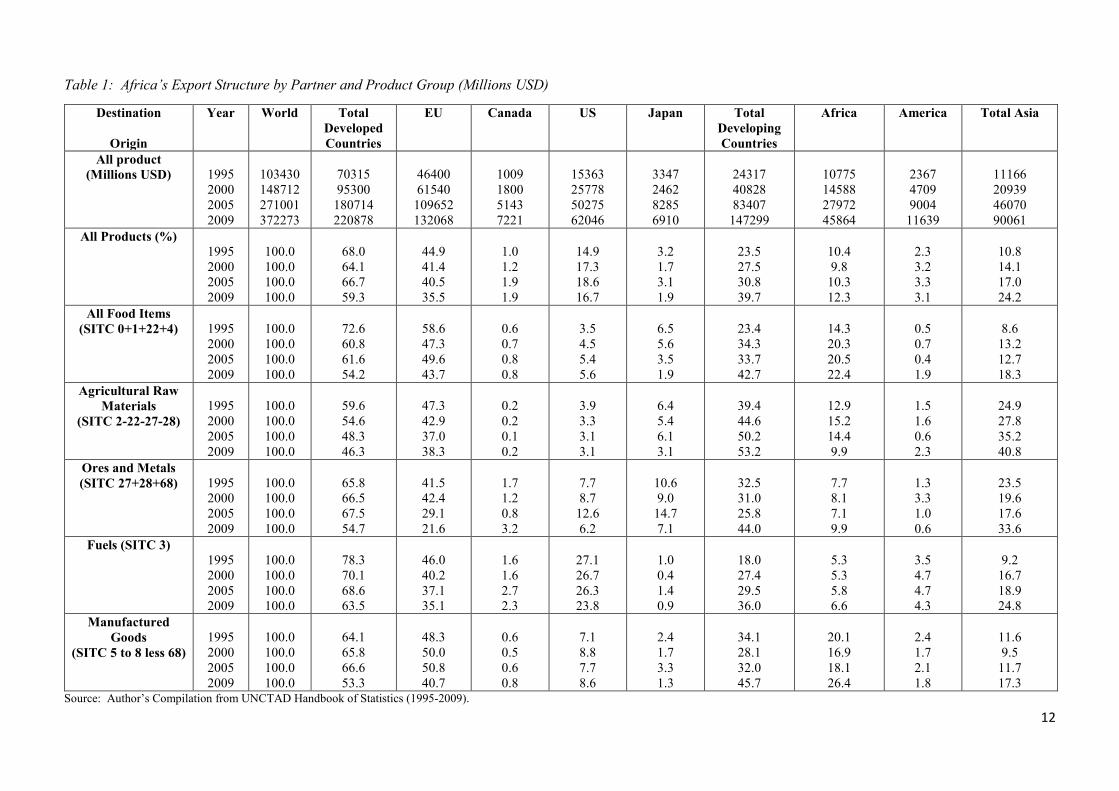
Table 1: Africa’s Export Structure by Partner and Product Group (Millions USD)
Destination
Origin
Year World Total Developed Countries
EU Canada US Japan Total Developing Countries
Africa America Total Asia
All product (Millions USD)
1995 2000 2005 2009
103430 148712 271001 372273
70315 95300
180714 220878
46400 61540
109652 132068
1009 1800 5143 7221
15363 25778 50275 62046
3347 2462 8285 6910
24317 40828 83407
147299
10775 14588 27972 45864
2367 4709 9004
11639
11166 20939 46070 90061
All Products (%) 1995 2000 2005 2009
100.0 100.0 100.0 100.0
68.0 64.1 66.7 59.3
44.9 41.4 40.5 35.5
1.0 1.2 1.9 1.9
14.9 17.3 18.6 16.7
3.2 1.7 3.1 1.9
23.5 27.5 30.8 39.7
10.4 9.8
10.3 12.3
2.3 3.2 3.3 3.1
10.8 14.1 17.0 24.2
All Food Items (SITC 0+1+22+4)
1995 2000 2005 2009
100.0 100.0 100.0 100.0
72.6 60.8 61.6 54.2
58.6 47.3 49.6 43.7
0.6 0.7 0.8 0.8
3.5 4.5 5.4 5.6
6.5 5.6 3.5 1.9
23.4 34.3 33.7 42.7
14.3 20.3 20.5 22.4
0.5 0.7 0.4 1.9
8.6
13.2 12.7 18.3
Agricultural Raw Materials
(SITC 2-22-27-28)
1995 2000 2005 2009
100.0 100.0 100.0 100.0
59.6 54.6 48.3 46.3
47.3 42.9 37.0 38.3
0.2 0.2 0.1 0.2
3.9 3.3 3.1 3.1
6.4 5.4 6.1 3.1
39.4 44.6 50.2 53.2
12.9 15.2 14.4 9.9
1.5 1.6 0.6 2.3
24.9 27.8 35.2 40.8
Ores and Metals (SITC 27+28+68)
1995 2000 2005 2009
100.0 100.0 100.0 100.0
65.8 66.5 67.5 54.7
41.5 42.4 29.1 21.6
1.7 1.2 0.8 3.2
7.7 8.7
12.6 6.2
10.6 9.0
14.7 7.1
32.5 31.0 25.8 44.0
7.7 8.1 7.1 9.9
1.3 3.3 1.0 0.6
23.5 19.6 17.6 33.6
Fuels (SITC 3) 1995 2000 2005 2009
100.0 100.0 100.0 100.0
78.3 70.1 68.6 63.5
46.0 40.2 37.1 35.1
1.6 1.6 2.7 2.3
27.1 26.7 26.3 23.8
1.0 0.4 1.4 0.9
18.0 27.4 29.5 36.0
5.3 5.3 5.8 6.6
3.5 4.7 4.7 4.3
9.2
16.7 18.9 24.8
Manufactured Goods
(SITC 5 to 8 less 68)
1995 2000 2005 2009
100.0 100.0 100.0 100.0
64.1 65.8 66.6 53.3
48.3 50.0 50.8 40.7
0.6 0.5 0.6 0.8
7.1 8.8 7.7 8.6
2.4 1.7 3.3 1.3
34.1 28.1 32.0 45.7
20.1 16.9 18.1 26.4
2.4 1.7 2.1 1.8
11.6 9.5
11.7 17.3
Source: Author’s Compilation from UNCTAD Handbook of Statistics (1995-2009).
12
In the category of fuels (SITC3), developing countries have reduced the trade restrictions that will not
allow the access of these products to their markets, improving levels of importation in Asia in particular.
For instance, out of the 18 percent share of developing countries in 1995, Asia took more 9 percent,
while by 2005 they got more than half of the share of developing countries for the year. The same trend
was recorded in 2009 for developing countries. The share of the developed countries decreased from
78 percent in 1995 to about 69 percent in 2005, and further decreased to 64 percent in 2009. The EU
accounted for the largest share out of developed countries with 46 percent in 1995, 37 percent in 2005
and 35 percent in 2009, while the US recorded 27, 26, and 24 percent in each of those years,
respectively.
Africa’s exports of manufactured goods were allowed access to the developed countries due to the low
level of tariffs imposed in manufactured goods by the developed countries. Developed countries shares
rose from 64 percent in 1995 to about 67 percent in 2005 before declining to about 53 percent in 2009.
The EU recorded the highest share with 48, 51, and 41 percent in 1995, 2005, and 2009, respectively.
The shares of US also increased, from 7 to 8 to 9 percent in the period under review, while Japan
experienced a rise and fall from 2 to 3 to 1 percent, respectively. Surprisingly, African countries have
been closing their borders to manufactured goods emanating from the continent: the share of African
imports of African-produced manufactured good reduced from 20 percent in 1995 to 18 percent in 2005.
By 2009, however, it increased to over 26 percent due to regional integration arrangements within the
continent. Ultimately, though, Asian countries have allowed Africa’s manufactured goods more access
to their market than African countries themselves.
2.2.1 Agricultural Sector’s Performance The agricultural sector has been and will always be an important sector to many African economies.
This is because the sector has been the major employer of labour and earner of foreign exchange to
many of the countries. Prior to the past three decades, most African economies were agrarian to the
point that most of the foreign exchange earnings in most countries in Africa were from the sector. The
discovery of natural resources in commercial quantities in many of the countries, however, led to neglect
of the sector and dwindling performance.
13
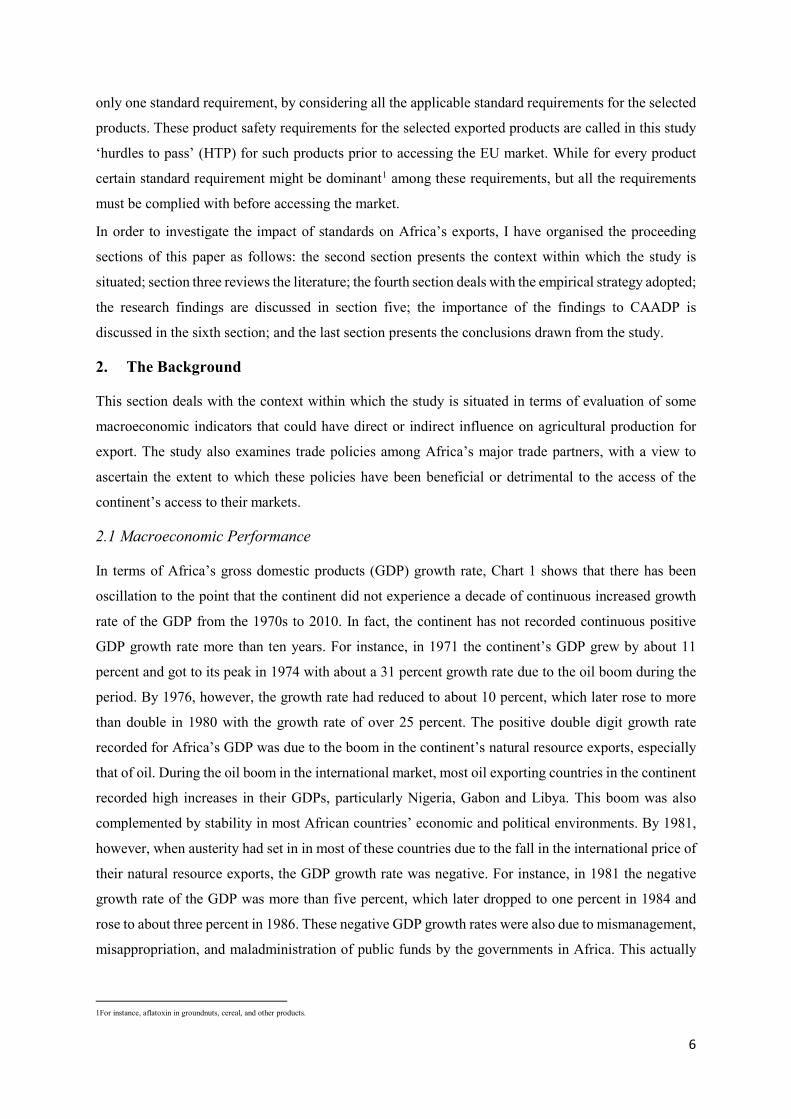
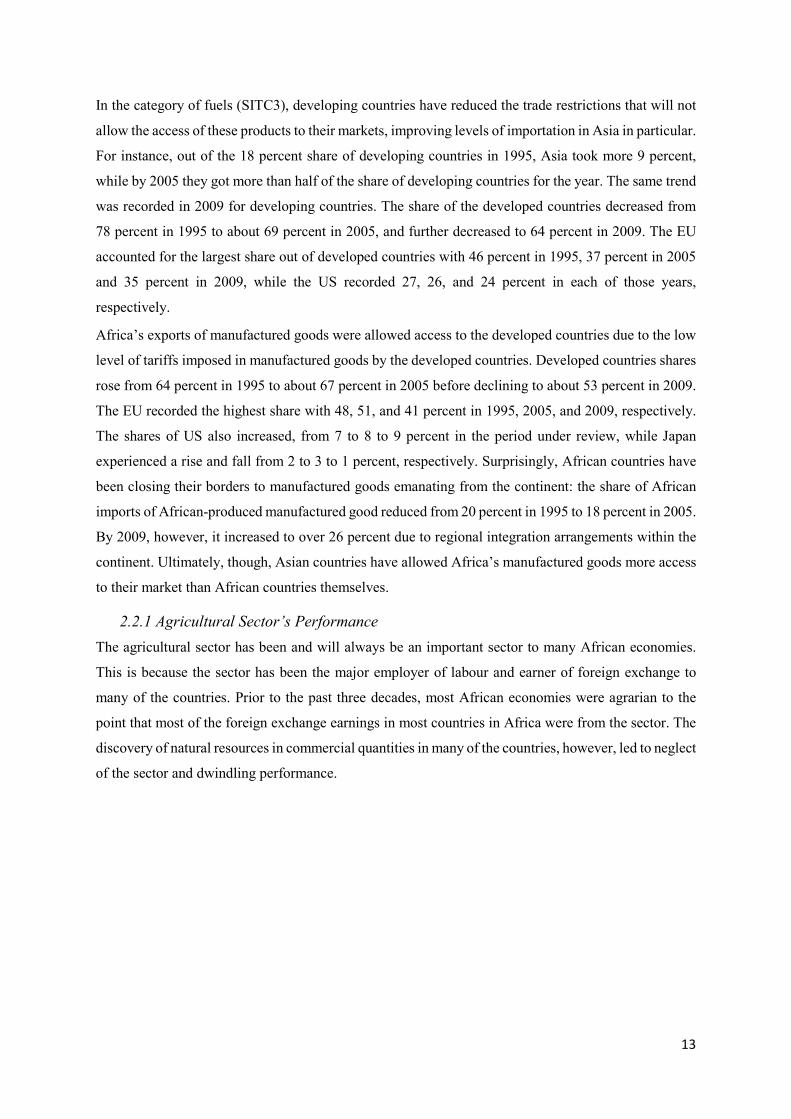
Figure 4. Trends in Africa's Agricultural Exports
Source: FAO Statistics Database This could be seen in terms of the sector’s exports and contributions to the GDP in Africa. Figure 4
shows that in 1991, Africa exported $100.9 billion USD worth of agricultural products to the world and
this later reduced to $93 billion in 1994. This reduction was a result of inadequate supports and
infrastructure that would encourage agriculture production for export. By 2000, Africa’s agricultural
exports rose to $154.9 billion and further increased to $307.9 billion in 2005. These increases were due
to efforts by various African governments to encourage and promote agriculture production for export,
especially in their quest for diversification of their economies and expansion of export base. This
yielded further positive developments as the value of exports increased to $558 billion in 2008;
however, due to the global economic meltdown’s effect on the demand for Africa’s agricultural exports,
the total amount of agricultural exports declined to about $390 billion in 2009. Disaggregating Africa’s
exports by sub-regional groupings, North Africa had the highest agricultural exports all through the
period under consideration, followed by Southern Africa (except for the period of 2007 to 2009, when
West Africa recorded more agricultural exports).
Examining the contribution of agriculture to the GDP in Africa, it could be said that this contribution
has not been encouraging in spite of the importance of agriculture to African economies. For instance,
in 1991 its contribution to GDP was about 23 percent, and by 1995 it has declined to 11 percent (a
reduction of over 50 percent). This actually complemented the reduction in the agricultural exports
experienced in the same period. However, the little encouragement the agricultural sector got from
0.00
100000.00
200000.00
300000.00
400000.00
500000.00
600000.00(Millions USD)
Africa
EAfrica
CAfrica
NAfrica
SAfrica
WAfrica
14
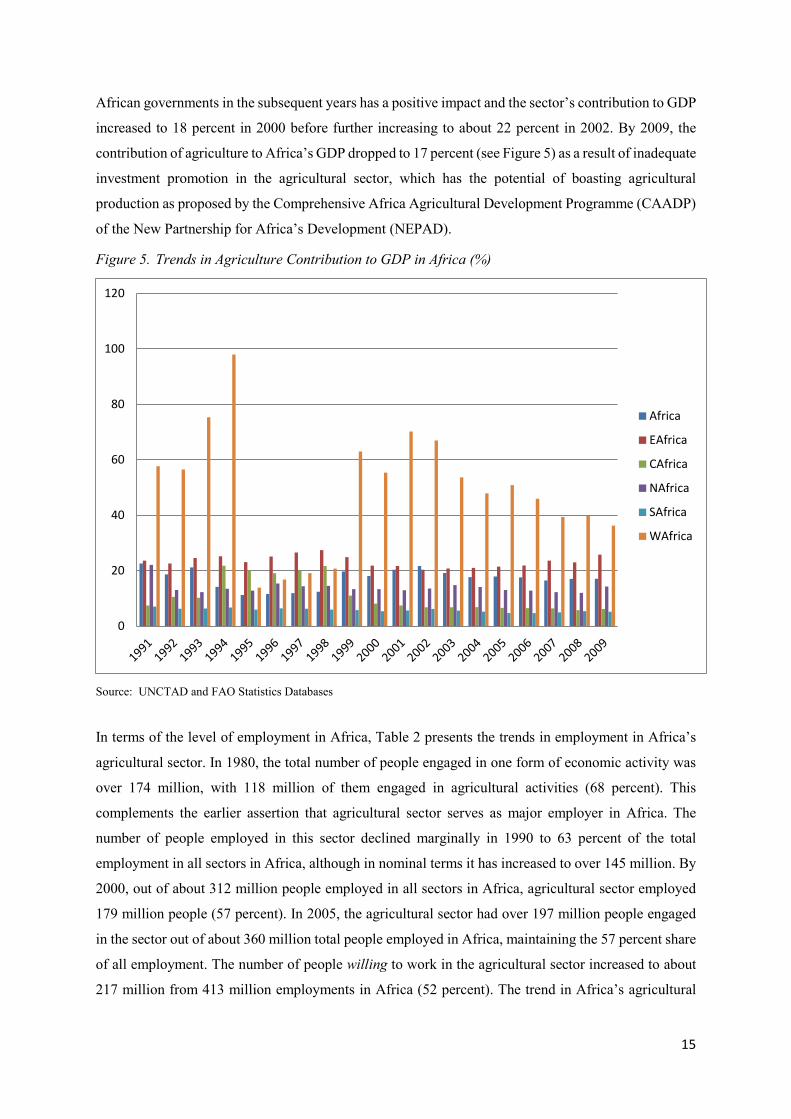
African governments in the subsequent years has a positive impact and the sector’s contribution to GDP
increased to 18 percent in 2000 before further increasing to about 22 percent in 2002. By 2009, the
contribution of agriculture to Africa’s GDP dropped to 17 percent (see Figure 5) as a result of inadequate
investment promotion in the agricultural sector, which has the potential of boasting agricultural
production as proposed by the Comprehensive Africa Agricultural Development Programme (CAADP)
of the New Partnership for Africa’s Development (NEPAD).
Figure 5. Trends in Agriculture Contribution to GDP in Africa (%)
Source: UNCTAD and FAO Statistics Databases In terms of the level of employment in Africa, Table 2 presents the trends in employment in Africa’s
agricultural sector. In 1980, the total number of people engaged in one form of economic activity was
over 174 million, with 118 million of them engaged in agricultural activities (68 percent). This
complements the earlier assertion that agricultural sector serves as major employer in Africa. The
number of people employed in this sector declined marginally in 1990 to 63 percent of the total
employment in all sectors in Africa, although in nominal terms it has increased to over 145 million. By
2000, out of about 312 million people employed in all sectors in Africa, agricultural sector employed
179 million people (57 percent). In 2005, the agricultural sector had over 197 million people engaged
in the sector out of about 360 million total people employed in Africa, maintaining the 57 percent share
of all employment. The number of people willing to work in the agricultural sector increased to about
217 million from 413 million employments in Africa (52 percent). The trend in Africa’s agricultural
0
20
40
60
80
100
120
Africa
EAfrica
CAfrica
NAfrica
SAfrica
WAfrica
15
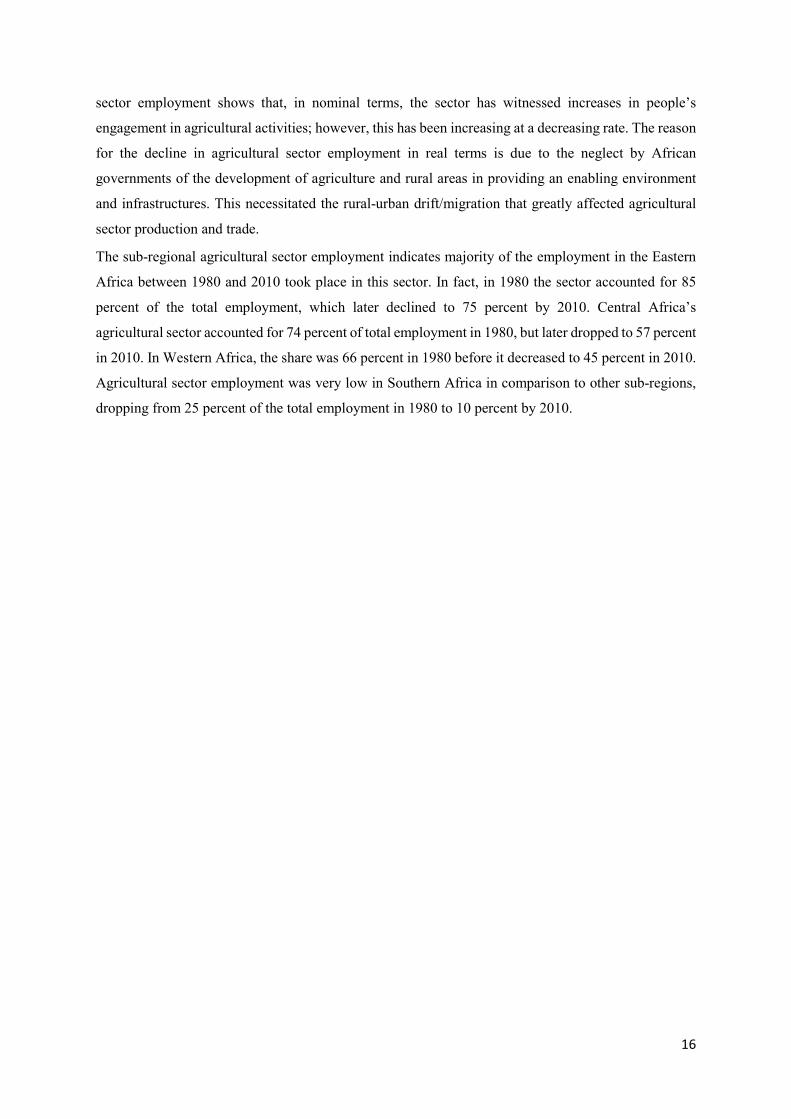
sector employment shows that, in nominal terms, the sector has witnessed increases in people’s
engagement in agricultural activities; however, this has been increasing at a decreasing rate. The reason
for the decline in agricultural sector employment in real terms is due to the neglect by African
governments of the development of agriculture and rural areas in providing an enabling environment
and infrastructures. This necessitated the rural-urban drift/migration that greatly affected agricultural
sector production and trade.
The sub-regional agricultural sector employment indicates majority of the employment in the Eastern
Africa between 1980 and 2010 took place in this sector. In fact, in 1980 the sector accounted for 85
percent of the total employment, which later declined to 75 percent by 2010. Central Africa’s
agricultural sector accounted for 74 percent of total employment in 1980, but later dropped to 57 percent
in 2010. In Western Africa, the share was 66 percent in 1980 before it decreased to 45 percent in 2010.
Agricultural sector employment was very low in Southern Africa in comparison to other sub-regions,
dropping from 25 percent of the total employment in 1980 to 10 percent by 2010.
16
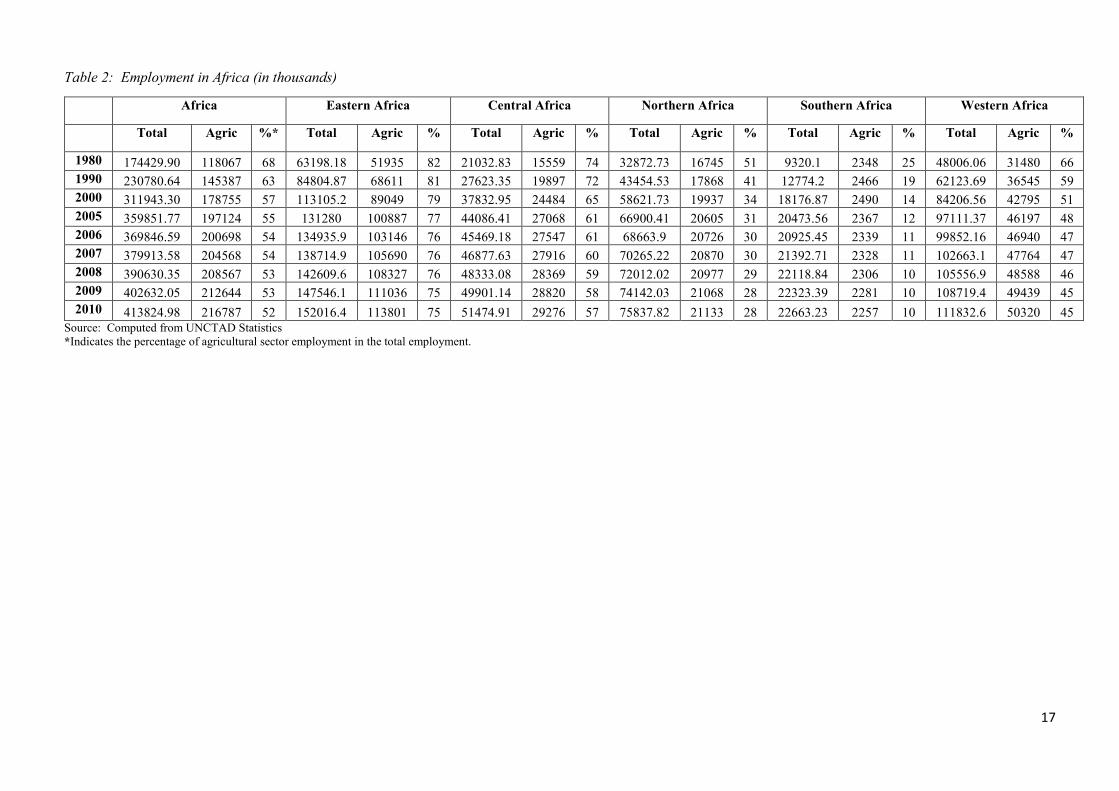
Table 2: Employment in Africa (in thousands)
Africa Eastern Africa Central Africa Northern Africa Southern Africa Western Africa
Total Agric %* Total Agric % Total Agric % Total Agric % Total Agric % Total Agric %
1980 174429.90 118067 68 63198.18 51935 82 21032.83 15559 74 32872.73 16745 51 9320.1 2348 25 48006.06 31480 66 1990 230780.64 145387 63 84804.87 68611 81 27623.35 19897 72 43454.53 17868 41 12774.2 2466 19 62123.69 36545 59 2000 311943.30 178755 57 113105.2 89049 79 37832.95 24484 65 58621.73 19937 34 18176.87 2490 14 84206.56 42795 51 2005 359851.77 197124 55 131280 100887 77 44086.41 27068 61 66900.41 20605 31 20473.56 2367 12 97111.37 46197 48 2006 369846.59 200698 54 134935.9 103146 76 45469.18 27547 61 68663.9 20726 30 20925.45 2339 11 99852.16 46940 47 2007 379913.58 204568 54 138714.9 105690 76 46877.63 27916 60 70265.22 20870 30 21392.71 2328 11 102663.1 47764 47 2008 390630.35 208567 53 142609.6 108327 76 48333.08 28369 59 72012.02 20977 29 22118.84 2306 10 105556.9 48588 46 2009 402632.05 212644 53 147546.1 111036 75 49901.14 28820 58 74142.03 21068 28 22323.39 2281 10 108719.4 49439 45 2010 413824.98 216787 52 152016.4 113801 75 51474.91 29276 57 75837.82 21133 28 22663.23 2257 10 111832.6 50320 45
Source: Computed from UNCTAD Statistics *Indicates the percentage of agricultural sector employment in the total employment.
17
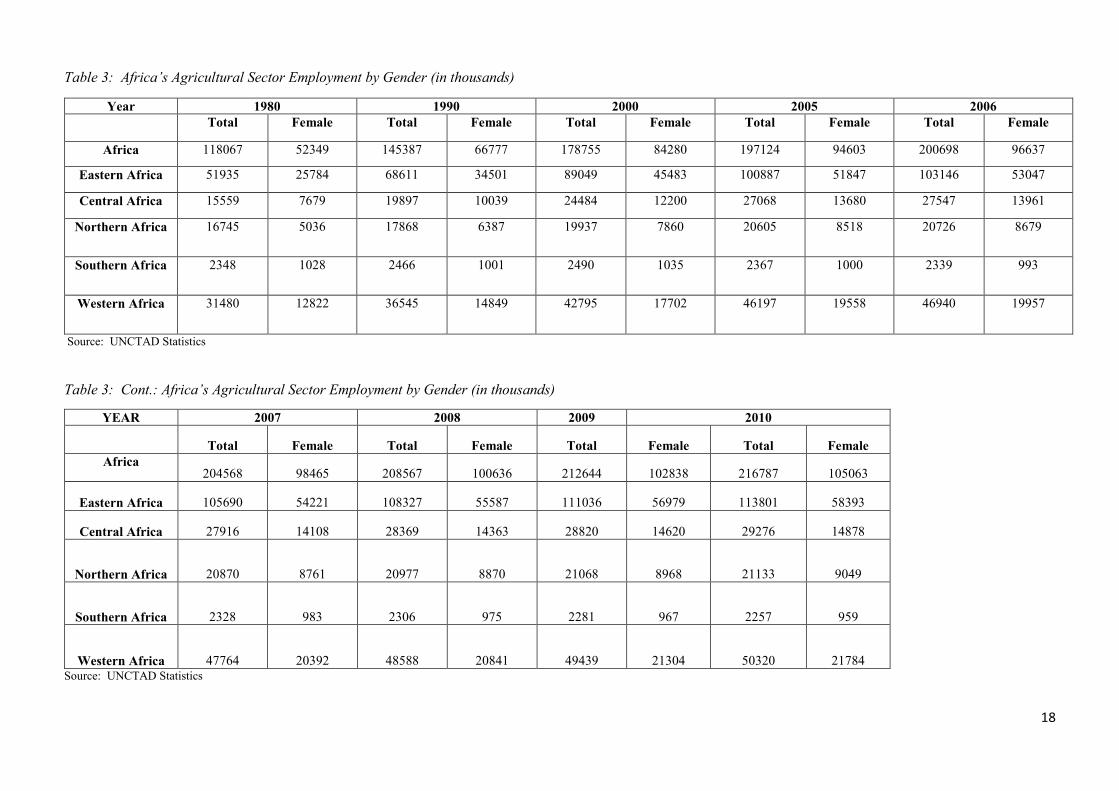
Table 3: Africa’s Agricultural Sector Employment by Gender (in thousands)
Source: UNCTAD Statistics
Table 3: Cont.: Africa’s Agricultural Sector Employment by Gender (in thousands)
YEAR 2007 2008 2009 2010
Total Female Total Female Total Female Total Female Africa
204568 98465 208567 100636 212644 102838 216787 105063
Eastern Africa 105690 54221 108327 55587 111036 56979 113801 58393
Central Africa 27916 14108 28369 14363 28820 14620 29276 14878
Northern Africa 20870 8761 20977 8870 21068 8968 21133 9049
Southern Africa 2328 983 2306 975 2281 967 2257 959
Western Africa 47764 20392 48588 20841 49439 21304 50320 21784 Source: UNCTAD Statistics
Year 1980 1990 2000 2005 2006 Total Female Total Female Total Female Total Female Total Female
Africa 118067 52349 145387 66777 178755 84280 197124 94603 200698 96637
Eastern Africa 51935 25784 68611 34501 89049 45483 100887 51847 103146 53047
Central Africa 15559 7679 19897 10039 24484 12200 27068 13680 27547 13961
Northern Africa 16745 5036 17868 6387 19937 7860 20605 8518 20726 8679
Southern Africa 2348 1028 2466 1001 2490 1035 2367 1000 2339 993
Western Africa 31480 12822 36545 14849 42795 17702 46197 19558 46940 19957
18
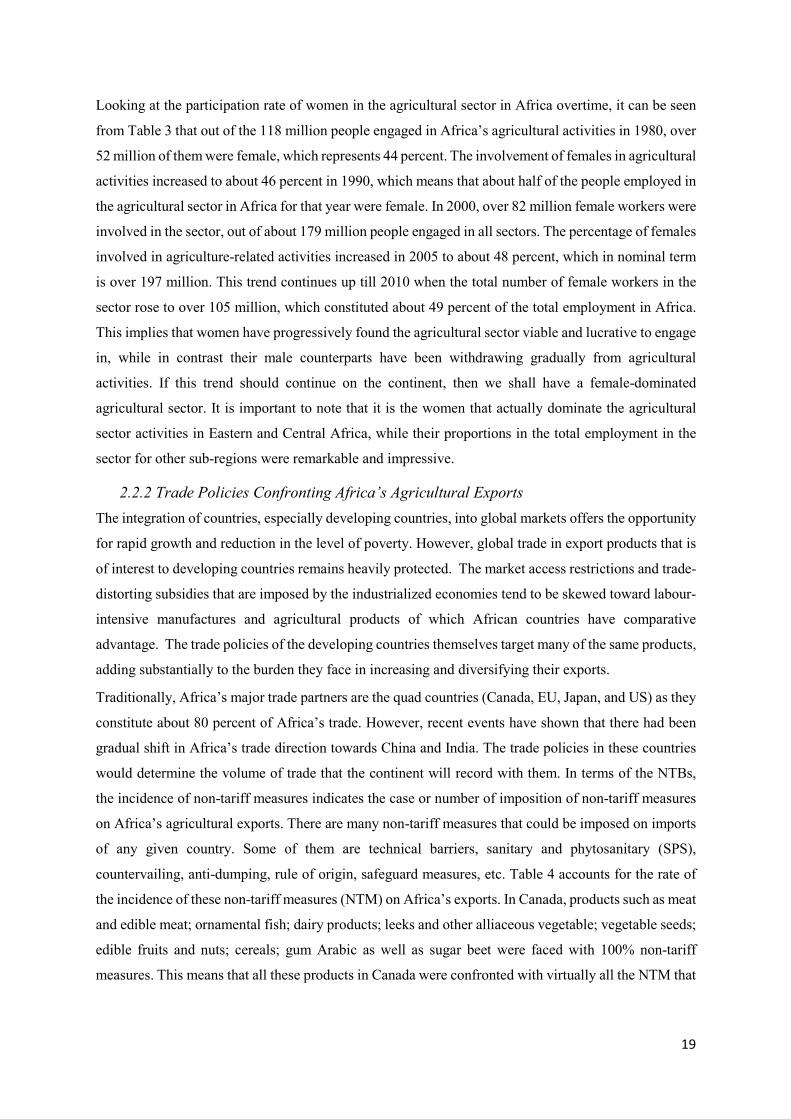
Looking at the participation rate of women in the agricultural sector in Africa overtime, it can be seen
from Table 3 that out of the 118 million people engaged in Africa’s agricultural activities in 1980, over
52 million of them were female, which represents 44 percent. The involvement of females in agricultural
activities increased to about 46 percent in 1990, which means that about half of the people employed in
the agricultural sector in Africa for that year were female. In 2000, over 82 million female workers were
involved in the sector, out of about 179 million people engaged in all sectors. The percentage of females
involved in agriculture-related activities increased in 2005 to about 48 percent, which in nominal term
is over 197 million. This trend continues up till 2010 when the total number of female workers in the
sector rose to over 105 million, which constituted about 49 percent of the total employment in Africa.
This implies that women have progressively found the agricultural sector viable and lucrative to engage
in, while in contrast their male counterparts have been withdrawing gradually from agricultural
activities. If this trend should continue on the continent, then we shall have a female-dominated
agricultural sector. It is important to note that it is the women that actually dominate the agricultural
sector activities in Eastern and Central Africa, while their proportions in the total employment in the
sector for other sub-regions were remarkable and impressive.
2.2.2 Trade Policies Confronting Africa’s Agricultural Exports The integration of countries, especially developing countries, into global markets offers the opportunity
for rapid growth and reduction in the level of poverty. However, global trade in export products that is
of interest to developing countries remains heavily protected. The market access restrictions and trade-
distorting subsidies that are imposed by the industrialized economies tend to be skewed toward labour-
intensive manufactures and agricultural products of which African countries have comparative
advantage. The trade policies of the developing countries themselves target many of the same products,
adding substantially to the burden they face in increasing and diversifying their exports.
Traditionally, Africa’s major trade partners are the quad countries (Canada, EU, Japan, and US) as they
constitute about 80 percent of Africa’s trade. However, recent events have shown that there had been
gradual shift in Africa’s trade direction towards China and India. The trade policies in these countries
would determine the volume of trade that the continent will record with them. In terms of the NTBs,
the incidence of non-tariff measures indicates the case or number of imposition of non-tariff measures
on Africa’s agricultural exports. There are many non-tariff measures that could be imposed on imports
of any given country. Some of them are technical barriers, sanitary and phytosanitary (SPS),
countervailing, anti-dumping, rule of origin, safeguard measures, etc. Table 4 accounts for the rate of
the incidence of these non-tariff measures (NTM) on Africa’s exports. In Canada, products such as meat
and edible meat; ornamental fish; dairy products; leeks and other alliaceous vegetable; vegetable seeds;
edible fruits and nuts; cereals; gum Arabic as well as sugar beet were faced with 100% non-tariff
measures. This means that all these products in Canada were confronted with virtually all the NTM that
19
are available in the Canadian market. However, products like coffee and tea; beer from malt; full grains;
other vegetable materials; animal fats and oil; cocoa beans; and others were free from NTM incidences.
In the EU, only meat and edible meat attracted 100 percent non-tariff measures incidences. Products
such as ornamental fish and animal fats and oil and their fractions were faced with just 50% NTM
incidence. Japan has no incidence of non-tariff measures on Africa’s exports except for ornamental fish
and preparation based on sausages and similar products that have 100 percent incidence of non-tariff
measures. The US has no incidence of non-tariff measures on gum Arabic, full grains, brooms and
brushes with twigs or other vegetable materials, sugar beet, cocoa beans, residues of starch
manufactures, and tobacco that are not stemmed. There is a 50 percent incidence of NTM on ornamental
fish and animal fats and oil and their fractions in the United States, while other Africa’s exports in the
products group in Table 4 attracted 100 percent NTM incidence.
20
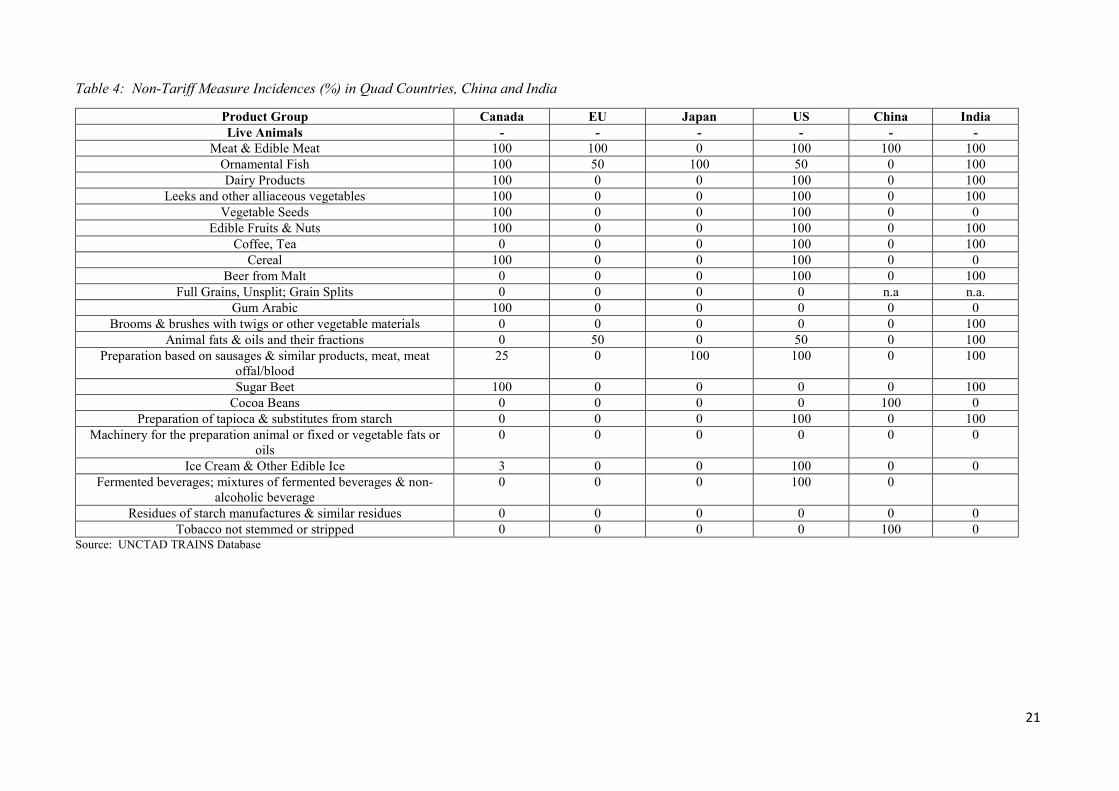
Table 4: Non-Tariff Measure Incidences (%) in Quad Countries, China and India
Product Group Canada EU Japan US China India Live Animals - - - - - -
Meat & Edible Meat 100 100 0 100 100 100 Ornamental Fish 100 50 100 50 0 100 Dairy Products 100 0 0 100 0 100
Leeks and other alliaceous vegetables 100 0 0 100 0 100 Vegetable Seeds 100 0 0 100 0 0
Edible Fruits & Nuts 100 0 0 100 0 100 Coffee, Tea 0 0 0 100 0 100
Cereal 100 0 0 100 0 0 Beer from Malt 0 0 0 100 0 100
Full Grains, Unsplit; Grain Splits 0 0 0 0 n.a n.a. Gum Arabic 100 0 0 0 0 0
Brooms & brushes with twigs or other vegetable materials 0 0 0 0 0 100 Animal fats & oils and their fractions 0 50 0 50 0 100
Preparation based on sausages & similar products, meat, meat offal/blood
25 0 100 100 0 100
Sugar Beet 100 0 0 0 0 100 Cocoa Beans 0 0 0 0 100 0
Preparation of tapioca & substitutes from starch 0 0 0 100 0 100 Machinery for the preparation animal or fixed or vegetable fats or
oils 0 0 0 0 0 0
Ice Cream & Other Edible Ice 3 0 0 100 0 0 Fermented beverages; mixtures of fermented beverages & non-
alcoholic beverage 0 0 0 100 0
Residues of starch manufactures & similar residues 0 0 0 0 0 0 Tobacco not stemmed or stripped 0 0 0 0 100 0
Source: UNCTAD TRAINS Database
21
In China, there is very low incidence of non-tariff measures on Africa’s exports. From Table 4, it can be
seen that only three of Africa’s exports-- meat and edible meat, cocoa beans and tobacco not stemmed or
stripped-- attracted 100 percent NTM incidence in Chinese markets. There is contrary incidence of NTM
in India: apart from vegetable seeds, cereal, gum Arabic, cocoa beans, vegetable fats and oil, ice cream and
other edible ice, residues of starch manufactures, and tobacco not stemmed, all of which did not witness
any incidence of NTM in Indian markets, all other products of Africa to their economies were faced with
100 percent NTM incidence. Thus, the US has the highest incidences of NTM, followed by India and
Canada, while Japan has the lowest incidences, followed by the EU and China.
2.3 An Overview of Product Standards
Generally, standards requirements are used in the protection of human, animal, or plant health in any
country from risk arising from additives, contaminants, toxins, disease-causing organisms in foods,
beverages or foodstuffs. Another interest is reducing risk of diseases caused by animals, plants, or products
thereof while limiting other damage caused by the spread of pests. Standards in international trade are used
for the quality requirements of the products and the production process in order to safeguard human and
animal life as well as the environment. They are used as the technical measures in trade between importing
and exporting countries, or as a mechanism to facilitate compliance to technical regulations. Pedagogically,
international trade standard is a formal document that is established by consensus and published by a
recognized body that provides for repeated use, rules, guidelines, or characteristics for activities or their
results, aimed at the achievement of the optimum degree of order in a given context (ISO, 2010). Thus,
standards can apply to products and services as well as the process or systems that are utilized to provide
them. The essence of the usage of standards is to ensure compliance, which will facilitate market access
and ensure product safety and quality while preventing deceptive practices and protecting the environment
(ISO/ITC, 2011).
In international trade there are also technical barriers to trade (TBT), which is part of non-tariff measures
(NTMs). The TBT are comprised of technical regulations, standards, and conformity assessment (Kareem,
2010). The technical regulation is a document that provide legislative rules that is adopted by an authority
(i.e. a regulator), which provides technical requirement, either directly or by referring to or incorporating
the content of a standard, technical specification or code of practice. It should be noted that a technical
regulation may be complemented by technical guidance that outlines some mechanisms of compliance with
the requirements of the regulation. The WTO defines technical regulations as document that lays down
product characteristics or their related processes and production methods, including the applicable
administrative provisions, with which compliance is mandatory (ISO/ITC, 2010). This may include or deal
exclusively with terminology, symbols, packaging, making or labeling requirements as they apply to a
22
product, process or production method. Standard is defined as a document that is approved by a recognized
body that provides for common and repeated common use, rules, guidelines or characteristics for products
or related processes and production methods, with which compliance is not mandatory (see ITC, 2011;
ISO/UNIDO, 2010). Conformity assessment is said to be any procedure by producers, suppliers, clients,
regulatory bodies or third parties, directly or indirectly to determine that relevant requirements in technical
regulations or standards are fulfilled. It is a collective term that covers all the services needed to provide
evidence that a product or service complies with a standard or technical regulation. This assessment could
be provided by independent third parties, or by the supplier, depending on the purchaser of regulatory
authority requirements. This includes testing, inspection, products or system certification, or any relevant
combination of these (ISO/UNIDO, 2010).
International trade standards include product standards, which establish the fitness of products for a
particular use; and process or management standards that deal with the quality of the production process.
Aside this, there is documentary standards, which set specifications for the function and operation of a
device or system (ISO/ITC, 2010). Also, test and measurement standards are broadly used for infra-
technologies that support market efficiency. Further, there are different stages in the standards mechanism.
First, there is the setting of standards for products and services, which is followed by the adoption of these
standards by these setters. The next stage is the implementation of the standards by those setters. Another
stage is the conformity assessment of the standards that involves testing, inspection and certification.
Enforcement is the last stage in this mechanism and it involves rejection, withdrawal and sanctions of
products and services (ISO, 2010).
In a broad analysis, standards could be categorized into product and process standards. Products standards
are standards on goods and services while process standards are applicable to process of making or
producing the products (Kareem, 2010). In line with the WTO agreements of SPS, this study deals with the
product standards that are applied to food products in the EU.
Two types of these standards are identified in the literature: public and private standards (ITC, 2011;
ISO/ITC, 2010)2. The public standards are the quality requirements set by the government in order to protect
the people, animals, plants, and the environment from products that will have a harmful effect on their
health and well-being. However, private standards are developed by companies, civil societies, other
coalitions and collective organizations such as industry associations and NGOs, which are mainly for
strategic reasons. There are also mandatory and voluntary standards. Mandatory standards are compulsory
requirements that products or services must abide with before gaining access to the market. These standards
are usually technical regulations that are given by the government which are required to be in conformity
2 This section gives the taxonomy of standards in the literature and this is the reason for identifying private standards and not that it is the focus of this study.
23
with the WTO Technical Barriers to Trade (TBT) agreements. Voluntary standards are non-mandatory
requirements that products are at liberty to abide with or fulfill; however, this could be demanded by
contract or considered desirable by the marketplace. In short, public standards can be mandatory or
voluntary standards depending on whether the standards are backed by legislation or not. The public
standards that are backed by law of the country are the technical regulations and they are mandatory, while
those not backed by law but introduced and implemented by the regulatory agencies in the country are
voluntary (the private standards are usually voluntary).
In addition to all this, there is global governance to international trade standards that is facilitated by the
World Trade Organization (WTO). WTO provides the framework with which standards are monitored and
disputes are settled. The WTO had two international standards agreements: the Agreement on Technical
Barriers to Trade (TBT) and the Agreement on Application of Sanitary and Phytosanitary (SPS) Measures.
These agreements recognize the need for governments to establish regulations, but they did not set any
standards (ISO/UNIDO, 2010). The TBT agreement recognizes that access to markets can be restricted
through the use of technical regulations and standards, which are different across countries and could be
said to be protective such as the non-tariff barriers to trade if they are used arbitrarily. This agreement
acknowledges the right of a country to adopt those technical regulations, standards and conformity
assessment procedures it considers appropriate to sustain and protect human, animal or plant life or health,
to assure the protection of the environment, or to meet other consumer interests. Also, TBT agreement
allows countries to employ other mechanisms such as equivalence and mutual recognition of the standards
of others when developing technical regulations (see ITC, 2011).
The Sanitary and Phytosanitary agreement is put in place to protect human, animal or plant life from risks
arising from additives or disease-causing organisms in food, and to protect a country from the damage
caused by the spread of pests, which may, directly or indirectly, affect international trade. This agreement
makes provision for the sovereign right of governments to take such measures, but requires that they should
not be arbitrarily or unfairly discriminatory against other countries and be based on scientific evidence. It
is recommended that countries should base their SPS measures and technical regulations on international
standards, where they exist. The standards that are of particular relevance are that of the Codex Alimentarius
Commission (CAC), the International Plant Protection Convention (IPPC) and the International Office
Epizootics (OIE) (see ITC, 2011; ISO/ITC, 2010). These three inter-governmental organizations are
commonly referred to as the “three sisters”. The SPS agreement shows that for matters not covered by the
sisters, appropriate standards, guidelines and recommendations promulgated by other “relevant
international organizations open for membership to all Members, as identified by the agreement” may also
be considered as “international standards”. However, in reality, the WTO SPS committee has yet to identify
such organizations (ISO/ITC, 2010).
24
In technical terms, there are differences between TBT and SPS measures. The major difference between
these non-tariff measures is whether the measure is to address food safety risks from pest or disease, food-
borne risks. For instance, the TBT deals with the regulation of quality, grading and labeling of imported
vegetable while SPS regulates the treatment of imported vegetables to prevent pests. Also, the TBT provides
regulation on label’s position, letter size, nutrient content and quality, while the regulation of permitted
food safety, health warnings and dosage are done by SPS. By and large, the SPS covers food safety and/or
health protection measures; however, TBT cover all technical requirements for agricultural and industrial
products except those covered by SPS measures.
Thus, a perusal of conceptual issues of international trade standards shows that there is different usage of
the term “standards” in different contexts. At times, SPS is taken as the standard and used differently with
TBT (while standards and technical regulations also have similar identification challenge), but most often
they are used interchangeably by scholars, researchers, trade practitioners and authors(see Shepherd, 2007;
2013; Czubala et al. 2009; Fugazza, 2013; Asfaw et al. 2007). This is because of the very close definitions
between the two terms, in facts, some scholars often confused their meanings, and in the empirical literature,
there is divergence opinion with regards to their usage and definitions. Technically, to my understanding,
this is not the case, as there are differences between technical regulations and standards3 because the
regulations deal with the laws and rules governing standards, which are mandatory while standards are the
specific content requirements, vis a vis, the sanitary and phytosanitary requirements for every product that
often set by the national standards agencies and said to be voluntary. For instance, many technical
regulations often identified mycotoxins inspections for nuts and seeds, but the national standards agencies
give the specificity of SPS by disaggregating the mycotoxins regulations into aflatoxins, Ochratoxin A, etc.
Also, I discovered that private standards, though are voluntary but with the influence, technological and
scientific orientation of the private standards setters on government, some of these standards are adopted
as public standards. Thus, this makes private standards indirectly mandatory in many of the countries. More
so, in a case where there is no provision for international public standards on a product, then the
international private standards such as the ISO standards are often used and adopted as the international/
public standards if available for the product case (ITC, 2011; ISO/UNIDO, 2010), but this does not mean
private standards are public.
2.4 EU Standard Requirements: Hurdles to Pass for Selected Products
A perusal of ‘hurdles to pass’ (HTP) in the EU market for all product lines, especially foods and feeds,
indicates that more than one hurdle (standard requirement) needs to be passed or is placed on products
3 Both are subset of the Technical Barriers to Trade.
25
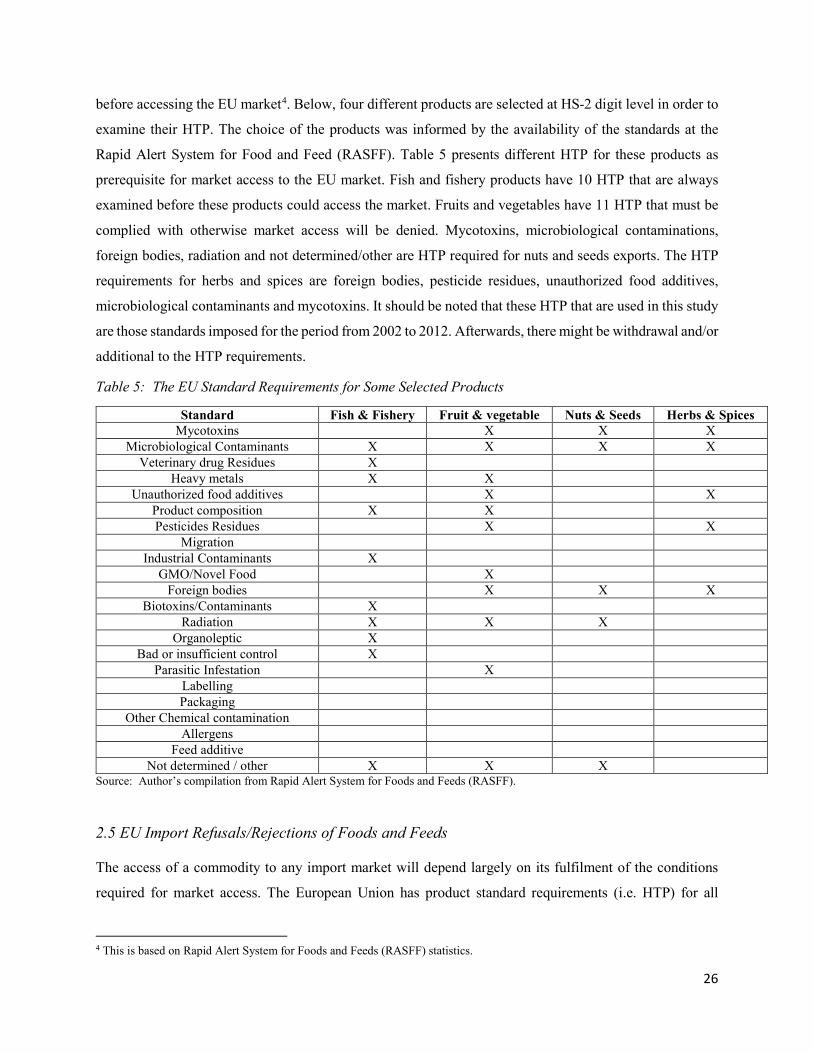
before accessing the EU market4. Below, four different products are selected at HS-2 digit level in order to
examine their HTP. The choice of the products was informed by the availability of the standards at the
Rapid Alert System for Food and Feed (RASFF). Table 5 presents different HTP for these products as
prerequisite for market access to the EU market. Fish and fishery products have 10 HTP that are always
examined before these products could access the market. Fruits and vegetables have 11 HTP that must be
complied with otherwise market access will be denied. Mycotoxins, microbiological contaminations,
foreign bodies, radiation and not determined/other are HTP required for nuts and seeds exports. The HTP
requirements for herbs and spices are foreign bodies, pesticide residues, unauthorized food additives,
microbiological contaminants and mycotoxins. It should be noted that these HTP that are used in this study
are those standards imposed for the period from 2002 to 2012. Afterwards, there might be withdrawal and/or
additional to the HTP requirements.
Table 5: The EU Standard Requirements for Some Selected Products
Standard Fish & Fishery Fruit & vegetable Nuts & Seeds Herbs & Spices Mycotoxins X X X
Microbiological Contaminants X X X X Veterinary drug Residues X
Heavy metals X X Unauthorized food additives X X
Product composition X X Pesticides Residues X X
Migration Industrial Contaminants X
GMO/Novel Food X Foreign bodies X X X
Biotoxins/Contaminants X Radiation X X X
Organoleptic X Bad or insufficient control X
Parasitic Infestation X Labelling Packaging
Other Chemical contamination Allergens
Feed additive Not determined / other X X X
Source: Author’s compilation from Rapid Alert System for Foods and Feeds (RASFF).
2.5 EU Import Refusals/Rejections of Foods and Feeds
The access of a commodity to any import market will depend largely on its fulfilment of the conditions
required for market access. The European Union has product standard requirements (i.e. HTP) for all
4 This is based on Rapid Alert System for Foods and Feeds (RASFF) statistics.
26
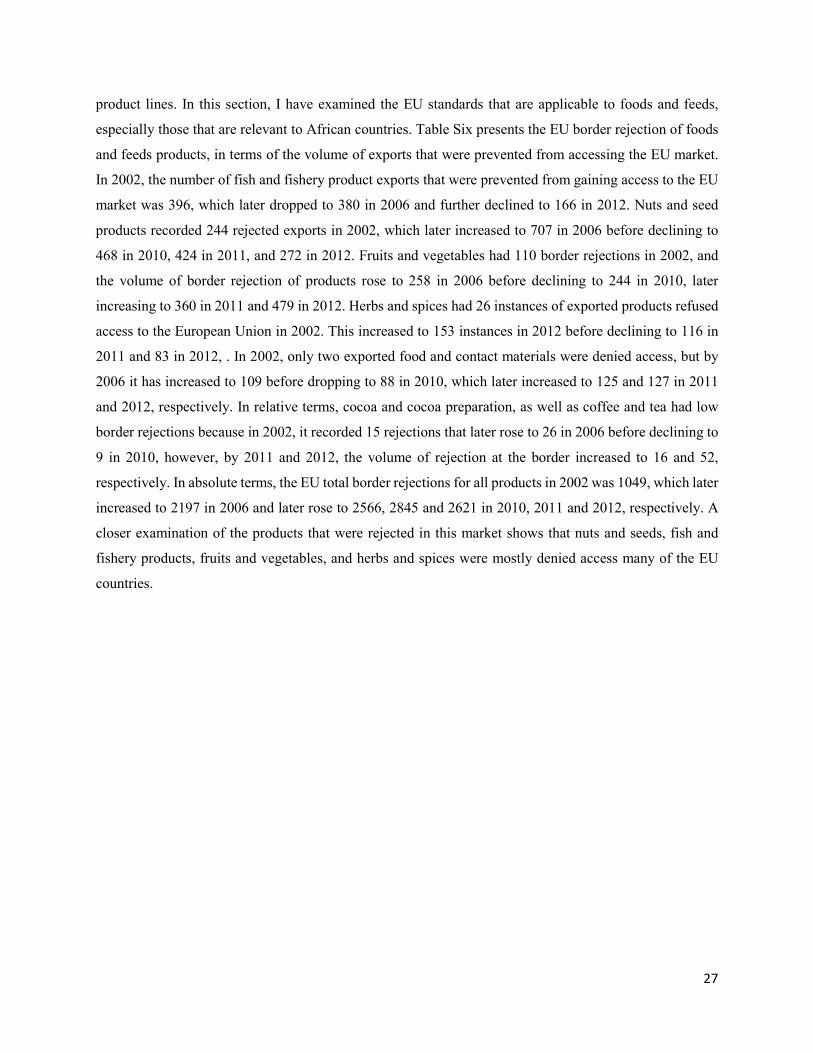
product lines. In this section, I have examined the EU standards that are applicable to foods and feeds,
especially those that are relevant to African countries. Table Six presents the EU border rejection of foods
and feeds products, in terms of the volume of exports that were prevented from accessing the EU market.
In 2002, the number of fish and fishery product exports that were prevented from gaining access to the EU
market was 396, which later dropped to 380 in 2006 and further declined to 166 in 2012. Nuts and seed
products recorded 244 rejected exports in 2002, which later increased to 707 in 2006 before declining to
468 in 2010, 424 in 2011, and 272 in 2012. Fruits and vegetables had 110 border rejections in 2002, and
the volume of border rejection of products rose to 258 in 2006 before declining to 244 in 2010, later
increasing to 360 in 2011 and 479 in 2012. Herbs and spices had 26 instances of exported products refused
access to the European Union in 2002. This increased to 153 instances in 2012 before declining to 116 in
2011 and 83 in 2012, . In 2002, only two exported food and contact materials were denied access, but by
2006 it has increased to 109 before dropping to 88 in 2010, which later increased to 125 and 127 in 2011
and 2012, respectively. In relative terms, cocoa and cocoa preparation, as well as coffee and tea had low
border rejections because in 2002, it recorded 15 rejections that later rose to 26 in 2006 before declining to
9 in 2010, however, by 2011 and 2012, the volume of rejection at the border increased to 16 and 52,
respectively. In absolute terms, the EU total border rejections for all products in 2002 was 1049, which later
increased to 2197 in 2006 and later rose to 2566, 2845 and 2621 in 2010, 2011 and 2012, respectively. A
closer examination of the products that were rejected in this market shows that nuts and seeds, fish and
fishery products, fruits and vegetables, and herbs and spices were mostly denied access many of the EU
countries.
27
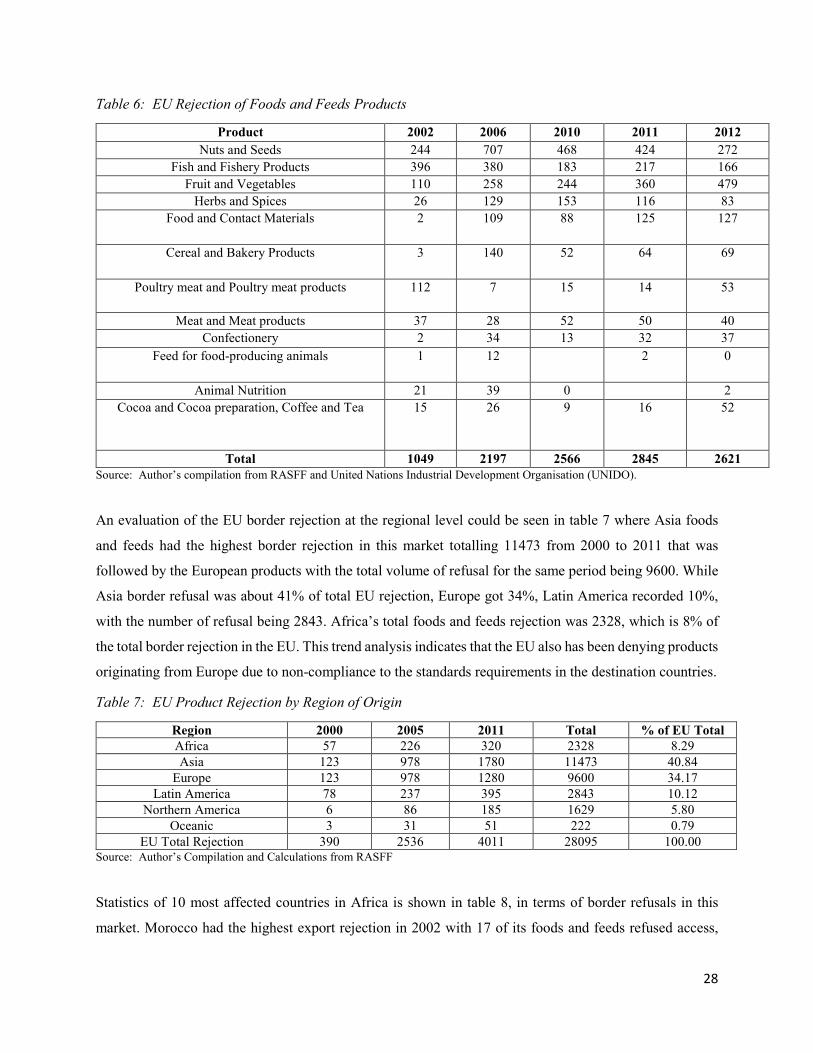
Table 6: EU Rejection of Foods and Feeds Products
Product 2002 2006 2010 2011 2012 Nuts and Seeds 244 707 468 424 272
Fish and Fishery Products 396 380 183 217 166 Fruit and Vegetables 110 258 244 360 479
Herbs and Spices 26 129 153 116 83 Food and Contact Materials 2 109 88 125 127
Cereal and Bakery Products 3 140 52 64 69
Poultry meat and Poultry meat products 112 7 15 14 53
Meat and Meat products 37 28 52 50 40 Confectionery 2 34 13 32 37
Feed for food-producing animals 1 12 2 0
Animal Nutrition 21 39 0 2 Cocoa and Cocoa preparation, Coffee and Tea 15 26 9 16 52
Total 1049 2197 2566 2845 2621 Source: Author’s compilation from RASFF and United Nations Industrial Development Organisation (UNIDO). An evaluation of the EU border rejection at the regional level could be seen in table 7 where Asia foods
and feeds had the highest border rejection in this market totalling 11473 from 2000 to 2011 that was
followed by the European products with the total volume of refusal for the same period being 9600. While
Asia border refusal was about 41% of total EU rejection, Europe got 34%, Latin America recorded 10%,
with the number of refusal being 2843. Africa’s total foods and feeds rejection was 2328, which is 8% of
the total border rejection in the EU. This trend analysis indicates that the EU also has been denying products
originating from Europe due to non-compliance to the standards requirements in the destination countries.
Table 7: EU Product Rejection by Region of Origin
Region 2000 2005 2011 Total % of EU Total Africa 57 226 320 2328 8.29 Asia 123 978 1780 11473 40.84
Europe 123 978 1280 9600 34.17 Latin America 78 237 395 2843 10.12
Northern America 6 86 185 1629 5.80 Oceanic 3 31 51 222 0.79
EU Total Rejection 390 2536 4011 28095 100.00 Source: Author’s Compilation and Calculations from RASFF Statistics of 10 most affected countries in Africa is shown in table 8, in terms of border refusals in this
market. Morocco had the highest export rejection in 2002 with 17 of its foods and feeds refused access,
28
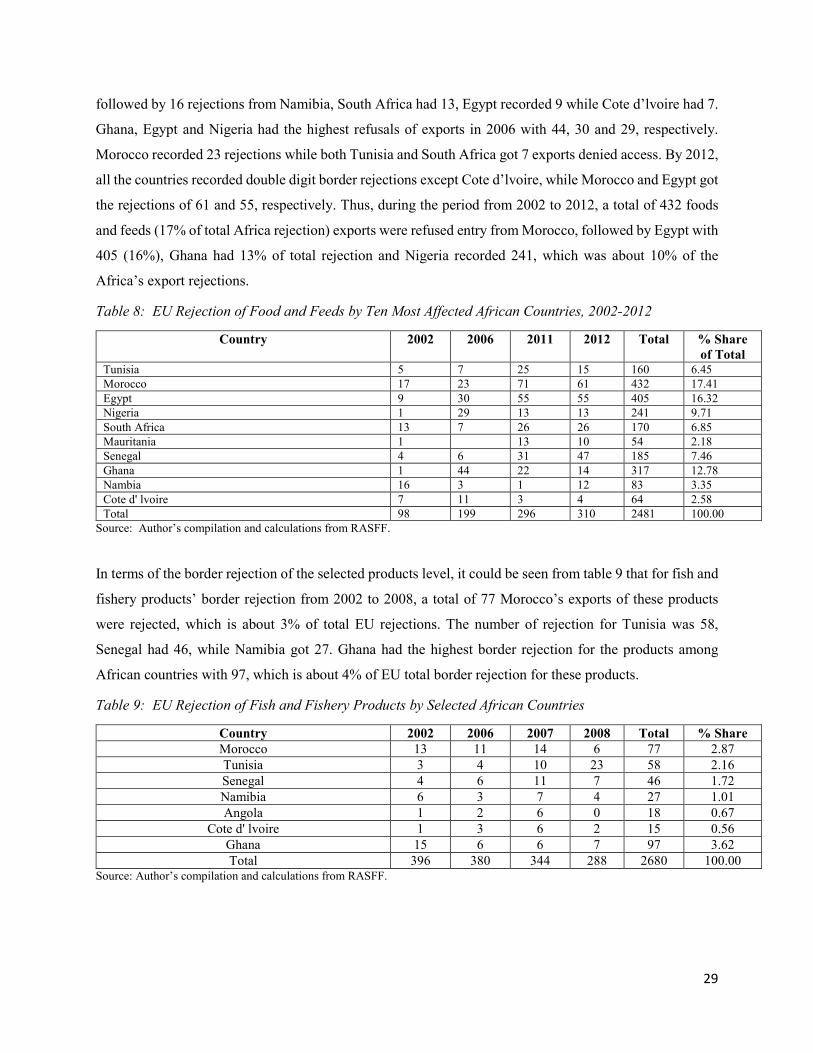
followed by 16 rejections from Namibia, South Africa had 13, Egypt recorded 9 while Cote d’lvoire had 7.
Ghana, Egypt and Nigeria had the highest refusals of exports in 2006 with 44, 30 and 29, respectively.
Morocco recorded 23 rejections while both Tunisia and South Africa got 7 exports denied access. By 2012,
all the countries recorded double digit border rejections except Cote d’lvoire, while Morocco and Egypt got
the rejections of 61 and 55, respectively. Thus, during the period from 2002 to 2012, a total of 432 foods
and feeds (17% of total Africa rejection) exports were refused entry from Morocco, followed by Egypt with
405 (16%), Ghana had 13% of total rejection and Nigeria recorded 241, which was about 10% of the
Africa’s export rejections.
Table 8: EU Rejection of Food and Feeds by Ten Most Affected African Countries, 2002-2012
Country 2002 2006 2011 2012 Total % Share of Total
Tunisia 5 7 25 15 160 6.45 Morocco 17 23 71 61 432 17.41 Egypt 9 30 55 55 405 16.32 Nigeria 1 29 13 13 241 9.71 South Africa 13 7 26 26 170 6.85 Mauritania 1 13 10 54 2.18 Senegal 4 6 31 47 185 7.46 Ghana 1 44 22 14 317 12.78 Nambia 16 3 1 12 83 3.35 Cote d' lvoire 7 11 3 4 64 2.58 Total 98 199 296 310 2481 100.00
Source: Author’s compilation and calculations from RASFF. In terms of the border rejection of the selected products level, it could be seen from table 9 that for fish and
fishery products’ border rejection from 2002 to 2008, a total of 77 Morocco’s exports of these products
were rejected, which is about 3% of total EU rejections. The number of rejection for Tunisia was 58,
Senegal had 46, while Namibia got 27. Ghana had the highest border rejection for the products among
African countries with 97, which is about 4% of EU total border rejection for these products.
Table 9: EU Rejection of Fish and Fishery Products by Selected African Countries
Country 2002 2006 2007 2008 Total % Share Morocco 13 11 14 6 77 2.87 Tunisia 3 4 10 23 58 2.16 Senegal 4 6 11 7 46 1.72 Namibia 6 3 7 4 27 1.01 Angola 1 2 6 0 18 0.67
Cote d' lvoire 1 3 6 2 15 0.56 Ghana 15 6 6 7 97 3.62 Total 396 380 344 288 2680 100.00
Source: Author’s compilation and calculations from RASFF.
29
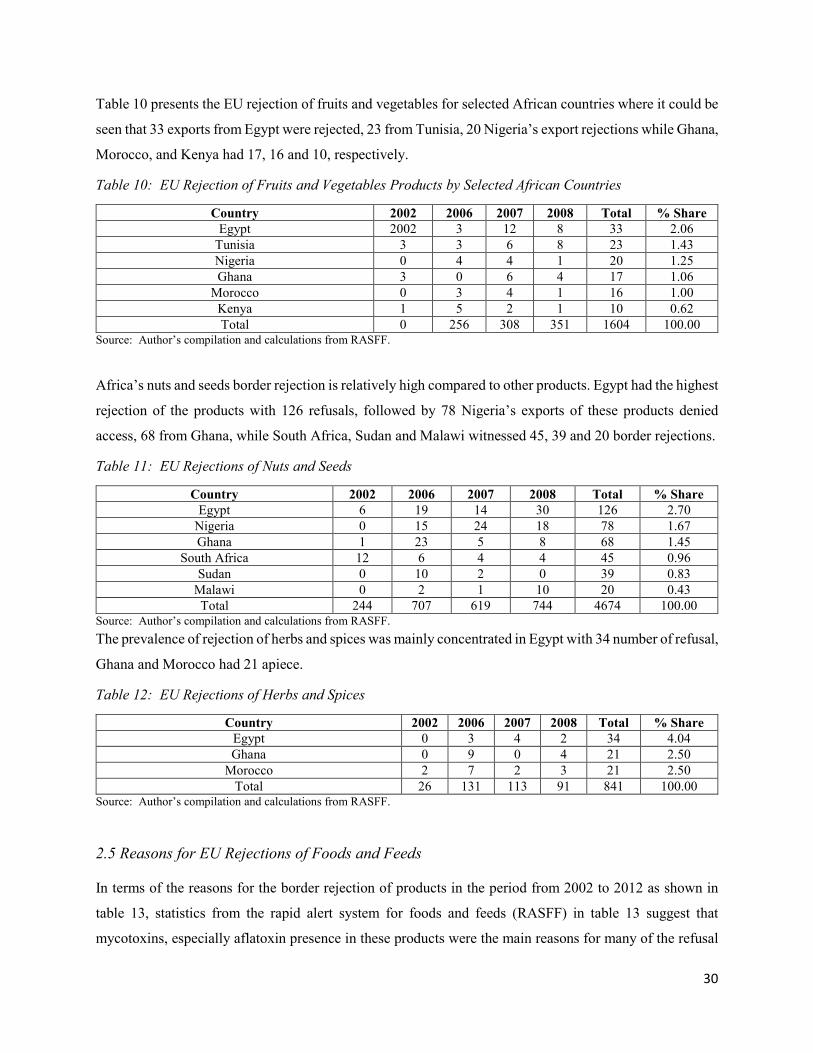
Table 10 presents the EU rejection of fruits and vegetables for selected African countries where it could be
seen that 33 exports from Egypt were rejected, 23 from Tunisia, 20 Nigeria’s export rejections while Ghana,
Morocco, and Kenya had 17, 16 and 10, respectively.
Table 10: EU Rejection of Fruits and Vegetables Products by Selected African Countries
Country 2002 2006 2007 2008 Total % Share Egypt 2002 3 12 8 33 2.06
Tunisia 3 3 6 8 23 1.43 Nigeria 0 4 4 1 20 1.25 Ghana 3 0 6 4 17 1.06
Morocco 0 3 4 1 16 1.00 Kenya 1 5 2 1 10 0.62 Total 0 256 308 351 1604 100.00
Source: Author’s compilation and calculations from RASFF. Africa’s nuts and seeds border rejection is relatively high compared to other products. Egypt had the highest
rejection of the products with 126 refusals, followed by 78 Nigeria’s exports of these products denied
access, 68 from Ghana, while South Africa, Sudan and Malawi witnessed 45, 39 and 20 border rejections.
Table 11: EU Rejections of Nuts and Seeds
Country 2002 2006 2007 2008 Total % Share Egypt 6 19 14 30 126 2.70
Nigeria 0 15 24 18 78 1.67 Ghana 1 23 5 8 68 1.45
South Africa 12 6 4 4 45 0.96 Sudan 0 10 2 0 39 0.83
Malawi 0 2 1 10 20 0.43 Total 244 707 619 744 4674 100.00
Source: Author’s compilation and calculations from RASFF. The prevalence of rejection of herbs and spices was mainly concentrated in Egypt with 34 number of refusal,
Ghana and Morocco had 21 apiece.
Table 12: EU Rejections of Herbs and Spices
Country 2002 2006 2007 2008 Total % Share Egypt 0 3 4 2 34 4.04 Ghana 0 9 0 4 21 2.50
Morocco 2 7 2 3 21 2.50 Total 26 131 113 91 841 100.00
Source: Author’s compilation and calculations from RASFF.
2.5 Reasons for EU Rejections of Foods and Feeds
In terms of the reasons for the border rejection of products in the period from 2002 to 2012 as shown in
table 13, statistics from the rapid alert system for foods and feeds (RASFF) in table 13 suggest that
mycotoxins, especially aflatoxin presence in these products were the main reasons for many of the refusal
30
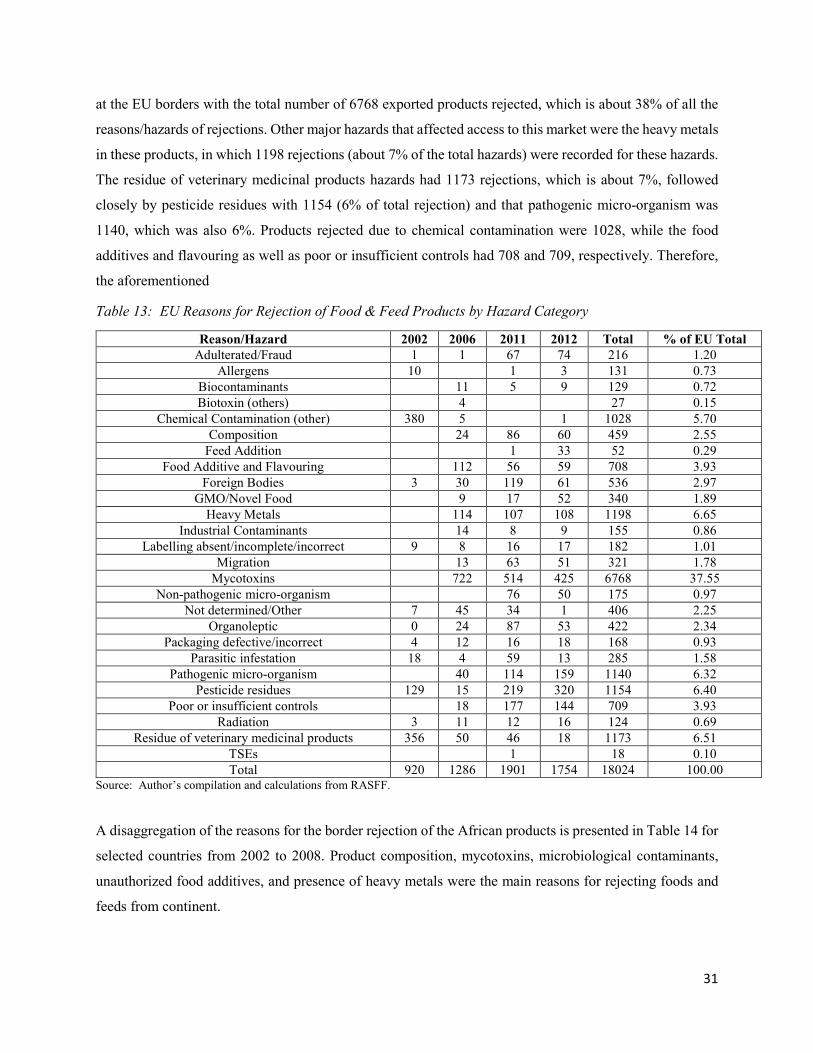
at the EU borders with the total number of 6768 exported products rejected, which is about 38% of all the
reasons/hazards of rejections. Other major hazards that affected access to this market were the heavy metals
in these products, in which 1198 rejections (about 7% of the total hazards) were recorded for these hazards.
The residue of veterinary medicinal products hazards had 1173 rejections, which is about 7%, followed
closely by pesticide residues with 1154 (6% of total rejection) and that pathogenic micro-organism was
1140, which was also 6%. Products rejected due to chemical contamination were 1028, while the food
additives and flavouring as well as poor or insufficient controls had 708 and 709, respectively. Therefore,
the aforementioned
Table 13: EU Reasons for Rejection of Food & Feed Products by Hazard Category
Reason/Hazard 2002 2006 2011 2012 Total % of EU Total Adulterated/Fraud 1 1 67 74 216 1.20
Allergens 10 1 3 131 0.73 Biocontaminants 11 5 9 129 0.72 Biotoxin (others) 4 27 0.15
Chemical Contamination (other) 380 5 1 1028 5.70 Composition 24 86 60 459 2.55
Feed Addition 1 33 52 0.29 Food Additive and Flavouring 112 56 59 708 3.93
Foreign Bodies 3 30 119 61 536 2.97 GMO/Novel Food 9 17 52 340 1.89
Heavy Metals 114 107 108 1198 6.65 Industrial Contaminants 14 8 9 155 0.86
Labelling absent/incomplete/incorrect 9 8 16 17 182 1.01 Migration 13 63 51 321 1.78
Mycotoxins 722 514 425 6768 37.55 Non-pathogenic micro-organism 76 50 175 0.97
Not determined/Other 7 45 34 1 406 2.25 Organoleptic 0 24 87 53 422 2.34
Packaging defective/incorrect 4 12 16 18 168 0.93 Parasitic infestation 18 4 59 13 285 1.58
Pathogenic micro-organism 40 114 159 1140 6.32 Pesticide residues 129 15 219 320 1154 6.40
Poor or insufficient controls 18 177 144 709 3.93 Radiation 3 11 12 16 124 0.69
Residue of veterinary medicinal products 356 50 46 18 1173 6.51 TSEs 1 18 0.10 Total 920 1286 1901 1754 18024 100.00
Source: Author’s compilation and calculations from RASFF. A disaggregation of the reasons for the border rejection of the African products is presented in Table 14 for
selected countries from 2002 to 2008. Product composition, mycotoxins, microbiological contaminants,
unauthorized food additives, and presence of heavy metals were the main reasons for rejecting foods and
feeds from continent.
31
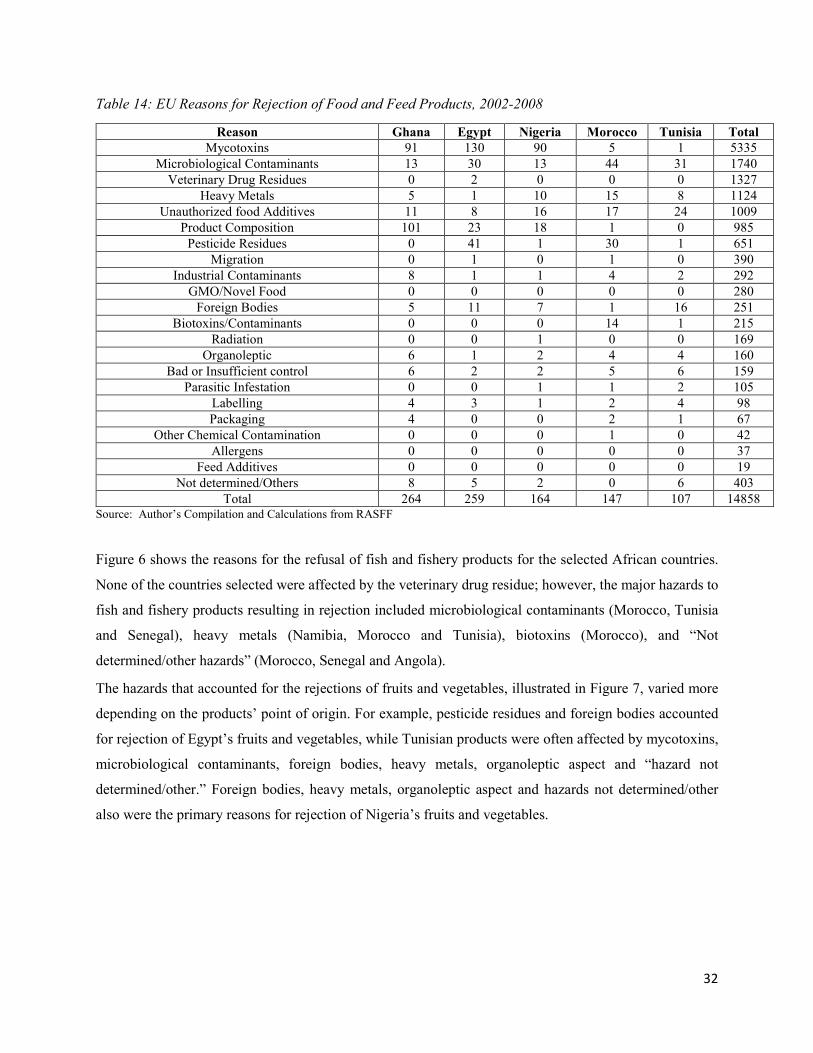
Table 14: EU Reasons for Rejection of Food and Feed Products, 2002-2008
Reason Ghana Egypt Nigeria Morocco Tunisia Total Mycotoxins 91 130 90 5 1 5335
Microbiological Contaminants 13 30 13 44 31 1740 Veterinary Drug Residues 0 2 0 0 0 1327
Heavy Metals 5 1 10 15 8 1124 Unauthorized food Additives 11 8 16 17 24 1009
Product Composition 101 23 18 1 0 985 Pesticide Residues 0 41 1 30 1 651
Migration 0 1 0 1 0 390 Industrial Contaminants 8 1 1 4 2 292
GMO/Novel Food 0 0 0 0 0 280 Foreign Bodies 5 11 7 1 16 251
Biotoxins/Contaminants 0 0 0 14 1 215 Radiation 0 0 1 0 0 169
Organoleptic 6 1 2 4 4 160 Bad or Insufficient control 6 2 2 5 6 159
Parasitic Infestation 0 0 1 1 2 105 Labelling 4 3 1 2 4 98 Packaging 4 0 0 2 1 67
Other Chemical Contamination 0 0 0 1 0 42 Allergens 0 0 0 0 0 37
Feed Additives 0 0 0 0 0 19 Not determined/Others 8 5 2 0 6 403
Total 264 259 164 147 107 14858 Source: Author’s Compilation and Calculations from RASFF Figure 6 shows the reasons for the refusal of fish and fishery products for the selected African countries.
None of the countries selected were affected by the veterinary drug residue; however, the major hazards to
fish and fishery products resulting in rejection included microbiological contaminants (Morocco, Tunisia
and Senegal), heavy metals (Namibia, Morocco and Tunisia), biotoxins (Morocco), and “Not
determined/other hazards” (Morocco, Senegal and Angola).
The hazards that accounted for the rejections of fruits and vegetables, illustrated in Figure 7, varied more
depending on the products’ point of origin. For example, pesticide residues and foreign bodies accounted
for rejection of Egypt’s fruits and vegetables, while Tunisian products were often affected by mycotoxins,
microbiological contaminants, foreign bodies, heavy metals, organoleptic aspect and “hazard not
determined/other.” Foreign bodies, heavy metals, organoleptic aspect and hazards not determined/other
also were the primary reasons for rejection of Nigeria’s fruits and vegetables.
32
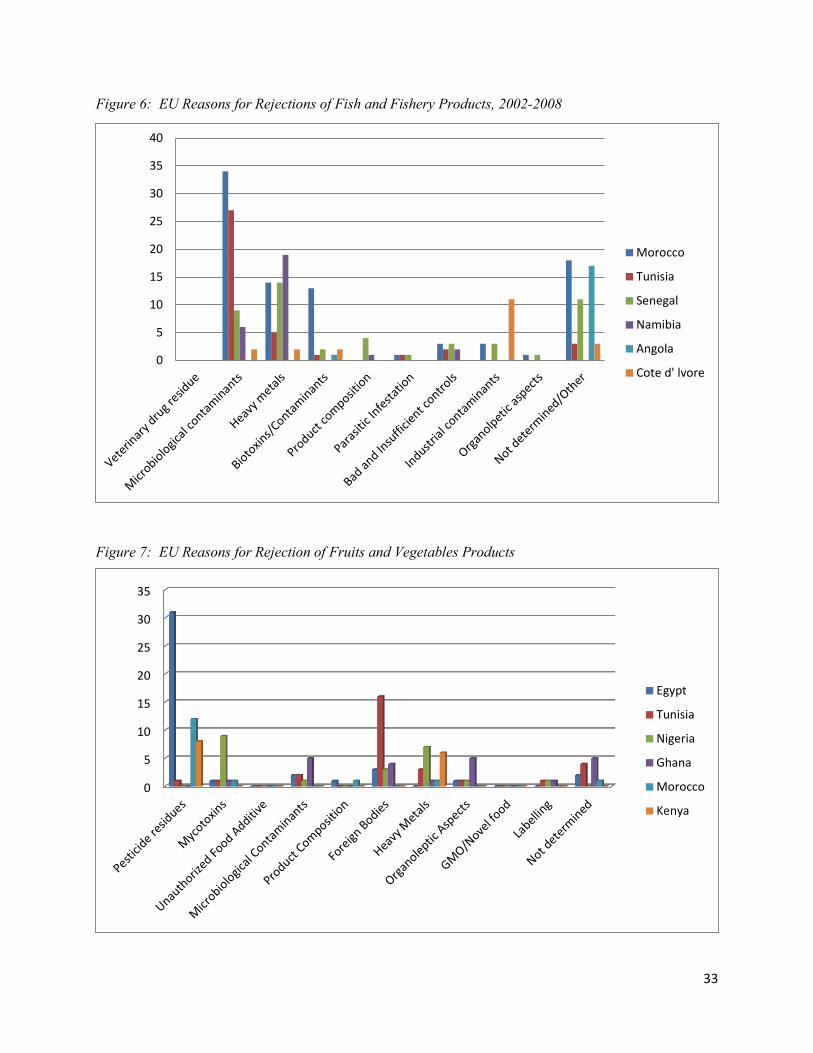
Figure 6: EU Reasons for Rejections of Fish and Fishery Products, 2002-2008
Figure 7: EU Reasons for Rejection of Fruits and Vegetables Products
0
5
10
15
20
25
30
35
40
Morocco
Tunisia
Senegal
Namibia
Angola
Cote d' lvore
0
5
10
15
20
25
30
35
Egypt
Tunisia
Nigeria
Ghana
Morocco
Kenya
33
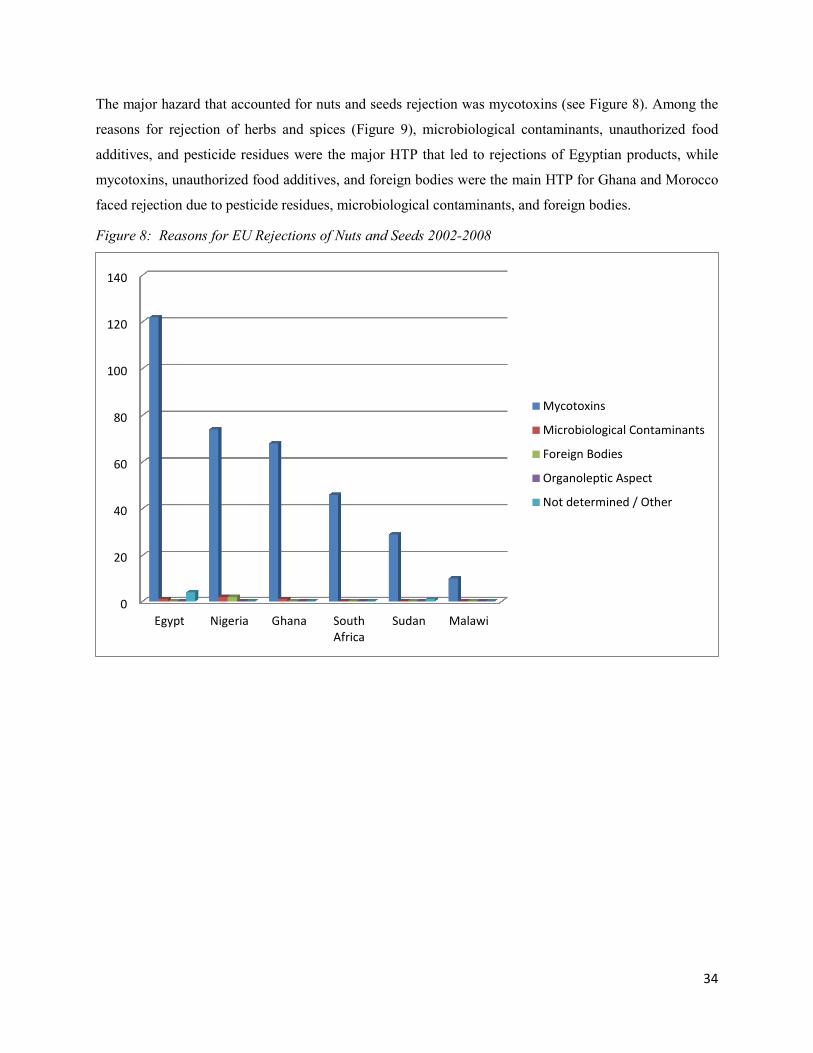
The major hazard that accounted for nuts and seeds rejection was mycotoxins (see Figure 8). Among the
reasons for rejection of herbs and spices (Figure 9), microbiological contaminants, unauthorized food
additives, and pesticide residues were the major HTP that led to rejections of Egyptian products, while
mycotoxins, unauthorized food additives, and foreign bodies were the main HTP for Ghana and Morocco
faced rejection due to pesticide residues, microbiological contaminants, and foreign bodies.
Figure 8: Reasons for EU Rejections of Nuts and Seeds 2002-2008
0
20
40
60
80
100
120
140
Egypt Nigeria Ghana SouthAfrica
Sudan Malawi
Mycotoxins
Microbiological Contaminants
Foreign Bodies
Organoleptic Aspect
Not determined / Other
34
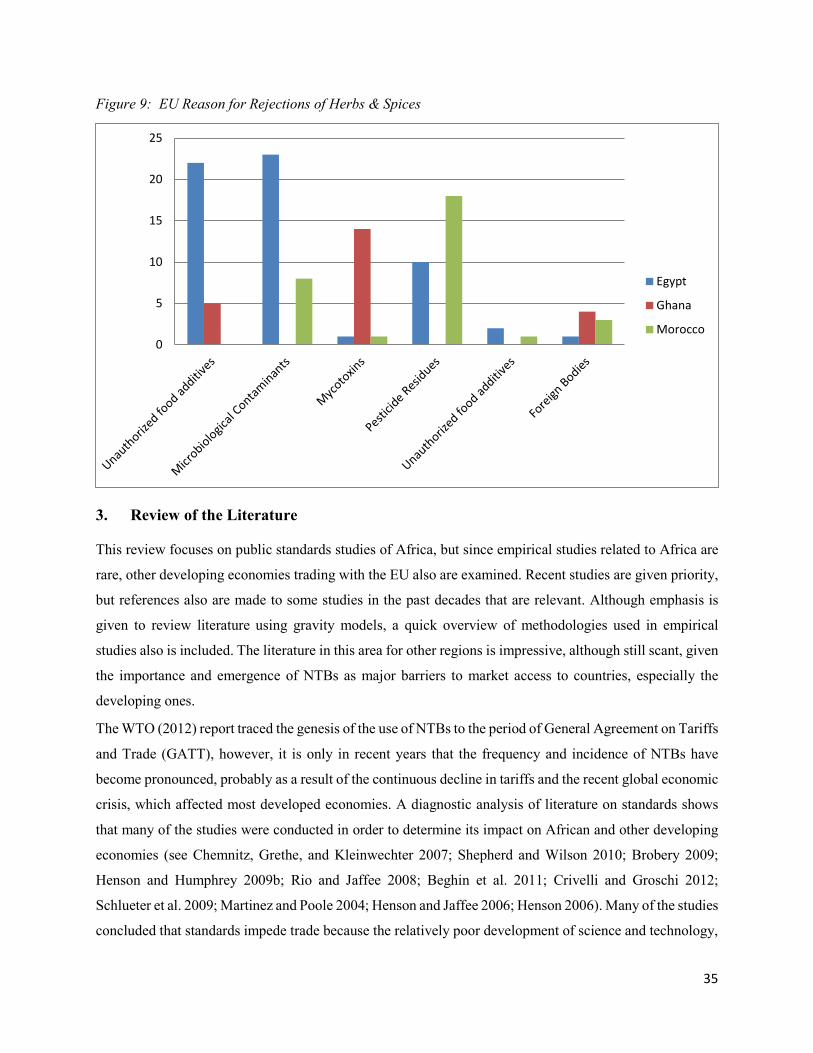
Figure 9: EU Reason for Rejections of Herbs & Spices
3. Review of the Literature
This review focuses on public standards studies of Africa, but since empirical studies related to Africa are
rare, other developing economies trading with the EU also are examined. Recent studies are given priority,
but references also are made to some studies in the past decades that are relevant. Although emphasis is
given to review literature using gravity models, a quick overview of methodologies used in empirical
studies also is included. The literature in this area for other regions is impressive, although still scant, given
the importance and emergence of NTBs as major barriers to market access to countries, especially the
developing ones.
The WTO (2012) report traced the genesis of the use of NTBs to the period of General Agreement on Tariffs
and Trade (GATT), however, it is only in recent years that the frequency and incidence of NTBs have
become pronounced, probably as a result of the continuous decline in tariffs and the recent global economic
crisis, which affected most developed economies. A diagnostic analysis of literature on standards shows
that many of the studies were conducted in order to determine its impact on African and other developing
economies (see Chemnitz, Grethe, and Kleinwechter 2007; Shepherd and Wilson 2010; Brobery 2009;
Henson and Humphrey 2009b; Rio and Jaffee 2008; Beghin et al. 2011; Crivelli and Groschi 2012;
Schlueter et al. 2009; Martinez and Poole 2004; Henson and Jaffee 2006; Henson 2006). Many of the studies
concluded that standards impede trade because the relatively poor development of science and technology,
0
5
10
15
20
25
Egypt
Ghana
Morocco
35
institutions, management, absorptive capacity of producers, and other factors in these countries prevent
them from conforming to the standards in the markets of their trading partners, particularly the developed
countries.
Put differently, available evidence shows that tariffs have been decreasing and their impact is gradually
becoming marginal, although they still can be significant as a result of bilateral, regional, and multilateral
trade agreements (World Trade Organization 2012; UNCTAD 2013; Asci, Koc, and SukruErdem 2013;
Kareem 2010). In contrast, recent studies have revealed the importance of nontariff measures in global trade
(UNCTAD 2013; Fugazza 2013; Haveman and Thursby 2000; Fugazza and Maur 2006; Fontagne et al.
2010; Staiger 2011; Kareem 2012). Nontariff measures include anti-dumping, countervailing to rule of
origin, procurement, subsidies, voluntary export restriction, quotas, and technical barriers to trade such as
standards, technical regulations, conformity assessment, and certification (see UNCTAD, 2013). Technical
measures have become the most important factor in the regulation of global trade (see Fugazza 2013;
UNCTAD 2013) and their significance to Africa’s exports has been analyzed by Otsuki, Wilson, and
Sewadeh (2001); Okello and Roy (2007); and Maertens and Swinnen (2009).
Despite the importance of product standards to Africa and the region’s quest for sustainable development
through employment generation, poverty reduction, and growth, only a few studies have been conducted to
actually determine the extent to which this technical barrier to trade has influenced market access of
products originating from Africa. The paucity of empirical studies, acknowledged by Shepherd and Wilson
(2010), has inhibited research and evidence-based policy formulation by African governments that could
solve the problem of inadequate conformity and the inaccessibility of African exports to the markets of the
region’s trading partners. Studies conducted by Cheminitz, Grethe, and Kleinwechter (2007); Wilson and
Abiola (2003); Czubala, Shepherd, and Wilson (2009); and Otski, Wilson, and Sewadeh (2001) show that
Africa’s exports were restricted to the developed markets because of its inability to meet the standards set
by these markets. For instance, Dean (2008) concluded that the Food Safety Law of the EU effectively
restricted East Africa’s livestock exports to the region’s market. Mutume (2006) opined that implicit efforts
to raise African standards to the level of those in developed countries resulted in the development of extra
layers of regulatory barriers in developed countries, which led to the exclusion of cheap African exports.
However, there are studies by Ignacio (2008), Jaffee, and Henson (2005); Henson and Jaffee (2009);
Henson and Humphrey (2008); and Maertens and Swinnen (2009) that state that standards could serve as
the impetus for long-term export growth in the agricultural and food sector. These authors believe that
standards could act as a bridge between producers in Africa and consumer preferences in developed
markets, which could then serve as catalysts for improving, upgrading, and modernizing the continent’s
food supply system and enhancing Africa’s competitive capacity. Put differently, McCullough, Pingali, and
Stamoulis (2008); Swinnen (2007); and Henson (2006) said that the trade impact of standards could be both
36
restrictive and enhancing, depending on the degree of adjustment by institutions regulating trade. They
argue that the rise in standards, both private and public, has led to sudden change in the organization of
exports, especially food exports, and that this increase has affected the distribution of welfare not only
across countries but also along supply chains and among rural dwellers (World Bank 2005).
Further, a review of the literature on African standards indicates that most of the studies were conducted
on horticultural products and focused primarily on Kenya and other East African countries (see Wilson and
Abiola, 2003; Jaffee 2005). Wilson and Abiola (2003) analysed the impact of standards on the horticultural
industry in Kenya and found that, apart from the changing consumer preferences, the major challenges are
the inability to meet the maximum residual levels (MRLs) in the exporting markets and pest risk analysis.
However, the cost of compliance varies with the type of intervention and crop grown. Jaffee (2005) studied
the challenges and opportunities for Kenya’s fresh vegetable trade in the context of emerging food safety
and other standards in Europe. He examined the challenges of changing regulatory and market requirements
and the coping strategy adopted by Kenyan horticultural exporters and growers. He found they already
presume that compliance with standards is a must, given the requirements by major importers and markets
in the future, and have improved product quality to meet those requirements.
A case study by Minten, Randrianarisen, and Swinnen (2006) of a large contract-farming scheme with
smallholder producers in Madagascar’s vegetable export subsector with contract that involve on-farm
assessment and extension services indicate that they have to assure conformity with standards in all their
export produce. To buttress this point, Maertens and Swinnen (2009) gave an outcome of a shift from
procurement strategy that was 95 percent based on contracting with small holders to a reliance on 50 percent
on vertical integrated production on estate farm in vegetable exporting sector in Senegal due to rise in
standard. Aside the above studies, research were conducted on other areas of agricultural exports in Africa.
ISEAL Alliance (2008) in conjunction with Trade Standards Practitioners Network (TSPN) in Tunisia
examines the effects of organic standard on farmers. They discovered that the expansion of Tunisia’s
organic agricultural sector has significantly improved the commercial and trade performance. Henson and
Mitullah (2004) investigate the effects of EU’s food safety standards requirements on Kenya Nile Perch
exports. The imposition of these food safety requirements gingered Kenya exporters to strive in order to
meet these standards so that their exports could gain access to the market. However, the country’s domestic
food safety regulations remain weak and obsolete. Due to increased market access restriction especially in
1997-2000, efforts were made to upgrade facilities for processing export Nile Perch, which led to high cost
of compliance while domestic legislation and control mechanism were enhance. They conclude that the
Kenyan case is a case where loss of market access could propel concerted effort in complying to standard
requirement and thus, illustrate the importance of responding to emerging food safety requirements in a
proactive and effective manner.
37
In another study by Rio et al. (2009) to evaluate the extent to which investment in standard compliant by
private, government and donor agencies have contributed to improve market access by exporters of
horticulture in Uganda. Efforts were made in the study to evaluate the size of the industry and the
contributions of these stakeholders towards smallholders compliant with horticultural standard
requirements in developed markets. They found that the size of the industry is small, which affect
profitability and competitiveness, thereby adversely affecting rural income, employment and poverty. The
conclusion is that the challenge of compliance is just part of several challenges faced by the horticulture
industry in Uganda, and that government and donor agencies should look beyond the compliance challenge
in the industry to other issues such as management, applied research, technology transfer and access to
finance.
Thus, the findings of these studies were influenced by the type of standards that were covered (see Henson,
2006; Henson and Northen, 1998; Henson and Reardon, 2005; Asfaw, Mithoefer and Waibel, 2007; Anders
and Caswell, 2009; Disdier, Fontagne and Mimoun, 2008; Moenius, 2007; etc.), whether they were
harmonized or non-harmonized (Shepherd and Wilson, 2010; Czubala, Shepherd and Wilson, 2009; Chgen
and Matoo, 2008; Portugal-Perez, Reyes and Wilson, 2009). However, the commonality finding most of
these empirical studies investigating the effects of standards on the economies of Africa is the fact that the
measures would have its adverse effects on the continent’s exports at the initial stage but, in the long run,
this could change depending on extent of standards compliance attained through structural transformation
and technology advancement in these countries.
It is pertinent to note that many of the empirical studies in this area were conducted for countries and regions
other than Africa (see Van-Cauteren and de Frahan, 2004; Schlueter and Wiek, 2009; Chemnitz, Grethe
and Kleinwechter, 2007; Schlueter, Wieck and Heckelei, 2009; Crivelli and Groschl, 2012; Munasib and
Roy, 2013; Beghin, Disdier, Marette and Tongeren, 2011; etc.). Many of these studies measure the effects
of public standards on developing economies, including some African countries (Beghin, Disdier, Marette
and Tongeren, 2011; Manasib and Roy, 2013; Crivelli and Groschl, 2012; Schlueter and Wieck, 2009;
Swan, 2010; Maskus and Wilson, 2000), while few empirical literature exist on private standards (see
Henson, 2006; Henson and Humphreys, 2009a; Shepherd and Wilson, 2010; Martinez, Fearne, Caswell and
Henson, 2007). The recent development in global trade and standards requirements gave relevance to
private standards; their evolution had been traced by Henson and Humphrey (2009b). Among the studies
that have worked on public standards, Vancauteren and de Frahan (2004), Shepherd and Wilson (2010),
Swann (2010), An and Maskus (2008), Shepherd (2008), Shepherd and Wilson (2013), and Ferro et al.
(2013) have used harmonized standards, while only few used non-harmonized product standards (see
Maskus and Wilson, 2000).
38
According to Jaffee and Henson (2004), the developing countries perceived these standards as barriers to
exports, either because they lack the technical and administrative capacities needed for compliance, or due
to the fact that the standards can be applied in a protectionist manner. Martinez and Poole (2004) opined
that for the developing countries to sustain an international demand for their exports will depend on
strategic, procedural and structural initiatives to solidify the confidence and trust of importing countries on
the safety and quality of their exports. In a similar vein, Chemitz, Grethe and Kleinwechter (2007)
developed an analytical framework that lays out the problem of whether, how, and to what extent small
producers in developing countries are on the receiving end due to the rise in the prevalence of food
standards. They argue that small and medium producers hardly comply with the required standards without
support from the downstream actors, while literate and wealthy farmers can easily integrate.
Identifying the legal measures of the European Community’s food safety regime that really hinder
developing countries’ export of food products, Brobery (2009) proposes three specific measures that could
serve as solutions to these problems. First is the improvement in the harmonization of food safety measures
in the developed markets. Second, the European Commission should examine on a regular basis the
consequence of any new proposed food safety measures on developing countries. Lastly, the Commission
should strengthen its provision of development assistance to enable the developing countries to comply
with the food safety standards.
In contrast to this, Jaffee and Henson (2004) examine the changing standards environment and its effects
on developing countries’ existing and potential exports of high-value agriculture and food products, and
the partial evidence they got shows that the picture for developing countries as a whole is not necessarily
problematic and certainly is less pessimistic than the mainstream “standards-as-barriers” perspective. This
outcome is complemented by Henson and Humphrey (2009a) when they posit that the diversity food safety
standards, in their institutional form, scope, and prevalence across value chains, belies attempts to draw
general conclusions. They do however concur that standards do present challenges for developing countries,
especially on the role of governmental institutions in the regulation of food safety at the national and
international levels, but opined that many of the debates on food safety standards are fuelled by
misunderstanding of the reason for the evolution of such standards. In another study carried out by Henson
and Jaffee (2008), they argue that standards ought to be seen as “catalysts” in the context of food safety in
international trade rather than as “barriers” as dominated in the standard literature. The study does not deny
the adverse effects that public and private standards may have on agriculture and food exports from
developing countries, but rather emphasizes the need for a strategic orientation when considering the trade
effects of food safety standards. The study presents limited evidence in terms of scope and scale and stresses
the need for further research.
39
3.1 Methodological Review
This section reviews the models and estimation techniques utilized in the literature in this area of research.
A critical examination of the literature shows that many of the empirical studies on trade and standards
often adopt gravity models (Otsukietal, 2001; Wilson and Otsuki, 2004; Jun Yang and Findlay, 2008; Melo
et al. 2012; Shepherd and Wilson, 2013, Peterson et al. 2013). The extent of the adoption and application
of these models depend on the research questions and trade data (Head and Mayer, 2013; Baldwin and
Taglioni, 2007; Henson and Loader, 2001). Given the theoretical framework of gravity models, its
effectiveness in modelling trade relations (bilateral, regional and multilateral), investment, migration, aid,
and regional integration has been widely acknowledged (Baldwin and Taglioni, 2007; Head and Mayer,
2013). Recently, some studies have investigated the extensive and intensive margins of trade in the product
standards literature using gravity models (Helpman et al. 2008; Belenkij, 2009; Munasib and Roy, 2013),
while other studies that have used other econometric models to study these margins of trade (Jongwanich,
2009; Xiong and Beghin, 2011; Liu and Yue, 2011; Schuster and Maerter, 2013; Grundke and Moser,
2013). The similarity in these studies is the Heckman specification, which was modified by Helpman et al.
(2008).5 A critical evaluation of these studies show that their results depend on the model specifications
(Santos Silva and Tenreyro, 2006, 2011; Gomez-Herrera, 2011), estimation techniques (Santos, Silva and
Tenreyro, 2009; Flam and Nordström, 2011; Helpman et al. 2008; Martinez-Zarzoso, 2013), data
(Martinez-Zarzoso, 2013; Cipollina and Salvatici, 2008; Burger et al. 2009) and the countries or regions of
focus (Martinez-Zarzoso, 2013).
As such, the focus of recent gravity modelling is on the appropriate specifications, including variables and
types of data to be used in gravity models’ estimation (Shepherd, 2012; UNCTAD-WTO 2011; Baldwin
and Taglioni, 2007, 2011; Westerlund and Wilhelmsson, 2006; Santos Silva and Tenreyro, 2009; Martinez-
Zarzoso, 2013). Although Anderson and Wincoop (2003) give a sound theoretical micro-foundation to the
use of gravity model, the study uses cross-sectional data, which is not the type of data this study shall use.
Mayer and Zignago (2005) use a panel data covering both developed and developing counties with their
imports, GDPs, and prices in relative terms; however, Baldwin and Taglioni (2007) show the importance
of using the nominal values of these variables at unidirectional trade and GDPs levels at an aggregated trade
level. Haveman and Thursby (2000) specify a gravity model in unidirectional trade with nominal values of
imports and GDPs at a disaggregated product levels and with the inclusion of trade policy variables, but it
is also cross-sectional for two years, 1994 and 1998. A critical examination of all these studies and others
was recently carried out by Head and Mayer (2013); after reviewing existing facts on gravity modelling
and established sound estimation and interpretation of gravity equations for bilateral trade, they argue
5 The implication of these specifications is that firms’ heterogeneity was evaluated.
40
against the reliance on one particular method to modelling gravity equation and instead they advocate a
workhorse, toolkit and cookbook approach.
Economic theory indicates that product standards could either inhibit or enhance trade (Maskus, Otsuki and
Wilson, 2005) irrespective of the methodology. Available facts from empirical studies gave credence and
support to this theoretical assertion. Some of the early and widely cited studies in the area are Gesiorek et
al. (1992), Swann et al. (1996), Moenius (1999), Otsuki et al. (2001), Wilson and Otsuki (2003), and Wilson
et al. (2002). An econometric model specified by Swann et al. (1996) constructs standards data through a
simple count of the number in the industry to investigate the effects of standards on Britain’s trade from
1995 to 1991. Prior to Swann et al. (1996), Gasiorek et al. (1992) used the computable general equilibrium
(CGE) model for trade impact of standards. Wilson and Otsuki (2003) examine the effects of adopting food
safety standards and the harmonization of standards on global food trade patterns. They estimate the effects
of aflatoxin standards in 15 importing (four developing) countries on exports from 31 (21 developing)
countries using a gravity model. Also, Mangelsdorf, Portugal-Perez, and Wilson (2002) investigate the
impact of voluntary and mandatory standards on China’s agricultural and food exports using a new dataset
on Chinese food standards that covers seven products from 1992-2008 in a gravity equation.
Addtionally, Chevassus-Lozza et al. (2008) use a gravity model to find direct trade impact of sanitary
measures, which they find to exert insignificant negative impact when phytosanitary and quality measures
are used. Asfaw, Mithofer and Waibel (2007) examine the costs of compliance, the factors explaining the
smallholder decision to adopt EU quality standards, and the impact of the standards on farm financial
performance by developing a two-stage standard treatment effect model to account for self-selection as a
source of endogeneity. The analysis is based on a random cross-sectional sample of 439 small-scale export
vegetable producers in Kenya whose production was monitored in 2005/2006. Maerten and Swinnen (2009)
quantify the income and poverty effects of such high-standards trade and integrationof labour market effects
by using company and household survey data from the vegetable export chain in Senegal.
Liu and Yue (2011) use a novel nested variable elasticity of substitution (VES) utility model to determine
the impact of SPS standards on trade. This utility model was used to investigate the impact of EU’s Hazard
Analysis Critical Control Point (HACCP) standards on EU orange juice trade and social welfare. It was
found that the standards’ effect on trade and welfare is underestimated when the elasticity of substitution is
restricted to be constant. Chen, Otsuki and Wilson (2006) investigate the effects of standards on the
propensity to exports and the market diversification in developing countries using the gravity model in a
World Bank TBT survey database of 619 firms in 17 developed countries. In addition, the research by Jun
Yang and Findlay (2008) measures the impact of food safety standards on China’s agricultural exports
following the experience China had in agricultural dispute with the developed countries. The study uses a
gravity model of agricultural product trade to test the effects of the residue standards on China’s exports of
41
vegetables (Chlorpyrifos MRL) and aquatic products (Oxytetracycline MRL). Also, Jongwanich (2009)
determines the impact of food safety standards on processed food exports in developing countries using
inter-country cross-sectional econometric analysis of processed food exports in developing countries. Melo
et al. (2012) use a gravity model to investigate whether SPS regulation affects developing countries’ exports
by conducting a survey that asked Chilean fresh fruit exporters to evaluate the stringency for 16 countries
and four fresh fruits and creating an index that incorporates several aspects of SPS regulation. Similarly,
Wei, Huang and Yang (2012) assess the impact of food safety standards on tea exports from China, the
world’s largest tea producer and exporter. The study uses a gravity model to show that the MRL of
pesticides imposed by the importing countries have significantly affected China’s tea exports. Schuster and
Maesters (2013) investigate the effects of food standards on export performance of individual firms at
intensive and extensive margins of trade, using a unique 18 years panel data from 95 asparagus export firms
in Peru and apply fixed effects and system GMM models.
Okello and Roy (2007) use a qualitative analysis to evaluate the impact of food standards in African Green
Bean exports on small farmers in Ethiopia, Kenya and Zambia. Xiong and Beghin (2011) provide an ex-
post econometric examination of the harmonization and the tightening of the EU maximum residue limit
(MRL) of aflatoxins in 2002, and its impact on Africa’s exports of groundnut products. Similarly, Ferro,
Wilson and Otsuki (2013) determine the impact of food safety standards on agricultural exports by creating
a standards restrictiveness index using newly available data on maximum residue levels of pesticides for
61 importing countries in a gravity model. Grundke and Moser (2013) examine the costs of non-compliance
with the product standards for trading partners of the United States.
In another empirical study by Peterson et al. (2013), they evaluate the trade restrictiveness of SPS measures
on the US fresh fruit and vegetable imports, constructing a novel database of US phytosanitary measures
and matching these to 47 fresh fruit and vegetable products from 89 exporting countries over the period
1996-2008. A product-line gravity model that accounts for zero trade flows is developed to determine the
trade impact of different pest-mitigating measures. Also using the gravity model, Shepherd and Wilson
(2013) estimate the results with the Poisson pseudo–maximum likelihood (PPML) estimator to show that
product standards in food and agricultural markets in the EU could have significant trade effects.
3.2 The Data
The data sources for the next section come from the following sources. Perinom is used to source for the
EU harmonised product standards data. The import refusal used in the descriptive analysis is sourced from
the Rapid Alert for Foods and Feeds (RASFF) and UNIDO’s trade standards compliance database, while
the export data comes from the World Integrated Trade Solution (WITS) database. The economic size of
the trading partners, i.e. the GDP, is sourced from the World Development Indicators (WDI). This study
42
shall cover the period from 1995 to 2012 for 49 African countries as exporters across all the estimations.
This period includes the year of the establishment of World Trade Organisation (WTO) when decline of
tariffs were pronounced among trading partners while the incidences of NTBs were on the increase6. The
EU is used as bloc that is a unified entity in this study.
The technical regulation vis-a-vis product standards were not in usable form when obtained, as they were
in written form of rules and regulations. I coded these rules and regulations in their number of occurrence.
Cumulative harmonised standards data were used with the deduction of any withdrawal and addition of
new regulations7 (see next section for the calculation). This study selected three commodities; two of them
are high value, one low. The high value commodities are fish and vegetables while there other is the
traditional cash crop, coffee. They were obtained from WITS at the HS 4 level. The economic mass
variables are the nominal GDPs of the importing and exporting countries obtained from the WDI.
4. The Empirical Strategy
Many of the studies in the literature that look at the issue of bilateral and multilateral trade relations use
gravity models in the determination and evaluation of the issues raised and in testing their various
hypotheses. Major reasons cited for the use of this model are that it takes care of the political, spatial and
temporal factors in the trade relations (see Head and Mayer, 2013). The simplest form of trade gravity
model assumes that the volume of trade between any two trading partners is an increasing function of their
national incomes and populations and a decreasing function of the distance between them.
There is no more doubt about the gravity model’s theoretical framework, which could be found in almost
every trade model; especially that of the increasing returns, which are important causes of perfect product
specialization and gravity equation as shown by Evenett and Keller (2003). The theoretical framework for
this study’s model is derived from the new trade theory, which makes provisions for economics of scale
and imperfect markets. Bergstrand (1990) provides a description of the link between gravity equation and
bilateral trade patterns in a monopolistic competition framework of the new trade theory. Anderson (1979),
Bergstrand (1990), and Helpman and Krugman (1985) have derived gravity equations from trade models
based on product differentiation and increasing returns to scale. This model is also extensively used by
Shepherd and Wilson (2010), Czubala, Shepherd and Wilson (2009), Portugal-Perez, Reyes and Wilson
(2009), and Shepherd (2007) in the determination of the impact of non-tariff barriers on exports.
This study investigates the agricultural export effects of product standards in the trade relations between
Africa and the EU. A two-stage Heckman gravity model specification is be adopted. Heckman model has
6 The WTO Report 2012 confirms this. 7That is, in 1995 if there are 2 regulations for a product and in 1996, another 2 is added, then I added them together to give total regulations for the product as 4. And if by the following year, which is 1997 no addition to the regulation but a withdrawal of a regulation previously in existence, then for the year the total regulation for the product is 3,and so on.
43
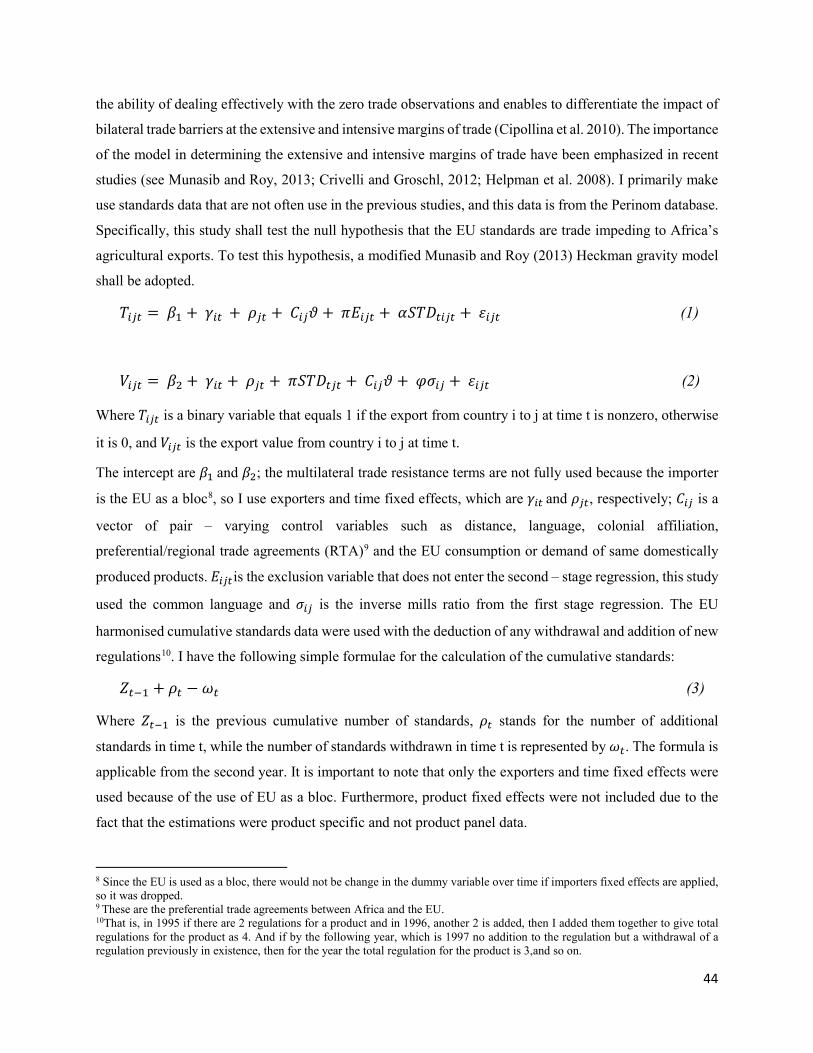
the ability of dealing effectively with the zero trade observations and enables to differentiate the impact of
bilateral trade barriers at the extensive and intensive margins of trade (Cipollina et al. 2010). The importance
of the model in determining the extensive and intensive margins of trade have been emphasized in recent
studies (see Munasib and Roy, 2013; Crivelli and Groschl, 2012; Helpman et al. 2008). I primarily make
use standards data that are not often use in the previous studies, and this data is from the Perinom database.
Specifically, this study shall test the null hypothesis that the EU standards are trade impeding to Africa’s
agricultural exports. To test this hypothesis, a modified Munasib and Roy (2013) Heckman gravity model
shall be adopted.
𝑇𝑇𝑖𝑖𝑖𝑖𝑖𝑖 = 𝛽𝛽1 + 𝛾𝛾𝑖𝑖𝑖𝑖 + 𝜌𝜌𝑖𝑖𝑖𝑖 + 𝐶𝐶𝑖𝑖𝑖𝑖𝜗𝜗 + 𝜋𝜋𝐸𝐸𝑖𝑖𝑖𝑖𝑖𝑖 + 𝛼𝛼𝑆𝑆𝑇𝑇𝑆𝑆𝑖𝑖𝑖𝑖𝑖𝑖𝑖𝑖 + 𝜀𝜀𝑖𝑖𝑖𝑖𝑖𝑖 (1)
𝑉𝑉𝑖𝑖𝑖𝑖𝑖𝑖 = 𝛽𝛽2 + 𝛾𝛾𝑖𝑖𝑖𝑖 + 𝜌𝜌𝑖𝑖𝑖𝑖 + 𝜋𝜋𝑆𝑆𝑇𝑇𝑆𝑆𝑖𝑖𝑖𝑖𝑖𝑖 + 𝐶𝐶𝑖𝑖𝑖𝑖𝜗𝜗 + 𝜑𝜑𝜎𝜎𝑖𝑖𝑖𝑖 + 𝜀𝜀𝑖𝑖𝑖𝑖𝑖𝑖 (2)
Where 𝑇𝑇𝑖𝑖𝑖𝑖𝑖𝑖 is a binary variable that equals 1 if the export from country i to j at time t is nonzero, otherwise
it is 0, and 𝑉𝑉𝑖𝑖𝑖𝑖𝑖𝑖 is the export value from country i to j at time t.
The intercept are 𝛽𝛽1 and 𝛽𝛽2; the multilateral trade resistance terms are not fully used because the importer
is the EU as a bloc8, so I use exporters and time fixed effects, which are 𝛾𝛾𝑖𝑖𝑖𝑖 and 𝜌𝜌𝑖𝑖𝑖𝑖, respectively; 𝐶𝐶𝑖𝑖𝑖𝑖 is a
vector of pair – varying control variables such as distance, language, colonial affiliation,
preferential/regional trade agreements (RTA)9 and the EU consumption or demand of same domestically
produced products. 𝐸𝐸𝑖𝑖𝑖𝑖𝑖𝑖is the exclusion variable that does not enter the second – stage regression, this study
used the common language and 𝜎𝜎𝑖𝑖𝑖𝑖 is the inverse mills ratio from the first stage regression. The EU
harmonised cumulative standards data were used with the deduction of any withdrawal and addition of new
regulations10. I have the following simple formulae for the calculation of the cumulative standards:
𝑍𝑍𝑖𝑖−1 + 𝜌𝜌𝑖𝑖 − 𝜔𝜔𝑖𝑖 (3)
Where 𝑍𝑍𝑖𝑖−1 is the previous cumulative number of standards, 𝜌𝜌𝑖𝑖 stands for the number of additional
standards in time t, while the number of standards withdrawn in time t is represented by 𝜔𝜔𝑖𝑖. The formula is
applicable from the second year. It is important to note that only the exporters and time fixed effects were
used because of the use of EU as a bloc. Furthermore, product fixed effects were not included due to the
fact that the estimations were product specific and not product panel data.
8 Since the EU is used as a bloc, there would not be change in the dummy variable over time if importers fixed effects are applied, so it was dropped. 9 These are the preferential trade agreements between Africa and the EU. 10That is, in 1995 if there are 2 regulations for a product and in 1996, another 2 is added, then I added them together to give total regulations for the product as 4. And if by the following year, which is 1997 no addition to the regulation but a withdrawal of a regulation previously in existence, then for the year the total regulation for the product is 3,and so on.
44
The regression equation in the first step of this model is known as the probit regression, while the second
step is the linear regression for the volume or value of trade flows. The second step takes into consideration
the selection into trade flows as characterized in the first step with the inclusion of the inverse mills ratio
as one of the explanatory variables. The inverse mills ratio is the ratio of the probability density function
(PDF) and the cumulative density function (CDF) of the normal distribution, which is evaluated at the
predicted outcomes divided by the standard error of the probit estimation.
The exclusion variable in the first step is the one that is highly correlated with a country’s propensity to
export and not significantly correlated with the volume of export. Previous studies have used different
exclusion variables; in fact, Helpman et al. (2008) uses common religion in their pioneering study of
estimating the extensive and intensive margins of trade in a heterogeneous firm model. This study uses
common language as the exclusion variable that does not go into the second-step estimation (an exclusion
variable is the one that influences the selection process but does not affect the outcome equation). The
inclusion of the exclusion variable is used to prove the robustness of the estimates; that is, that the estimation
of the model is free of any bias (Gomez-Herrera, 2013). Thus, an exclusion variable is used in the probit
model as a valid exclusion restriction that controls for the fixed costs of exporting and not its variable cost
(Ferro, et al., 2013). Cameron and Trivedi (2010) opined that the exclusion restriction is used to correct the
identification problem that could arise as a result of the nonlinearity implied by the probit selection model.
The estimation of gravity model with the flow of trade is often confronted with double biases (Helpman et
al. 2008). First, there is the standard sample selection problem at the intensive margins regression where
the sample of nonzero exports is non-random. The inclusion of the inverse mills ratio in the Heckman model
as an explanatory variable in the second step has been used to correct the biasness in the coefficients in the
second stage. The second bias is the omitted variable bias due to firms’ heterogeneity in the extensive
margins of trade as identified by Helpman et al. The trade fixed costs and the productivity distribution of
firms determine the number of exporting firms. In line with this, it is the firm that has its productivity
beyond a certain threshold that end up exporting. As such, in this study standards are fixed costs of exporting
and thereby affect the extensive margins of trade.
On the other hand, although part of the trade policies used in the EU, tariffs are not included in the analysis:
first, because this study actually focuses specifically on products standards, which are non-tariff barriers;
and second, studies have found that tariffs are declining and the trade impact of tariffs in Africa is
indistinguishable from zero given that the continent enjoyed preferential trade tariffs in this market
(Czubala et al. 2009; Kareem, 2010; Fugazza, 2013).
Different methods have been used in the product standards literature to measure standards. Brenton et al.
(2001), Henry DeFrahanVancauteren (2006), Chen and Matoo (2004), and Baller (2007) have used dummy
45
variables for standards; the dummies capture whether directives were given by the EU11 on their selected
products or not for the years considered. Some studies, such as Fontagne et al. (2005) and Disdier et al.
(2007) use the TBT standards notification at the WTO, but these are usually found to be inaccurate (see
Czubala et al. 2009) given that countries’ notifications are often inadequate. Czubala et al. (ibid.), and
Shepherd and Wilson (2010; 2013) use the frequency method and further aggregate the data to differentiate
across its sub-sector while adding any amendment to the existing standards. In the case of withdrawal, they
assume the standard is still in force for the entire year. Munasib and Roy (2013) use the method of “the
bridge to cross.” They use the difference between the standards in the exporting and importing countries as
the bridge to cross, which indicates the remaining standard requirements that will be faced by exporters in
the importing countries after complying the with their domestic standards. I, however, found this method
inappropriate for the trade relations between developing countries (especially Africa) and developed
countries. Most African countries do not have official standards requirements, and where they are available,
implementations or applications are very inadequate due to the drive for exports.
The standard restrictiveness method is used by Ferro et al. (2013) and Li and Beghin (2013); they use the
stringency of MRLs for pesticides and a few veterinary drugs in agricultural and food trade. This study,
however, uses cumulative or aggregated standards for the selected food products, similar to Czubala et al.
(2009), taking into consideration all the amendments and/or withdrawals to the standards during the period
under consideration. In contrast to Czubala et al. (2009), who applied these standards to textiles products,
this study focuses on selected food products in a Heckman model. It also goes beyond their data point of
1995 to 2003 by extending the data point to include recent information at the Perinorm database for 1995
to 2012.
5. The Findings
The results of two-step Heckman model are present in this section. All the extensive margins of trade results
are shown in the first part, while the other part shows the intensive margins of trade results. The estimated
results have been corrected for the robust cluster errors that often arise in this type of model. The exporter
and time fixed effects were included in the estimation but not reported due to the large size of the cross-
sections. I have estimated the extensive model using the probit regression since the dependent variable in
the model is binary. This estimation corrects the robust cluster errors and distils the inverse mills ratio from
the first-step regression, which was used in the second-step regression (intensive margins estimation) as an
explanatory variable in order to know whether any selection bias has been corrected or mitigated. The
second-step equation was estimated with the generalised least squares method in order to mitigate the
problem of heterogeneity associated with panel regression.
11 EU committee for standardization (CEN)
46
Extensive Margin of Export: Fish Table 15 presents the results of the selected agricultural products-- fish, vegetable and coffee-- in the
extensive margins of export estimation. The economic mass of the exporting countries (exporters’ GDPs)
propel the probability of exporting African fish to the EU. There is increased probability of exporting fish
by new exporters, those that have exported in the past but are no longer exporting (disappearing exporters)
and would want to export in the future, as well as those that are currently exporting with the probability of
expanding their exports. One can observe that Africa’s economic growth enhances the possibility of new
country entry into exporting of fish such that a percentage increase in GDP would raise the probability of
new exporters, disappearing exporters, and existing exporters’ fish export to the EU by 0.25%. However,
the EU expenditure on Africa’s fish remains insignificant. The EU standards on fish hinder export at the
extensive margins, which means that the standards are restrictive such that they significantly prevent export
of fish at the extensive margin. This implies that compliance to the standard requirements often increase
the fixed costs substantially such that it discourage potential new firms from exporting. The trade costs
proxy by distance does not significantly affect export of fish at this margin of trade, while the regional trade
agreements are significant in propelling trade. Common language and domestic demand of locally
produced fish are not significant factors to consider at the extensive margins of export. This implies that
the demand for domestically produced fish does not hinder the consumption of imported ones. Inverse
relationship exists between language and extensive margins of fish export.
47
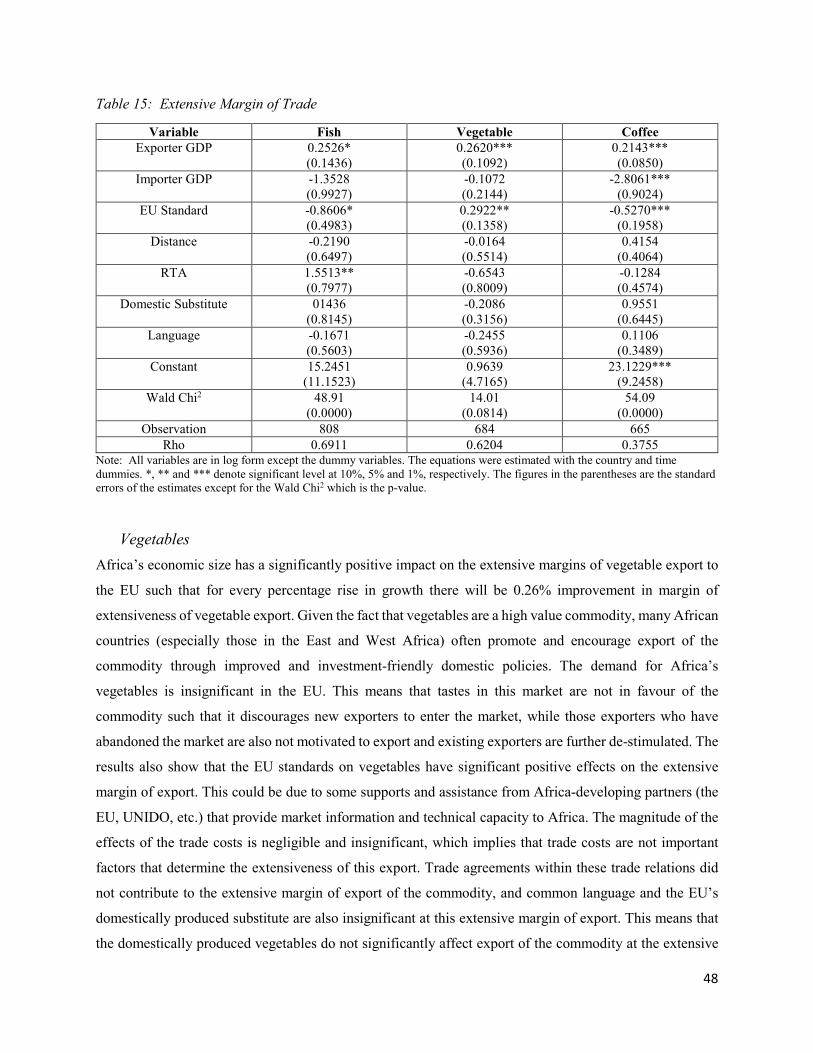
Table 15: Extensive Margin of Trade
Variable Fish Vegetable Coffee Exporter GDP 0.2526*
(0.1436) 0.2620*** (0.1092)
0.2143*** (0.0850)
Importer GDP -1.3528 (0.9927)
-0.1072 (0.2144)
-2.8061*** (0.9024)
EU Standard -0.8606* (0.4983)
0.2922** (0.1358)
-0.5270*** (0.1958)
Distance -0.2190 (0.6497)
-0.0164 (0.5514)
0.4154 (0.4064)
RTA 1.5513** (0.7977)
-0.6543 (0.8009)
-0.1284 (0.4574)
Domestic Substitute 01436 (0.8145)
-0.2086 (0.3156)
0.9551 (0.6445)
Language -0.1671 (0.5603)
-0.2455 (0.5936)
0.1106 (0.3489)
Constant 15.2451 (11.1523)
0.9639 (4.7165)
23.1229*** (9.2458)
Wald Chi2 48.91 (0.0000)
14.01 (0.0814)
54.09 (0.0000)
Observation 808 684 665 Rho 0.6911 0.6204 0.3755
Note: All variables are in log form except the dummy variables. The equations were estimated with the country and time dummies. *, ** and *** denote significant level at 10%, 5% and 1%, respectively. The figures in the parentheses are the standard errors of the estimates except for the Wald Chi2 which is the p-value.
Vegetables Africa’s economic size has a significantly positive impact on the extensive margins of vegetable export to
the EU such that for every percentage rise in growth there will be 0.26% improvement in margin of
extensiveness of vegetable export. Given the fact that vegetables are a high value commodity, many African
countries (especially those in the East and West Africa) often promote and encourage export of the
commodity through improved and investment-friendly domestic policies. The demand for Africa’s
vegetables is insignificant in the EU. This means that tastes in this market are not in favour of the
commodity such that it discourages new exporters to enter the market, while those exporters who have
abandoned the market are also not motivated to export and existing exporters are further de-stimulated. The
results also show that the EU standards on vegetables have significant positive effects on the extensive
margin of export. This could be due to some supports and assistance from Africa-developing partners (the
EU, UNIDO, etc.) that provide market information and technical capacity to Africa. The magnitude of the
effects of the trade costs is negligible and insignificant, which implies that trade costs are not important
factors that determine the extensiveness of this export. Trade agreements within these trade relations did
not contribute to the extensive margin of export of the commodity, and common language and the EU’s
domestically produced substitute are also insignificant at this extensive margin of export. This means that
the domestically produced vegetables do not significantly affect export of the commodity at the extensive
48
margin. In conclusion, the results for vegetables show that the economic size of the exporters and the
standards in place are the significantly relevant factors that determine vegetable exports at this extensive
margin of export.
Coffee The coffee results suggest that the economic mass of the Africa significantly contributes to the improvement
in coffee export at the extensive margin, while that of the EU did not significantly propel export at this
extensive margin. EU standards, on the other hand, have significant negative impact on coffee extensive
margin such that for every additional standard requirement, export at this extensive margin will decline by
about 0.52%. This confirms the findings of Chevassus-Lozza et al. (2008) and Disdier and Marette (2010).
Distance is insignificant at this extensive margin of export; and the same can be said of regional trade
agreements. Domestic substitute is also insignificant at this margin of trade. Common language is a factor
that enhances trade of this commodity, although it is not significant. In conclusion, at the extensive margins
of export, economic mass of the trading partners as well as standards are the relevant determining factors
of coffee export to the EU. They constitute significant factors to be considered by potential, disappearing
and existing exporting countries of coffee in Africa to the EU markets.
Thus in all the commodities selected for the extensive margins of export analysis, except for fish and
vegetables where the EU’s incomes are insignificant, the economic mass of the trading partners is important
and enhances export, and standards are statistically significant for all the commodities. Only the EU
standards on vegetables enhance export at the extensive margin. In a nutshell, the impact of standards at
this margin of export is commodity specific, so generalization cannot be made of the impact of standards
from the analysis of a single commodity to others. Also, the domestically produced products do not affect
export of these products to Africa’s exporters at this margin.
Intensive Margins of Exports: Fish The results of the intensive margins of exports are presented in Table 16, where one can see that the
intensive export of fish has not been significantly encouraged by the continent. This implies that income in
Africa has not been used to propel the volume of fish export to the EU such that for every percentage rise
in growth, there will be 0.7% corresponding neglect of fish export, despite the demand in this market. This
indicates that the commodity is not of priority to the continent, especially those countries that are
landlocked. Furthermore, the absorptive capacity of this commodity in the EU is very high, which depicts
the fact that there is demand for this commodity if the commodity could be promoted for export to the
market. In other words, expenditures on African fish in this market are very encouraging-- if only supply
and the quality of the commodity could be improved upon. This could be due to the adequate compliance
to the EU standards, which positively affected supply to this market. To this end, the EU standards did not
49
significantly hinder the flow of this commodity. The trade costs associated with the flow of export of this
commodity are not significant. Regional trade agreements do not contribute significantly to the flow of
exports of this commodity, while the consumption of domestic fish in the EU significantly affects the import
of fish from Africa, indicating that as more domestically produced fish are consumed there is lower
importation of African fish. The results show that there is no selection bias in the model going by the
coefficient of the inverse mills ratio, indicating that I have correctly specified the selection equation.
Vegetables This is the other high value commodity considered in this study besides fish. Africa’s economic size has
not been used to promote the export of vegetables to the EU. This implies that there is low motivation to
export vegetables to the EU for every percentage increase in the income level. In contrast, there is absorptive
capacity in the importing countries for this commodity. In other words, expenditures on vegetables in the
importing countries does encourage exports at the intensive margins for Africa.
The results show that it is very necessary to comply with the standard requirements before market access
can be assured. Wilson and Otsuki (2004), Ganslandt and Markusen (2001), and Anders and Caswell (2009)
echo this observation. Distance does not significantly affect this commodity at this margin of export.
Domestically produced vegetables do not significantly affect import of Africa’s vegetables, which means
any rise in the consumption of domestically produced vegetable would not affect import of the commodity
from Africa. The inverse mills ratio indicates that the selection bias in the estimation has been rectified and
the results are robust.
A further examination of the results shows that the sanitary and phytosanitary measures in the EU are
important to vegetable export at this intensive margin. In addition to this, the regional trade agreements
between the trading partners and the consumption of domestically produced vegetable are relevant factors
determining the intensiveness of Africa’s vegetable export to this market.
50
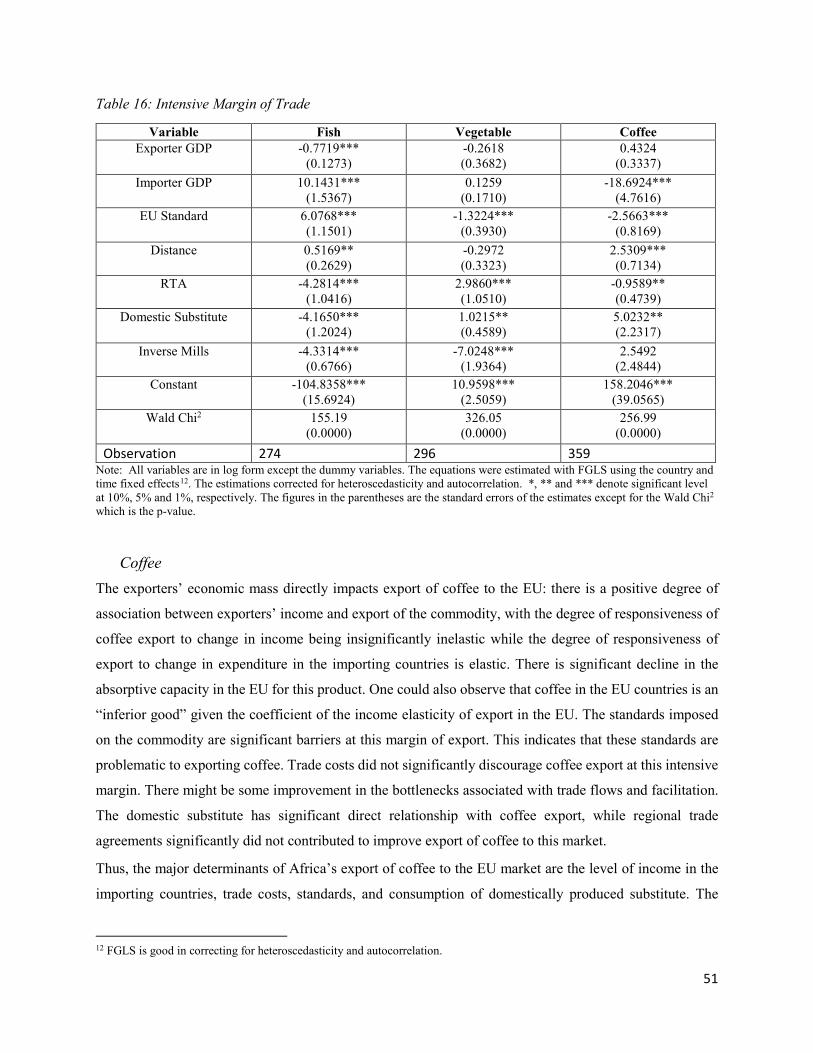
Table 16: Intensive Margin of Trade
Variable Fish Vegetable Coffee Exporter GDP -0.7719***
(0.1273) -0.2618 (0.3682)
0.4324 (0.3337)
Importer GDP 10.1431*** (1.5367)
0.1259 (0.1710)
-18.6924*** (4.7616)
EU Standard 6.0768*** (1.1501)
-1.3224*** (0.3930)
-2.5663*** (0.8169)
Distance 0.5169** (0.2629)
-0.2972 (0.3323)
2.5309*** (0.7134)
RTA -4.2814*** (1.0416)
2.9860*** (1.0510)
-0.9589** (0.4739)
Domestic Substitute -4.1650*** (1.2024)
1.0215** (0.4589)
5.0232** (2.2317)
Inverse Mills -4.3314*** (0.6766)
-7.0248*** (1.9364)
2.5492 (2.4844)
Constant -104.8358*** (15.6924)
10.9598*** (2.5059)
158.2046*** (39.0565)
Wald Chi2 155.19 (0.0000)
326.05 (0.0000)
256.99 (0.0000)
Observation 274 296 359 Note: All variables are in log form except the dummy variables. The equations were estimated with FGLS using the country and time fixed effects12. The estimations corrected for heteroscedasticity and autocorrelation. *, ** and *** denote significant level at 10%, 5% and 1%, respectively. The figures in the parentheses are the standard errors of the estimates except for the Wald Chi2 which is the p-value.
Coffee The exporters’ economic mass directly impacts export of coffee to the EU: there is a positive degree of
association between exporters’ income and export of the commodity, with the degree of responsiveness of
coffee export to change in income being insignificantly inelastic while the degree of responsiveness of
export to change in expenditure in the importing countries is elastic. There is significant decline in the
absorptive capacity in the EU for this product. One could also observe that coffee in the EU countries is an
“inferior good” given the coefficient of the income elasticity of export in the EU. The standards imposed
on the commodity are significant barriers at this margin of export. This indicates that these standards are
problematic to exporting coffee. Trade costs did not significantly discourage coffee export at this intensive
margin. There might be some improvement in the bottlenecks associated with trade flows and facilitation.
The domestic substitute has significant direct relationship with coffee export, while regional trade
agreements significantly did not contributed to improve export of coffee to this market.
Thus, the major determinants of Africa’s export of coffee to the EU market are the level of income in the
importing countries, trade costs, standards, and consumption of domestically produced substitute. The
12 FGLS is good in correcting for heteroscedasticity and autocorrelation.
51
results for all the selected commodities at the intensive margins of exports show that the products’ standard
requirements are significant factors determining market access to the EU countries for all the products.
Additional critical factors for these exports include the economic mass of the trading partners, regional
trade agreements, and the consumption of domestic substitute.
6. The Importance of the Findings to CAADP
The empirical findings of this study suggest that the trade impact of the EU standards is commodity-
specific, so, it might not be plausible to generalize the impact from the analysis of a product. At the
extensive margins of export, the income growth experienced by many African countries in recent years
have not substantially translated into improvement in the quality of export base, number of exporting firms,
and revitalization of the moribund exporting firms. These results show that many of the purported
investments aimed at improving agricultural outputs and exports of these commodities have not yielded the
necessary and expected outcomes as contained in the CAADP Pillar II document. It could be that the
selected commodities used in the analyses might have received little of these investments. As is often found
in many studies, the supply capacity of the continent is inadequate for these commodities, especially
vegetable and fish. This is usually attributable to the supply constraints faced by producers, especially from
the domestic policies. CAADP, as a driving force in propelling growth in agricultural outputs and exports,
could ensure that outputs of agriculture are of the quality standards required in the importing markets
(especially in the EU). Partnering with science and technology institutions at both the domestic and
international level will provide the technologies that are required to comply with the product standards, in
addition to enhancing the output of these products. CAADP should go beyond focusing only on aflatoxins,
e.g. in ‘Partnership for Aflatoxins Control in Africa (PACA)’ since standard requirements, particularly
those that affect Africa are many and are not limited to aflatoxins alone. There should be intensive and
comprehensive efforts from CAADP in mitigating as well as controlling the incidences of unwanted
elements in export commodities.
This study also finds that there is demand for the selected commodities in the EU if only quality exports
could get to the market, particularly fish export. In other words, taste and preferences are in favour of the
selected African commodities in this market. This shows that the continent needs to increase exports by
motivating exporters at the extensive margins, particularly the disappearing exporting firms, through
investment-friendly domestic policies and improvement in trade facilitation. CAADP should not only
ensure adequate budget allocation to agricultural sector, but should also see that such allocations go to the
development of commodities that have potential and probability of accessing this market with the standard
requirements.
52
Although standards seem to be trade inhibiting at the extensive margins of export, except for vegetables,
compliance to these standards should be the ultimate priority for Africa. CAADP could assist in this under
Pillar II with lead institutions and country implementing agencies by building the capacity of producers,
particularly educating them on the quality issue and providing them with adequate market information on
the technical regulations and standards in their prospective and/or current export markets. This could go a
long way towards the level of compliance, especially at the smallholder farmers’ level. The findings further
show that export of these products at the extensive margins have great potential. CAADP could encourage
export of these products through adequate investments and technological supports to the agricultural food
sector specifically for these products.
In the intensive margins of exports, the selected commodities have the potential of accessing this market if
outputs could be improve upon at the domestic levels. Despite the potential that Africa has in this market,
the degree of responsiveness of fish exports to African income is not encouraging in relation to the export
potential of the commodity. This calls for specific intervention by CAADP to increase export of fish by the
continent by providing technical and institutional supports to exporting countries. Furthermore, the findings
show that there is adequate absorptive capacity for fish export from Africa in the EU if only the export
volume could be increased and quality improved upon. Thus, efforts must be made to improve production
at this margin of trade. Each CAADP country’s collaborating institution could be used to facilitate the
improvement in the level of fish output in the country through adequate investments with domestic and
international supports for improved production technology. Education and adequate training should also be
given to illiterate smallholder farmers, especially those in the rural areas, if possible to organize them into
exporting groups. This might enhance export since it will reduce cost of exporting to each farmer. Standards
might be trade restrictive at the margin of export (except in the case of fish), but farmers must be encouraged
to produce quality outputs with the assistance of commodity-specific research institutions at the local,
regional, and international levels. CAADP could also improve exports African exports of these selected
commodities by improving the partnership and alliance between the African Union and the EU, particularly
in regional trade agreements, which presently do not really contribute to exports of these commodities at
this margin of trade. Trade assistance and support could be solicited from the EU through preferential trade
arrangement or agreements that have the potential of accelerating the propensity to import from Africa.
The findings of this study give support and credence to the output of research funded by NEPAD-CAADP
in 2005 (see CAADP document, 2003) which projected that foreign demand for commodities and high-
value exports would grow from $8 billion USD and $3 billion USD in 2000, respectively, to roughly $10
billion USD in each category by 2030. Since taste and preference for these selected commodities are in
favour of Africa, as found in this study, the projected export growth as cited above is feasible. There is a
caveat, however: the attainment of this projected export growth and the potential income of $4.5 billion
53
USD from all exporting markets in 2030 could only be achieved if concerted efforts are geared towards
accelerating exports at both extensive and intensive margins. The inadequate export of these commodities
to this market thus far indicates an implementation deficiency of the CAADP Pillar II, which seeks to attain
at least a 4 percent annual growth of agricultural outputs and exports so as to induce a growth rate of 6
percent in the rest of the economy. This study affirms that some achievements have been made in the
CAADP Strategic Area B, which aimed to improve the investment in commercial and trade infrastructure
to lower the cost of supplying national, regional, and international markets. I found that the costs of trading
in all the commodities are favourable and did not inhibit trade. Trade costs, though shown to be insignificant
in its impact on exports from Africa, are still an obvious challenge due to the enormous infrastructure and
technology requirements involved; for instance, harvesting the commodity on the farm and adequately
preserving to be transported the same day by specialized van to the airport for onward delivery by the
specialized cargo aircraft to the importing country. The costs incurred using these technologies are high
and involve huge capital not easily secured. The CAADP-Pillar II country agency could assist producers
with the provision of these technologies, especially by partnering and engaging in alliance with international
institutions so that these technologies could be available at affordable costs.
In this way, this study reaffirms the ultimate objective of CAADP Pillar II: accelerating growth in the
agricultural sector by raising the capacity of private entrepreneur, including commercial and smallholder
farmers, to meet the increasingly complex cost, quality and logistical requirements of domestic, regional,
and international markets. Focus on strategic value chains with the greatest potential to generate broad-
based income growth and create wealth in the rural areas and the rest of the economy has not yet been fully
realized due to inadequacies in the implementation of the programme.
7. Conclusion
This study investigates the export effects of EU product standards on the agricultural sector of the African
economy. The issue of standards among the non-tariff barriers is very vital to Africa, and compliance has
been the necessary condition in accessing this market. In order to boost Africa’s exports and their quality,
the CAADP Pillar II strives to build the capacity of producers, both the commercial and smallholder
farmers, and encourage infrastructural development through adequate policy and regulatory actions, while
also partnering and engage in alliances with development partners in order to meet the rising compliance
costs and logistic requirements in the importing markets in general and in the EU in particular. To
investigate the impact of standards on Africa’s agricultural exports, this study evaluates the macroeconomic
performance of Africa vis-a-vis trends in aggregate output, growth, the structure of exports, and the trends
and contribution of agricultural exports to the GDP. Labour participation in this sector and the engagement
by gender are also evaluated, with the examination of the contribution of employment in agriculture to total
54
employment in the continent. An evaluation of the incidences of non-tariff barriers confronting Africa’s
exports in its major foreign markets is done as well; and the analysis shows that exports of Africa origin
often face more incidences of NTBs in India, the US, and Canada than other foreign markets.
An overview of product standards is also carried out to ascertain the importance and reasons for the use of
these standards. This study has given a vivid definition of standards and their different types, while also
enumerating the confusion and overlapping definitions of standards among international institutions and
scholars. Different stages of export assessment prior to accessing the market were enunciated. The standard
requirements in the EU market, which this study refers to as the “hurdle to pass” before market access, are
highlighted and discussed. Standard requirements for selected products of relevance to Africa are analysed
as well. The analysis indicates that there are many applicable standards on every product, although at any
point in time, a particular standard requirement might dominate the reasons for border rejection (e.g.
mycotoxins). I discovered that the hazards were product-specific.
The volume of export rejection faced by Africa in the EU market is also presented, relative to other
continents of the world. The border rejections witnessed by ten most affected countries in Africa are
highlighted, with Morocco, Egypt, Ghana, and Nigeria ranking as the most affected countries. The study
disaggregates the border rejections and hazards/reasons for the rejection by some selected products where
it was discovered that apart from the product-specific rejection, the import refusal hazards were different
across the countries.
An empirical review of previous studies boils down to three schools of thought on standards: they are either
are trade-inhibiting, trade-enhancing, or trade-enhancing or inhibiting-depending on the compliance level,
stage of development in exporting countries, and the choice of standards used in the empirical analysis.
This study supports the argument that the impact of standards on trade is product-specific and the
generalization of conclusions on market access from analysis of a specific product is not appropriate.
Besides, without applying all required standards to products of interest in the empirical estimations,
inferences on the market access from such selected standard can be inaccurate. To this end, the empirical
analysis in this study used all the applicable standards in two high valued commodities-- fish and
vegetables-- and a traditional crop—coffee-- in a Heckman model. At the extensive margins of export,
standards are trade-enhancing in vegetables while trade-inhibiting for exports of fish and coffee. The
incomes of exporting countries have not substantially boosted export of these products despite the potential,
taste, and preferences favouring these products in the importing countries. These observations support the
argument that Africa has inadequate export, which is due in turn to some constraints. Regional trade
agreements have not contributed meaningfully to trade in these products except for fish.
Similar results are obtained at the intensive margins of exports. Standard requirements do not constitute
restriction to fish export, but they significantly hinder the flow of vegetable and coffee. The income of the
55
exporting countries does not contribute to the volume of export, nor does it really stimulate the flow of
these commodities except for coffee, and the regional trade agreements do not really contribute to trade.
The consumption of domestically produced substitute products is a major determinant of import of the
selected products.
Thus, this study finds that product standards in vegetables are trade-enhancing at the extensive and trade-
inhibiting at intensive margins of exports. This implies that new producers of the commodity are able to
comply with the standards, possibly due to institutional and technological supports from the governments
and development partners; but after accessing the market, the standards of the commodity cannot be
sustained. Standards are trade-inhibiting at both the extensive and intensive margins of exports for coffee,
which indicate that the compliance level has been inadequate and makes access to this market difficult. Fish
standards are trade-restrictive at the extensive margins but trade-enhancing at the intensive margins. This
study therefore concludes that the impact of standards on trade is product-specific.
Africa must ensure adequate standards compliance not only in the EU market, but in all its markets. Efforts
must be engineered in partnering and engaging in alliances with local and international institutions and
development partners across the globe to provide technological, institutional, and human capacity
development support and assistance to the agricultural sector, particularly to commercial and smallholder
farmers. Design and adequate implementation of institutional, regulatory, and domestic policies that will
stimulate quality outputs for export are a critical next step.
56
References
Anders S. and J. Caswell. 2009. “Standards as Barriers versus Standards as Catalysts: Assessing the Impact
of HACCP Implementation on U.S. Seafood Imports.” American Journal of Agricultural
Economics 91(2): 310–321.
Anderson, J.E. 1979. “A Theoretical Foundation for the Gravity Equation.” American Economic Review
69.
Anderson, J.E. and E. van Wincoop. 2003. "Gravity with Gravitas: A Solution to the Border Puzzle,"
American Economic Review 93(1): 170-192.
Asci, S., A. Ali Koc, and M. Sukru Erdem. 2013. “The Impact of Non-Tariff Barriers on Trade: The Gravity
Model of Turkish Agri-Food Producers.” Poster prepared for presentation at the Agricultural and
Applied Economics Association’s 2013 AAEAA and CAES Joint Annual Meeting, Washington,
DC, August.
Asfaw, S., D. Mithofer, and H. Weibet. 2007. “What Impact Are EU Supermarket Standards Having on
Developing Countries Export of High-Value Horticultural Products? Evidence from Kenya.”
Paper prepared for presentation at the 105th EAAE Seminar “International Marketing and
International Trade of Quality Food Products,” Bologna, Italy, March.
Baldwin, R. and D. Taglioni 2007. “Trade Effects of the Euro: A Comparison of Estimators.” Journal of
Economic Integration 22: 780–818.
Baldwin, R. and D. Taglioni. 2011. Gravity Chains: Estimating Bilateral Trade Flows When Parts and
Components Trade is Important. NBER Working Paper 16672. Washington, DC: National Bureau
of Economic Research, Inc.
Belenkiy M. 2009. Robustness of the Extensive Margin in the Helpman, Melitz and Rubinstein (HMR)
Model. Munich Personal RePEc Archive Paper 17913. Munich: University Library of Munich.
Bergstrand, J.H. 1985. “The Gravity Equation in International Trade: Some Microeconomic Foundations
and Empirical Evidence.” Review of Economics and Statistics 67: 34 -78.
Bergstrand, J.H. 1990. “The Heckscher-Ohlin-Samuelson Model, the Linder Hypothesis, and the
Determinants of Bilateral Intra-Industry Trade.” Economic Journal 100 (December): 1219-1229.
Burger, M. J., F. G. VanOort, and G.J. Linders. 2009. “On the Specification of the Gravity Model of Trade:
Zeros, Excess Zeros and Zero-Inflated Estimations.” Spatial Economic Analysis 4(2): 167-190.
Chen, M.X., T. Otsuki, and J.S. Wilson. 2006. Do Standards Matter for Export Success? World Bank Policy
Research Working Paper 3809, January.
57
Chevassus-Lozza, E., et. al. 2008. “The importance of EU-15 borders for CEECs agri-food exports: The
role of tariffs and non-tariff measures in the pre-accession period.” Food Policy 33(6): 596-606.
Crivelli, P. and J. Groschl. 2012. The Impact of Sanitary and Phytosanitary Measures on Market Entry and
Trade Flows. IFO Working Paper No. 136, August.
Czubala, W., B. Shepherd, and J.S. Wilson. 2009. "Help or Hindrance? The Impact of Harmonised
Standards on African Exports." Journal of African Economies 18: 711-44.
Disdier, A. C., L. Fontagné, and D. Mimouni. 2008. “The impact of regulations on agricultural trade:
evidence from SPS and TBT agreements.” American Journal of Agricultural Economics 90(2):
336-350.
Evenett, S. and W. Keller. 2003. “On Theories Explaining the Success of the Gravity Equation.” Journal
of Political Economy, 110: 281-316.
Ferro, E., J.S. Wilson, and T. Otsuki. 2013. The Effects of Product Standards on Agricultural Exports from
Developing Countries. World Bank Policy Research Working Paper G518, June.
Fugazza, M. 2013. “The Economics Behind Non-Tariff Measures: Theoretical Insights and Empirical
Evidence”, UNCTAD Policy Issues in International Trade and Commodities Studies Series 57.
UNCTAD.
Fugazza, M. and J. Maur. 2006. “Non-Tariff Barriers in a Non-Tariff World.” Conference Proceedings of
the Ninth GTAP Annual Conference on Global Economic Analysis, Addis Ababa.
Ganslandt, M. and J.R. Markusen. 2001. Standards and related regulations in international trade: a
modelling approach.” In Quantifying the Impact of Technical Barriers to Trade: Can It Be Done?
edited by K. Maskus and J.R. Wilson. Ann Arbor, MI, US: University of Michigan Press.
Grundke, R. and C. Moser. 2013. “Developing Countries and the Costs of Regulation in International Trade:
the Role of Product Standards.” Paper presentation at the IO and Trade Seminar, LMU Munich.
Haveman, J. and J.G. Thursby. 2000. The Impact of Tariff and Non-Tariff Barriers to Trade in Agricultural
Commodities: A Disaggregated Approach. Purdue CIBER Working Paper 143.
Head, K and T, Mayer. 2013. “Gravity Equations: Workhorse, Toolkits and Cookbook”, In: Gropinath,
Helpman,and Rogoff (Ed.), Handbook of International Economics. Vol. 4.Elsevier.
Heckman, J. 1979. “Sample Selection Bias as a Specification Error.”Econometrica 47: 153-161.
Helpman, E. and P. Krugman. 1985. Market Structure and Foreign Trade. Cambridge, MA, US: MIT Press.
Helpman, E., M. Melitz, and Y. Rubinstein. 2008. “Trading Partners and Trading Volume.” Quarterly
Journal of Economics, 123(2), 441-487.
58
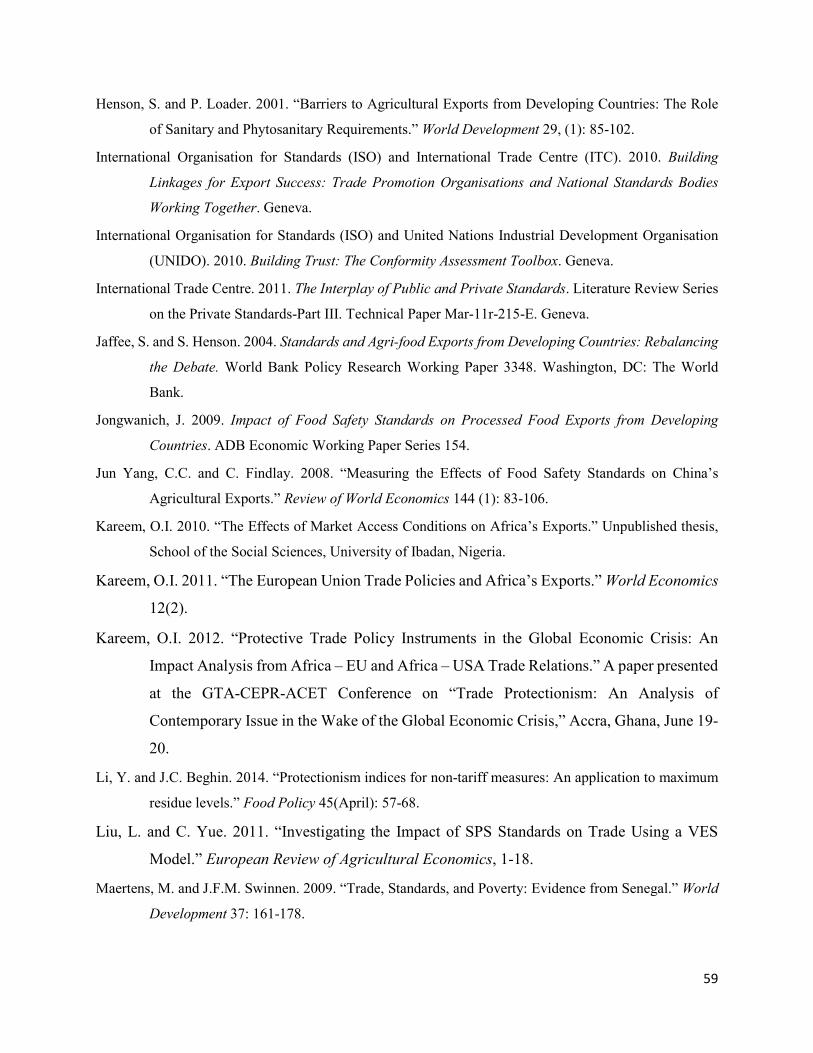
Henson, S. and P. Loader. 2001. “Barriers to Agricultural Exports from Developing Countries: The Role
of Sanitary and Phytosanitary Requirements.” World Development 29, (1): 85-102.
International Organisation for Standards (ISO) and International Trade Centre (ITC). 2010. Building
Linkages for Export Success: Trade Promotion Organisations and National Standards Bodies
Working Together. Geneva.
International Organisation for Standards (ISO) and United Nations Industrial Development Organisation
(UNIDO). 2010. Building Trust: The Conformity Assessment Toolbox. Geneva.
International Trade Centre. 2011. The Interplay of Public and Private Standards. Literature Review Series
on the Private Standards-Part III. Technical Paper Mar-11r-215-E. Geneva.
Jaffee, S. and S. Henson. 2004. Standards and Agri-food Exports from Developing Countries: Rebalancing
the Debate. World Bank Policy Research Working Paper 3348. Washington, DC: The World
Bank.
Jongwanich, J. 2009. Impact of Food Safety Standards on Processed Food Exports from Developing
Countries. ADB Economic Working Paper Series 154.
Jun Yang, C.C. and C. Findlay. 2008. “Measuring the Effects of Food Safety Standards on China’s
Agricultural Exports.” Review of World Economics 144 (1): 83-106.
Kareem, O.I. 2010. “The Effects of Market Access Conditions on Africa’s Exports.” Unpublished thesis,
School of the Social Sciences, University of Ibadan, Nigeria.
Kareem, O.I. 2011. “The European Union Trade Policies and Africa’s Exports.” World Economics
12(2).
Kareem, O.I. 2012. “Protective Trade Policy Instruments in the Global Economic Crisis: An
Impact Analysis from Africa – EU and Africa – USA Trade Relations.” A paper presented
at the GTA-CEPR-ACET Conference on “Trade Protectionism: An Analysis of
Contemporary Issue in the Wake of the Global Economic Crisis,” Accra, Ghana, June 19-
20.
Li, Y. and J.C. Beghin. 2014. “Protectionism indices for non-tariff measures: An application to maximum
residue levels.” Food Policy 45(April): 57-68.
Liu, L. and C. Yue. 2011. “Investigating the Impact of SPS Standards on Trade Using a VES
Model.” European Review of Agricultural Economics, 1-18.
Maertens, M. and J.F.M. Swinnen. 2009. “Trade, Standards, and Poverty: Evidence from Senegal.” World
Development 37: 161-178.
59
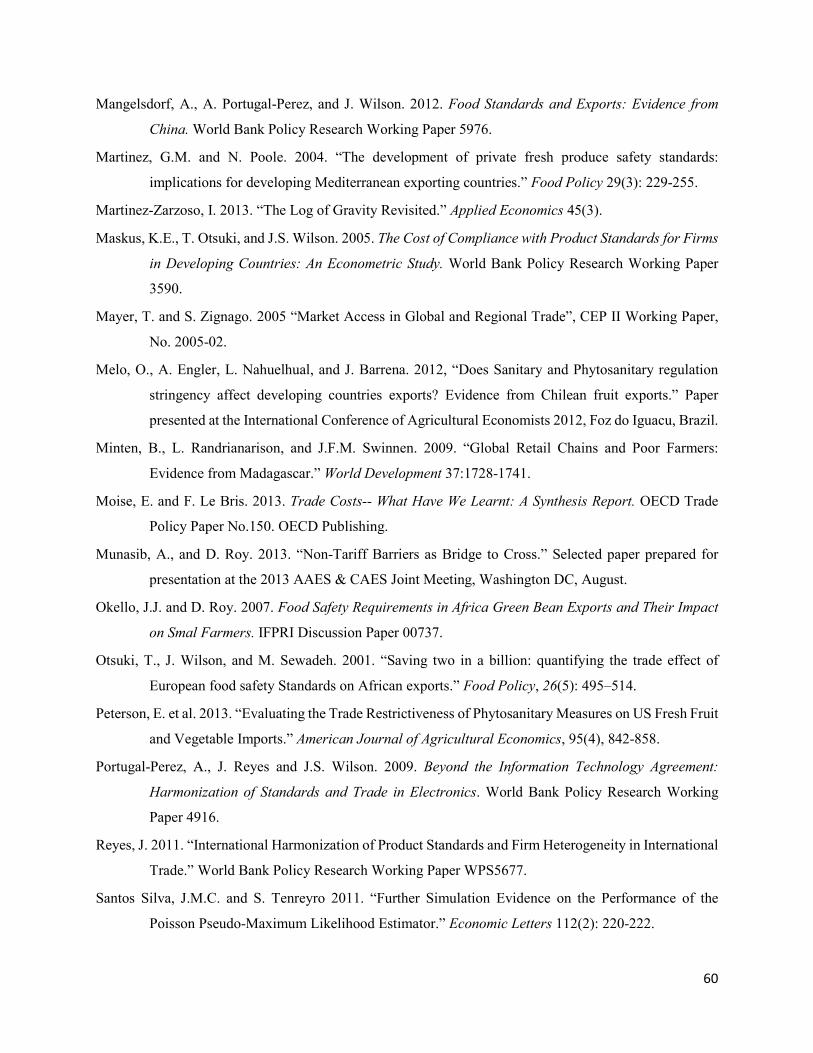
Mangelsdorf, A., A. Portugal-Perez, and J. Wilson. 2012. Food Standards and Exports: Evidence from
China. World Bank Policy Research Working Paper 5976.
Martinez, G.M. and N. Poole. 2004. “The development of private fresh produce safety standards:
implications for developing Mediterranean exporting countries.” Food Policy 29(3): 229-255.
Martinez-Zarzoso, I. 2013. “The Log of Gravity Revisited.” Applied Economics 45(3).
Maskus, K.E., T. Otsuki, and J.S. Wilson. 2005. The Cost of Compliance with Product Standards for Firms
in Developing Countries: An Econometric Study. World Bank Policy Research Working Paper
3590.
Mayer, T. and S. Zignago. 2005 “Market Access in Global and Regional Trade”, CEP II Working Paper,
No. 2005-02.
Melo, O., A. Engler, L. Nahuelhual, and J. Barrena. 2012, “Does Sanitary and Phytosanitary regulation
stringency affect developing countries exports? Evidence from Chilean fruit exports.” Paper
presented at the International Conference of Agricultural Economists 2012, Foz do Iguacu, Brazil.
Minten, B., L. Randrianarison, and J.F.M. Swinnen. 2009. “Global Retail Chains and Poor Farmers:
Evidence from Madagascar.” World Development 37:1728-1741.
Moise, E. and F. Le Bris. 2013. Trade Costs-- What Have We Learnt: A Synthesis Report. OECD Trade
Policy Paper No.150. OECD Publishing.
Munasib, A., and D. Roy. 2013. “Non-Tariff Barriers as Bridge to Cross.” Selected paper prepared for
presentation at the 2013 AAES & CAES Joint Meeting, Washington DC, August.
Okello, J.J. and D. Roy. 2007. Food Safety Requirements in Africa Green Bean Exports and Their Impact
on Smal Farmers. IFPRI Discussion Paper 00737.
Otsuki, T., J. Wilson, and M. Sewadeh. 2001. “Saving two in a billion: quantifying the trade effect of
European food safety Standards on African exports.” Food Policy, 26(5): 495–514.
Peterson, E. et al. 2013. “Evaluating the Trade Restrictiveness of Phytosanitary Measures on US Fresh Fruit
and Vegetable Imports.” American Journal of Agricultural Economics, 95(4), 842-858.
Portugal-Perez, A., J. Reyes and J.S. Wilson. 2009. Beyond the Information Technology Agreement:
Harmonization of Standards and Trade in Electronics. World Bank Policy Research Working
Paper 4916.
Reyes, J. 2011. “International Harmonization of Product Standards and Firm Heterogeneity in International
Trade.” World Bank Policy Research Working Paper WPS5677.
Santos Silva, J.M.C. and S. Tenreyro 2011. “Further Simulation Evidence on the Performance of the
Poisson Pseudo-Maximum Likelihood Estimator.” Economic Letters 112(2): 220-222.
60
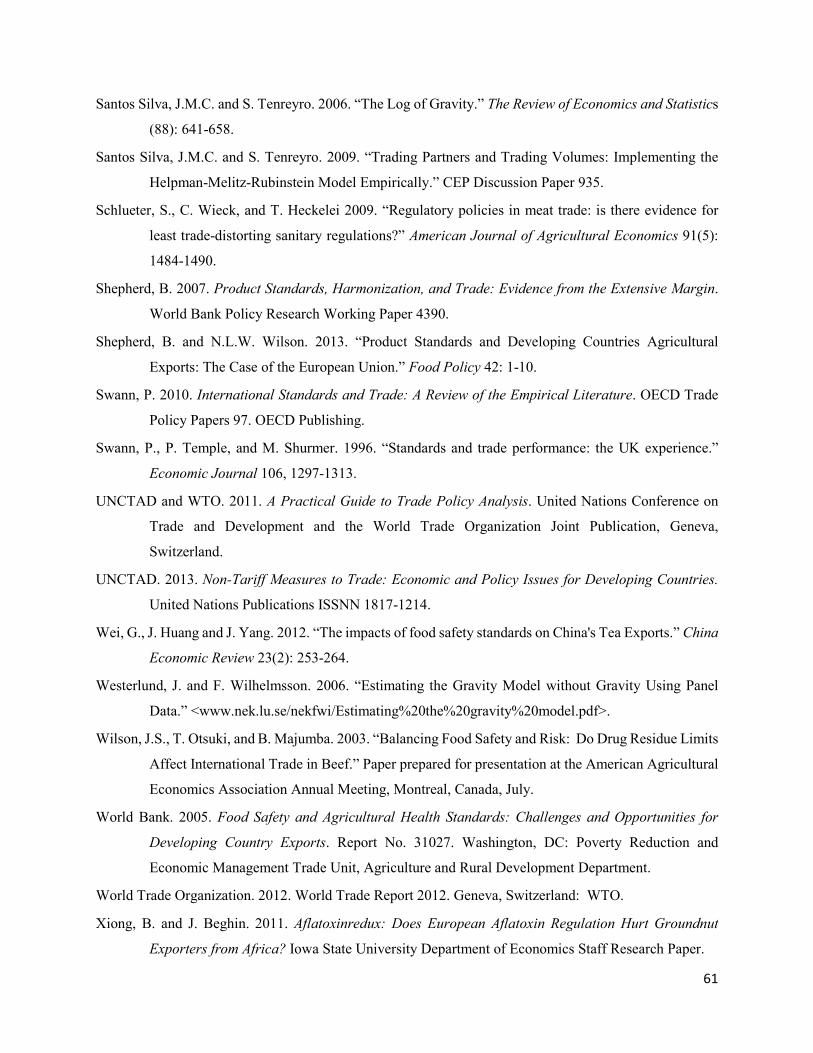
Santos Silva, J.M.C. and S. Tenreyro. 2006. “The Log of Gravity.” The Review of Economics and Statistics
(88): 641-658.
Santos Silva, J.M.C. and S. Tenreyro. 2009. “Trading Partners and Trading Volumes: Implementing the
Helpman-Melitz-Rubinstein Model Empirically.” CEP Discussion Paper 935.
Schlueter, S., C. Wieck, and T. Heckelei 2009. “Regulatory policies in meat trade: is there evidence for
least trade-distorting sanitary regulations?” American Journal of Agricultural Economics 91(5):
1484-1490.
Shepherd, B. 2007. Product Standards, Harmonization, and Trade: Evidence from the Extensive Margin.
World Bank Policy Research Working Paper 4390.
Shepherd, B. and N.L.W. Wilson. 2013. “Product Standards and Developing Countries Agricultural
Exports: The Case of the European Union.” Food Policy 42: 1-10.
Swann, P. 2010. International Standards and Trade: A Review of the Empirical Literature. OECD Trade
Policy Papers 97. OECD Publishing.
Swann, P., P. Temple, and M. Shurmer. 1996. “Standards and trade performance: the UK experience.”
Economic Journal 106, 1297-1313.
UNCTAD and WTO. 2011. A Practical Guide to Trade Policy Analysis. United Nations Conference on
Trade and Development and the World Trade Organization Joint Publication, Geneva,
Switzerland.
UNCTAD. 2013. Non-Tariff Measures to Trade: Economic and Policy Issues for Developing Countries.
United Nations Publications ISSNN 1817-1214.
Wei, G., J. Huang and J. Yang. 2012. “The impacts of food safety standards on China's Tea Exports.” China
Economic Review 23(2): 253-264.
Westerlund, J. and F. Wilhelmsson. 2006. “Estimating the Gravity Model without Gravity Using Panel
Data.” <www.nek.lu.se/nekfwi/Estimating%20the%20gravity%20model.pdf>.
Wilson, J.S., T. Otsuki, and B. Majumba. 2003. “Balancing Food Safety and Risk: Do Drug Residue Limits
Affect International Trade in Beef.” Paper prepared for presentation at the American Agricultural
Economics Association Annual Meeting, Montreal, Canada, July.
World Bank. 2005. Food Safety and Agricultural Health Standards: Challenges and Opportunities for
Developing Country Exports. Report No. 31027. Washington, DC: Poverty Reduction and
Economic Management Trade Unit, Agriculture and Rural Development Department.
World Trade Organization. 2012. World Trade Report 2012. Geneva, Switzerland: WTO.
Xiong, B. and J. Beghin. 2011. Aflatoxinredux: Does European Aflatoxin Regulation Hurt Groundnut
Exporters from Africa? Iowa State University Department of Economics Staff Research Paper.
61
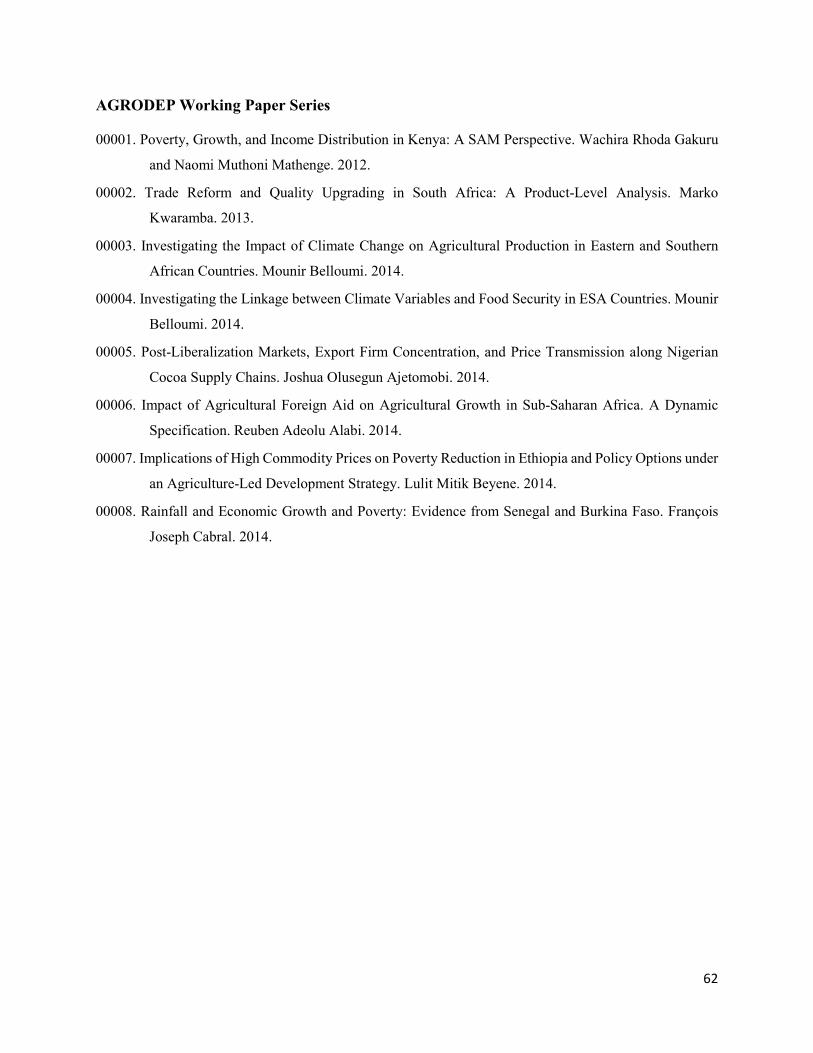
AGRODEP Working Paper Series
00001. Poverty, Growth, and Income Distribution in Kenya: A SAM Perspective. Wachira Rhoda Gakuru
and Naomi Muthoni Mathenge. 2012.
00002. Trade Reform and Quality Upgrading in South Africa: A Product-Level Analysis. Marko
Kwaramba. 2013.
00003. Investigating the Impact of Climate Change on Agricultural Production in Eastern and Southern
African Countries. Mounir Belloumi. 2014.
00004. Investigating the Linkage between Climate Variables and Food Security in ESA Countries. Mounir
Belloumi. 2014.
00005. Post-Liberalization Markets, Export Firm Concentration, and Price Transmission along Nigerian
Cocoa Supply Chains. Joshua Olusegun Ajetomobi. 2014.
00006. Impact of Agricultural Foreign Aid on Agricultural Growth in Sub-Saharan Africa. A Dynamic
Specification. Reuben Adeolu Alabi. 2014.
00007. Implications of High Commodity Prices on Poverty Reduction in Ethiopia and Policy Options under
an Agriculture-Led Development Strategy. Lulit Mitik Beyene. 2014.
00008. Rainfall and Economic Growth and Poverty: Evidence from Senegal and Burkina Faso. François
Joseph Cabral. 2014.
62
Recommended