CODES AND STANDARDS ENHANCEMENT INITIATIVE (CASE)
Draft Measure Information Template – Office
Task Lighting Plug Load Circuit Control
2013 California Building Energy Efficiency Standards
California Utilities Statewide Codes and Standards Team, March 2011
This report was prepared by the California Statewide Utility Codes and Standards Program and funded by the California utility customers under the auspices of the California Public Utilities Commission.
Copyright 2011 Pacific Gas and Electric Company, Southern California Edison, Sempra Utilities.
All rights reserved, except that this document may be used, copied, and distributed without modification.
Neither PG&E, SCE, SoCalGas, SDG&E, nor any of its employees makes any warranty, express of implied; or assumes any legal liability or
responsibility for the accuracy, completeness or usefulness of any data, information, method, product, policy or process disclosed in this document; or
represents that its use will not infringe any privately-owned rights including, but not limited to, patents, trademarks or copyrights
Measure Information Template Page 2
2013 California Building Energy Efficiency Standards [March 2011]
Measure Information Template – Office Task
Lighting and Plug Loads Circuit Controls
2013 California Building Energy Efficiency Standards
[California Utilities Statewide Codes and Standards Team, March 2011]
CONTENTS
1. Purpose ........................................................................................................................ 5
2. Overview ....................................................................................................................... 6
3. Methodology............................................................................................................... 10 3.1 Task Lighting and Plug Load Characteristics Study ................................................................10 3.2 Market Assessment ...................................................................................................................10
3.3 Building Prototype Development .............................................................................................11 3.4 Energy Savings Analysis ..........................................................................................................11 3.5 Cost Analysis ............................................................................................................................12
3.6 Cost Effectiveness Analysis .....................................................................................................12 3.7 Stakeholder Meeting Process....................................................................................................13
4. Analysis and Results ................................................................................................. 14 4.1 Task Lighting and Plug Load Characteristics Study ................................................................14
4.1.1 Office Plug Load Definition ..............................................................................................14 4.1.2 Controllable and Non-controllable Plug Loads .................................................................15
4.1.3 Operation Mode / Power Status .........................................................................................18 4.2 Market Assessment ...................................................................................................................20
4.2.1 Plug Load Control Standards .............................................................................................20 4.2.2 Control Products ................................................................................................................20
4.2.3 Level of Controls ...............................................................................................................23 4.2.4 Task Lighting and Plug Load Circuit Wiring ....................................................................23
4.3 Prototype Buildings Development............................................................................................25 4.4 Energy Savings Analysis ..........................................................................................................26
4.4.1 Energy Savings Analysis Assumptions .............................................................................26
4.4.2 Energy Savings Analysis Results ......................................................................................31
4.5 Cost Analysis ............................................................................................................................34
4.5.1 Baselines and Compliance Options ...................................................................................34 4.5.2 Incremental Cost of Three Levels of Controls ...................................................................38
4.6 Cost Effectiveness Analysis .....................................................................................................45
5. Recommended Language for the Standards Document, ACM Manuals, and the Reference Appendices ....................................................................................................... 48
6. Bibliography and Other Research ............................................................................ 49
Measure Information Template Page 3
2013 California Building Energy Efficiency Standards [March 2011]
7. Appendix I: ASHRAE and IgCC Plug Load Control Standards .............................. 51 7.1 ASHRAE 90.1 ..........................................................................................................................51 7.2 International Green Construction Code (IgCC) ........................................................................51
8. Appendix II: Industry Practice Survey ..................................................................... 53 8.1 CASE Office Task Lighting and Plug Loads, Designer and Contractor survey ......................53
8.1.1 Survey Form.......................................................................................................................53
8.1.2 Survey Answers .................................................................................................................55 8.2 CASE Office Task Lighting and Plug Loads, System furniture manufacturer survey .............56
8.2.1 Survey Form.......................................................................................................................56
9. Appendix III: Office Building Prototypes ................................................................. 59 9.1 Small Office ..............................................................................................................................59
9.2 Large Office ..............................................................................................................................60
FIGURES
Figure 1 Examples of Non-controllable Plug Loads............................................................................. 16 Figure 2 Plug Loads that can be controlled by a Time Switch or by an Occupancy Sensor ................ 18
Figure 3 Plug Load Power States and Typical Installation Density ..................................................... 20 Figure 4 Examples of Lighting Control and Controllable Breaker Panels ........................................... 22 Figure 5 Examples of Occupancy Sensor Controls .............................................................................. 23
Figure 6 Single circuit (top) versus double circuit (bottom) wiring practice ....................................... 25 Figure 7 Office Building Prototype Summary ...................................................................................... 26
Figure 8 Office Operation and Occupant Working Schedule Assumptions ......................................... 27
Figure 9 Probability of Plug Load Power States –Non-Business Hours .............................................. 30
Figure 10 Probability of Plug Load Power States –Away-from-desk .................................................. 30 Figure 11 Probability of Plug Load Power States – Empty Conference Room .................................... 31
Figure 12 Present Values of Life Cycle Energy Savings ($/sf) ............................................................ 32 Figure 13 Annual TDV Energy Savings (kBtu/sf/yr) ........................................................................... 33 Figure 14 Statewide Energy Savings .................................................................................................... 33 Figure 15 Central Timer Control Baseline and Compliance Options – Design A................................ 34
Figure 16 Central Timer Control Baseline and Compliance Options – Design B ................................ 35 Figure 17 Central Timer Control Baseline and Compliance Options – Design C ................................ 36 Figure 18 Central Timer Control Baseline and Compliance Options – Design D................................ 37 Figure 19 Baselines and Compliance Options for Occupancy Sensor Controls (top: high-voltage;
bottom: low-voltage) ...................................................................................................................... 38
Figure 20 Number of Circuits per Space Type ..................................................................................... 39
Figure 21 Central Timer Control Panel Cost ........................................................................................ 39
Figure 22 Occupancy Sensor Control Cost ........................................................................................... 40 Figure 23 Control System Upgrade Requirement – Level 1 Control ................................................... 40 Figure 24 Additional Wiring Length for Dual Circuit Wiring Support– Level 1 Control ................... 41 Figure 25 System Incremental Cost – Level 1 Control ($/sf) ............................................................... 41 Figure 26 Control System Upgrade Requirement – Level 2 Control .................................................. 42 Figure 27 Additional Wiring Length for Dual Circuit Wiring Support– Level 2 Control .................. 42 Figure 28 System Incremental Cost – Level 2 Control ($/sf) ............................................................... 43
Measure Information Template Page 4
2013 California Building Energy Efficiency Standards [March 2011]
Figure 29 Number of Occupancy Sensor Control – Level 3 Control .................................................. 44
Figure 30 System Incremental Cost – Level 3 Control ($/sf) ............................................................... 45 Figure 31 LCC – Level 1 Control ......................................................................................................... 46 Figure 32 LCC – Level 2 Control ......................................................................................................... 46 Figure 33 LCC – Level 3 Control ......................................................................................................... 47 Figure 34 Small Office Area Breakdown ............................................................................................. 59
Figure 35 Small Office Floor Plan ........................................................................................................ 60 Figure 36 Large Office Area Breakdown ............................................................................................. 61 Figure 37 Large Office Floor Plan ........................................................................................................ 61

Measure Information Template Page 5
2013 California Building Energy Efficiency Standards [March 2011]
1. Purpose
This Codes and Standards Enhancement (CASE) report addresses office task lighting controls, and
associated controls of other plug loads.
Task lightings and other plug loads are becoming a major electricity end-use in office buildings. These
loads are significant in term of both power density and power consumption. This is due to both
increased practices of low ambient lighting designs, which lead to increased task lighting usage, and
increased use of computer and other office electronic equipment.
According to the California Commercial End-Use Survey (CEUS) released in March 2006, interior
lighting represents 26.4% of the electricity energy consumption in California office floor space, which
is the highest electricity end-use. Office buildings compliant with the 2008 Title 24 minimum
requirements can be assumed to have 0.9W/sf of installed overhead lighting and 0.2W/sf of installed
task lighting. Hence, about 18% of the interior lighting power density is due to task lighting. In low
ambient lighting designs, this ratio is much higher. When further considering overhead lighting controls
required by 2008 Title 24, the ratio of power consumption by task lightings to that of overhead lightings
can be even higher.
Office equipment represents the third highest electricity end-use in California; it accounts for about
19.2% of the total building electricity consumption. Despite penetration of newer and more efficient
technologies, this electricity end-use is steadily increasing as the use of personal computers and other
electronics devices in offices continues to grow. Forecasts by the Energy Information Administration’s
2010 annual energy outlook predict a 36% increase in PC office equipment energy consumption from
2010 to 2030, and a 65% increase for non-PC office equipment energy consumption.
Although the growth in office equipment use is difficult to control, office equipment use patterns give
room for energy savings. This CASE study investigates potential requirements of applying
automatically shut-off controls to circuits serving task lightings and certain plug loads, so that they can
be switched off when not in use. These control technologies are already required by 2008 Title 24 for
general lightings in nonresidential buildings. Therefore, they can be easily implemented with fewer
technical barriers.
Measure Information Template Page 6
2013 California Building Energy Efficiency Standards [March 2011]
2. Overview
a. Measure
Title
Office Task Lighting and Plug Load Circuit Controls
b.
Description
This proposal investigates the feasibility and cost-effectiveness of requiring automatic
shut-off controls of electric circuits that serve task lightings and certain plug loads in
office buildings. These controls enable connected task lights and plug loads to be
automatically switched off when they are not in use. Electric energy savings are
achieved through reduction in power consumption of connected task lights and plug
loads.
The proposal requests an expansion of 2008 Title 24 automatic shut off controls for
general lighting to cover circuits serving task lighting. The same type of controls, timer
controls and occupancy sensor controls, which are currently required for general
lightings, are proposed to be applied to circuits for task lighting and certain plug loads.
Uncontrolled circuits should still be provided for plug loads that cannot be disrupted.
Receptacles connected to controlled circuits should be marked differently from those
connected to uncontrolled circuits.
The proposed code changes do not impose any requirement on how task lighting and
other plug loads should be connected or used. Rather, they ensure office buildings to be
equipped with the proper control system to allow reduction of unnecessary power
consumption by task lighting and plug loads.
c. Type of
Change
The proposed requirements are mandatory for all office buildings. As mandatory
measures, these requirements do not affect the performance method and trade-off
calculations. Similar to general lighting control requirements, they would require an
acceptance test to ensure controls are correctly installed and wall receptacles are
properly marked.

Measure Information Template Page 7
2013 California Building Energy Efficiency Standards [March 2011]
d. Energy
Benefits
Energy savings are calculated for two prototype office buildings. As task lighting and
plug load circuit controls are not required in 2008 Title 24 and are rarely installed in
California market, baselines for energy savings calculation were assumed to have no
task lighting and plug load circuit controls. Energy savings calculations are discussed in
details in section 0.
The CASE study investigated three levels of control requirements. The final code
change recommendation is based on the Level 2 control requirement. Electricity
savings corresponding to this level of requirements are provided in the table below for
whole office building and for unit floor area. Electricity savings are not affected by
climate zones. TDV electricity savings vary slightly among different climate zones.
The proposed change does not have any natural gas savings.
Electricity
Savings
(kwh/yr)
Demand
Savings (kw)
Per Small Office Prototype2 (10,000
sf) 4,900 1.97
Savings per square foot3 (Small
Office) 0.49 1.97E-04
Per Large Office Prototype2
(175,000 sf) 107,000 23.6
Savings per square foot3 (Large
Office) 0.61 1.35E-04
1. For description of prototype buildings refer to Methodology section below.
2. Applies to office buildings only.
e.
Non-Energy
Benefits
Reducing power consumption will reduce the use of the fuels that produce the needed
electricity resulting in a positive statewide impact on power plant emissions. Air quality
will improve, related illnesses will be reduced and community health will be improved
in general, which in turn should have an impact on the demand for health care services.
The economic side benefit that results from cleaner air is increased commerce
(productivity), which benefits everyone. This also reduces the amount of land and
resources that must be dedicated to a larger electricity infrastructure.
Measure Information Template Page 8
2013 California Building Energy Efficiency Standards [March 2011]
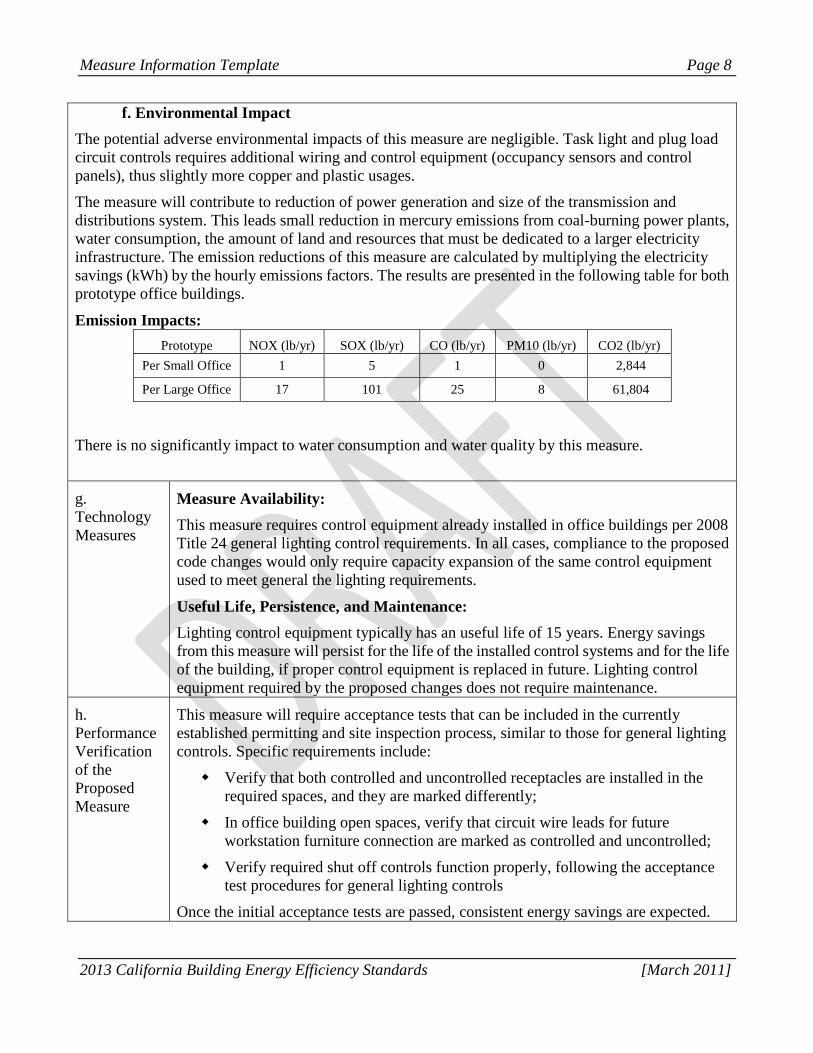
f. Environmental Impact
The potential adverse environmental impacts of this measure are negligible. Task light and plug load
circuit controls requires additional wiring and control equipment (occupancy sensors and control
panels), thus slightly more copper and plastic usages.
The measure will contribute to reduction of power generation and size of the transmission and
distributions system. This leads small reduction in mercury emissions from coal-burning power plants,
water consumption, the amount of land and resources that must be dedicated to a larger electricity
infrastructure. The emission reductions of this measure are calculated by multiplying the electricity
savings (kWh) by the hourly emissions factors. The results are presented in the following table for both
prototype office buildings.
Emission Impacts:
Prototype NOX (lb/yr) SOX (lb/yr) CO (lb/yr) PM10 (lb/yr) CO2 (lb/yr)
Per Small Office 1 5 1 0 2,844
Per Large Office 17 101 25 8 61,804
There is no significantly impact to water consumption and water quality by this measure.
g.
Technology
Measures
Measure Availability:
This measure requires control equipment already installed in office buildings per 2008
Title 24 general lighting control requirements. In all cases, compliance to the proposed
code changes would only require capacity expansion of the same control equipment
used to meet general the lighting requirements.
Useful Life, Persistence, and Maintenance:
Lighting control equipment typically has an useful life of 15 years. Energy savings
from this measure will persist for the life of the installed control systems and for the life
of the building, if proper control equipment is replaced in future. Lighting control
equipment required by the proposed changes does not require maintenance.
h.
Performance
Verification
of the
Proposed
Measure
This measure will require acceptance tests that can be included in the currently
established permitting and site inspection process, similar to those for general lighting
controls. Specific requirements include:
Verify that both controlled and uncontrolled receptacles are installed in the
required spaces, and they are marked differently;
In office building open spaces, verify that circuit wire leads for future
workstation furniture connection are marked as controlled and uncontrolled;
Verify required shut off controls function properly, following the acceptance
test procedures for general lighting controls
Once the initial acceptance tests are passed, consistent energy savings are expected.

Measure Information Template Page 9
2013 California Building Energy Efficiency Standards [March 2011]
i. Cost Effectiveness
Life cycle costs (LCC) per building floor area were calculated using the California Energy Commission
Life Cycle Costing Methodology posted on the 2013 Standards website for each proposed measure.
The measure life for each control level is 15 year. The post-adoption measure costs are not likely to
decrease much, and therefore are not shown in the results of the analysis summarized in the table below.
No maintenance costs were considered. Details of the analysis are included in Section Error!
eference source not found..
a b c f g
Measure
Life (Years)
Additional Costs1–
Current Measure Costs
(Relative to Basecase)
($)
PV of4
Energy Cost
Savings
(PV$)
LCC
c-f
Based on
Current Costs
Per Small Office Prototype2
(10,000 sf)
15 $2,638 $9,433 ($6,796)
Savings per square foot3
(Small Office)
15 $0.26 $1 ($0.68)
Per Large Office Prototype2
(175,000 sf)
15 $33,250 $206,373 ($173,123)
Savings per square foot3
(Large Office)
15 $0.19 $1 ($0.99)
j. Analysis
Tools
Task lighting and plug load energy consumption is not covered by any Title 24
Standards reference methods. A spreadsheet tool was developed following energy
analysis method described in the Methodology section to assess measure energy
savings. The proposed measure is a mandatory requirement, therefore, whole building
energy simulation tool was not needed to quantify energy savings for performance
trade-off calculations.
k.
Relationship
to Other
Measures
This measure is related to all other lighting control measures that affect lighting
controls in office buildings as task lighting and plug load circuit controls are likely to be
integrated with the rest of the building lighting control systems. This measure is also
important to measures that encourage low ambient lighting strategies. This measure
will make sure energy savings achieved with low ambient lighting are not offset by
increased task lighting left on when occupants are away from their desk.

Measure Information Template Page 10
2013 California Building Energy Efficiency Standards [March 2011]
3. Methodology
This section describes the methodology that we followed to assess control strategy feasibility, energy
savings, incremental costs, and cost effectiveness of the proposed code change. The key elements of the
study methodology are as follow:
Task lighting and plug loads usage characteristics study
Control technologies market study and industry practice survey Prototype building development
Energy Savings Analysis
Cost Analysis
Cost-effectiveness and Statewide Savings
Stakeholder Meeting Process
3.1 Task Lighting and Plug Load Characteristics Study
The first step of the study was to understand the characteristics of office task lightings and plug loads in
terms of installed power densities and operation patterns. Such information was needed to determine if
and how plug loads can be controlled and the amount of power that can potentially be reduced through
controls. The CASE study team conducted literature reviews in order to collect relevant information.
Different sources were reviewed and analyzed in order to provide a comprehensive understanding of
the subject.
3.2 Market Assessment
The general code change proposal concept is to require task lighting and plug loads to be controlled by
time switchers or occupancy sensors to achieve automatic shut off controls. To demonstrate the
feasibility of this concept, the CASE study conducted market studies to identify commercially available
control products and to explore control system design options. Market study results were used to
develop compliance options, and collected product costs supported the cost analysis of the proposed
control requirements.
This market assessment encompassed two efforts:
Control technologies market study
Industry practice assessment
The market study started with literature research to understand existing practices and technology
development associated with plug load controls. This effort was carried out in conjunction with
literature research on office plug load characteristics study.
Many plug load control studies focused on soft-wired control technologies, e.g. task lighting with
embedded occupancy sensor and power strips with occupancy sensor or timer control capabilities.
These are effective control strategies and are especially cost effective for plug load control in existing
buildings. They are not, however, suitable for Title 24 regulation. This CASE study investigates the
implementation of hardwired control strategies in new construction buildings.
Measure Information Template Page 11
2013 California Building Energy Efficiency Standards [March 2011]
The literature study and initial survey revealed that hardwired plug controls had very small market
penetration and that little was published on this topic. In response, the CASE project team shifted
market study efforts towards product research and control strategy development by interviewing
industry practitioners. A broad range of lighting control and circuit control products were reviewed.
The project team conducted extensive discussion with lighting control and system furniture
manufacturers to examine how hardwired plug load circuit controls can be implemented. The CASE
team further surveyed electrical designers, contractors, and system furniture manufacturers using an
online survey or through phone calls. The survey aimed at collecting industry consensus on following
issues:
Lighting and circuit control practices and products
Feasibility of potential control requirements
Office electric circuit wiring design practices
Integration of plug load controls with office furniture systems
The project staff further interviewed authors of relevant studies and projects to obtain detailed technical
information, to seek additional control strategies and design options, and to identify implementation
and operation issues.
3.3 Building Prototype Development
The CASE team developed two building prototypes (a small office building and a large office building)
to assess the energy savings, cost, and cost-effectiveness of the proposed task lighting and plug load
control requirements. The CASE team built on the two office building prototypes from the Database for
Energy Efficient Resources (DEER), which classified the office building stock into two categories,
small and large, using a building square footage threshold of 30,000 sf. An office layout was developed
for each prototype based on typical office building design and was checked by registered architects.
3.4 Energy Savings Analysis
Once task lightings and other controllable plug loads are plugged into receptacles that are connected to
controlled circuits, they can be automatically shut off when they are not in use. The amount of energy
savings depends on three elements: how many task lights and plug loads are connected to controlled
receptacles, when they can be switched off, and the average power status when they are switched off.
Types of controllable plug loads and installation densities of controllable plug loads were determined
based on task lighting and plug load characteristics study. The number of plug loads installed for each
building prototype was further estimated based on prototype building sizes and detailed configurations,
such as number of private offices and conference rooms.
Control schedule depends on office operation and occupancy presence schedule, as well as on control
technology. Central timer control can shut off plug load power according to a fixed schedule when all
occupants are expected to be out of office, e.g. during non-business hours. In the case of occupancy
sensor control, additional savings can be achieved when an occupant is not at his/her desk during
business hours, which includes two scenarios, away from desk and out of office. Similarly, occupancy
sensor control in conference rooms can achieve additional savings when the conference room is vacant.
Control schedules were developed based on assumptions of average office operation schedules.

Measure Information Template Page 12
2013 California Building Energy Efficiency Standards [March 2011]
Power status of task lighting and other controllable plug loads during all control schedule periods, i.e.
business and non-business hours were also based on information collected through task lighting and
plug load characteristics study, described in section 0.
The CASE team evaluated energy savings for both the small and large office building prototypes. Three
levels of control were considered, which used different combinations of central timer control and
occupancy sensor controls.
State-wide energy savings were calculated by multiplying unit energy savings (savings per square foot)
by the CEC’s forecast of square footage of office building new construction. Peak demand savings were
estimated as the average load (kW) reduction during summer peak hours, which are defined as 12pm –
6 pm in July through September, according to CPUC treatment of demand savings for IOU energy
efficiency programs.
3.5 Cost Analysis
This code change proposal seeks to expand existing lighting control systems for general lighting in
office buildings to implement task lighting and plug load controls. Based on 2008 Title 24 general
lighting automatic shut off control requirements , general lighting control compliance options were
investigated to develop baseline designs. Task lighting and plug load control compliance options were
developed as an upgrade to these general lighting control systems. The CASE study assessed the
incremental cost of the proposed code changes by comparing the cost of the baselines to the cost of the
corresponding task lighting and plug load control compliance options.
System upgrade costs were estimated for each compliance option with the consideration of following
components:
Cost of control equipment upgrade, installation, configuration, and maintenance
Cost of additional wiring, if any
This approach also provided realistic compliance examples to effectively demonstrate code change
feasibility.
Control equipment costs depend on the number of task lighting and plug load circuits to be controlled,
which were determined based on prototype office building configurations. Different office building
wiring practices were considered to generate a range of cost estimate.
Control equipment costs were obtained from manufacturers’ distributors as part of the efforts of market
study of control technologies previously discussed. Labor and material costs for installation,
configuration and additional wiring were estimated based on RS Means Cost Works Online
Construction Cost Data.
3.6 Cost Effectiveness Analysis
The CASE team calculated lifecycle cost analysis using methodology explained in the California
Energy Commission report Life Cycle Cost Methodology 2013 California Building Energy Efficiency
Standards, written by Architectural Energy Corporation, using the following equation:
Measure Information Template Page 13
2013 California Building Energy Efficiency Standards [March 2011]
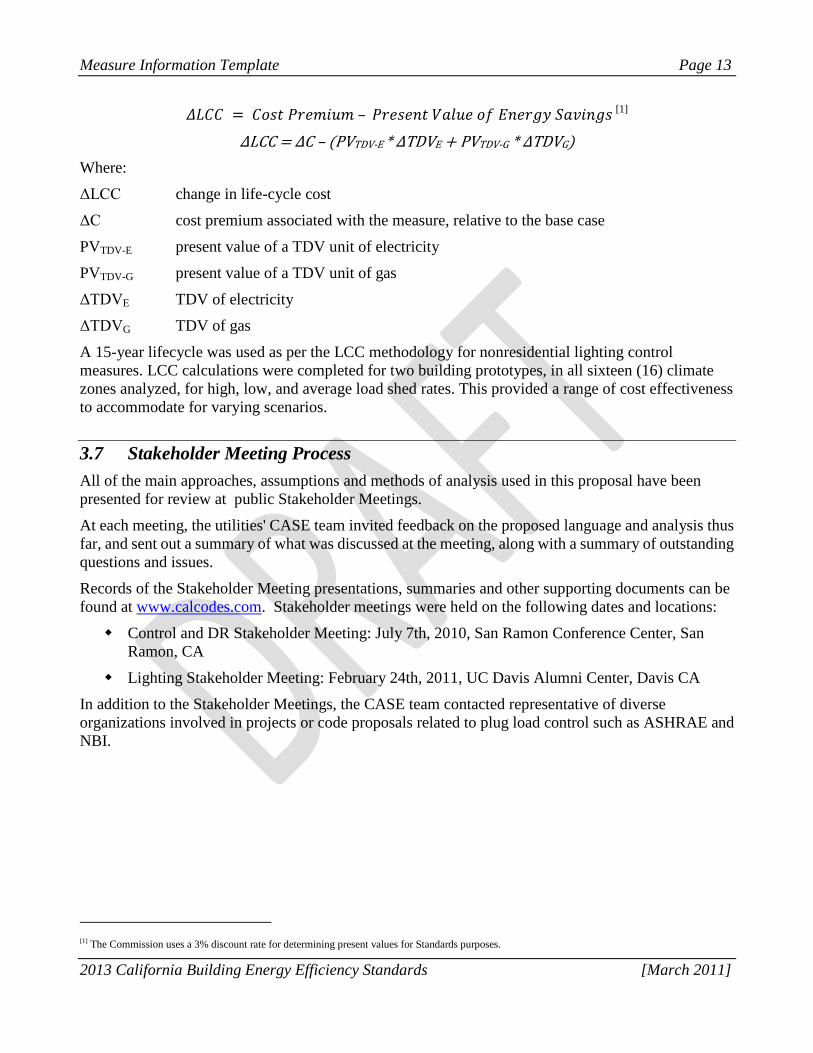
– [1]
ΔLCC = ΔC – (PVTDV-E * ΔTDVE + PVTDV-G * ΔTDVG)
Where:
ΔLCC change in life-cycle cost
ΔC cost premium associated with the measure, relative to the base case
PVTDV-E present value of a TDV unit of electricity
PVTDV-G present value of a TDV unit of gas
ΔTDVE TDV of electricity
ΔTDVG TDV of gas
A 15-year lifecycle was used as per the LCC methodology for nonresidential lighting control
measures. LCC calculations were completed for two building prototypes, in all sixteen (16) climate
zones analyzed, for high, low, and average load shed rates. This provided a range of cost effectiveness
to accommodate for varying scenarios.
3.7 Stakeholder Meeting Process
All of the main approaches, assumptions and methods of analysis used in this proposal have been
presented for review at public Stakeholder Meetings.
At each meeting, the utilities' CASE team invited feedback on the proposed language and analysis thus
far, and sent out a summary of what was discussed at the meeting, along with a summary of outstanding
questions and issues.
Records of the Stakeholder Meeting presentations, summaries and other supporting documents can be
found at www.calcodes.com. Stakeholder meetings were held on the following dates and locations:
Control and DR Stakeholder Meeting: July 7th, 2010, San Ramon Conference Center, San
Ramon, CA
Lighting Stakeholder Meeting: February 24th, 2011, UC Davis Alumni Center, Davis CA
In addition to the Stakeholder Meetings, the CASE team contacted representative of diverse
organizations involved in projects or code proposals related to plug load control such as ASHRAE and
NBI.
[1] The Commission uses a 3% discount rate for determining present values for Standards purposes.

Measure Information Template Page 14
2013 California Building Energy Efficiency Standards [March 2011]
4. Analysis and Results
This section presents the data collected and results of analysis according to approaches laid out in the
methodology section.
4.1 Task Lighting and Plug Load Characteristics Study
The CASE team identified and reviewed a list of publications related to office task lighting and plug
loads. Detailed references of these reports are provided in the Bibliography and Other Research section.
Even though numerous studies have been conducted regarding energy consumption of office equipment
and home electronics, they are relatively old (from 1998 to 2002) and usually not specific to office
buildings. In particular, after-hours equipment power status and equipment density are scarce
information. Two studies, one from the Lawrence Berkeley National Laboratory (LBNL) and one from
ECOS Consulting, provided the most comprehensive, updated and valuable data on office plug load
energy consumption, status, usage and density in commercial offices.
LBNL conducted series of field measurement studies and analysis of equipment density, powers, and
usage patterns of miscellaneous office equipment. The study focused on characterizing after-hour
power states of office plug loads. It was published in two papers, “After-hours Power Status of Office
Equipment and Energy Use of Miscellaneous Plug-Load Equipment.” and “Field Surveys of Office
Equipment Operation Patterns”. This study is referred to as the LBNL Study in following sections. The
other study is the PIER research conducted by ECOS Consulting (referred to as the ECOS Study in
following sections), which monitored power consumption and status of plug load devices in 25
commercial offices in 2007 and 2008. The research metered plug load devices and recorded power,
current, voltage, and power factor over a two-week period at one-minute intervals. In total, the team
inventoried nearly 7,000 plug load devices and collected meter data from 470 plug load devices.
The following information and analysis on office task lighting and plug load characteristics are based
on these two studies.
4.1.1 Office Plug Load Definition
In general, office plug loads include task lighting and other office and personal equipment and devices.
Following the Title 24 convention that treats lighting as a dedicated category, this study separates task
lighting from other plug loads. However, for control feasibility, energy savings analysis, and cost
effectiveness evaluation, they are treated in the same way.
Task lighting devices are commonly used. Their installed density usually varies between 1 and 2
lighting fixtures per office workstation, which is either a private office space or an open-space office
cubicle. The 2008 Title 24 has a definition for task light in section 100:
“Task lighting is lighting that is designed specifically to illuminate a task location, and that is
generally confined to the task location.”
There is no specific Title 24 requirement for task lighting. It is generally assumed for Title 24
compliance that installed task lighting power density is about 0.2 W/sf when overall lighting power
density is 0.9 W/sf to reach the maximum allowed power density of 1.1 W/sf. Low ambient lighting
strategies, which reduce the overhead lighting power density, tend to increase task light densities and
usages.
Measure Information Template Page 15
2013 California Building Energy Efficiency Standards [March 2011]
For the purpose of this CASE study, data and taxonomy from the LBNL Study and ECOS Study were
used. According to the LBNL Study, office plug loads can be broken into two categories: office
equipment and miscellaneous equipment.
Office equipment refers to electronics products found in any type of offices and are primarily designed
for office work. The ECOS Study further sorts office equipment into computers and monitors, and
office electronics categories. For the purpose of this analysis, it was further classified into the following
categories:
Task lighting:
Under-cabinet light, table lamp
Computer & Monitor:
Computers: desktop, laptop (notebook or mobile), thin clients
Monitors: cathode ray tube (CRT), and liquid crystal display (LCD)
Office electronics
Imaging: printers (inkjet, laser, wide format), fax machines, copiers, scanners, multi-function
devices (inkjet, laser)
Computer Peripheral: computer speakers
Miscellaneous equipment refers to plug load devices that are typically portable, often
occupant-provided units whose number, power consumption and usage patterns depend more on
occupants. Combining the results from the ECOS Study and LBNL Study, the most common and
important ones in term of energy consumption are listed below:
Audio/Visual: television, DVD player, video projector, speakers, subwoofers, CD player,
portable stereo, portable CD player, table radio
Telephone: speakerphone, answering machine, phone jack
Kitchen Equipment: coffee maker, coffee grinder, toaster oven, microwave oven, vending
machine, water dispenser, hot beverage dispenser
Others: portable fan, portable space heater, stapler, electric typewriter, shredder, adding
machine
4.1.2 Controllable and Non-controllable Plug Loads
Title 24 cannot and should not regulate installation and usages of office plug loads. Energy savings
should come from active controls, i.e. to shut off plug-load devices when they are not in use. Some
plug-load devices cannot be switched off even during non-business times due to business operation
requirements. They are classified as non-controllable plug load. Controllable plug loads are plug loads
that can be switched off during certain times of office operation, e.g. when the occupant is away from
the workstation or the office is closed for business. Controllability of certain plug loads is hard to be
determined. For example, battery chargers can be switched off when the connected battery is fully
charged, however, it is not feasible to require the control to determine if the charging is complete. For
energy savings evaluation, this CASE study took a conservative assumption and only classified as
controllable plug loads those that can be safely switched off without affecting any intended functions.

Measure Information Template Page 16
2013 California Building Energy Efficiency Standards [March 2011]
Figure 1 provides a list of non-controllable equipment. They are not included in the energy savings
analysis.
Plug Loads Rationale
Desktop, laptop, and thin
client computers
Need to stay on for remotely access and/or for software
update during non-business hours
Ethernet hub or switch Need to support connected computers
Phone, fax Need to receive messages/fax all the time
Refrigerator, clock, battery
chargers
Need to provide continuous operation
Figure 1 Examples of Non-controllable Plug Loads
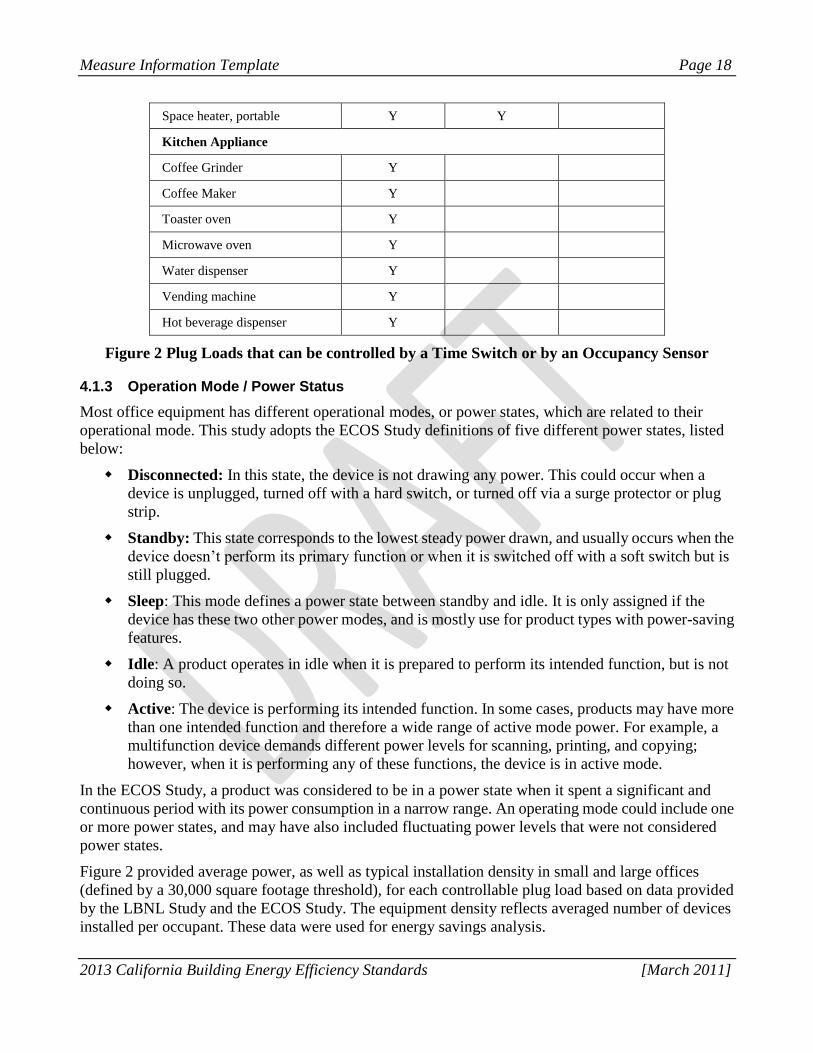
Figure 2 provides a detailed list of controllable plug loads, which include task lightings. The figure also
indicates control technologies that can be applied to these plug loads. It depends on where in the office
building the plug load can be found: workstation (private office or cubicle), conference room, copy
room or kitchen. Workstations and conference rooms allow for a finer grain controls using an
occupancy sensor where devices can be switched off whenever the space is unoccupied, while kitchen
and copy room appliances cannot be disrupted during business hours even without presence of any
occupants. Shut off controls of plug loads in these spaces are better to set to be during non-business
hours achieved with a time switch control. Detailed discussion on control technologies will be provided
in following sections.
The general concept for plug load control is to provide two separate sets of receptacles in office spaces
for task lighting and other plug loads. The electric circuits connected to one set of receptacles are
controlled to achieve automatically shut off, similar to general lighting circuit shut off control. This set
of receptacles is called controlled receptacles and are marked differently from others. When
controllable plug loads are connected to controlled receptacles, energy savings are expected.
Non-controllable plug loads are connected to un-controlled receptacles so that their services will not be
disrupted. Similar to general lighting shut off controls, building occupants should have easy access to
manual switches to override the shut off controls.
In practice, building occupants have the choice to decide which plug loads are to be plugged into
controlled receptacles.

Measure Information Template Page 17
2013 California Building Energy Efficiency Standards [March 2011]
Plug Load Time Switch
Control
Occupancy Sensor Control
Private Office /
Cubicle
Conference
Room
Task Lighting
Under Cabinet Light Y Y
Table Lamp Y Y
Monitor
CRT Y Y
LCD Y Y
Printing/Imaging Equipment
Laser MFD Y
Inkjet MFD Y
Laser printer Y
Inkjet printer Y
Wide Format Printer Y
Document Scanner Y
Audio /video
Television, LCD Y Y
DVD player Y Y
Video Projector Y Y
Speakers Y Y
Subwoofer Y Y
CD Player Y Y
Computer Speakers Y Y Y
Portable Stereo Y Y
Portable CD player Y Y
Table Radio Y Y
Other
Adding machine Y
Shredder Y
Stapler Y
Typewriter, Electric Y
Fan, portable Y Y
Measure Information Template Page 18
2013 California Building Energy Efficiency Standards [March 2011]
Space heater, portable Y Y
Kitchen Appliance
Coffee Grinder Y
Coffee Maker Y
Toaster oven Y
Microwave oven Y
Water dispenser Y
Vending machine Y
Hot beverage dispenser Y
Figure 2 Plug Loads that can be controlled by a Time Switch or by an Occupancy Sensor
4.1.3 Operation Mode / Power Status
Most office equipment has different operational modes, or power states, which are related to their
operational mode. This study adopts the ECOS Study definitions of five different power states, listed
below:
Disconnected: In this state, the device is not drawing any power. This could occur when a
device is unplugged, turned off with a hard switch, or turned off via a surge protector or plug
strip.
Standby: This state corresponds to the lowest steady power drawn, and usually occurs when the
device doesn’t perform its primary function or when it is switched off with a soft switch but is
still plugged.
Sleep: This mode defines a power state between standby and idle. It is only assigned if the
device has these two other power modes, and is mostly use for product types with power-saving
features.
Idle: A product operates in idle when it is prepared to perform its intended function, but is not
doing so.
Active: The device is performing its intended function. In some cases, products may have more
than one intended function and therefore a wide range of active mode power. For example, a
multifunction device demands different power levels for scanning, printing, and copying;
however, when it is performing any of these functions, the device is in active mode.
In the ECOS Study, a product was considered to be in a power state when it spent a significant and
continuous period with its power consumption in a narrow range. An operating mode could include one
or more power states, and may have also included fluctuating power levels that were not considered
power states.
Figure 2 provided average power, as well as typical installation density in small and large offices
(defined by a 30,000 square footage threshold), for each controllable plug load based on data provided
by the LBNL Study and the ECOS Study. The equipment density reflects averaged number of devices
installed per occupant. These data were used for energy savings analysis.

Measure Information Template Page 19
2013 California Building Energy Efficiency Standards [March 2011]
Plug Loads
Activ
e (W)
Idle (W
)
Sleep
(W)
Sta
nd
by
(W)
Density
(unit/person)
Power Density
(w/sf)
Small
Office
Large
Office
Small
Office
Large
Office
Task Lighting
Lamp, Desk
attachment
35.4 23.2 0.57 0.5 0.5 0.06 0.07
Lamp, Table 41.7 13.4 0.91 1 1 0.14 0.17
Monitor
CRT 70.6 64.2 45.9 2.6 0.21 0.23 0.05 0.07
LCD 34.2 26.4 6.19 0.88 0.99 1.07 0.11 0.15
Printing/Imaging
Laser MFD 75.7 26.1 5.44 5.45 0.01 0.01 0.00 0.00
Inkjet MFD 26.0 11.1 4.66 0.04 0.04 0.00 0.00
Laser printer 130.1 19.0 11.4 0.26 0.26 0.11 0.14
Inkjet printer 64.0 6.75 4.68 2.69 0.24 0.2 0.05 0.05
Wide Format Printer 86.8 28.6 5.62 0.048 0.04 0.01 0.01
Document Scanner 10.1 4.03 0.05 0.05 0.00 0.00
Audio /video
Television, LCD 58.2 3.14 0.04 0.04 0.01 0.01
DVD player 80.0 1.28 0.02 0.04 0.01 0.01
Video Projector 181.9 9.76 4.56 0.02 0.04 0.01 0.03
Speakers 32.0 10 3 1 0.04 0.08 0.00 0.01
Subwoofer 200.0 6.96 0 0.01 0.00 0.01
CD Player 8.3 2.06 0 0.02 0.00 0.00
Computer Speakers 6.0 2.43 1.66 1 1 0.02 0.02
Portable Stereo 7.5 3.31 0.88 0.02 0.01 0.00 0.00
Portable CD player 18.0 2.95 1.27 0.02 0.01 0.00 0.00
Table Radio 2.8 1.4 0.2 0.2 0.00 0.00
Other
Adding machine 3.6 3.57 1.58 0.04 0.04 0.00 0.00
Shredder 78 0.77 0.04 0.02 0.01 0.01
Stapler 2 0.81 1.22 0.04 0.02 0.00 0.00

Measure Information Template Page 20
2013 California Building Energy Efficiency Standards [March 2011]
Typewriter, Electric 7 3.38 0.02 0.02 0.00 0.00
Fan, portable 30 0.63 0.1 0.2 0.01 0.03
Space heater,
portable
938 1.03 0.1 0.2 0.31 0.78
Kitchen Appliance
Coffee Grinder 120.0 1.25 0.21 0.2 0.01 0.08 0.01
Coffee Maker 464 40.3 1.77 0.1 0.01 0.15 0.02
Toaster oven 1058 0.03 0.04 0.02 0.14 0.09
Microwave oven 1620 3 0.08 0.02 0.06 0.14
Water dispenser 90 1 0.08 0.01 0.00 0.00
Vending machine 205 1 0.04 0.01 0.00 0.01
Hot beverage
dispenser
1650 75 0 0.01 0.03 0.07
Figure 3 Plug Load Power States and Typical Installation Density
4.2 Market Assessment
The goal of the market study was to demonstrate feasibility and product availability of the proposed
task lighting control and plug load control requirements. The market study also provided information to
develop baseline designs for the cost analysis. Different levels of controls were investigated to test the
stringency level of code requirements that can still be cost effectively achieved.
4.2.1 Plug Load Control Standards
Both ASHRAE 90.1 and International Green Construction Code (IgCC) have adopted codes for plug
load controls. The ASHRAE 90.1 Lighting Subcommittee developed a CMP to 90.1-2007, modifying
Addendum “bs” section 8.4.2, labelled “Automatic Receptacle Control”. The IgCC technical
requirement was developed in the framework of soft-wire control technologies such as timer or
occupancy sensor on plug strips or smart strips rather than hard wiring control technologies.
Code language for both organizations can be found in Appendix I: ASHRAE and IgCC Plug Load
Control Standards.
4.2.2 Control Products
In general, electrical circuits dedicated to task lighting and other plug loads can be shut off in the same
way as general lighting shut off controls. Some manufacturers already promote lighting control
products for plug load controls to respond to the growing market demand for reduced plug load energy
consumption. Electrical designers, contractors, building managers, and building officials are familiar
with the design, installation, and operation of circuit controls due to various existing lighting control
code requirements. Hence, there are no infrastructure or market or behavior barriers to expand lighting
controls to task lighting and plug load circuits/receptacles.

Measure Information Template Page 21
2013 California Building Energy Efficiency Standards [March 2011]
Similar to general lighting controls, task lighting and plug load receptacle controls can be achieved with
time switch and occupancy sensor controls technologies. Manually override can be achieved with the
same type of dry contact signal or even using the same override switches. The following sections
describe control products that are widely available and are commonly used to demonstrate feasibility
and product availability. Lists of commercial products are intended as examples of available products.
The CASE study does not suggest they are the only ones capable of achieving the proposed control
requirements.
Time Switch Control Products
Time switch controls can be achieved with lighting control panels or controllable breaker panels. These
control panels are usually centrally located to serve a large zone of the building. Therefore, the CASE
study also refers to the control technology as the central timer control, although other non-central
control products can also achieve the same function.
Lighting Control Panels
Lighting control panels essentially use relays to switch on and off 120V or 277V lighting circuits. Most
manufacturers indicated that they can be used to control plug load circuits, which are 120V. These
relays can be controlled by an astronomical timer clock, building management system signal,
occupancy sensors or other inputs. Most control panels currently on the market are compatible with
BACNet, LonWorks, DMX512, and other building management communication protocols. They all
come with manual override to ensure services can be provided whenever needed, and most of them are
Title 24 compliant certified. These panels usually come in three sizes, the most common sizes being 8,
30 and 48 channels. Therefore, the number of circuits that can be controlled by one panel ranges from 8
to 48. Many buildings required more than one control panels. In this case, panels can be networked,
with only one logic controller for the whole network to avoid controller logic redundancy and to reduce
system cost. The number of panels allowed in a network varies from 10 to 128 depending on the
manufacturer and the product line. Most of the products can deal with 120V and 277V mixed loads and
hence control overhead lighting and plug control at the same time, using a voltage barrier, which is
usually a plastic plate to separate 120V and 277V circuits. Task lighting and plug load control can be
implemented by increasing the number of relays in the existing overhead lighting control panel.
Controllable Breaker Panels
Controllable breaker panels integrate circuit breakers for power surge protection and switch control into
one panel, so the system demands less space for installation. A controllable breaker panel can have
mixed number of controlled and uncontrolled channels. Usually, the number of controlled breakers in a
panel comes in multiples of four. The number of circuits in a panel ranges from to 4 to 42, the usual
panel size being 18, 30 and 42 circuits. Like lighting control panels, they are compatible with BACNet,
LonWorks, DMX512, and other common building management communication protocols. They have
manual overrides and take the same dry contact signal inputs as lighting control panels. They also can
be networked to support a large building or space. The number of panels in a network can go up to 12,
with 8 being the average. Some controllable breaker panels can accept mixed loads (120V and 277V).
Depending on configuration of general lighting controls, task lighting and plug load control can be
implemented by upgrade a regular breaker panel to a controllable breaker panel or by increasing the
number of controllable breakers in an existing breaker panel.
Figure 4 lists a sample of both types of control panels to demonstrate product availability.

Measure Information Template Page 22
2013 California Building Energy Efficiency Standards [March 2011]
Product Type Manufacturer Model
Lighting
Control Panel
Intelligent Lighting Control Light Master
Leviton e EZMax / ZMax
Lighting Control and Design GR2400 Quintessence
Lightholier/Philips LyteSwitch
Lutron LCP128
Siemens LCP3000EZ System
Wattstopper Lighting Integrator
Controllable
Breaker Panel
Cutler Hammer Power-R-Command
Lighting Control and design GR2400 SmartBreaker
Lutron XPS
Schneider Square D PowerLink
Siemens I-3 Control Technology P1 series
Synergy lighting control Synergy Controllable Breaker Panel
Figure 4 Examples of Lighting Control and Controllable Breaker Panels
Occupancy Sensor Controls
Occupancy sensor controls have been widely used for general lighting controls. There are no technical
barriers to applying this technology to controlled receptacles in the same fashion for general lighting
controls.
Most of high-voltage wall occupancy switches are single-pole based. When an occupancy sensor
control is already required to control 270V overhead lights, per 2008 Title 24 requirements, such as in
private offices and conference rooms, there are three options to accommodate occupancy sensor control
of 120V controlled receptacles:
Add additional high-voltage single-pole occupancy wall switches for the controlled receptacles
Use a high-voltage 2-pole occupancy sensor, e.g. SensorSwitch WSD-2P-I, with one pole for
general lighting and one pole for controlled receptacles
Use a low-voltage occupancy sensor, but separate relays, for general lighting and controlled
receptacles
The cost analysis considered all these options.
Figure 5 lists manufacturers and models of occupancy sensor controls. For occupancy sensor control in
open-space with cubicles, the occupancy sensor needs to be mounted on the cubicle furniture,
preferably under the desk. Most of occupancy sensors are designed for wall mount and may not be
suitable for cubicle furniture mounting. Some cubicle furniture, e.g. Herman Miller and Haworth,
already make furniture that includes occupancy sensor controls. They are not considered in the cost
analysis as a Title 24 compliance option.

Measure Information Template Page 23
2013 California Building Energy Efficiency Standards [March 2011]
Product Type Manufacturer Product Name
High-voltage Wall
Occupancy Switch
Cooper Controls Greengate OMC-P-0450-R
Enerlites WOSS15-W
Heath Zenith Lighting SL-6107-WH
Leviton OSC04-I0W
Lutron LOS-CIR-450-WH
SensorSwitch CM-9, WSD-2P-I (2-Pole)
Wattstopper PW100I
Low-voltage Occupancy
Sensor with Relay Box
Legrand Wiremold Convia
Lutron Maestro Wireless
Wattstopper Room Controller
Figure 5 Examples of Occupancy Sensor Controls
4.2.3 Level of Controls
Occupancy sensor controls have finer granularity of controls than timer controls as they can capture
more time periods when controlled plug loads can switched off. It is, therefore, desirable to use
occupancy sensors to control all task lighting and plug loads. The CASE study considered three levels
of control, with increased use of occupancy sensor controls, to test the maximum level of occupancy
sensor controls that can be feasibly and cost-effectively achieved. The three levels of controls are:
Level 1: No occupancy sensor controls. Central timer controls are used for all controlled
receptacles.
Level 2: Occupancy sensor controls are used for controlled receptacles in private offices and
conference rooms; central timer controls are used for controlled receptacles in all other spaces
including open-space workstations, kitchens, and copy rooms
Level 3: Occupancy sensor controls are used for controlled receptacles located in all building
spaces except those in kitchens and copy rooms.
The proposed Level 2 requirements are very similar to 2008 Title 24 shut off control requirements for
general lightings. The difference is that the occupancy sensor controls are not applied to kitchens and
copy rooms for plug load controls. Certain appliances, such as coffee maker and printers, need to
operate without the presence of any occupant. Using occupancy sensor control would lead occupants to
plug those appliances into uncontrolled receptacles, which would therefore never be controlled.
4.2.4 Task Lighting and Plug Load Circuit Wiring
The proposed task lighting and plug load controls would require independent circuits to be connected to
controlled and uncontrolled receptacles. This may or may not affect building circuit wiring, depending
on the control technologies and existing wiring practices. The CASE study evaluated the impact of
industry practices on cost and Title 24 compliance.
Measure Information Template Page 24
2013 California Building Energy Efficiency Standards [March 2011]
There are two practices regarding general office electrical wiring. One consists of laying out one circuit
at a time from the 3-circuits in-feed. The first circuit is laid out in one space, and the next circuit is used
to serve the next space. The other practice entails laying out the 3 circuits at the same time. In this case,
the 3 circuits will be used to feed the space receptacle
One building 3-circuit in-feed usually serves a group of 4 cubicles, but can serve go up to 8 cubicles
depending on the workstation type. Within the system furniture, three to four separate circuits are
commonly laid.
Occupancy sensor controls are installed locally. An electric circuit can be split into two branches locally
with one branch been controlled by the local occupancy sensor and connected to receptacles marked as
controlled, while the other is serving uncontrolled receptacles. More often, multiple circuits are
supplied to a workstation or other office spaces, as it is a preferred practice. In this case, one or two
circuits can be dedicated to task lighting and other controllable plug loads and will be controlled by an
occupancy sensor.
For central timer controls, controlled and uncontrolled circuits need to be separated at the central
control panel. Hence, dual circuits are required for all spaces where controlled receptacles are required.
According to the industry survey to described in Appendix II: Industry Practice Survey, dual circuit
wiring layout is the preferred practice for system reliability and is already used in 46% of office
building projects. All system furniture (cubicle) products accommodate multiple circuit inputs and are
equipped with receptacles with color-coding to differentiate connected circuits. Contractors are
required to clearly mark breakers for each circuit. It requires little additional efforts for electric
designers and contractors to mark controlled circuits and make sure they are connected to proper control
channels. This is especially true when controllable breaker panels are used. If connection mistakes are
made, they can be corrected at the control panel. Therefore, dual circuit wiring does not present any
implementation issue according to interviewed electrical designers, contractors and system furniture
manufacturers.
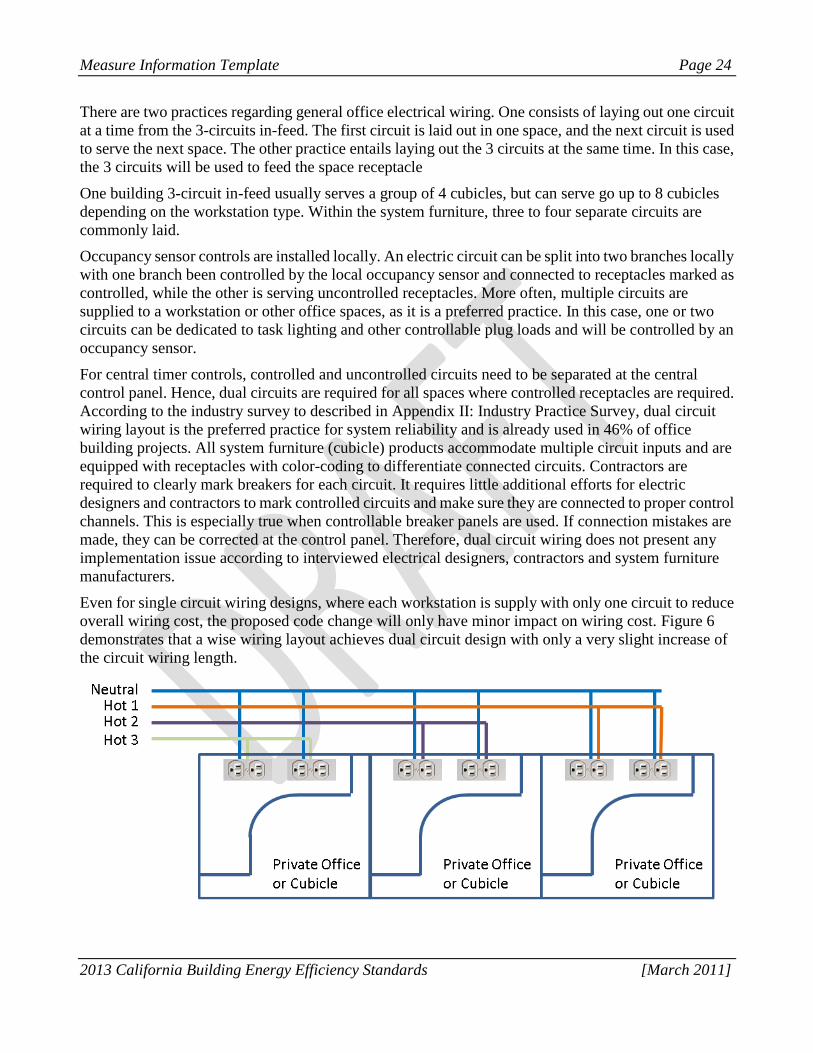
Even for single circuit wiring designs, where each workstation is supply with only one circuit to reduce
overall wiring cost, the proposed code change will only have minor impact on wiring cost. Figure 6
demonstrates that a wise wiring layout achieves dual circuit design with only a very slight increase of
the circuit wiring length.

Measure Information Template Page 25
2013 California Building Energy Efficiency Standards [March 2011]
Figure 6 Single circuit (top) versus double circuit (bottom) wiring practice
New construction office buildings may be finished without installation of workstation furniture, which
will be added later as part of the tenant improvement (TI) project, possibly along with
installation/improvement of overhead lightings. In this case, circuits for workstations will not be
connected to any receptacles. For the Title 24 compliance consideration, the proposed code change
would require that all unconnected circuits have to be marked to differentiate controlled circuits from
uncontrolled one to allow inspection and proper future installation. Local building department may
impose inspection during and after TI projects and installation of controlled receptacles can be
inspected accordingly.
The number of control channels depends on the number of controlled circuits, which, in turn, are
determined by the total power of office task lighting and other controllable plug loads. In general, a 20A
circuit can serve plug loads of 2-4 workstations, depending on the expected amount of office equipment
installed at each workstation. For cost analysis, the CASE study considered this range of possibility to
come up with low and high estimates of control panel upgrade requirements.
4.3 Prototype Buildings Development
The CASE study developed prototypes of small and large office buildings based on the Database for
Energy Efficient Resources (DEER). The detailed space layouts are provided in Appendix III: Office
Building Prototypes.
The DEER small office building prototype has two stories, with a rectangular footprint (50ft×100ft) and
total floor area of 10,000 sf. The building was estimated to have thirty three (33) occupants with nine (9)
private offices and one conference room on each floor.
The DEER large office building prototype has ten stories, 175,000 sf building, with a rectangular
footprint (175ft×100ft) and total floor area of 175,000 sf. It was estimated there were seven hundred and
thirty (730) occupants working in this building. All floors have a similar layout, which includes 19
private offices, 54 cubicles, 2 conference rooms, 2 copy rooms, kitchen and restrooms.
Measure Information Template Page 26
2013 California Building Energy Efficiency Standards [March 2011]
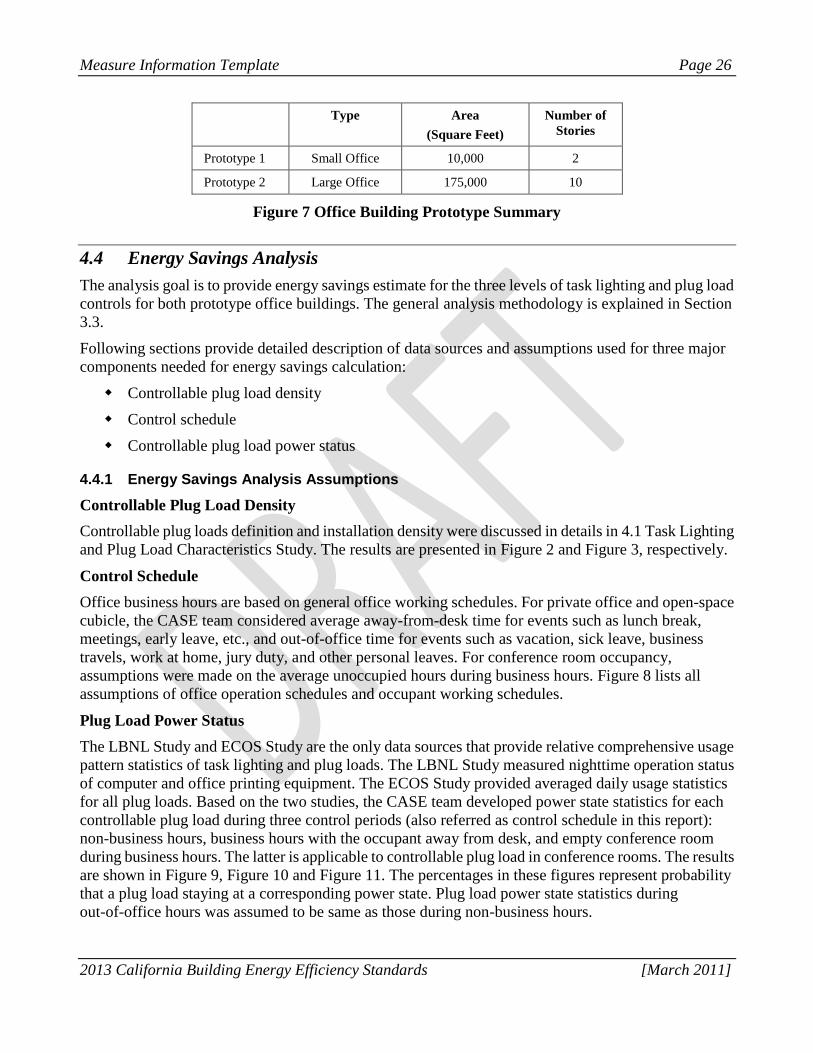
Type Area
(Square Feet)
Number of
Stories
Prototype 1 Small Office 10,000 2
Prototype 2 Large Office 175,000 10
Figure 7 Office Building Prototype Summary
4.4 Energy Savings Analysis
The analysis goal is to provide energy savings estimate for the three levels of task lighting and plug load
controls for both prototype office buildings. The general analysis methodology is explained in Section
3.3.
Following sections provide detailed description of data sources and assumptions used for three major
components needed for energy savings calculation:
Controllable plug load density
Control schedule
Controllable plug load power status
4.4.1 Energy Savings Analysis Assumptions
Controllable Plug Load Density
Controllable plug loads definition and installation density were discussed in details in 4.1 Task Lighting
and Plug Load Characteristics Study. The results are presented in Figure 2 and Figure 3, respectively.
Control Schedule
Office business hours are based on general office working schedules. For private office and open-space
cubicle, the CASE team considered average away-from-desk time for events such as lunch break,
meetings, early leave, etc., and out-of-office time for events such as vacation, sick leave, business
travels, work at home, jury duty, and other personal leaves. For conference room occupancy,
assumptions were made on the average unoccupied hours during business hours. Figure 8 lists all
assumptions of office operation schedules and occupant working schedules.
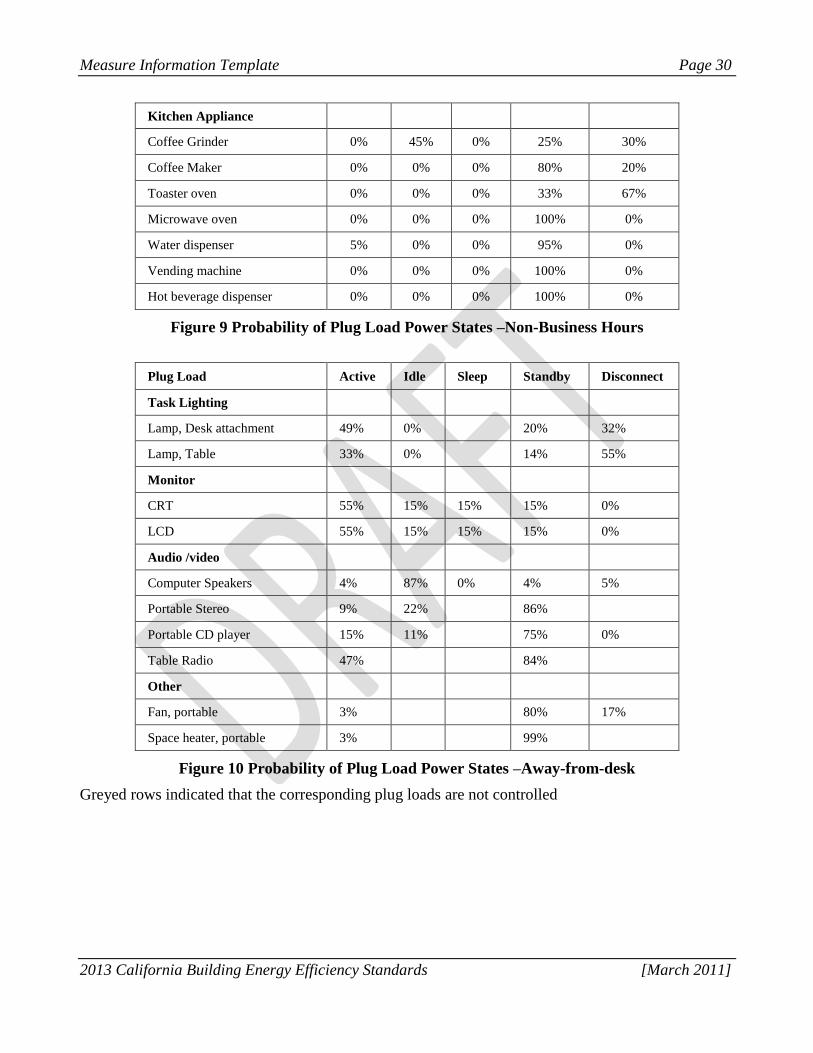
Plug Load Power Status
The LBNL Study and ECOS Study are the only data sources that provide relative comprehensive usage
pattern statistics of task lighting and plug loads. The LBNL Study measured nighttime operation status
of computer and office printing equipment. The ECOS Study provided averaged daily usage statistics
for all plug loads. Based on the two studies, the CASE team developed power state statistics for each
controllable plug load during three control periods (also referred as control schedule in this report):
non-business hours, business hours with the occupant away from desk, and empty conference room
during business hours. The latter is applicable to controllable plug load in conference rooms. The results
are shown in Figure 9, Figure 10 and Figure 11. The percentages in these figures represent probability
that a plug load staying at a corresponding power state. Plug load power state statistics during
out-of-office hours was assumed to be same as those during non-business hours.

Measure Information Template Page 27
2013 California Building Energy Efficiency Standards [March 2011]
Annual Office Hours
Number of weekend days 104
Number of holiday 10
Number of business days 251
Average business hours/day 12
Business hours 3012
Non-business Hours (Timer control hours) 5748
Annual Private Office/Work Station Hours
Number of vacation days 15
Number of sick/personal leave days 8
Number of business travel/work-at-home days 5
Annual in-office days 223
Annual out-of-office hours 336
Average hour in office per day 9
Average lunch/break hours/day 1
Average away-from-desk meeting hours/day 1
Annual away-from-desk hours 1115
Annual OC controlled hours 1451
Annual Conference Room Hours
Average occupied hours per day 5
Annual un-occupied hours during business hours 1757
Figure 8 Office Operation and Occupant Working Schedule Assumptions

Measure Information Template Page 28
2013 California Building Energy Efficiency Standards [March 2011]
The detailed calculation formulas are as following:
The average power of a controllable plug load, i, is the average of its power states, weighted by the
probabilities of power states.
PS = {Active, idle, sleep, standby}
The probabilities depend on following control schedule, j:
1. Non-Business hours
Business hours, the occupant is away from desk;
Business hours, the occupant is out of office
Business hours, empty Conference room (for conference room plug loads only)
Figure 9, Figure 10, and Figure 11 provide power state probabilities for all relevant plug load at the four
control schedules. A central time control only has scenario 1, while an occupant control has all control
scenarios.
The total power linked to a control, k, is the sum of power from all connected plug load. This is the
amount of power reduction that can be achieved by the corresponding control, a central control panel or
an occupancy senor.
Then, hourly energy savings were estimated based on office operation schedule provided in Figure 8.
During non-business hours, energy savings are achieved for every hour. The corresponding building
energy savings (kWh) at each non-business hour are:
For occupancy sensor controls, additional savings can be achieved during the three business hour
control scenarios. The office operation schedule shown in Figure 8 provides total number of hours for
each control scenario. We assumed that they were evenly distributed among the range of business
hours, with the exception that lunch hours were assumed to only from 12pm to 1pm. This approach
provided probabilities of circuit shut off, , at each business hour. The corresponding total
building energy savings are:
For both central timer control and occupancy sensor controls, personal fans and heaters were assumed
to be used in summer and winter months, respectively.

Measure Information Template Page 29
2013 California Building Energy Efficiency Standards [March 2011]
Plug Load Active Idle Sleep Standby Disconnect
Task Lighting
Lamp, Desk attachment 5% 0% 0% 5% 90%
Lamp, Table 5% 0% 0% 2% 93%
Monitor
CRT 10% 15% 0% 35% 40%
LCD 10% 15% 0% 35% 40%
Printing/Imaging Equipment
Laser MFD 0% 28% 0% 45% 27%
Inkjet MFD 0% 28% 0% 70% 2%
Laser printer 0% 35% 0% 45% 20%
Inkjet printer 0% 0% 0% 60% 40%
Wide Format Printer 0% 0% 0% 75% 25%
Document Scanner 0% 0% 0% 95% 5%
Audio /video
Television, LCD 0% 0% 0% 34% 66%
DVD player 0% 0% 0% 100% 0%
Video Projector 0% 0% 5% 64% 31%
Speakers 0% 37% 2% 40% 21%
Subwoofer 0% 100% 0% 0% 0%
CD Player 0% 0% 0% 95% 5%
Computer Speakers 0% 90% 0% 4% 6%
Portable Stereo 0% 5% 0% 86% 9%
Portable CD player 0% 8% 0% 75% 17%
Table Radio 0% 0% 0% 84% 16%
Other
Adding machine 0% 40% 0% 37% 23%
Shredder 0% 0% 0% 60% 40%
Stapler 0% 48% 0% 50% 2%
Typewriter, Electric 0% 44% 0% 50% 6%
Fan, portable 0% 0% 0% 80% 20%
Space heater, portable 0% 0% 0% 99% 1%
Measure Information Template Page 30
2013 California Building Energy Efficiency Standards [March 2011]
Kitchen Appliance
Coffee Grinder 0% 45% 0% 25% 30%
Coffee Maker 0% 0% 0% 80% 20%
Toaster oven 0% 0% 0% 33% 67%
Microwave oven 0% 0% 0% 100% 0%
Water dispenser 5% 0% 0% 95% 0%
Vending machine 0% 0% 0% 100% 0%
Hot beverage dispenser 0% 0% 0% 100% 0%
Figure 9 Probability of Plug Load Power States –Non-Business Hours
Plug Load Active Idle Sleep Standby Disconnect
Task Lighting
Lamp, Desk attachment 49% 0% 20% 32%
Lamp, Table 33% 0% 14% 55%
Monitor
CRT 55% 15% 15% 15% 0%
LCD 55% 15% 15% 15% 0%
Audio /video
Computer Speakers 4% 87% 0% 4% 5%
Portable Stereo 9% 22% 86%
Portable CD player 15% 11% 75% 0%
Table Radio 47% 84%
Other
Fan, portable 3% 80% 17%
Space heater, portable 3% 99%
Figure 10 Probability of Plug Load Power States –Away-from-desk
Greyed rows indicated that the corresponding plug loads are not controlled

Measure Information Template Page 31
2013 California Building Energy Efficiency Standards [March 2011]
Plug Load Active Idle Sleep Standby Disconnect
Audio /video
Television, LCD 47% 34% 19%
DVD player 100%
Video Projector 17% 5% 64% 14%
Speakers 20% 37% 2% 40% 1%
Subwoofer 100%
CD Player 15% 95%
Figure 11 Probability of Plug Load Power States – Empty Conference Room
4.4.2 Energy Savings Analysis Results
An EXCEL spreadsheet was developed to performance energy savings analysis based on the algorithms
described above. Figure 12 and Figure 13 present life cycle TDV savings benefits and annual TDV
energy savings, respectively for each three levels of control. Savings variation among sixteen (16)
climate zones is due TDV value differences.
Statewide energy savings were estimated by multiplying these values by office building new
construction forecast for 2013 provided by the CEC. The results are summarized in Figure 14.

Measure Information Template Page 32
2013 California Building Energy Efficiency Standards [March 2011]
Small Office Large Office
Climate Zone Level 1 Level 2 Level 3 Level 1 Level 2 Level 3
1 $0.71 $0.86 $0.98 $0.94 $1.05 $1.32
2 $0.73 $0.87 $0.98 $0.97 $1.07 $1.31
3 $0.75 $0.89 $0.99 $1.00 $1.10 $1.33
4 $0.79 $0.92 $1.02 $1.06 $1.15 $1.36
5 $0.82 $0.93 $1.03 $1.09 $1.17 $1.38
6 $0.83 $0.94 $1.03 $1.11 $1.18 $1.38
7 $0.87 $0.97 $1.06 $1.15 $1.23 $1.42
8 $0.86 $0.96 $1.05 $1.15 $1.22 $1.40
9 $0.87 $0.96 $1.04 $1.15 $1.22 $1.40
10 $0.86 $0.96 $1.04 $1.15 $1.22 $1.39
11 $0.86 $0.97 $1.05 $1.15 $1.22 $1.40
12 $0.85 $0.96 $1.04 $1.13 $1.21 $1.40
13 $0.83 $0.94 $1.04 $1.11 $1.19 $1.39
14 $0.80 $0.92 $1.01 $1.07 $1.15 $1.36
15 $0.77 $0.90 $1.00 $1.02 $1.11 $1.34
16 $0.74 $0.88 $0.99 $0.98 $1.08 $1.32
Figure 12 Present Values of Life Cycle Energy Savings ($/sf)

Measure Information Template Page 33
2013 California Building Energy Efficiency Standards [March 2011]
Small Office Large Office
Climate Zone Level 1 Level 2 Level 3 Level 1 Level 2 Level 3
1 7.96 9.67 11.03 10.61 11.82 14.81
2 8.18 9.73 10.97 10.90 12.00 14.72
3 8.46 9.95 11.14 11.26 12.33 14.95
4 8.93 10.31 11.41 11.89 12.88 15.30
5 9.16 10.48 11.55 12.20 13.14 15.48
6 9.33 10.58 11.58 12.42 13.31 15.52
7 9.73 10.94 11.91 12.95 13.82 15.96
8 9.71 10.84 11.75 12.93 13.74 15.74
9 9.73 10.83 11.71 12.95 13.74 15.68
10 9.70 10.81 11.69 12.91 13.71 15.66
11 9.69 10.85 11.78 12.90 13.73 15.78
12 9.55 10.76 11.73 12.72 13.58 15.71
13 9.35 10.61 11.63 12.45 13.35 15.58
14 8.99 10.32 11.40 11.97 12.92 15.27
15 8.64 10.07 11.22 11.50 12.53 15.05
16 8.28 9.83 11.08 11.03 12.13 14.87
Figure 13 Annual TDV Energy Savings (kBtu/sf/yr)
Small Office Large Office
Statewide
Energy
Savings
kWh/sf/yr MW/sf
NC Floor
Area
(Msf)
kWh/sf/yr MW/sf NC Floor
Area (Msf) GWh MW
Level 1 0.42 0
8.5
0.56 0
24.2
17.09 0
Level 2 0.49 0.197 0.61 0.236 18.93 4.94
Level 3 0.55 0.356 0.74 0.839 22.46 14.62
Figure 14 Statewide Energy Savings
Measure Information Template Page 34
2013 California Building Energy Efficiency Standards [March 2011]
4.5 Cost Analysis
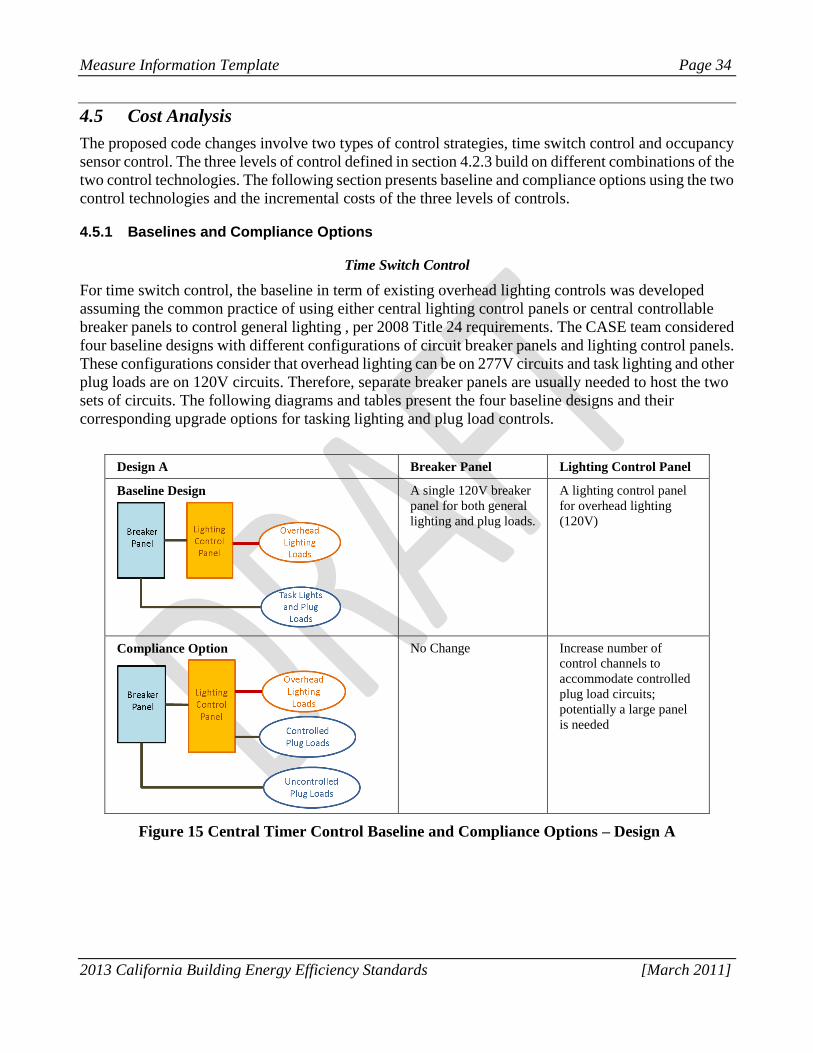
The proposed code changes involve two types of control strategies, time switch control and occupancy
sensor control. The three levels of control defined in section 4.2.3 build on different combinations of the
two control technologies. The following section presents baseline and compliance options using the two
control technologies and the incremental costs of the three levels of controls.
4.5.1 Baselines and Compliance Options
Time Switch Control
For time switch control, the baseline in term of existing overhead lighting controls was developed
assuming the common practice of using either central lighting control panels or central controllable
breaker panels to control general lighting , per 2008 Title 24 requirements. The CASE team considered
four baseline designs with different configurations of circuit breaker panels and lighting control panels.
These configurations consider that overhead lighting can be on 277V circuits and task lighting and other
plug loads are on 120V circuits. Therefore, separate breaker panels are usually needed to host the two
sets of circuits. The following diagrams and tables present the four baseline designs and their
corresponding upgrade options for tasking lighting and plug load controls.
Design A Breaker Panel Lighting Control Panel
Baseline Design
A single 120V breaker
panel for both general
lighting and plug loads.
A lighting control panel
for overhead lighting
(120V)
Compliance Option
No Change Increase number of
control channels to
accommodate controlled
plug load circuits;
potentially a large panel
is needed
Figure 15 Central Timer Control Baseline and Compliance Options – Design A

Measure Information Template Page 35
2013 California Building Energy Efficiency Standards [March 2011]
Design B Breaker Panel Lighting Control Panel
Baseline Design
Separate breaker panels
for overhead lighting
and plug loads,
including task lighting;
overhead lighting could
be 120V or 277V
A lighting control panel
for overhead lighting
(120V or 277V)
Compliance Option 1
Upgrade the regular
breakers to a
controllable breaker
panel; only control
circuits serving
controlled receptacles
No change
Compliance Option 2
No change Increase number of
control channels to
accommodate controlled
plug load circuits;
potentially a large panel
is needed; a voltage
barrier is needed if
overhead light and plug
loads have different
voltage
Figure 16 Central Timer Control Baseline and Compliance Options – Design B
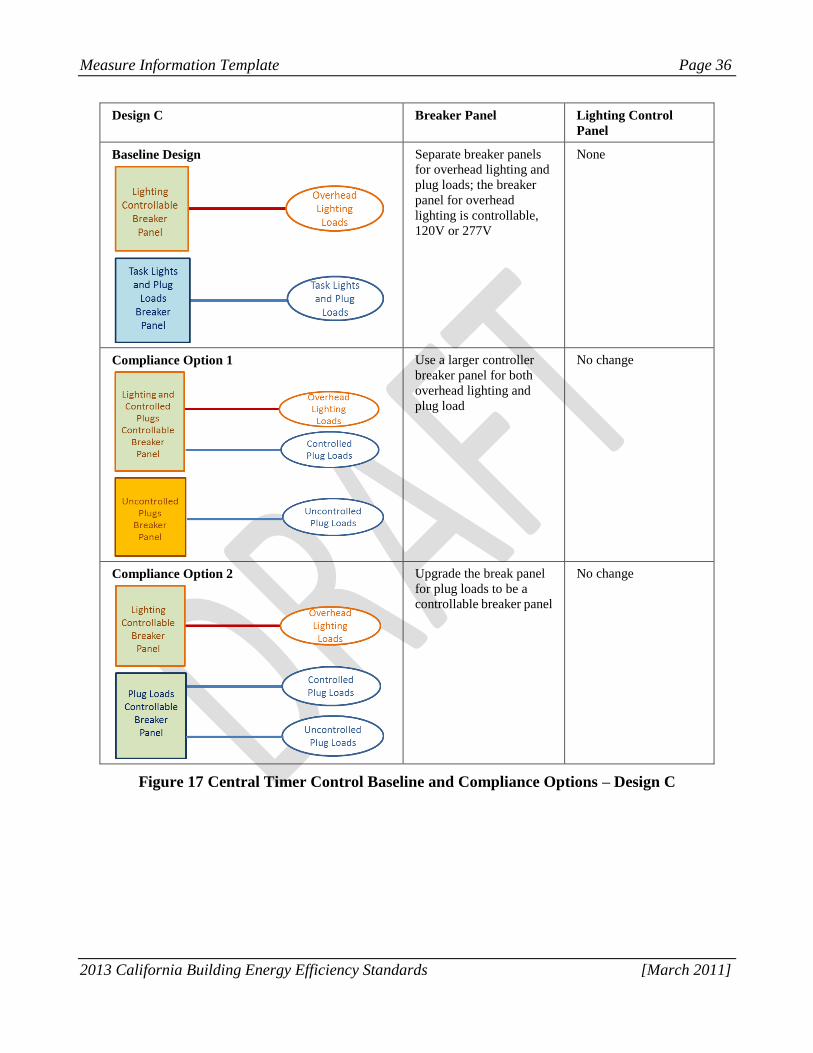
Measure Information Template Page 36
2013 California Building Energy Efficiency Standards [March 2011]
Design C Breaker Panel Lighting Control
Panel
Baseline Design
Separate breaker panels
for overhead lighting and
plug loads; the breaker
panel for overhead
lighting is controllable,
120V or 277V
None
Compliance Option 1
Use a larger controller
breaker panel for both
overhead lighting and
plug load
No change
Compliance Option 2
Upgrade the break panel
for plug loads to be a
controllable breaker panel
No change
Figure 17 Central Timer Control Baseline and Compliance Options – Design C

Measure Information Template Page 37
2013 California Building Energy Efficiency Standards [March 2011]
Design D Breaker Panel Lighting Control Panel
Baseline Design
One controllable
breaker panel for both
overhead lighting and
plug loads; only
overhead lighting
circuits are controlled
None
Compliance Option
Upgrade circuit
channels for controlled
receptacles to be
controllable
No change
Figure 18 Central Timer Control Baseline and Compliance Options – Design D
Industry practice survey indicated that the dual circuit wiring design, which brings at least two
independent circuits into workstations, represents 46% of the market practice. Hence, the baseline is a
weighted average of dual circuit wiring and single circuit wiring. The cost for upgrading to a dual
circuit design was estimated for the two office building prototypes based on the method described in
section 4.2.4.
Occupancy Sensor Control
For occupancy sensor controls, the baselines for existing overhead lighting control are based on the
2008 Title 24 requirement of occupancy sensor shut off controls for general lighting in office spaces
less than 250 sf which effectively covers private offices, and in conference rooms. System upgrades
needed for meeting the proposed changes are:
When a high-voltage occupancy sensor is used for 2008 Title 24 compliance, another
high-voltage occupancy sensor is installed to support controlled receptacles.
When a low-voltage occupancy sensor is used for 2008 Title 24 compliance, the corresponding
lighting control or relay box needs to be upgraded to include an additional channel to support
controlled receptacles.
The two scenarios above are illustrated in Figure 19. For the first scenario, a 2-pole occupancy sensor
can be used to support both general lighting and task lighting shut off controls. The cost would be
slightly lower. Since the majority of high-voltage occupancy sensors are single pole based, the use of
2-pole occupancy sensor was not included for cost analysis.
For open-space workstations, there is no baseline for control requirements. The proposed changes, as in
the level 3 control, can be met by installing a high-voltage occupancy sensor located under the desk.
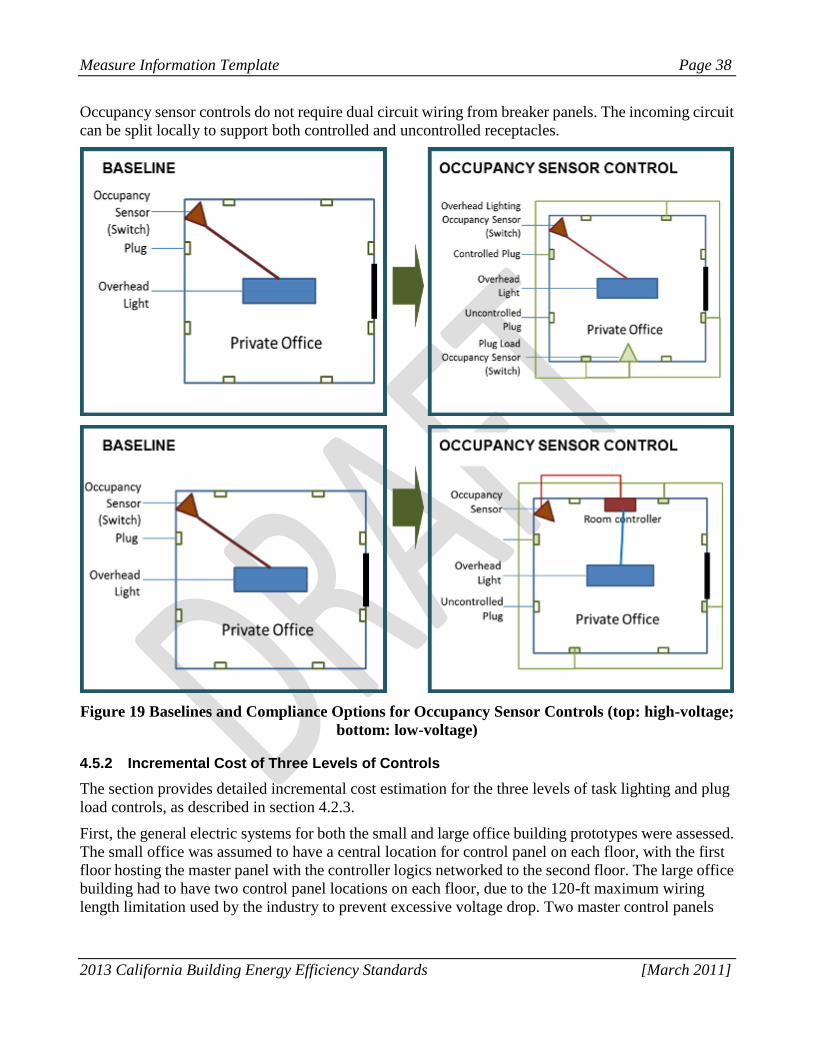
Measure Information Template Page 38
2013 California Building Energy Efficiency Standards [March 2011]
Occupancy sensor controls do not require dual circuit wiring from breaker panels. The incoming circuit
can be split locally to support both controlled and uncontrolled receptacles.
Figure 19 Baselines and Compliance Options for Occupancy Sensor Controls (top: high-voltage;
bottom: low-voltage)
4.5.2 Incremental Cost of Three Levels of Controls
The section provides detailed incremental cost estimation for the three levels of task lighting and plug
load controls, as described in section 4.2.3.
First, the general electric systems for both the small and large office building prototypes were assessed.
The small office was assumed to have a central location for control panel on each floor, with the first
floor hosting the master panel with the controller logics networked to the second floor. The large office
building had to have two control panel locations on each floor, due to the 120-ft maximum wiring
length limitation used by the industry to prevent excessive voltage drop. Two master control panels

Measure Information Template Page 39
2013 California Building Energy Efficiency Standards [March 2011]
were used to serve two control-panel networks, one for each side of the building so network wiring can
be easily routed along vertical electrical shafts.
Second, the total number of circuits for overhead lighting, task lighting, and other plug loads were
determined based on the building configurations. This information was used to determine control panel
sizes. The number of overhead lighting circuits was determined based on a lighting power density of 1.1
W/sf. The number of 120 V plug load circuits was estimated based on the office layout as well as on
electric system design practices. The analysis considered two levels of assumption of number of circuits
used to serve each space type, as shown in Figure 20, to cover the range of possible design practices.
Load Type Space Type More Circuits Less Circuits
Task
Lighting and
Other Plug
Loads
Private Office 1 circuit/private office 1/2 circuit/private office
Open Space Cubicle ½ circuit/cubicle ¼ circuit/cubicle
Copy Room 1 circuit/copy room
Lobby, Corridor 1 circuit
Kitchen 2 circuits/kitchen
Mechanical Room 2 circuits/mechanical room
Overhead
Lighting
Overhead lighting 1.1 W/sf LPD, 3 amp/circuit 1.1 W/sf LPD, 4 amp/circuit
Figure 20 Number of Circuits per Space Type
A 20% extra capacity was used for panel sizing to accommodate for future expansion, as commonly
done.
Third, the total incremental costs were estimated based on system upgrade requirements as described in
the prior section for each baseline design case. Figure 21 provides costs of central control panels for
several standard sizes, obtained from manufacturer surveys. Master panels include control logics while
slave panels can only receive control signals. The cost for control panel installation and configuration is
assumed to be 2 hr per control panel. Wiring material and labor costs were assessed using RS Means
data as 1.27 hr/ 100ft of wire. Electric contractor hourly labor rate was assumed to be 86.11 /hr. Figure
22 provides cost estimate for each occupancy sensor option.
Panel Type Type 8 relays
/breakers
24 relays
/breakers
42 relays
/breakers
Lighting Control
Panel
Master $2,305 $3,085 $3,960
Slave $1,495 $2,305 $3,215
Controllable Breaker
Panel
Master $1,090 $2765 $4,650
Slave $930 $2,335 $3,915
Figure 21 Central Timer Control Panel Cost

Measure Information Template Page 40
2013 California Building Energy Efficiency Standards [March 2011]
Options Unit Price Installation
Time/unit
Labor Cost
/unit
One High-voltage Wall Switch $25 0.35 $ 30
One additional Relay Channel for
Low-voltage Occupancy Sensor Control
$100 0.7 $ 60
Figure 22 Occupancy Sensor Control Cost
Level 1 Control Incremental Cost
This level of control requires all task lighting and plug loads to be controlled by central timer controls.
The system upgrade requirements are summarized in Figure 23 for each compliance option. The
additional wiring length to support dual circuit wiring is shown in Figure 24. Unit office area
incremental costs are summarized in Figure 25. For an initial electric system design using minimum
number of circuits, more wiring upgrade is required to support the controllable receptacle requirement.
Total incremental cost also depends on incremental cost associated with control panel upgrade
schedule. As shown in Figure 25, some scenarios of “Less Circuits” show slightly higher incremental
cost than corresponding “More Circuits” scenarios.
Baseline Option Small Office Large Office
Less Circuits More Circuits Less Circuits More Circuits
A 1 Add 6 relays
control panel
Add 8 relays to
control panel
Add 9 relays to
control panel
Add to 15 relays to
control panel
B 1 Change task/plug loads breaker panel by controllable breaker panel
2 Add to 6 relays
control panel
Add to 8 relays to
control panel
Add to 9 relays to
control panel
Add to 15 relays to
control panel
C 1 Increase
controllable
breaker panel by
6 controlled
breakers and 14
breakers
No task/plug
breaker panel
Increase
controllable
breaker panel by 8
controlled breakers
and 16 breakers
No task/plug
breaker panel
Increase
controllable breaker
panel by 9
controlled breakers
and 16 breakers
No task/plug
breaker panel
Increase
controllable breaker
panel by 15
controlled breakers
and 23 breakers
No task/plug
breaker panel
2 Change task/plug loads breaker panel by controllable breaker panel
D 1 Replace 6 regular
breakers by
controllable
breakers in the
controllable
breaker panel
Replace 8 regular
breakers by
controllable
breakers in the
controllable
breaker panel
Replace 9 regular
breakers by
controllable
breakers in the
controllable breaker
panel
Replace 15 regular
breakers by
controllable
breakers in the
controllable breaker
panel
Figure 23 Control System Upgrade Requirement – Level 1 Control

Measure Information Template Page 41
2013 California Building Energy Efficiency Standards [March 2011]
Small Office Large Office
Less Circuits More Circuits Less Circuits More Circuits
Additional Wiring
Length (ft) 252 120 3,250 2,340
Figure 24 Additional Wiring Length for Dual Circuit Wiring Support– Level 1 Control
Baseline Central
Timer
Control
Option
Small Office Large Office
Less
Circuits
More
Circuits
Less
Circuits
More
Circuits
A 1 $0.25 $0.26 $0.17 $0.23
B 1 $0.55 $0.55 $0.29 $0.33
2 $0.29 $0.29 $0.18 $0.25
C 1 $0.18 $0.17 $0.12 $0.15
2 $0.52 $0.51 $0.27 $0.31
D 1 $0.17 $0.14 $0.11 $0.14
Figure 25 System Incremental Cost – Level 1 Control ($/sf)
Level 2 Control Incremental Cost
In this control level, central timer control is used for task lights and plug loads serving open-space
workstations, kitchens, and copy rooms and occupancy sensor controls are used in private offices and
conference rooms. Central control panel upgrade requirements are summarized in Figure 26. Level 2
control requires less additional wiring since controllable receptacles are used in private offices. Figure
28 shows the unit are system upgrade incremental cost for each prototype. Similar to the level 1 control,
when an office electric system has relatively less number of circuit, more system upgrade might be
needed, therefore having a higher incremental cost.
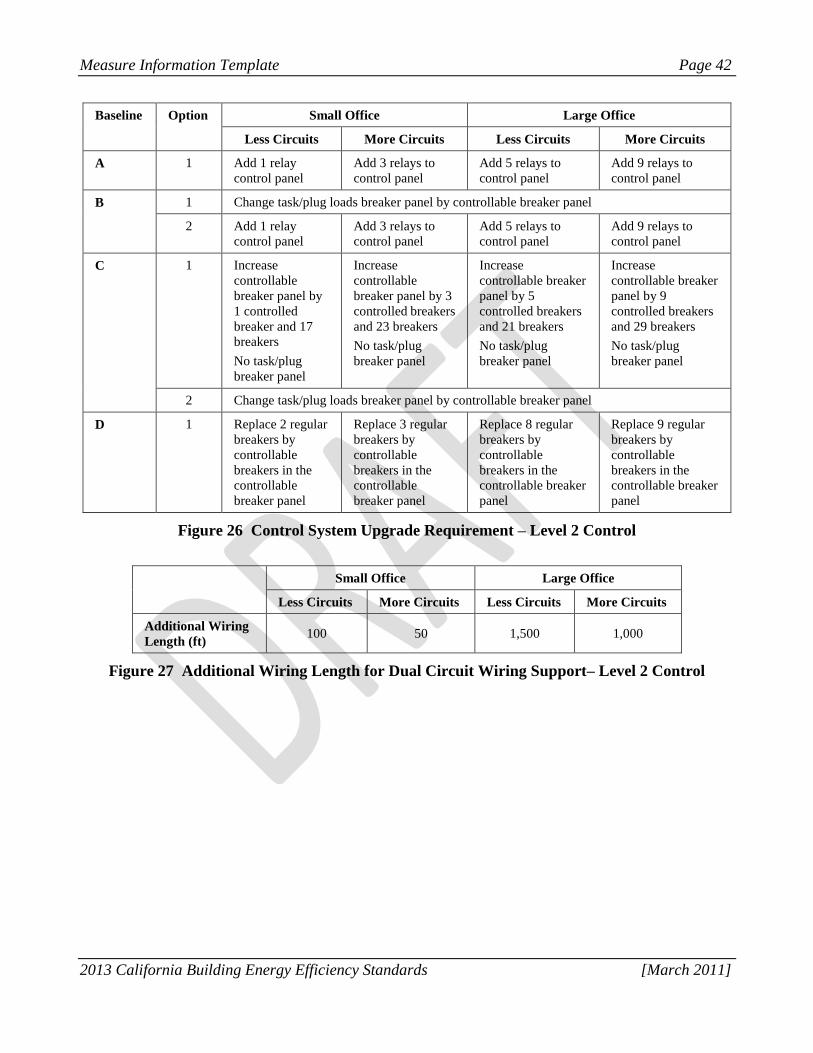
Measure Information Template Page 42
2013 California Building Energy Efficiency Standards [March 2011]
Baseline Option Small Office Large Office
Less Circuits More Circuits Less Circuits More Circuits
A 1 Add 1 relay
control panel
Add 3 relays to
control panel
Add 5 relays to
control panel
Add 9 relays to
control panel
B 1 Change task/plug loads breaker panel by controllable breaker panel
2 Add 1 relay
control panel
Add 3 relays to
control panel
Add 5 relays to
control panel
Add 9 relays to
control panel
C 1 Increase
controllable
breaker panel by
1 controlled
breaker and 17
breakers
No task/plug
breaker panel
Increase
controllable
breaker panel by 3
controlled breakers
and 23 breakers
No task/plug
breaker panel
Increase
controllable breaker
panel by 5
controlled breakers
and 21 breakers
No task/plug
breaker panel
Increase
controllable breaker
panel by 9
controlled breakers
and 29 breakers
No task/plug
breaker panel
2 Change task/plug loads breaker panel by controllable breaker panel
D 1 Replace 2 regular
breakers by
controllable
breakers in the
controllable
breaker panel
Replace 3 regular
breakers by
controllable
breakers in the
controllable
breaker panel
Replace 8 regular
breakers by
controllable
breakers in the
controllable breaker
panel
Replace 9 regular
breakers by
controllable
breakers in the
controllable breaker
panel
Figure 26 Control System Upgrade Requirement – Level 2 Control
Small Office Large Office
Less Circuits More Circuits Less Circuits More Circuits
Additional Wiring
Length (ft) 100 50 1,500 1,000
Figure 27 Additional Wiring Length for Dual Circuit Wiring Support– Level 2 Control

Measure Information Template Page 43
2013 California Building Energy Efficiency Standards [March 2011]
Baseline Central
Timer
Control
Option
Occupancy
Sensor
Control
Option
Small Office Large Office
Less
Circuits
More
Circuits
Less
Circuits
More
Circuits
A 1 Low-voltage $0.27 $0.26 $0.18 $0.23
High-voltage $0.42 $0.41 $0.27 $0.32
B
1 Low-voltage $0.64 $0.65 $0.34 $0.37
High-voltage $0.79 $0.80 $0.43 $0.46
2 Low-voltage $0.30 $0.30 $0.20 $0.24
High-voltage $0.45 $0.45 $0.29 $0.29
C 1 Low-voltage $0.28 $0.28 $0.17 $0.20
High-voltage $0.43 $0.43 $0.26 $0.29
2 Low-voltage $0.61 $0.61 $0.32 $0.37
High-voltage $0.76 $0.76 $0.41 $0.46
D 1 Low-voltage $0.22 $0.20 $0.13 $0.17
High-voltage $0.37 $0.35 $0.22 $0.26
Figure 28 System Incremental Cost – Level 2 Control ($/sf)
Level 3 Control Incremental Cost
The level 3 control requires occupancy sensor controls to be installed in private offices, open-space
cubicles, and conference rooms and central timer control is applied to controllable plug loads in
kitchens and copy rooms. Figure 29 shows the number of occupancy sensor controls needed for each
prototype building. It is assumed that open-space cubicles will use high-voltage switch type of
occupancy sensor.
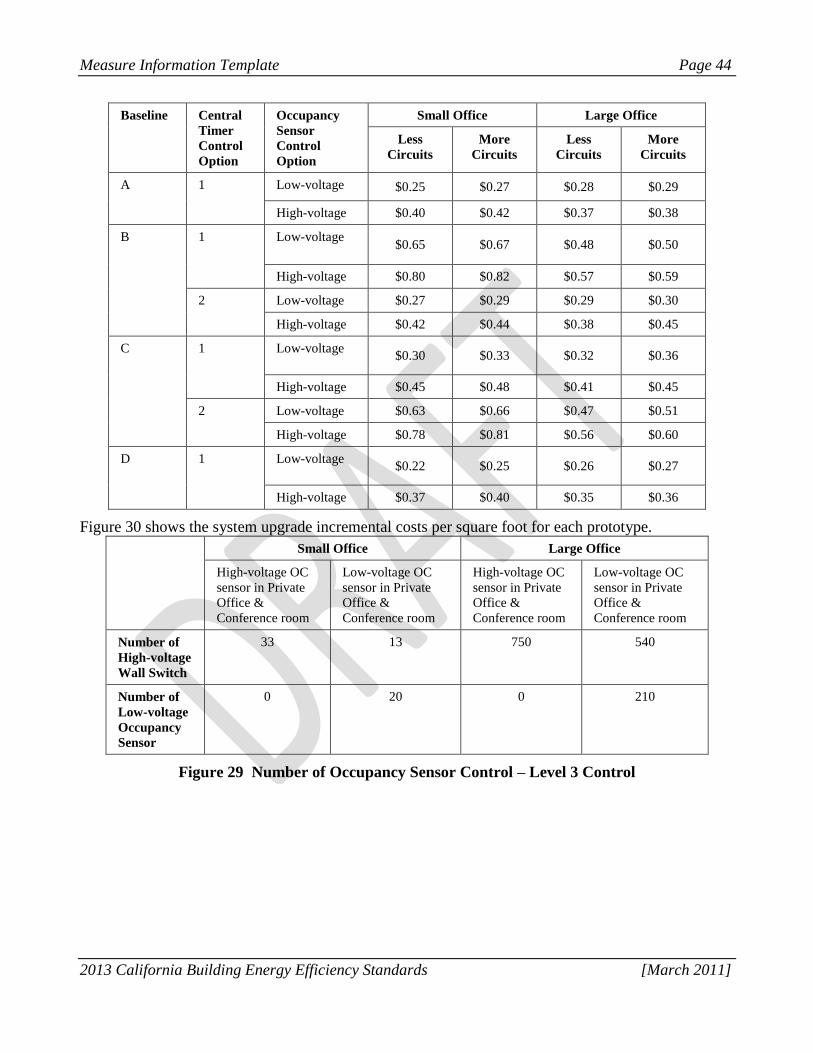
Measure Information Template Page 44
2013 California Building Energy Efficiency Standards [March 2011]
Baseline Central
Timer
Control
Option
Occupancy
Sensor
Control
Option
Small Office Large Office
Less
Circuits
More
Circuits
Less
Circuits
More
Circuits
A 1 Low-voltage $0.25 $0.27 $0.28 $0.29
High-voltage $0.40 $0.42 $0.37 $0.38
B
1 Low-voltage $0.65 $0.67 $0.48 $0.50
High-voltage $0.80 $0.82 $0.57 $0.59
2 Low-voltage $0.27 $0.29 $0.29 $0.30
High-voltage $0.42 $0.44 $0.38 $0.45
C 1 Low-voltage $0.30 $0.33 $0.32 $0.36
High-voltage $0.45 $0.48 $0.41 $0.45
2 Low-voltage $0.63 $0.66 $0.47 $0.51
High-voltage $0.78 $0.81 $0.56 $0.60
D 1 Low-voltage $0.22 $0.25 $0.26 $0.27
High-voltage $0.37 $0.40 $0.35 $0.36
Figure 30 shows the system upgrade incremental costs per square foot for each prototype.
Small Office Large Office
High-voltage OC
sensor in Private
Office &
Conference room
Low-voltage OC
sensor in Private
Office &
Conference room
High-voltage OC
sensor in Private
Office &
Conference room
Low-voltage OC
sensor in Private
Office &
Conference room
Number of
High-voltage
Wall Switch
33 13 750 540
Number of
Low-voltage
Occupancy
Sensor
0 20 0 210
Figure 29 Number of Occupancy Sensor Control – Level 3 Control

Measure Information Template Page 45
2013 California Building Energy Efficiency Standards [March 2011]
Baseline Central
Timer
Control
Option
Occupancy
Sensor
Control
Option
Small Office Large Office
Less
Circuits
More
Circuits
Less
Circuits
More
Circuits
A 1 Low-voltage $0.25 $0.27 $0.28 $0.29
High-voltage $0.40 $0.42 $0.37 $0.38
B
1 Low-voltage $0.65 $0.67 $0.48 $0.50
High-voltage $0.80 $0.82 $0.57 $0.59
2 Low-voltage $0.27 $0.29 $0.29 $0.30
High-voltage $0.42 $0.44 $0.38 $0.45
C 1 Low-voltage $0.30 $0.33 $0.32 $0.36
High-voltage $0.45 $0.48 $0.41 $0.45
2 Low-voltage $0.63 $0.66 $0.47 $0.51
High-voltage $0.78 $0.81 $0.56 $0.60
D 1 Low-voltage $0.22 $0.25 $0.26 $0.27
High-voltage $0.37 $0.40 $0.35 $0.36
Figure 30 System Incremental Cost – Level 3 Control ($/sf)
4.6 Cost Effectiveness Analysis
Results of energy savings and cost analysis were combined to produce LCC as defined in section 3.5.
The results are shown in Figure 31, Figure 32 and Figure 33 . As energy savings variation among
different climate zones are small, averaged TDV energy savings among all sixteen (16) climate zones
were used. The results clearly indicate all three levels of proposed controls have negative LCC values.
Therefore, the proposed measures are cost effective.

Measure Information Template Page 46
2013 California Building Energy Efficiency Standards [March 2011]
Baseline Central Timer
Control Option
Small Office Large Office
Less Circuits More Circuits Less Circuits More Circuits
A 1 ($0.58) ($0.57) ($0.92) ($0.86)
B 1 ($0.28) ($0.28) ($0.80) ($0.76)
2 ($0.54) ($0.54) ($0.91) ($0.84)
C 1 ($0.65) ($0.66) ($0.97) ($0.94)
2 ($0.31) ($0.32) ($0.82) ($0.78)
D 1 ($0.66) ($0.69) ($0.98) ($0.95)
Figure 31 LCC – Level 1 Control
Baseline Central
Timer
Control
Option
Occupancy
Sensor
Control
Option
Small Office Large Office
Less
Circuits
More
Circuits
Less
Circuits
More
Circuits
A 1 Low-voltage ($0.67) ($0.68) ($0.99) ($0.94)
High-voltage ($0.52) ($0.53) ($0.90) ($0.85)
B
1 Low-voltage ($0.30) ($0.29) ($0.83) ($0.80)
High-voltage ($0.15) ($0.14) ($0.74) ($0.71)
2 Low-voltage ($0.64) ($0.64) ($0.97) ($0.93)
High-voltage ($0.49) ($0.49) ($0.88) ($0.88)
C 1 Low-voltage ($0.66) ($0.66) ($1.00) ($0.97)
High-voltage ($0.51) ($0.51) ($0.91) ($0.88)
2 Low-voltage ($0.33) ($0.33) ($0.85) ($0.80)
High-voltage ($0.18) ($0.18) ($0.76) ($0.71)
D 1 Low-voltage ($0.72) ($0.74) ($1.04) ($1.00)
High-voltage ($0.57) ($0.59) ($0.95) ($0.91)
Figure 32 LCC – Level 2 Control
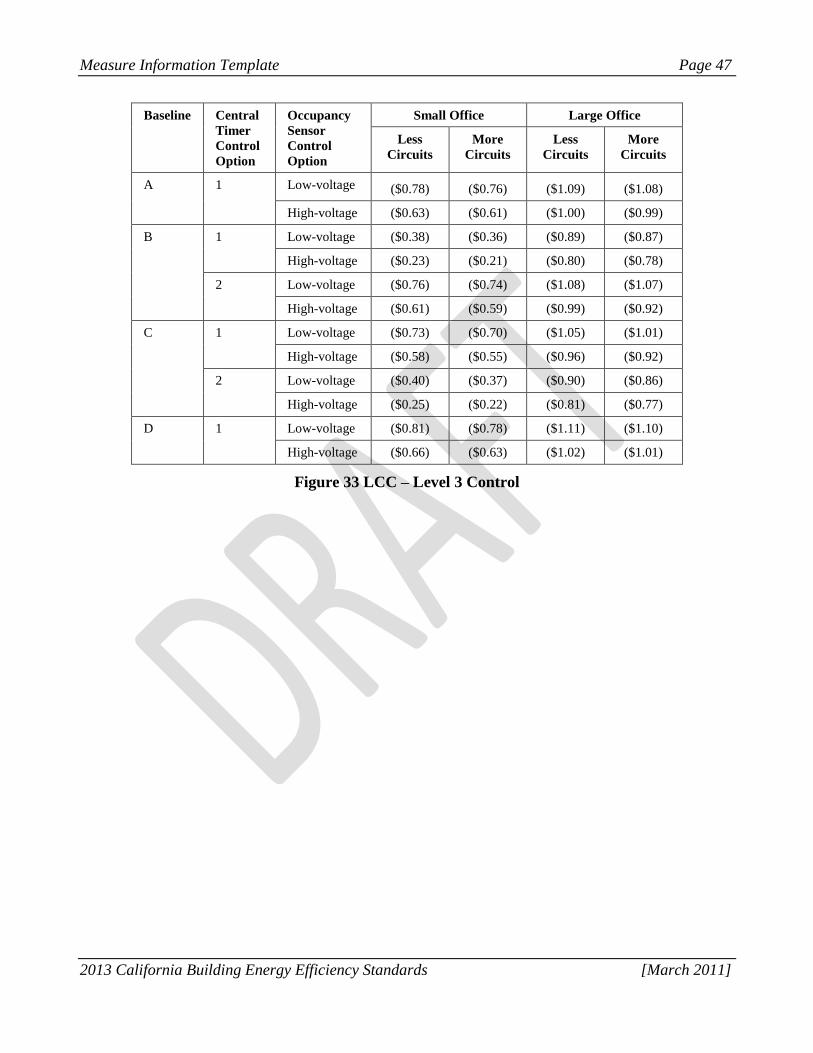
Measure Information Template Page 47
2013 California Building Energy Efficiency Standards [March 2011]
Baseline Central
Timer
Control
Option
Occupancy
Sensor
Control
Option
Small Office Large Office
Less
Circuits
More
Circuits
Less
Circuits
More
Circuits
A 1 Low-voltage ($0.78) ($0.76) ($1.09) ($1.08)
High-voltage ($0.63) ($0.61) ($1.00) ($0.99)
B
1 Low-voltage ($0.38) ($0.36) ($0.89) ($0.87)
High-voltage ($0.23) ($0.21) ($0.80) ($0.78)
2 Low-voltage ($0.76) ($0.74) ($1.08) ($1.07)
High-voltage ($0.61) ($0.59) ($0.99) ($0.92)
C 1 Low-voltage ($0.73) ($0.70) ($1.05) ($1.01)
High-voltage ($0.58) ($0.55) ($0.96) ($0.92)
2 Low-voltage ($0.40) ($0.37) ($0.90) ($0.86)
High-voltage ($0.25) ($0.22) ($0.81) ($0.77)
D 1 Low-voltage ($0.81) ($0.78) ($1.11) ($1.10)
High-voltage ($0.66) ($0.63) ($1.02) ($1.01)
Figure 33 LCC – Level 3 Control

Measure Information Template Page 48
2013 California Building Energy Efficiency Standards [March 2011]
5. Recommended Language for the Standards Document,
ACM Manuals, and the Reference Appendices
The CASE study investigated three levels of controls. All of them can be achieved cost effectively.
Lighting control products are widely available to support field implementation. It is desirable to require
the level 3 control to maximize energy savings. However, occupancy sensor control at open-space
cubicles may not be easily enforced through existing office building permitting and inspection process,
since many office buildings are built for future lease and do not have specific cubicle layout plan upon
construction completion. Therefore, the CASE study recommends that the level 2 control, which is very
similar to 2008 Title 24 general lighting control requirements, be adopted for task lighting and plug load
circuit controls.
We propose to add Section 131(h) for task lighting shut off controls.
In the following proposed language, additions are shown underlined and deletions are shown in
strikeout.
SECTION 131 – INDOOR LIGHTING CONTROLS THAT SHALL BE INSTALLED
(h) Task lighting. In all buildings, both controlled and uncontrolled receptacles shall be provide
in each private office, open office space, conference room, kitchen, and copy room. Controlled
receptacles will allow automatic shut off control of connected task lighting and plug loads.
Controlled receptacles shall meet the following requirements:
1. Electric circuits serving controlled receptacles shall be equipped with automatic shut-off
controls following the requirements prescribed in section 131(d) for general lighting; and
2. At least one controlled receptacle shall be installed within 1 foot from each uncontrolled
receptacles; and
3. Controlled receptacles shall be located and marked to differentiate them from uncontrolled
receptacles, and
4. For open office spaces, controlled circuits shall be provided and marked to support installation
and configuration of office furniture with receptacles that comply with section 131 (h) 1, 2, and 3.

Measure Information Template Page 49
2013 California Building Energy Efficiency Standards [March 2011]
6. Bibliography and Other Research
Benchmark Offices, “Office space floor plan”, http://www.benchmarkoffices.com/floorplans.htm
California Energy Commission, “Commercial Building End-Use Survey (CEUS)”,
http://www.energy.ca.gov/ceus/
California Public Utility commission, “Database for Energy Efficient Resources”,
http://www.deeresources.com/
Chase A.., Ramos R., Pope T., “Consumer Electronics: Market Trends, Energy Consumption, and
Program Recommendations 2005-2010”, December 2006
De Chiara J., Crosbie M., “Time Saver Standard for Building Types”, 4th edition, McGraw-Hill
Professional Publishing, 2000
ECOS, Office Plug Load Field Monitoring Report California Energy Commission, PIER
Energy-Related Environmental Research Program, CEC-500-06-007, 2008
Kawamoto K., Koomey J., Nordman B., Brown R., Piette MA., and Meier A., “Electricity Used by
Office Equipment and Network Equipment in the U.S.”, Energy Analysis Department
Environmental Energy Technologies Division Ernest Orlando Lawrence Berkeley National
Laboratory, LBNL-45917, August 2000
Kawamoto K., Koomey J., Nordman B., Brown R., Piette MA., Ting M., Meier A., “Electricity Used by
Office Equipment and Network Equipment in the U.S.: Detailed report and appendices”, Energy
Analysis Department Environmental Energy Technologies Division Ernest Orlando Lawrence
Berkeley National Laboratory, LBNL-45917, February 2001
National Electrical Installation Standards, “All NEIS Standards”, http://www.neca-neis.org/standards/
National Fire Protection Association, “NFPA 70 : National Electrical Code”, Codes & Standards, ,
http://www.nfpa.org/aboutthecodes/AboutTheCodes.asp?DocNum=70
Roberson J., Homan G., Mahajan A., Nordman B., Webber C., Brown R., McWhinney M., Koomey J.,
“Energy Use and Power Levels in New Monitors and Personal Computers”, Energy Analysis
Department Environmental Energy Technologies Division Ernest Orlando Lawrence Berkeley
National Laboratory, LBNL-48581, July 2002, http://enduse.lbl.gov/Projects/OffEqpt.html
Roberson J., Webber C., McWhinney M., Brown R., Pinckard M., and Busch J., “After-hours Power
Status of Office Equipment and Energy Use of Miscellaneous Plug-Load Equipment”,
LBNL-53729-Revised, May 2004
Roth K., Goldstein F., Kleinman J., “Energy Consumption by Office and Telecommunications
Equipment in Commercial Buildings Volume I: Energy Consumption Baseline”, prepared for
Office of Building Equipment Office of Building Technology State and Community Programs,
January 2002
Roth K., Goldstein F., Kleinman J., “Energy Consumption by Office and Telecommunications
Equipment in Commercial Buildings Volume II: Energy Savings Potential”, prepared for Building
Technologies Program, December 2004

Measure Information Template Page 50
2013 California Building Energy Efficiency Standards [March 2011]
Sanchez M. Webber C., Brown R., Busch J., Pinckard M., Roberson J., “Space Heaters, Computers,
Cell Phone Chargers: How Plugged In Are Commercial Buildings?”, Environmental Energy
Technologies Division Ernest Orlando Lawrence Berkeley National Laboratory University of
California , February 2007
SmartDraw Communicate Visually, “Easy floor plan software”,
http://www.smartdraw.com/specials/floorplans.asp
Southern California Edison, Design and Engineering Services, “Office of the Future Phase II Report
The 25% Solution”, Prepared for: The Office of the Future Consortium: Design and Engineering
Services, Southern California Edison; Pacific Gas & Electric; Sempra Energy; Sacramento
Municipal Utility District; Consolidated Edison; National Grid; NSTAR; BC Hydro; U.S.
Department of Energy, January 2002
The WattStopper, “Lighting control best practice guide: Office Buildings”,
http://www.nxtbook.com/nxtbooks/wattstopper/officebuildingsbpg08/
Webber C., Roberson J., Brown R., Payne C., Nordman B., Koomey J., “Field Surveys of Office
Equipment Operating Patterns”, Energy Analysis Program Environmental Energy Technologies
Division Lawrence Berkeley National Laboratory, LBNL-46930, September 2001,
http://enduse.lbl.gov/Projects/OffEqpt.html

Measure Information Template Page 51
2013 California Building Energy Efficiency Standards [March 2011]
7. Appendix I: ASHRAE and IgCC Plug Load Control
Standards
This section presents the ASHRAE 90.1 and the International Green Construction Code (IgCC)
language regarding plug load controls.
7.1 ASHRAE 90.1
The ASHRAE Lighting Subcommittee developed CMP to 90.1-2007, modifying Addendum
“bs”section 8.4.2, labelled “Automatic Receptacle Control”. The revised language is as follows:
“At least 50% of all 125 volt 15- and 20-Ampere receptacles, including those installed in
modular partitions, installed in the following space types:
Private offices
Open offices
Computer Classrooms
shall be controlled by an automatic control device that shall function on:
a. a scheduled basis using a time-of-day operated control device that turns receptacles
off at specific programmed times - an independent program schedule shall be provided
for areas of no more than 25,000 ft2 but not more than one floor - or
b. an occupant sensor that shall turn receptacles off within
30 minutes of all occupants leaving a space or
c. a signal from another control or alarm system that indicates the area is unoccupied.
Exceptions: Receptacles for the following shall not require an automatic control device:
Receptacles specifically designated for equipment requiring 24 hour operation.
Spaces where an automatic shutoff would endanger the safety or security of the room or
building occupant(s).”
7.2 International Green Construction Code (IgCC)
The IgCC also developed plug load control requirements. This is a technical requirement which doesn’t
specify implementation means. It was thought rather in the framework of soft-wire control technologies
such as timer or occupancy sensor on plug strips or smart strips rather than hard wiring control
technologies. The code language is the following:
“609.6 Plug load controls. Receptacles and electrical outlets controlled by an occupant sensor or time
switch shall be provided in accordance with all of the following:
1. In Group B office spaces without furniture systems incorporating wired receptacles, at least
one switched receptacle shall be provided for each 50 square feet.

Measure Information Template Page 52
2013 California Building Energy Efficiency Standards [March 2011]
2. In Group B office spaces with furniture systems incorporating wired receptacles, at least one
switched circuit shall be provided at each electrical outlet used for powering furniture systems.
3. In classrooms in Group B and Group E occupancies, at least four switched receptacles shall
be provided in each classroom.
4. In copy rooms, print shops, and computer labs, not less than one switched receptacle shall be
provided for each data jack.
5. In spaces with an overhead cabinet above a counter or work surface, not less than one
switched receptacle shall be provided for each work surface.
609.6.1 Distribution and marking. Controlled receptacles and electrical outlets shall be
distributed in a reasonably uniform pattern throughout each space. Controlled receptacles shall
be marked to differentiate them from uncontrolled receptacles.
609.6.2 Furniture systems. Furniture systems incorporating wired receptacles shall include at
least two receptacles at each workstation that are connected to a controlled circuit.
609.6.3 Computer office equipment. Computer monitors, plug in space heaters, air purifiers,
radios, computer speakers, coffee makers, fans, and task lights located in spaces with controlled
receptacles shall be plugged into controlled receptacles.
609.6.4 Audio and visual systems. Displays, projectors, and audio amplifiers in Group B and
Group E classrooms, conference and meeting rooms, and multipurpose rooms shall be
controlled by an occupant sensor.
609.6.5 Water dispensers. Water dispensers that utilize energy to cool or heat drinking water
shall be controlled by time switch controls.
609.6.6 Refrigerator and freezer cases. Lighting integral to vending machines and refrigerator
and freezer cases shall be controlled by an occupant sensor or a time switch.”

Measure Information Template Page 53
2013 California Building Energy Efficiency Standards [March 2011]
8. Appendix II: Industry Practice Survey
This section is presenting the online surveys sent to electrical designer, electrical contractor and system
furniture manufacturers.
8.1 CASE Office Task Lighting and Plug Loads, Designer and Contractor survey
8.1.1 Survey Form
The California Investor Owned Utilities (IOUs) are actively supporting the California Energy
Commission (CEC) in developing the state’s building energy efficiency standard (Title 24, Part 6).
Their joint intent is to achieve significant energy savings through the development of reasonable,
responsible, and cost-effective code change proposals for the 2011 code update. Codes and Standards
Enhancement (CASE) Studies are conducted by IOUs to assess technical potential, cost-effectiveness,
and feasibility of proposed regulation improvement.
The Office Tasking Lighting Control CASE study aims to develop requirements of automatic controls
of task lighting and other plug loads. Possible control strategies include central timer controls of task
lighting/plug load circuits or occupancy sensor controls at individual work station/private office.
As part of the CASE study effort, we invite you to fill out this survey to provide necessary information
to guide the code change development. The following questions are related to office space electrical
wiring design practices and challenges associated with plug load controls. Intended audience for this
survey is office building electrical system designers and contractors.
General Information
1. Please select the profile(s) that best describes you:
Designer / Electrical Engineer
Contractor
Other (please specify)
2. How many office electrical wiring design/installation projects have you worked on?
More that 100
50 – 100
10 – 50
Less than 10
3. What geographic areas do you serve (check all areas that apply):
North Coast
Sacramento area
Bay area
Central Valley
Central Coast
Los Angeles area
San Diego area
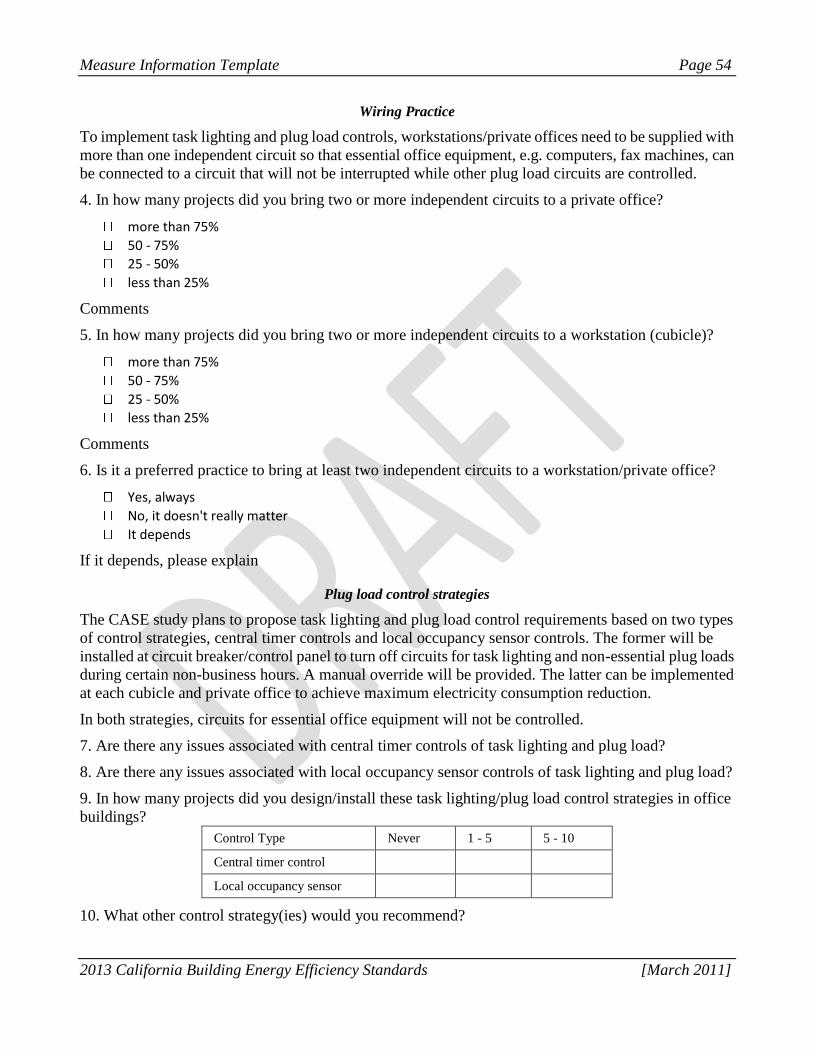
Measure Information Template Page 54
2013 California Building Energy Efficiency Standards [March 2011]
Wiring Practice
To implement task lighting and plug load controls, workstations/private offices need to be supplied with
more than one independent circuit so that essential office equipment, e.g. computers, fax machines, can
be connected to a circuit that will not be interrupted while other plug load circuits are controlled.
4. In how many projects did you bring two or more independent circuits to a private office?
more than 75%
50 - 75%
25 - 50%
less than 25%
Comments
5. In how many projects did you bring two or more independent circuits to a workstation (cubicle)?
more than 75%
50 - 75%
25 - 50%
less than 25%
Comments
6. Is it a preferred practice to bring at least two independent circuits to a workstation/private office?
Yes, always
No, it doesn't really matter
It depends
If it depends, please explain
Plug load control strategies
The CASE study plans to propose task lighting and plug load control requirements based on two types
of control strategies, central timer controls and local occupancy sensor controls. The former will be
installed at circuit breaker/control panel to turn off circuits for task lighting and non-essential plug loads
during certain non-business hours. A manual override will be provided. The latter can be implemented
at each cubicle and private office to achieve maximum electricity consumption reduction.
In both strategies, circuits for essential office equipment will not be controlled.
7. Are there any issues associated with central timer controls of task lighting and plug load?
8. Are there any issues associated with local occupancy sensor controls of task lighting and plug load?
9. In how many projects did you design/install these task lighting/plug load control strategies in office
buildings?
Control Type Never 1 - 5 5 - 10
Central timer control
Local occupancy sensor
10. What other control strategy(ies) would you recommend?

Measure Information Template Page 55
2013 California Building Energy Efficiency Standards [March 2011]
11. Please provide any comment or concern not covered by the previous questions.
12. Providing contact information is always optional. All survey results will always remain anonymous,
but if our CASE authors have follow up questions, they would like to be able to contact you.
Name:
Company:
Email Address:
Phone Number:
8.1.2 Survey Answers
Respondent Profile
The pool of electrical designers and contractors surveyed was diversified. Half of the respondents were
electrical designers, while the other half were electrical contractors, operating in every area of
California. The total number of participants was 12. Half of them have worked on more than 100 office
wiring projects, and 65% have worked on more than 50 office wiring projects. The other respondents
were also experienced in office wiring (they worked on 10 to 50 office wiring projects).
Wiring practice
Bringing two separate circuits to a private office is done in about a quarter of the office projects wired
this way. The main reason for feeding private offices with only one circuit is typically budget
constraint. The general rule for private office wiring is to bring 3 circuits to feed 3 to 4 offices.
Workstations in open spaces are very rarely served by two independent circuits (only 25% of them are).
Most of the respondents agreed that bringing two circuits to a private office or a workstation is a better
practice. They argued that it provides flexibility in terms of which equipment can be used at the
workstation, and that putting computers and printers on a separate circuit is preferable.
Circuit Controls
No major concerns were voiced about implementation of central timer for task light and plug control.
Designers and contractors noted that some circuits would have to remain uncontrolled. Some stressed
that this solution may not be widely adapted for businesses which require flexibility, for instance
businesses not on a 8am-5pm schedule, or when some workstations need to be switched on while others
can be turned off. One respondent was worried about additional cost and complexity while doing
business in California, and would rather see this requirement adopted at the federal level.
Apart from cost concerns, comments on the occupancy sensor control strategy are related to
implementation considerations. Survey respondents stressed the importance of the equipment quality,
in order to detect slight movements and adjust the time delay to avoid disruption. They also suggested
that the receptacles would have to be color-coded, and that clocks and some other equipment would
have to remain uncontrolled.
While there was little resistance to this proposal, these strategies are not commonly put into practice in
the field. Forty two percent (42%) of the respondent replied having experience installing central timer
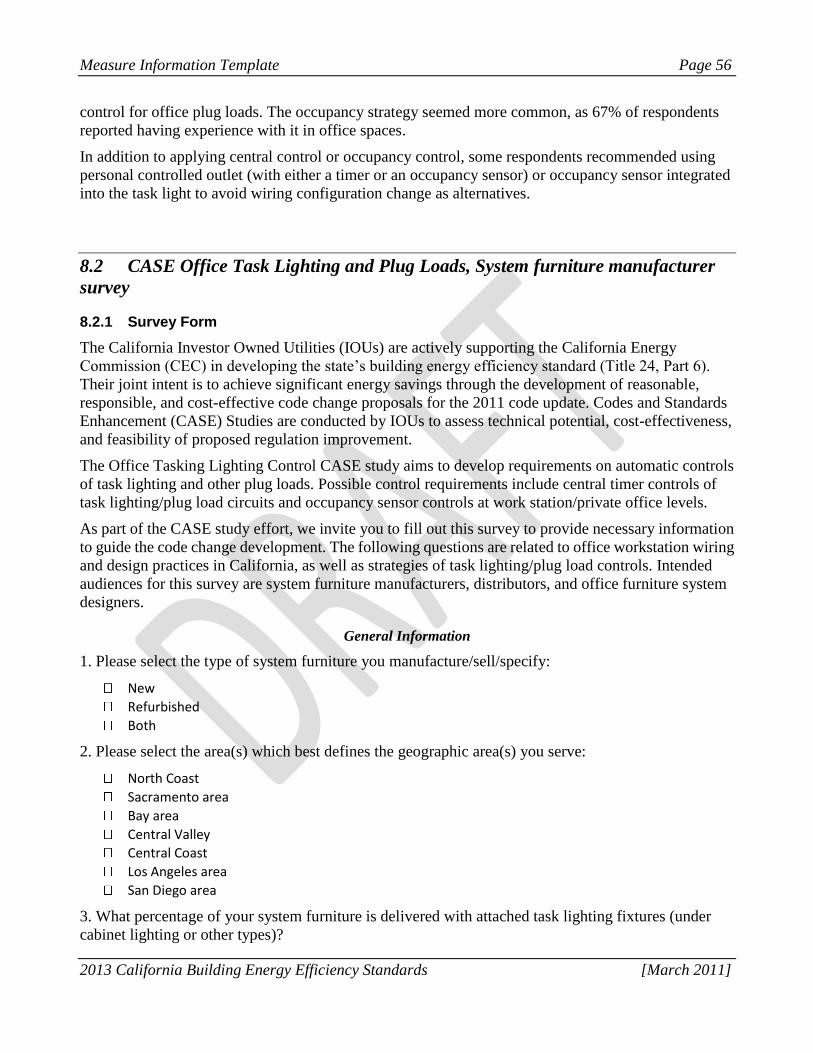
Measure Information Template Page 56
2013 California Building Energy Efficiency Standards [March 2011]
control for office plug loads. The occupancy strategy seemed more common, as 67% of respondents
reported having experience with it in office spaces.
In addition to applying central control or occupancy control, some respondents recommended using
personal controlled outlet (with either a timer or an occupancy sensor) or occupancy sensor integrated
into the task light to avoid wiring configuration change as alternatives.
8.2 CASE Office Task Lighting and Plug Loads, System furniture manufacturer
survey
8.2.1 Survey Form
The California Investor Owned Utilities (IOUs) are actively supporting the California Energy
Commission (CEC) in developing the state’s building energy efficiency standard (Title 24, Part 6).
Their joint intent is to achieve significant energy savings through the development of reasonable,
responsible, and cost-effective code change proposals for the 2011 code update. Codes and Standards
Enhancement (CASE) Studies are conducted by IOUs to assess technical potential, cost-effectiveness,
and feasibility of proposed regulation improvement.
The Office Tasking Lighting Control CASE study aims to develop requirements on automatic controls
of task lighting and other plug loads. Possible control requirements include central timer controls of
task lighting/plug load circuits and occupancy sensor controls at work station/private office levels.
As part of the CASE study effort, we invite you to fill out this survey to provide necessary information
to guide the code change development. The following questions are related to office workstation wiring
and design practices in California, as well as strategies of task lighting/plug load controls. Intended
audiences for this survey are system furniture manufacturers, distributors, and office furniture system
designers.
General Information
1. Please select the type of system furniture you manufacture/sell/specify:
New
Refurbished
Both
2. Please select the area(s) which best defines the geographic area(s) you serve:
North Coast
Sacramento area
Bay area
Central Valley
Central Coast
Los Angeles area
San Diego area
3. What percentage of your system furniture is delivered with attached task lighting fixtures (under
cabinet lighting or other types)?
Measure Information Template Page 57
2013 California Building Energy Efficiency Standards [March 2011]
More than 75%
50% - 75%
25% - 50%
less than 25%
Comments
System Furniture Wiring Practices
To implement task lighting and plug loads controls, workstations need to be supplied with more than
one independent circuit so that essential office equipment, e.g. computers, fax machines, can be
connected to a circuit that will not be interrupted while other plug load circuits are controlled.
4. What percentage of furniture is installed with at least two independent circuits brought to a
workstation?
more than 75% 50% -75% 25% - 50% less than 25%
Cubicles furniture
Private office
furniture
NA (please specify)
5. Do you usually recommend to have more than one circuit connected to a workstation, without
considering task lighting and plug load control?
Yes
No
It depends on application
If depends on application, please specify
6. For the system furniture you are providing, do you label receptacles to differentiate the circuits they
are connected to?
Yes, if multiple circuits are to be connected to the system furniture
Yes, upon customer requests
No
Comments:
Workstation Occupancy Sensor Control
Occupancy sensor control at workstations can help to maximize the reduction of electricity
consumption by task lighting and office plug loads. Operation of essential office equipment will not be
controlled.
7. Do you provide system furniture that is equipped with occupancy sensor control or can be configured
to allow occupancy sensor control?

Measure Information Template Page 58
2013 California Building Energy Efficiency Standards [March 2011]
Yes, we are
providing such
system furniture
Not now, but we plan to
provide such system furniture
in the near future
No, we don't plan to
provide such system
furniture
New system furniture
Refurbished system
Comments
8. What percentage of the system furniture you delivered was working with occupancy sensors?
more than 30% of the delivered system furniture
20 - 30%
10 - 20%
5 - 10%
less than 5%
Comments
9. Are there any issues related to implementing occupancy sensor controls in office system furniture?
10. What other control strategy(ies) would you recommend for office task lighting and plug load
controls in offices?
11. Providing contact information is always optional. All survey results will always remain anonymous,
but if our CASE authors have follow up questions, they would like to be able to contact you. Thank you!
Name:
Company:
Email Address:
Phone Number:
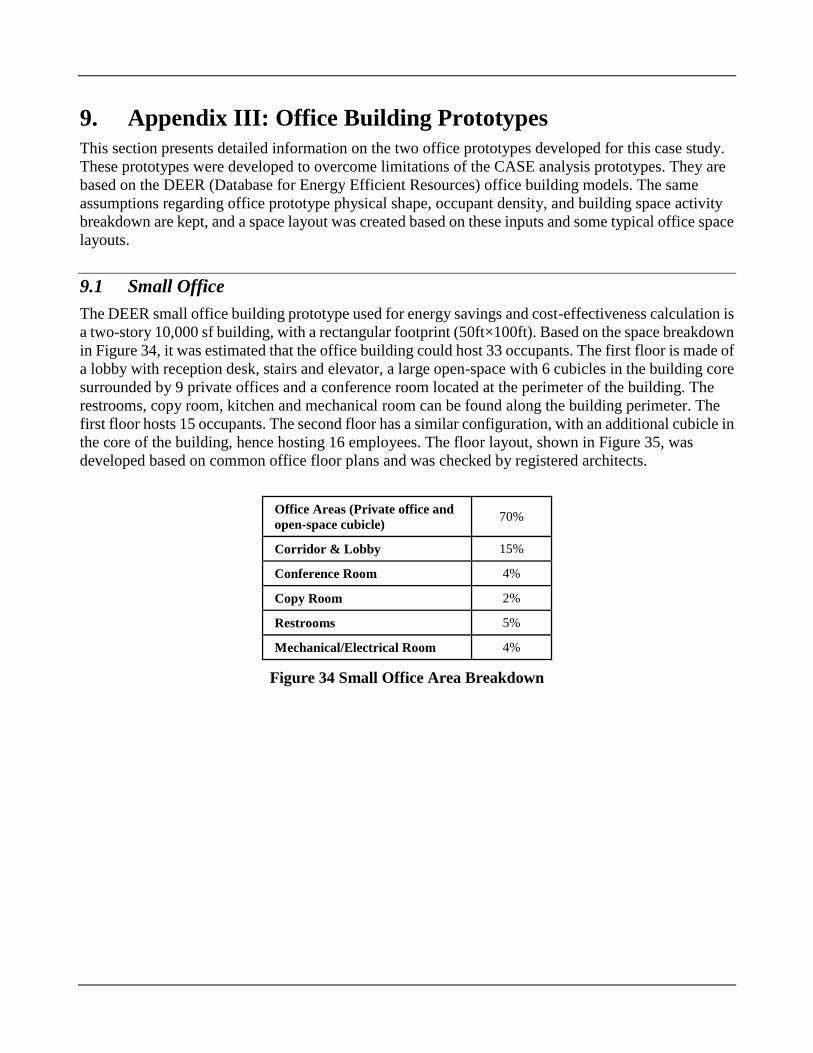
9. Appendix III: Office Building Prototypes
This section presents detailed information on the two office prototypes developed for this case study.
These prototypes were developed to overcome limitations of the CASE analysis prototypes. They are
based on the DEER (Database for Energy Efficient Resources) office building models. The same
assumptions regarding office prototype physical shape, occupant density, and building space activity
breakdown are kept, and a space layout was created based on these inputs and some typical office space
layouts.
9.1 Small Office
The DEER small office building prototype used for energy savings and cost-effectiveness calculation is
a two-story 10,000 sf building, with a rectangular footprint (50ft×100ft). Based on the space breakdown
in Figure 34, it was estimated that the office building could host 33 occupants. The first floor is made of
a lobby with reception desk, stairs and elevator, a large open-space with 6 cubicles in the building core
surrounded by 9 private offices and a conference room located at the perimeter of the building. The
restrooms, copy room, kitchen and mechanical room can be found along the building perimeter. The
first floor hosts 15 occupants. The second floor has a similar configuration, with an additional cubicle in
the core of the building, hence hosting 16 employees. The floor layout, shown in Figure 35, was
developed based on common office floor plans and was checked by registered architects.
Office Areas (Private office and
open-space cubicle) 70%
Corridor & Lobby 15%
Conference Room 4%
Copy Room 2%
Restrooms 5%
Mechanical/Electrical Room 4%
Figure 34 Small Office Area Breakdown

Measure Information Template Page 60
2013 California Building Energy Efficiency Standards [March 2011]
Figure 35 Small Office Floor Plan
9.2 Large Office
The DEER prototype building used for energy savings and cost-effectiveness analysis purpose is a 10
story 175,000 sf building. Its shape is rectangular (175ft×100ft), and all floors have a similar layout.
Based on the space breakdown in Figure 36 and floor plan in Figure 37, it was assumed that the building
would host seven hundred and thirty (730) people. Each floor hosts seventy-three (73) employees. A
typical floor is made of 19 private offices, 54 cubicles, 2 conference rooms, 2 copy rooms, kitchen and
restrooms. Each East and West perimeters host 10 private offices and a large conference room while the
North and South perimeter spaces are open offices with 27 cubicles in stack of 6 or 3 at each orientation.
A lobby with elevators and stairs is located in the building core, with kitchen, mechanical room and
restroom on both sides. Another 9 private offices can be found in the building core. The office layout
was developed based on the office buildings floor plan provided in the WattStopper “Lighting control
best practice guide: Office Buildings” and were checked by a registered architect.

Measure Information Template Page 61
2013 California Building Energy Efficiency Standards [March 2011]
Office Areas (Private office and
open-space cubicle) 70%
Corridor & Lobby 15%
Conference Room 4%
Copy Room 2%
Restrooms 5%
Mechanical/Electrical Room 4%
Figure 36 Large Office Area Breakdown
Figure 37 Large Office Floor Plan
Recommended