R E S EARCH ART I C L E
GEOPHYS I CS
GNS Science, 1 Fairway Drive, Avalon, Lower Hutt 5010, New Zealand.*Corresponding author. Email: [email protected]
Hamling et al. Sci. Adv. 2016; 2 : e1600288 3 June 2016
2016 © The Authors, some rights reserved;
exclusive licensee American Association for
the Advancement of Science. Distributed
under a Creative Commons Attribution
NonCommercial License 4.0 (CC BY-NC).
10.1126/sciadv.1600288
Off-axis magmatism along a subaerial back-arcrift: Observations from the Taupo Volcanic Zone,New Zealand
Ian J. Hamling,* Sigrun Hreinsdóttir, Stephen Bannister, Neville PalmerDo
Continental rifting and seafloor spreading play a fundamental role in the generation of new crust. However, thedistribution of magma and its relationship with tectonics and volcanism remain poorly understood, particularly inback-arc settings. We show evidence for a large, long-lived, off-axis magmatic intrusion located on the margin ofthe Taupo Volcanic Zone, New Zealand. Geodetic data acquired since the 1950s show evidence for uplift outside ofthe region of active extension, consistent with the inflation of amagmatic body at a depth of ~9.5 km. Satellite radarinterferometry and Global Positioning System data suggest that there was an increase in the inflation rate from 2003to 2011,which correlateswith intense earthquake activity in the region. Our results suggest that the continuedgrowthof a largemagmatic bodymay represent the birth of a newmagma chamber on themargins of a back-arc rift system.
wn
on February 8, 2018
http://advances.sciencemag.org/
loaded from
INTRODUCTION
Our understanding of rifting episodes and emplacement of magma be-neath oceanic spreading centers is constrained by a few, albeit well-documented, events (1, 2). Observations of subaerial rifting episodes inAfar (3, 4) and Iceland (3, 5, 6) have begun to shed light on the complexinteractions between volcanism, tectonics, and magmatism in regionsof incipient seafloor spreading. However, in arc and back-arc settings,there are very few candidate rift zones that produce significant volumesof magma and are observable above sea level. The subaerial TaupoVolcanic Zone (TVZ), New Zealand, is the most productive area of silicicvolcanism on Earth (7) and offers a unique opportunity to investigatethe role of magma in the development of complex back-arc rift.
The TVZ is located in the central North Island of New Zealandand formed as the result of continued subduction of the Pacific platebeneath the Australian plate at rates of 38 to 49 mm/year (Fig. 1) (8, 9).Extension across the TVZ over the last 1.6 million years (My) is expressedat the surface by extensive northeast-southwest–trending fault beltsalong a narrow ∼30-km-wide zone (10) with active volcanism duringthe last 300 thousand years (11). Previous studies have split the TVZ intothree distinct segments (southern, central, and northern TVZ) on thebasis of variations in volcanism along the rift (11, 12). In the centralTVZ, volcanism over the last ∼2 My has led to the eruption of morethan 10,000 km3 of predominately rhyolitic magma and resulted inthe formation of eight calderas (11). Conductive bodies at depths of 6to 10 km are thought to be zones of interconnected melt (13), consistentwith seismic velocity models, which suggest a heavily intruded shallowcrust beneath the central TVZ at depth (14). Large-scale subsidencealong the length of the central TVZ, observed by interferometric syn-thetic aperture radar (InSAR) and Global Positioning System (GPS)data, has been interpreted predominantly as the cooling and contractionof magma at a depth of∼6 km (15). There has been no volcanic activityin the central and onshore northern TVZ since the 1886 Taraweraeruption when a ∼17-km-long basaltic fissure eruption occurred alongthe southern margin of the Okataina Caldera (Fig. 1) (16). At the Northof the Okataina Caldera (Fig. 1), rifting is considered to be amagmatic
1 of
with extension being accommodated by normal faulting (12). Acrossthe northern TVZ, swarms of earthquakes have been detected since thedevelopment of the seismic network in the late 1970s. However, thenature of the swarms, whether tectonic or magmatic in origin, has re-mained largely unresolved (17, 18).
DATA ANALYSIS AND MODELING
Using synthetic aperture radar (SAR) images acquired by the EuropeanSpace Agency (ESA) Envisat satellite between 2004 and 2011, we gen-erate an InSAR time series covering the northern TVZ (Figs. 1 and 2,fig. S1, and Methods). Line of sight (LOS) increases of up to 12 mm/yearare observed at the south of Rotorua within the central TVZ (Fig. 2 andfig. S2), consistent with previous observations of subsidence explainedby the cooling magma at depth (15). We also identify LOS increases of∼15 mm/year centered over the Kawerau geothermal field within theRangitaiki Plains (Fig. 2 and fig. S2). To the west of the currently activerift, adjacent to the Bay of Plenty coast, we observe up to 10 mm/year ofLOS decrease over a ∼300-km2 area (Fig. 2). Two continuous GPS(CGPS) sites (Fig. 2 and fig. S3), operating since around 2007 (operatedas campaign sites in 2005 and 2007), and one campaign site with obser-vations since 2007 indicate uplift and up to 10 mm/year of southwardmotion, consistent with the InSAR observations. InSAR and GPS timeseries show that the deformation has been ongoing since at least 2004,but in late 2010, after the final InSAR acquisition, both of the GPSsites show a decrease in the uplift rate (Fig. 2 and fig. S3).
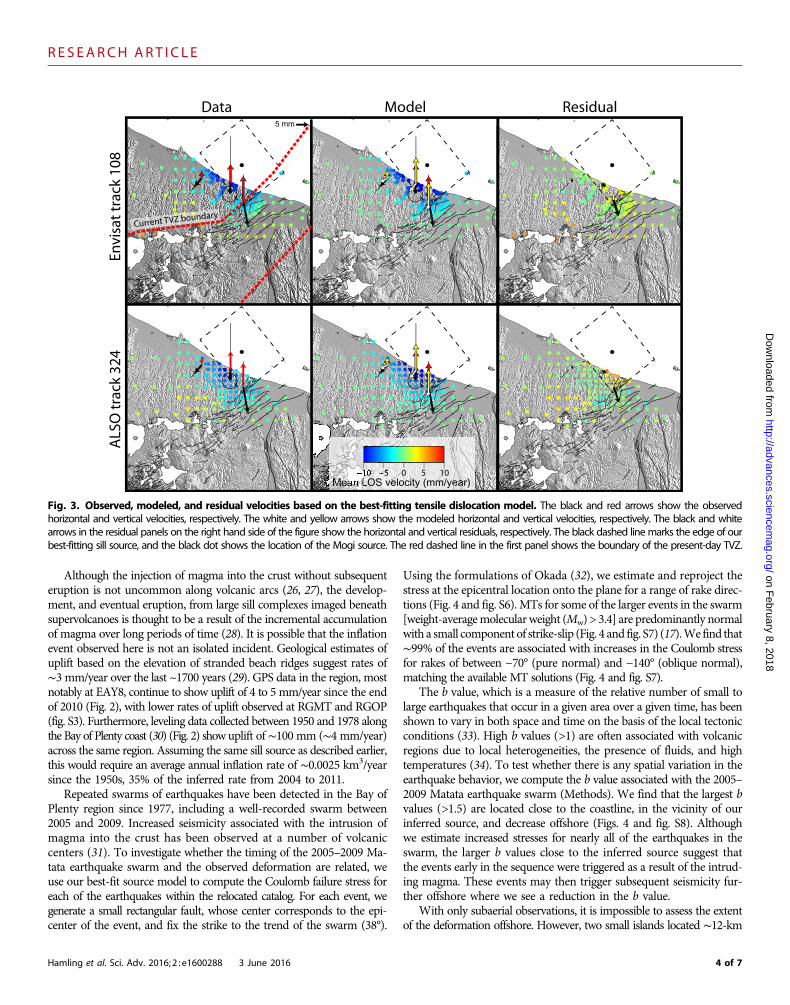
The magnitude and spatial pattern of deformation along the Bay ofPlenty coast are not consistent with a tectonic origin, and given theproximity to the active TVZ, we assume that the observed uplift is aresult of the accumulation of magma at depth. Despite the apparentvolcanic origin of the deformation, the broad pattern of uplift cannotbe explained by the intrusion of a dyke. We therefore model the infla-tion as a point source (19) embedded in an elastic half-space to repre-sent the accumulation of magma at depth. In addition to the Envisattrack and GPS velocities, we use the data from the Advanced Land Ob-serving Satellite (ALOS) track 324 presented by Hamling et al. (15) (Fig. 3
7
R E S EARCH ART I C L E
on February 8, 2018
http://advances.sciencemag.org/
Dow
nloaded from
and fig. S4). We solve for the position, depth, and volume change of thesource by performing a hybrid Monte-Carlo downhill simplex inver-sion, which minimizes the square misfit between the observed andcalculated displacements at each observation point (20). To assess thedistribution of model parameters, we perform a bootstrap resamplingprocedure to generate 1000 new data sets and reinvert each new dataset (fig. S4). The best-fitting model indicates a source located just offshoreat a depth of ∼12.9 ± 2.1 km inflating by ∼0.01 ± 0.006 km3/year.Although the point source approximation provides a good fit to thedata, we also model the deformation, assuming a more realistic sheet-like source (sill) (21), which would require a much lower overpressure toinflate (22). For example, inflating a preexisting magma chamber with aradius of 2 km by 0.01 km3 would require a pressure increase of ~12MPa.For an equivalent sill (10 × 10 km with 10 cm of opening), the requiredpressure would be ~0.4 MPa. We assume that the sill is horizontal andsolve for the body’s position, depth, strike, length, width, and amount ofinflation. As with the Mogi source, the distribution of model parametersis determined by the inversion of 1000 bootstrapped data sets (fig. S5).The best-fitting model (Fig. 3 and fig. S5) suggests a 19.1 ± 3.0 × 24.2 ±3.9–km source, inflating by ∼20 ± 13 mm/year at a depth of 9.5 ± 2.1km, producing an annual volume increase of ∼0.009 km3, comparableto the Mogi source. Trade-offs between different model parameters andlarge uncertainties in the position and size of the body are a function ofthe data distribution (fig. S5). With most of the observations limited to
Hamling et al. Sci. Adv. 2016; 2 : e1600288 3 June 2016
the Bay of Plenty coast, the offshore position and the extent of the mag-ma body are difficult to assess.
DISCUSSION AND CONCLUSIONS
The location of the observed uplift lies outside of the present-dayboundary of the active TVZ (Fig. 1) (11). Although the region fallswithin the limits of the older TVZ, evidence for an off-axis source issurprising, considering that the last known volcanism in the area oc-curred some 425 ka (23). The northern region of the TVZ is thoughtto be largely amagmatic with the accommodation of long-term ex-tension through normal faulting (12). Numerical simulations of dykeintrusions show that rift topography is an important factor in the transferof magma from depth (24). For nonvolcanic and wide rifts, models suggestthe formation of stacked sills in the lower crust and, in some cases, off-axisvolcanism if intrusions continue to propagate to the surface. Other modelssuggest that off-axis volcanism develops due to the interaction of boundaryfaults and magma at depth (25). Small displacements along the boundingnormal faults cause dilatational stresses to build at the base of the fault,promoting the intrusion of magma. Although there has been no recentvolcanism in the area, the location and depth of our best-fit source (Fig. 4and fig. S6), located on the footwall side of the inferred bounding faults,fit with these models for the formation of an off-axis magma body.
−38˚
2005 2006 2007 2008 20090
500
1000
1500
2000
2500
Time in years
Cu
mu
lati
ve n
um
ber
of e
ven
ts
Mw 4.7 29 September 2007
2005
2006
2007
2008
2009
Mw 4.729 September 2007
172˚ 174˚ 176˚ 178˚
−42˚
−40˚
−38˚
−36˚
−34˚
Modern TVZM
oder
n TV
ZO
ld T
VZH
ikur
angi
Tren
ch
Harve
Trou
gh
176˚ 177˚
Rotorua
1886 Tarawera eruption
Okataina
25 km
Fig 4
Auckland
Tauranga
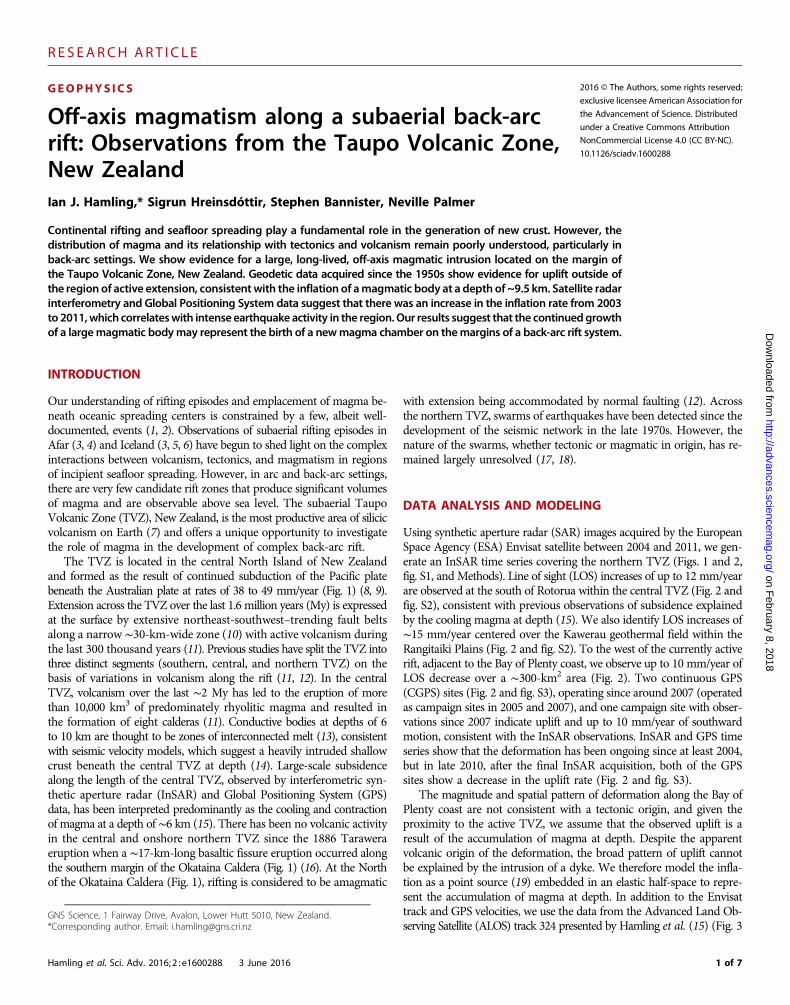
Fig. 1. Location maps showing the North Island of New Zealand and the study area at the northern end of the Taupo Volcanic Zone. (Left)Color-shaded relief map of the North Island of New Zealand indicating the study area (black box) and boundaries of the currently active TVZ [<300 thousandyears ago (ka); solid blue line] and old TVZ [>300 ka; dashed blue line). (Right) Color-shaded relief of the study area highlighting the location of the modernTVZ (gray transparency), Okataina and Rotorua Caldera boundaries (blue dashed lines), and the relocated 2005–2009 Matata earthquake swarm, which arecolor-coded by year. The dashed box indicates the region shown in Fig. 4. Themoment tensor (MT) solution for the largest event is shown by the beach ball.The inset in the top left shows the cumulative number of earthquakes during the sequence.
2 of 7
R E S EARCH ART I C L E
on February 8, 2018
http://advances.sciencemag.org/
Dow
nloaded from
Mea
n LO
S v
eloc
ity (
mm
/yea
r)
–10
0
10
0
1
3
LO
S e
rror
(m
m/y
ear)
RGOP
RGMT
EAY8
Kawerau
Rotorua
2004 2006 2008 2010 2012 2014 2016
−40
−20
0
20RGMTRGOP
LOS
dis
pla
cem
ent
(mm
)
InSAR
GPS
−60
−802000 2002 2004 2006 2008 2010 2012 2014 2016
A B
LOS error
5 m
m/y
ear
Before December 2010
After December 2010
Before December 2010
After December 2010
1950−1978 leveling
5 m
m/y
ear
Horizontal VerticalKey
20 km
C 176˚30
−38˚
177˚′
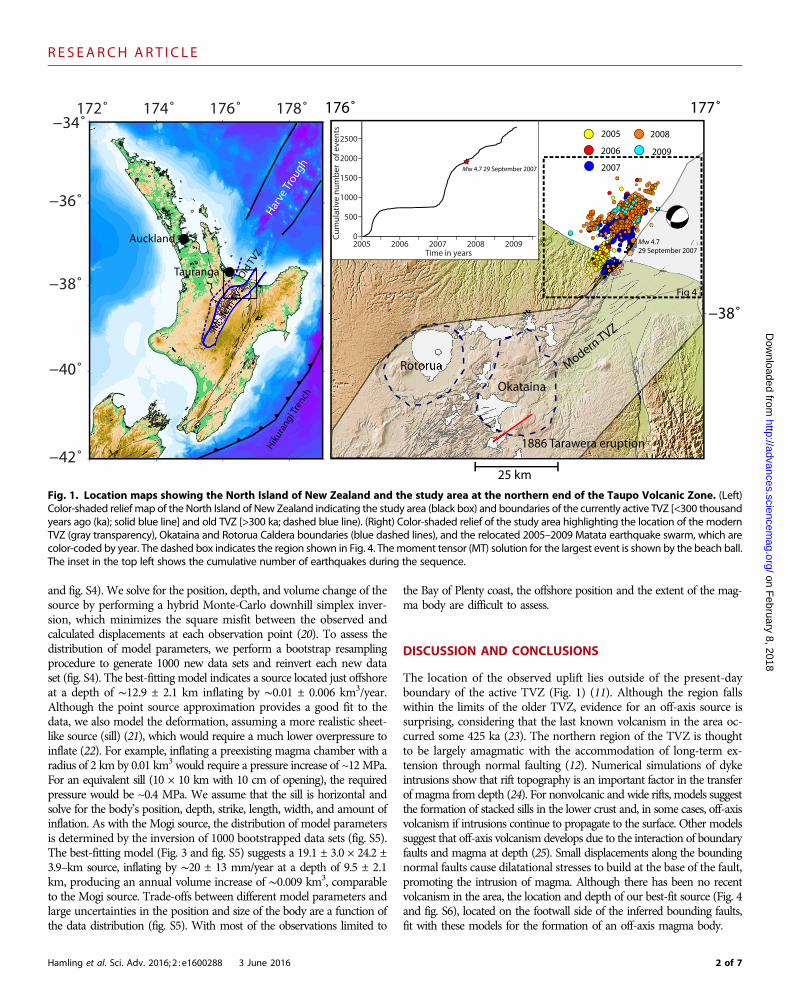
Fig. 2. Surface velocities derived from InSAR, leveling, and GPS data over the Bay of Plenty coast. (A and B) InSAR time series for scatterers (redcircles) colocated with the two CGPS sites (RGOP and RGMT) along with the GPS velocities converted into the satellites LOS. (C) Mean LOS velocities derivedusing 32 Envisat SAR images as described in themain text. Theblack lines indicatemapped active faults. Theblack dashed circle shows subsidence associatedwith the Kawerau geothermal power plant. The black, white, yellow, and red arrows show the velocities for the two continuous (RGOP and RGMT) andcampaign (EAY8) GPS sites (circles and lines show the 95 and 68% confidence levels for horizontal and vertical velocities, respectively) for the two periodsdescribed in the main text. The colored triangles show the GPS displacements (15) at campaign and continuous sites converted into the satellite’s LOS. Theblue arrows show the velocities derived from levelingdata collected in 1950and1978. The image shown in theblack box shows the errors associatedwith theLOS displacements shown in the main figure.
Hamling et al. Sci. Adv. 2016; 2 : e1600288 3 June 2016 3 of 7
R E S EARCH ART I C L E
on February 8, 2018
http://advances.sciencemag.org/
Dow
nloaded from
Although the injection of magma into the crust without subsequenteruption is not uncommon along volcanic arcs (26, 27), the develop-ment, and eventual eruption, from large sill complexes imaged beneathsupervolcanoes is thought to be a result of the incremental accumulationof magma over long periods of time (28). It is possible that the inflationevent observed here is not an isolated incident. Geological estimates ofuplift based on the elevation of stranded beach ridges suggest rates of∼3 mm/year over the last ~1700 years (29). GPS data in the region, mostnotably at EAY8, continue to show uplift of 4 to 5 mm/year since the endof 2010 (Fig. 2), with lower rates of uplift observed at RGMT and RGOP(fig. S3). Furthermore, leveling data collected between 1950 and 1978 alongthe Bay of Plenty coast (30) (Fig. 2) show uplift of∼100 mm (∼4 mm/year)across the same region. Assuming the same sill source as described earlier,this would require an average annual inflation rate of ∼0.0025 km3/yearsince the 1950s, 35% of the inferred rate from 2004 to 2011.
Repeated swarms of earthquakes have been detected in the Bay ofPlenty region since 1977, including a well-recorded swarm between2005 and 2009. Increased seismicity associated with the intrusion ofmagma into the crust has been observed at a number of volcaniccenters (31). To investigate whether the timing of the 2005–2009 Ma-tata earthquake swarm and the observed deformation are related, weuse our best-fit source model to compute the Coulomb failure stress foreach of the earthquakes within the relocated catalog. For each event, wegenerate a small rectangular fault, whose center corresponds to the epi-center of the event, and fix the strike to the trend of the swarm (38°).
Hamling et al. Sci. Adv. 2016; 2 : e1600288 3 June 2016
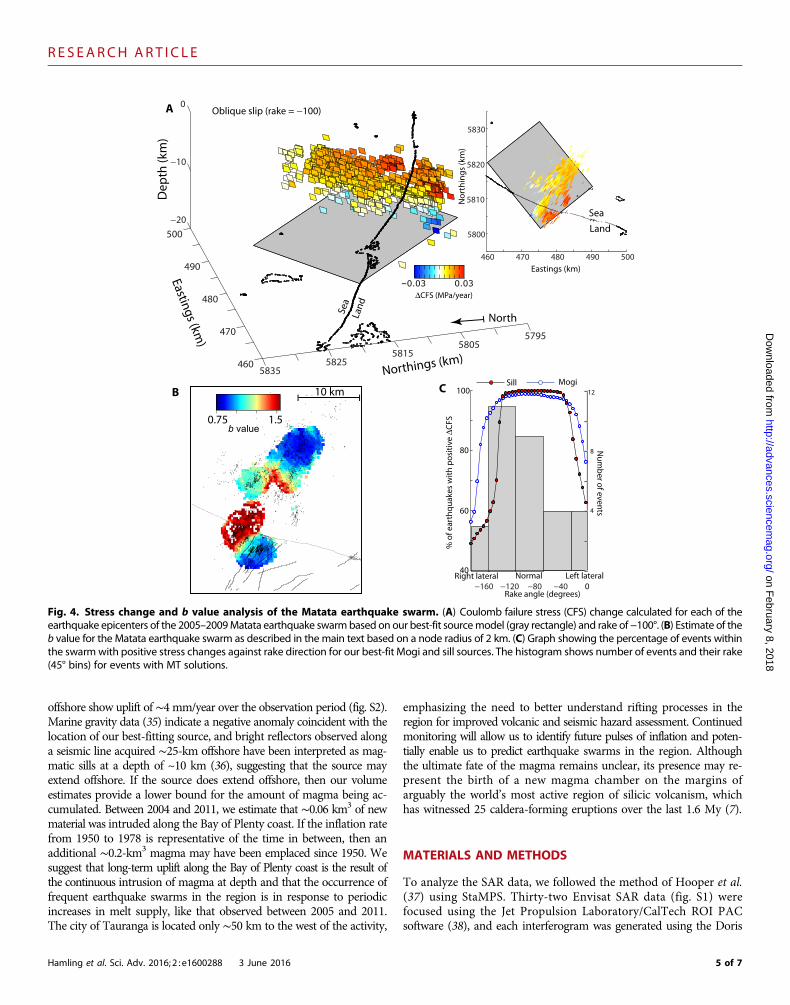
Using the formulations of Okada (32), we estimate and reproject thestress at the epicentral location onto the plane for a range of rake direc-tions (Fig. 4 and fig. S6). MTs for some of the larger events in the swarm[weight-averagemolecular weight (Mw) > 3.4] are predominantly normalwith a small component of strike-slip (Fig. 4 and fig. S7) (17).We find that∼99% of the events are associated with increases in the Coulomb stressfor rakes of between −70° (pure normal) and −140° (oblique normal),matching the available MT solutions (Fig. 4 and fig. S7).
The b value, which is a measure of the relative number of small tolarge earthquakes that occur in a given area over a given time, has beenshown to vary in both space and time on the basis of the local tectonicconditions (33). High b values (>1) are often associated with volcanicregions due to local heterogeneities, the presence of fluids, and hightemperatures (34). To test whether there is any spatial variation in theearthquake behavior, we compute the b value associated with the 2005–2009 Matata earthquake swarm (Methods). We find that the largest bvalues (>1.5) are located close to the coastline, in the vicinity of ourinferred source, and decrease offshore (Figs. 4 and fig. S8). Althoughwe estimate increased stresses for nearly all of the earthquakes in theswarm, the larger b values close to the inferred source suggest thatthe events early in the sequence were triggered as a result of the intrud-ing magma. These events may then trigger subsequent seismicity fur-ther offshore where we see a reduction in the b value.
With only subaerial observations, it is impossible to assess the extentof the deformation offshore. However, two small islands located ∼12-km
5 mm
Data Model ResidualEn
visa
t tr
ack
108
ALS
O t
rack
324
Mean LOS velocity (mm/year)−10 −5 0 5 10
Current TVZ boundary
Fig. 3. Observed, modeled, and residual velocities based on the best-fitting tensile dislocation model. The black and red arrows show the observedhorizontal and vertical velocities, respectively. The white and yellow arrows show the modeled horizontal and vertical velocities, respectively. The black and whitearrows in the residual panels on the right hand side of the figure show the horizontal and vertical residuals, respectively. The black dashed linemarks the edge of ourbest-fitting sill source, and the black dot shows the location of the Mogi source. The red dashed line in the first panel shows the boundary of the present-day TVZ.
4 of 7
R E S EARCH ART I C L E
on February 8, 2018
http://advances.sciencemag.org/
Dow
nloaded from
offshore show uplift of ∼4 mm/year over the observation period (fig. S2).Marine gravity data (35) indicate a negative anomaly coincident with thelocation of our best-fitting source, and bright reflectors observed alonga seismic line acquired ∼25-km offshore have been interpreted as mag-matic sills at a depth of ~10 km (36), suggesting that the source mayextend offshore. If the source does extend offshore, then our volumeestimates provide a lower bound for the amount of magma being ac-cumulated. Between 2004 and 2011, we estimate that ∼0.06 km3 of newmaterial was intruded along the Bay of Plenty coast. If the inflation ratefrom 1950 to 1978 is representative of the time in between, then anadditional ∼0.2-km3 magma may have been emplaced since 1950. Wesuggest that long-term uplift along the Bay of Plenty coast is the result ofthe continuous intrusion of magma at depth and that the occurrence offrequent earthquake swarms in the region is in response to periodicincreases in melt supply, like that observed between 2005 and 2011.The city of Tauranga is located only ∼50 km to the west of the activity,
Hamling et al. Sci. Adv. 2016; 2 : e1600288 3 June 2016
emphasizing the need to better understand rifting processes in theregion for improved volcanic and seismic hazard assessment. Continuedmonitoring will allow us to identify future pulses of inflation and poten-tially enable us to predict earthquake swarms in the region. Althoughthe ultimate fate of the magma remains unclear, its presence may re-present the birth of a new magma chamber on the margins ofarguably the world’s most active region of silicic volcanism, whichhas witnessed 25 caldera-forming eruptions over the last 1.6 My (7).
MATERIALS AND METHODS
To analyze the SAR data, we followed the method of Hooper et al.(37) using StaMPS. Thirty-two Envisat SAR data (fig. S1) werefocused using the Jet Propulsion Laboratory/CalTech ROI PACsoftware (38), and each interferogram was generated using the Doris
∆CFS (MPa/year)
Dep
th (k
m)
Northings (km)
Eastings (km)
Oblique slip (rake = −100)
−20
−10
0
40
60
80
100
Rake angle (degrees)
Right lateral Left lateralNormal
% o
f ear
thq
uak
es w
ith
po
siti
ve ∆
CFS
0
4
8
12
Nu
mb
er of even
ts
MogiSill
b value0.75 1.5
−160 −120 −80 −40
A
B C10 km
North
460
470
480
490
500
57955805
58155825
5835
460 470 480 490 500
5800
5810
5820
5830
Eastings (km)
No
rth
ing
s (k
m)
LandSe
a
Sea
Land
Fig. 4. Stress change and b value analysis of the Matata earthquake swarm. (A) Coulomb failure stress (CFS) change calculated for each of theearthquake epicenters of the 2005–2009Matata earthquake swarmbased on our best-fit sourcemodel (gray rectangle) and rake of−100°. (B) Estimate of theb value for the Matata earthquake swarm as described in the main text based on a node radius of 2 km. (C) Graph showing the percentage of events withinthe swarmwith positive stress changes against rake direction for our best-fit Mogi and sill sources. The histogram shows number of events and their rake(45° bins) for events with MT solutions.
5 of 7
R E S EARCH ART I C L E
on February 8, 2018
http://advances.sciencemag.org/
Dow
nloaded from
software (39). Topographic corrections were made using a 3–arc sec(90 min) digital elevation model generated by the NASA Shuttle RadarTopography Mission (40). To reduce the number of noisy points se-lected, points with SDs of more than 1 radian were removed. Residualorbital errors were estimated and removed by fitting a quadratic planefrom each interferogram in the time series. To account for variations inthe stratified water vapor content, we estimated and removed the best-fitting stratified delay, assuming a linear function with height. Usingthe corrected displacement time series, we solved for the best-fittingdisplacement rate x such that
AT∑�1Ax ¼ AT∑�1b
where the design matrix A contains the time interval of each epochrelative to the master epoch (6 December 2005), b is a matrix con-taining the displacements at each scatterer for each epoch, and S isthe variance-covariance matrix. In total, we identified ∼53,000 individualscatterers across the region (Figs. 2 and fig. S2). The GPS data wereanalyzed using the GAMIT/GLOBK software version 10.6 using over100 CGPS stations in the analysis to evaluate site positions in the ITRF08fixed Australian reference frame. In the analysis, we solved for stationcoordinates, satellite orbit, and Earth rotation parameters, estimatingatmospheric zenith delays every 2 hours and using three atmosphericgradients per day. We used the IGS08 azimuth and an elevation-dependent absolute phase center model with an elevation cutoff angleof 10° for the ground-based antennas and applied the FES2004 oceanloading model. Before becoming continuous sites in 2007, RGOP andRGMT operated as campaign sites with measurements in 2005 and2007, which were used in estimating the velocity for the same observa-tion period as the InSAR data. RGOP was also measured in 2001, butthis was not used for estimating the velocity because it was measuredbefore the first acquisition of the InSAR data. Velocities for site EAY8were estimated from measurements in 2007, 2009, 2011, and 2015.Before modeling, we reduced the number of InSAR data points by sub-sampling the two data sets on the basis of the distance from the ob-served uplift. For the ALOS data, points located within ∼10 km of thepeak uplift were resampled onto a regular 1 × 1–km grid. Similarly, forthe Envisat data, we used all scatterers located within ∼10 km of thepeak uplift (Fig. 3). We solved for the position, depth, and volumechange of the source by performing a hybrid Monte-Carlo downhillsimplex inversion, which minimizes the square misfit between the ob-served and calculated displacements at each scatterer (20). We assumeda Poisson’s ratio of 0.25 and a shear modulus of 30 GPa. Because ofthe larger number of InSAR observation points, we down-weighed theInSAR observations by a factor of 10 compared to the GPS. We foundthat additional down-weighing of the InSAR relative (factors of 100and 1000) to the GPS had little effect on the misfit to the GPS. Forthe sill, we solved for additional parameters including the position,strike, depth, length, width, and volume change. Given the distributionof data, the extent of the body offshore was difficult to assess. To pre-vent the model from having unreasonable dimensions, we applied ad-ditional penalties if the area of the sill became larger than 500 km2 orhad an aspect ratio of more than 3.
Earthquakes in the Matata swarm were relocated using the double-difference hypoDD method of Waldhauser and Ellsworth (41). Thisapproach minimizes the residuals between observed and calculatedarrival time differences for pairs of closely spaced earthquakes, using
Hamling et al. Sci. Adv. 2016; 2 : e1600288 3 June 2016
the differential times of catalog P- and S-phase times, as well as dif-ferential times derived from waveform cross-correlation of P and Swave-forms. We calculated the catalog-based differential times for all eventpairs initially separated by less than 8 km and for all seismometers lessthan 150 km from the cluster centroid using the manually picked P-and S- phase times. Cross-correlation and bispectrum methods werethen used to calculate the waveform-based differential times for allevent-station pairs after prefiltering, following the technique of Duet al. (42). These derived differential times were weighed on the basisof the quality of the arrival time measurements.
We estimated the spatially varying b value on a ∼250-m grid coveringthe earthquake swarm to have a magnitude of completeness ofMw = 2.3(fig. S5) using ZMap (43). For each node, a minimum of 50 eventsabove the magnitude of completeness was required to compute a value.We varied the size of the radii around each node but found that for allcases, the largest b values (>1.5) were found closer to the coastline, nearour inferred source, and decreased offshore (Fig. 4 and fig. S5).
SUPPLEMENTARY MATERIALSSupplementary material for this article is available at http://advances.sciencemag.org/cgi/content/full/2/6/e1600288/DC1fig. S1. Baseline time plot showing the distribution of ALOS and Envisat SAR images (red circlescircles) and interferograms (black lines) used in the analysis.fig. S2. Mean LOS velocities derived using 32 Envisat SAR images of the study region and twooffshore islands.fig. S3. East, north, and vertical displacements recorded at RGMT and RGOP.fig. S4. Mean LOS velocity derived from ALOS SAR data.fig. S5. Distribution of model parameters for the Mogi and sill sources.fig. S6. Cross section through the Matata earthquake swarm along the line A-A′ indicated inthe panel on the right of the figure.fig. S7. Relocated earthquakes from the 2005–2009 Matata earthquake swarm, which are color-coded by year, and available MT solutions for the larger events.fig. S8. Cumulative number of earthquakes and b value estimates for the Matata earthquake swarm.
REFERENCES AND NOTES1. J. R. Delaney, D. S. Kelley, M. D. Lilley, D. A. Butterfield, J. A. Baross, W. S. D. Wilcock,
R. W. Embley, M. Summit, The quantum event of oceanic crustal accretion: Impacts ofdiking at mid-ocean ridges. Science 281, 222–230 (1998).
2. M. Tolstoy, J. P. Cowen, E. T. Baker, D. J. Fornari, K. H. Rubin, T. M. Shank, F. Waldhauser,D. R. Bohnenstiehl, D. W. Forsyth, R. C. Holmes, B. Love, M. R. Perfit, R. T. Weekly, S. A. Soule,B. Glazer, A sea-floor spreading event captured by seismometers. Science 314, 1920–1922(2006).
3. T. J. Wright, F. Sigmundsson, C. Pagli, M. Belachew, I. J. Hamling, B. Brandsdóttir, D. Keir,R. Pedersen, A. Ayele, C. Ebinger, P. Einarsson, E. Lewi, E. Calais, Geophysical constraints onthe dynamics of spreading centres from rifting episodes on land. Nat. Geosci. 5, 242–250 (2012).
4. I. J. Hamling, T. J. Wright, E. Calais, L. Bennati, E. Lewi, Stress transfer between thirteensuccessive dyke intrusions in Ethiopia. Nat. Geosci. 3, 713–717 (2010).
5. F. Sigmundsson, A. Hooper, S. Hreinsdóttir, K. S. Vogfjörd, B. G. Ófeigsson,E. Rafn Heimisson, S. Dumont, M. Parks, K. Spaans, G. B. Gudmundsson, V. Drouin,T. Árnadóttir, K. Jónsdóttir, M. T. Gudmundsson, T. Högnadóttir, H. María Fridriksdóttir,M. Hensch, P. Einarsson, E. Magnússon, S. Samsonov, B. Brandsdóttir, R. S. White,T. Ágústsdóttir, T. Greenfield, R. G. Green, Á. Rut Hjartardóttir, R. Pedersen, R. A. Bennett,H. Geirsson, P. C. La Femina, H. Björnsson, F. Pálsson, E. Sturkell, C. J. Bean, M. Möllhoff,A. K. Braiden, E. P. S. Eibl, Segmented lateral dyke growth in a rifting event at Bárðarbungavolcanic system, Iceland. Nature 517, 191–195 (2015).
6. A. Björnsson, K. Saemundsson, P. Einarsson, E. Tryggvason, K. Grönvald, Current riftingepisode in North Iceland. Nature 266, 318–323 (1977).
7. C. J. N. Wilson, D. M. Gravley, G. S. Leonard, J. V. Rowland, Volcanism in the central TaupoVolcanic Zone, New Zealand: Tempo, styles and controls. Studies in Volcanology: The Legacy ofGeorge Walker (The Geological Society, London, ed. 2, 2009) pp. 225–247.
8. J. Cole, Structural control and origin of volcanism in the Taupo volcanic zone, New Zealand.Bull. Volcanol. 52, 445–459 (1990).
6 of 7
R E S EARCH ART I C L E
on February 8, 2018
http://advances.sciencemag.org/
Dow
nloaded from
9. C. DeMets, R. G. Gordon, D. F. Argus, Geologically current plate motions. Geophys. J. Int.181, 1–80 (2010).
10. P. Villamor, K. Berryman, A late Quaternary extension rate in the Taupo Volcanic Zone,New Zealand, derived from fault slip data. N. Z. J. Geol. Geophys. 44, 243–269 (2001).
11. C. J. N. Wilson, B. F. Houghton, M. O. McWilliams, M. A. Lanphere, S. D. Weaver, R. M. Briggs,Volcanic and structural evolution of Taupo Volcanic Zone, New Zealand: A review. J. Volcanol.Geotherm. Res. 68, 1–28 (1995).
12. J. V. Rowland, C. J. N. Wilson, D. M. Gravley, Spatial and temporal variations in magma assistedrifting, Taupo Volcanic Zone, New Zealand. J. Volcanol. Geotherm. Res. 190, 89–108 (2010).
13. W. Heise, H. M. Bibby, T. Grant Caldwell, S. C. Bannister, Y. Ogawa, S. Takakura, T. Uchida,Melt distribution beneath a young continental rift: The Taupo Volcanic Zone, New Zealand.Geophys. Res. Lett. 34, (2007).
14. W. R. Stratford, T. A. Stern, Strong seismic reflections and melts in the mantle of acontinental back-arc basin. Geophys. Res. Lett. 31, (2004).
15. I. Hamling, S. Hreinsdottir, N. Fournier, The ups and downs of the TVZ: Geodetic observa-tions of deformation around the Taupo Volcanic Zone, New Zealand. J. Geophys. Res. SolidEarth 120, 4667–4679 (2015).
16. G. P. L. Walker, S. Self, L. Wilson, Tarawera 1886, New Zealand—A basaltic plinian fissureeruption. J. Volcanol. Geotherm. Res. 21, 61–78 (1984).
17. T. Hurst, S. Bannister, R. Robinson, B. Scott, Characteristics of three recent earthquake sequencesin the Taupo Volcanic Zone, New Zealand. Tectonophysics 452, 17–28 (2008).
18. V. Mouslopoulou, D. T. Hristopulos, Patterns of tectonic fault interactions captured throughgeostatistical analysis of microearthquakes. J. Geophys. Res. Solid Earth 116, (2011).
19. K. Mogi, Relations between the eruptions of various volcanoes and the deformations ofthe ground surfaces around them. Bull. Earthq. Res. Inst. 239, 352–367 (1958).
20. T. J. Wright, B. E. Parsons, J. A. Jackson, M. Haynes, E. J. Fielding, P. C. England, P. J. Clarke,Source parameters of the 1 October 1995 Dinar (Turkey) earthquake from SAR interferometryand seismic bodywave modelling. Earth Planet. Sci. Lett. 172, 23–37 (1999).
21. Y. Okada, Surface deformation due to shear and tensile faults in a half-space. Bull. Seismol.Soc. Am. 75, 1135–1154 (1985).
22. F. Sigmundsson, Iceland Geodynamics: Crustal Deformation and Divergent Plate Tectonics(Springer-Praxis, Chichester, UK, 2006).
23. D. Kear, Reassessment of Neogene tectonism and volcanism in North Island, New Zealand.N. Z. J. Geol. Geophys. 47, 361–374 (2004).
24. F. Maccaferri, E. Rivalta, D. Keir, V. Acocella, Off-rift volcanism in rift zones determined bycrustal unloading. Nat. Geosci. 7, 297–300 (2014).
25. M. Ellis, G. King, Structural control of flank volcanism in continental rifts. Science 254,839–842 (1991).
26. S. Riddick, D. Schmidt, Time-dependent changes in volcanic inflation rate near ThreeSisters, Oregon, revealed by InSAR. Geochem. Geophys. Geosyst. 12, (2011).
27. M. E. Pritchard, S. T. Henderson, J. A. Jay, V. Soler, D. A. Krzesni, N. E. Button, M. D. Welch,A. G. Semple, B. Glass, M. Sunagua, E. Minaya, A. Amigo, J. Clavero, Reconnaissanceearthquake studies at nine volcanic areas of the central Andes with coincident satellitethermal and InSAR observations. J. Volcanol. Geotherm. Res. 280, 90–103 (2014).
28. K. Jaxybulatov, N. M. Shapiro, I. Koulakov, A. Mordret, M. Landès, C. Sens-Schönfelder, Alarge magmatic sill complex beneath the Toba caldera. Science 346, 617–619 (2014).
29. J. G. Begg, V. Mouslopoulou, Analysis of late Holocene faulting within an active rift usinglidar, Taupo Rift, New Zealand. J. Volcanol. Geotherm. Res. 190, 152–167 (2010)
30. G. H. Blick, M. P. Flaherty, Regional vertical deformation associated with the 1987 Edge-cumbe earthquake, New Zealand. N. Z. J. Geol. Geophys. 32, 99–108 (1989).
31. D. Keir, I. J. Hamling, A. Ayele, E. Calais, C. Ebinger, T. J. Wright, E. Jacques, K. Mohamed,J. O. S. Hammond, M. Belachew, E. Baker, J. V. Rowland, E. Lewi, L. Bennati, Evidence forfocused magmatic accretion at segment centers from lateral dike injections captured beneaththe Red Sea rift in Afar. Geology 37, 59–62 (2009).
Hamling et al. Sci. Adv. 2016; 2 : e1600288 3 June 2016
32. Y. Okada, Internal deformation due to shear and tensile faults in a half-space. Bull. Seismol.Soc. Am. 82, 1018–1040 (1992).
33. S. Wiemer, S. R. McNutt, Variations in the frequency-magnitude distribution with depth intwo volcanic areas: Mount St. Helens, Washington, and Mt. Spurr, Alaska. Geophys. Res. Lett.24, 189–192 (1997).
34. N. W. Warren, G. V. Latham, An experimental study of thermally induced microfracturingand its relation to volcanic seismicity. J. Geophys. Res. 75, 4455–4464 (1970).
35. V. M. Stagpoole, H. M. Bibby, Residual Gravity Anomaly Map of the Taupo Volcanic Zone,New Zealand, 1:250000, version 1.0 (Institute of Geological and Nuclear Sciences, LowerHutt, New Zealand, 1999).
36. S. Bannister, F. Davey, D. Woodward, A lower crustal “bright spot” under the Bay of Plenty,North Island, New Zealand. Tectonophysics 472, 62–71 (2009).
37. A. Hooper, A multi-temporal InSAR method incorporating both persistent scatterer andsmall baseline approaches. Geophys. Res. Lett. 35, (2008).
38. P. A. Rosen, S. Hensley, G. Peltzer, M. Simons, Updated repeat orbit interferometry packagereleased. Eos. Trans. AGU 85, 47 (2004).
39. B. M. Kampes, R. F. Hanssen, Z. Perski, Radar interferometry with public domain tools,Proceedings of FRINGE 2003 Workshop (ESA-ESRIN), Frascati, Italy, 1 to 5 December 2003.
40. T. G. Farr, M. Kobrick, Shuttle radar topography mission produces a wealth of data. Eos.Trans. AGU 81, 583–585 (2000).
41. F. Waldhauser, W. L. Ellsworth, A double-difference earthquake location algorithm: Methodand application to the northern Hayward fault, California. Bull. Seismol. Soc. Am. 90,1353–1368 (2000).
42. W.-X. Du, C. H. Thurber, M. Reyners, D. Eberhart-Phillips, H. Zhang, New constraints onseismicity in the Wellington region of New Zealand from relocated earthquake hypocentres.Geophys. J. Int. 158, 1088–1102 (2004).
43. S. Wiemer, A software package to analyze seismicity: ZMAP. Seismol. Res. Lett. 72, 373–382 (2001).
Acknowledgments: We would like to thank the Japan Aerospace Exploration Agency for accessto the ALOS data under project RA4-1093, the ESA for access to the Envisat data under projectC1P-14029, and GeoNet (http://geonet.org.nz) for the CGPS data. We also thank G. Caldwell andB. Scott for early reviews of the manuscript. We would also like to thank M. Pritchard and ananonymous reviewer for their comments and suggestions, which have greatly improved themanuscript. The aerial photo shown in fig. S2 was sourced from the Land Information New Zealand(LINZ) Data Service (https://data.linz.govt.nz/layer/1757-bay-ofplenty-04m-rural-aerial-photos-2010-2012/)and licensed by BOPLASS Limited for reuse under the Creative Commons Attribution 3.0 NewZealand license. Funding: This work was supported by public research funding from the Governmentof New Zealand with additional support from the New Zealand Natural Hazards Research Platformunder grant no. 2015-GNS-02-NHRP and LINZ. Author contributions: I.J.H. acquired and processedthe InSAR data. S.H. estimated the CGPS velocities. S.B. provided the relocated earthquake catalog.N.P. organized and led the collection of campaign GPS data. I.J.H. carried out the elastic modelingand led the writing of the paper, with contributions from all authors. Competing interests: Theauthors declare that they have no competing interests. Data and materials availability: All dataneeded to evaluate the conclusions in the paper are present in the paper and/or the Supplemen-tary Materials. Additional data related to this paper may be requested from the authors.
Submitted 10 February 2016Accepted 12 May 2016Published 3 June 201610.1126/sciadv.1600288
Citation: I. J. Hamling, S. Hreinsdóttir, S. Bannister, N. Palmer, Off-axis magmatism along asubaerial back-arc rift: Observations from the Taupo Volcanic Zone, New Zealand. Sci. Adv.2, e1600288 (2016).
7 of 7
Zone, New ZealandOff-axis magmatism along a subaerial back-arc rift: Observations from the Taupo Volcanic
Ian J. Hamling, Sigrun Hreinsdóttir, Stephen Bannister and Neville Palmer
DOI: 10.1126/sciadv.1600288 (6), e1600288.2Sci Adv
ARTICLE TOOLS http://advances.sciencemag.org/content/2/6/e1600288
MATERIALSSUPPLEMENTARY http://advances.sciencemag.org/content/suppl/2016/05/31/2.6.e1600288.DC1
REFERENCES
http://advances.sciencemag.org/content/2/6/e1600288#BIBLThis article cites 34 articles, 8 of which you can access for free
PERMISSIONS http://www.sciencemag.org/help/reprints-and-permissions
Terms of ServiceUse of this article is subject to the
registered trademark of AAAS.is aScience Advances Association for the Advancement of Science. No claim to original U.S. Government Works. The title
York Avenue NW, Washington, DC 20005. 2017 © The Authors, some rights reserved; exclusive licensee American (ISSN 2375-2548) is published by the American Association for the Advancement of Science, 1200 NewScience Advances
on February 8, 2018
http://advances.sciencemag.org/
Dow
nloaded from
Recommended