ISIJ International. Vol. 38 (1 998). No. 4, pp. 348-356
Developmentof Double andfor in Sitd Observation and
Single Hot ThermocoupleTechniqueMeasurementof Mold Slag
Crysta IIizati on
Yoshiaki KASHIWAYA.Carlos E. CICUTTI.1) Alan W. CRAMB2)and Kuniyoshi ISHll3)
Formerly Faculty of Engineering, Hokkaido University. Nowat Department of Materials Science and Engineering. CarnegieMellon University, Pittsburgh, PA. USA. 1)Formerly Departmentof Materials Science and Engineering, Carnegie Mel]onUniversity. Nowat Center for Industrial Research. FUDETEC.Argentina. 2) Department of Materials Science andEngineering. Carnegie Mellon University, 5000 Forbes Ave.. Pittsburgh, PA1521 3, USA.3) Department of Materials Science and Engineering. Faculty of Engineering, Hokkaido University, Kita-ku, Sapporo,Hokkaido. 060-8628 Japan.
(Received on September17. 1997, accepted in final form on December16. l997)
To overcomethe limitations of differential thermal analysis (DTA) and direct casting experimentation in
the measurementand understanding of the solidification phenomenaof mold slags, the double and singlehot thermocouple techniques (DHTTand SHTT)for the direct observation and measurementof mold slagcrystallization were developed. Thesemethodsenable the solidification and melting process of transparentslags to be observed '"in situ" under conditions where the temperature or temperature gradient can bemeasuredand controlled. The SHTTallows a sample to be subjected to rapid cooling rates or to be heldunder isothermal conditions. The DHTTallows large temperature gradients to be developed between thetwo thermocouples and allows a simulation of the transient conditions which can occur in the infiltratedslag film that occurs between the mold and the solidifying shell in the mold of a continuous caster. Bythese techniques both isothermal and non-isothermal phenomenacan be studied.
A numberof mold slags are optically tTansparent or translucent at steelmaking temperatures while thecrystalline phase which precipitates upon cooling is opaqueand can be clearly observed using opticalmicroscopy. Thusthe SHTTand DHTTare connected to an imagecapturing and analysis system that allowsthe onset and growth of the opaque crystals which precipitate from the slags to be documented. Thedevelo pmentand appl ication of these techn iques to moldslag crystal Iization wi IIbediscussed in th is paper,
KEYWORDS:hot thermocouple; mold flux; continuous casting; crystallization; nucleation; crystal growth;silicate; slag; TTT; CCT,
l. Introduction
Mold slags* play an important role in the controlof the continuous casting process and an understandingof mold slag properties and solidification behavior is
the basis for optimization of continuous caster opera-tion.1~19) The precipitation of crystalline solids frommold slags during continuous casting is well documentedand the use of casting powderswith a high crystallizationtendency*2 has been reported to be beneficial in thecasting of peritectic steel grades where the formation of
a significant crystal fraction in the mold slag layerbetweenthe mold and the strand reduces mold heat flux
and helps alleviate problems with longitudinal crack-ing.2~7) A high crystallization tendency has, however,
been shownto be deleterious to caster operation underhigh speed casting conditions where increased friction
between the mold and the strand and a higher incidenceof sticking type breakouts has been documented.8~15)For example, friction measurementscarried out by Gilles
et al.15) in a slab caster showed that powders with ahigher crystallization temperature gave larger frictionforces while Hering et al.9) noted that friction in thecontinuous casting mold depends on the viscosity ofmold slag and the type of crystalline phases present,
The infiuence of crystalline phases on heat transferin the mold has been the subject of a numberof investi-gations.2~6,16~18) In general, it is commonlyacceptedthat a larger proportion of crystalline phases (or a castingpowder with higher crystallization temperature) in a
* Mold slags are the liquids that form upon the melting of the mold powders or mold fiuxes that are added to the mold of a continuous casterused in the processing of liquid steel. The mold slag composition can be slightly different in composition from the mold powder or flux due to
absorption of inclusions or reaction with the liquid steel.
*2 Usually defined by the temperature at which crystallization can be measuredduring cooling using Differential Thermal Analysis (DTA).
C 1998 ISIJ 348

ISIJ International, Vol.
liquid slag film decreases the overall heat transfer rate
through the slag layer. This has been observed both in
laboratory experiments3) and in plant trials.2,3) Thisreduction in the heat transfer has been attributed to the
formation of pores in the crystalline layer4) and to the
scattering of radiation by the crystals, which reduces the
radiative portion of the overall heat flux.6) Jenkins7) hasmodelled heat transfer across the slag film presentbetween the shell and mold of a continuous caster andhas shown that the relative position of the crystalline
layer in the slag film can also modify the total rate ofheat transfer that be found in the mold of a continuouscaster. Thus it is necessary to understand the exactthermal conditions for precipitation and growth of acrystalline phase from a slag to understand the heat flux
encountered in the mold of a continuous caster, while it
is necessary to understand the crystal morphology andthe temporal development of the fraction of solid to
understand lubrication.
Quantification of mold slag solidification phenomenais normally conducted using differential thermal analysis
(DTA) or slag casting in a chill mold; however, these
techniques are limited as there is no direct method ofobservation of the solidification phenomenaand onlyeffects which liberate significant quantities of heat canbe measured. The DTAis one of the most populartechniques for the study of slag crystallization. In this
case, the slag sample is melted in a furnace and thencooled, together with a reference substance, and the
temperature difference betweenboth the sampleand the
reference material is recorded. Whena reaction that
involves heat generation or heat absorption takes placein the sample, a temperature difference between the
sampleand the reference can be detected. During samplecooling in a DTA, the highest temperature associated
with an exothermic peak is usually called the "Crystal-lization Temperature" of the casting powder. In general,
a higher "Crysta]lization Temperature" is thought to berelated to a higher fraction of crystalline phase in the
mold slag layer between the mold and the strand.
However, a unique criteria to establish the cooling rate
of the sample has not been established in these studies
and only a few studies have considered the effect of the
cooling rate on crystallization behavior.16~ 18) Further-
more, the term "Crystallization Temperature" is some-times confused with the so called "Solidification Tem-perature" of the slag which is determined from viscosity
tests where a rapid rate of viscosity increase withdecreasing temperature is incorrectly used as an indica-
tion of the onset of crystallization within the slag.19)
Another technique that is frequently employed to
determine the crystallization behavior of a mold slag
consists of melting the mold slag sample and elevatingits temperature to 1550'C before quenching in a metallicmold.9,11,12,i6.18) After casting, the sample can beinspected at room temperature by different techniques.
For example, the proportion of crystalline and glassy
phases can be evaluated using microscopy and X-raydiffraction can be performed to determine the composi-tion of the crystalline phases present. Obviously, these
methodsare useful to define a "crystallinity index" which
349
38 (1998), No. 4
compares, qualitatively, the tendency of different slags
to give glassy or crystalline phases; however, these in-
dexes do not provide a quantitative measurementthat
can characterize the slag behavior in the mold.To properly characterize the precipitation of a second
solid phase from a liquid, it is necessary to define thethermal field, the phase diagram and the nucleation andgrowth behavior of the solid. In mold slags, which areliquid oxides and easy glass formers under high coolingrates, it is necessary to be able to describe the conditions
under which glass formation is possible, the conditionsfor the initiation of solidification, the crystal morphol-
ogy, chemistry and growth rate and the time evolutionof the fraction of solid. It is well knownfrom classical
nucleation theory that the onset of crystallization in slags
must be a function of cooling rate and that to determinethe solidification behavior of a liquid slag one mustconstruct either isothermal time temperature trans-
formation diagrams (TTTcurves) or continuous coolingtransformation diagrams (CCTcurves). In addition, the
growth rate, morphology and solidified fraction of the
slag under varying cooling rates are important in the
determination of the effect of crystallization of the slag
on heat transfer and rheology. Thusa technique, wherebythe thermal field can be determined as the solidification
process is observed, wasdeveloped. This technique whichcombines the hot thermocouple technique with videoobservation and image analysis which allows crystal
growth rates, morphologies and solidified fractions to bedetermined under defined thermal conditions.
Theconcept of the single hot thermocouple techniquedates back to the end of nineteenth century and the hotthermocouple method itself was successfully developedby Ordway20)and Welch, et al.21) in 1950's. The prog-ress of electronic development has madethe hot ther-
mocouple method easier and more reliable and haslead to renewedinterest in the technique. YanagaseandMorinaga reported newdevelopments of the hot ther-
mocouplemethodand its application22 ~ 24) in the 1970's
and in 1980, Ohta et al.24) applied the hot thermocouplemethod to the measurementof liquidus temperatures,clarification of the existence of two phaseregions in slags
and also to the understanding of slag reactions. Morerecently (1993) Asayama,et al.25) has discussed glass
formation in silicate slags using the hot thermocouplemethod.
Ishii and Kashiwaya first developed the double hotthermocouple methodand applied it to a microgravityexperiment to determine the microstructural change of
a superconducting oxide in 1992.27-29) The technique
wasalso usedby Murayama,et al.26) to study Marangoniflow in silicate slags under microgravity andby Kuranagaet al.27) to measurethe ultimate length of a silicate slag
film to clarify the mechanismof the separation of a bubblefrom a liquid slag surface.
In this paper, the application of the hot thermocouplemethodto the study of the crystallization of a mold slag
will be described. Results of in situ observation andmeasurementof industrial and simulated mold slags will
be shownusing the single hot thermocouple technique
(SHTT) and the double hot thermocouple technique
C 1998 ISIJ

ISIJ International. Vol. 38 (1998), No. 4
HeatingIl
113
60HZ I•, 50Hzl
lI
Heatlngllf
il
li
lI
ll
~ iI
Temperature TemperatureMeasurement Measurement
Fig. 1. Principle of hot thermocouple controller
Manual
~~Computer
BTypeThermocouple
PowerSource
Diode
Current
Fig. 2. Circuit diagram of
Relay Circuit
Output ofTemp.
Thermocouple
he hot thenTrocouple controller.
Fig. 3.
/sample
~~~~~~Single(a)
SHTT
(DHTT).
2. Experimental
2.1. Principle of Hot ThermocoupleDriver
The hot thermocouple driver is a unique system thatenables simultaneous measurementof temperature while
a thermocouple is heated. In this method, the slag samplecan be melted directly on the tip of the thermocouple orbetween two similarly configured thermocouples. Figure
l illustrates the principle of the hot-thermocouple con-troller. The electric current (60 Hz) is rectified into ahalf-wave by a silicon controlled rectifier (SCR), sothat the heating cycle occurs for a maximumlength ofl/120sec followed by a similar period with no currentinput where the temperature of the thermocouple is
measuredusing a relay circuit.
Figure 2 shows a circuit schematic of the hot ther-
mocouple controller. The main circuit is the powersupp]y circuit having a SCRand a diode. To control theSCR,the gate signal is supplied from the powercontrolcircuit (or temperature contro] circuit) whlch is operatedby meansof a computer or a potentiometer. Since thetemperature will changewith the length of thermocouplewire and the amountof sample, the temperature is notalways constant whenthe sameD.C. voltage is suppliedto the control circuit. The output of electromotive forcefrom thermocouple is connected to the relay circuit whichis turned on only during one third of the no heatingperiod to reduce sampling noise. All errors of tempera-ture measurementoccurring from a contact potentialdifference between the electrode and relay circuit werecorrected by a calibration with pure CaF2'
CC*) 1998 ISIJ 350
~L~'~~~lDouble. (b)
DHTT
Illustration of (b) double hot thermocouple technique(DHTT) and (a) single hot thermocouple technique(SHTT).
2.2. Single Hot ThermocoupleTechnique (SHTT) andDouble Hot ThermocoupleTechnique (DHTT)
There are two modesof operation of the hot thermo-couple technique. Figure 3showsthe difference betweensingle hot thermocouple and double hot thermocoupletechniques. The first modeof operation is the single hotthermocouple technique (SHTT), which is the originaldevelopment of the apparatus.20-24) The SHTTis ap-propriate for samples of a high fluidity (or low viscosi-ty) Iiquid such as calcium fluoride (CaF2) and somemold slags.
The second modeof operation is the double hotthermocouple technique (DHTT), which wasdevelopedby the authors for mold slag crystallization studies. TheDHTThas the advantage that a desired temperaturegradient can be developed between the two thermo-couples. Therefore, the temperature of the melt can beset and solidification initiated by controlling either thetemperature or the temperature difference between thetwo thermocouples. In this method, it is possible togenerate the various thermal gradient conditions whichmaybe experienced in the mold of a steel continuouscaster. For examp]e, the slag sample can be completelymelted and held isothermally on the thermocouples attemperatures which would be experlenced in the moldof a continuous caster whenthe slag is in contact withthe liquid steel (1 450l 550'C)
.Onethermocouple can
be then programmedwith a desired coo]ing rate orrapidly decreased to adesired temperature to set a desiredthermal gradient.
Mostmold slags are basedupon the lime-silica systemwith additions of other oxides and fluorides to extendthe liquid phase field. Fortunately, the majority of theoxides used in mold slag formulations are transparentor translucent when liquid, while the crystals whichprecipitate tend to be opaque. Thus the crystallization
phenomenacan be clearly recorded using commercialvideo equipment and the onset of crystallization, thegrowth rate of the soiidification front and its position
can then be measuredas a function of the cooling rate.
Thus using the SHTTand the DHTT, solidification
phenomenacan be observed directly and the beginningofcrystallization, the numberof crystals, the morphologyof the crystal and a kinetic analysis of the crystal growthrate can be performed either isothermally or under

ISIJ International, Vo!, 38 (1 998), No. 4
from Powersupplying circuit
I~to Relay circuit forTemperature measurement
CopperElectrode
/t/ copper l\
BTypeThermocouple
0.5
Welding (a)point
~='?1.l
Sample
e~c (b)e~'
Alu~ina holder
BTyp' Thermocouple
Fig. 4. Schematic of (a) electrode conjunction 'and (b)
electrode assembly for hot thermocouple technique.
various thermal gradients.
There are limitations to the cooling rate that canbe achieved using the SHTTand the DHTTand the
maximumcooling rates which have been achieved are in
excess of 150'C per second which is significantly higher
than the critical cooling rate for glass formation mea-sured for a numberof similar oxide systems24,28,29) andshould allow TTTand CCTdiagrams to be constructed
for mold slags. Actual cooling rates between the steel
shell and the mold of a continuous caster have beenestimated by Hoand Thomas30)to range from less than
1'C per second to 20'C per second depending uponposition in the mold.
2.3. Experimental ApparatusFigures 4(a) and 4(b) showschematics of the electrode
assembly and electrode used to hold a hot thermocou-ple. The one of most important technique is to weidthe thermocouple without a bead and to makeit samediameter. Thewider or smaller diameter in hot thermo-couple would result in a nonuniform heat generation.
The thermocouple is heated from the tip of the thermo-couple to the end of the copper electrode which is
supplying the electric power. The maximumachievable
temperature varies with the length of the thermocouplewire connected between the electrodes. The achievablecooling rate is a function of the length of the thermo-couple wire and the heat transfer mechanismthat controlsheat loss from the sample. Tight contact between the
thermocouple and copper electrode is important for
noiseless measurement.Figure 5 shows a schematic of the observed natural
convection patterns of the gas flow around the sample.Kashiwaya et al. has investigated the effect of micro-gravity on the solidification of superconducting oxide6)
and has shown that the sample temperature increasedunder microgravity when natural convection wasminirnized, even though the power to the hot thermo-couple was constant. Natural convection must be sta-
bilized in this technique to obtain stable temperatures
351
Optical flat for observation
Natural convectionin the reaction tube
*
hot thermo-couple
Fig. 5. Schematic of convection patterns in the reaction tube,
onvectionction tube Quartz tube
~Electrodeof hot thermo-
~~)
Microscope
SupplementalHeater BType
T.C.
Fig. 6. Schematic of experimental apparatus.(VCR: video cassette recorder)
in the DHTTand SHTT.In the case of a large reactiontube, convection is unstable and it is difficult to reach
an equilibrium temperature. Thus to establish a stable
temperature for the hot thermocouple technique (HTT),the apparatus must have a small volumeand a constantheat loss from the reaction tube to its surroundings. Asupplemental heater wasthus employedto minimize theheat loss from the surface of the sample to the ambientgas. Several types of supplemental heaters madeout ofplatinum wire wereadopted and located under the sampleor adjacent to the sample.
Figure 6showsthe setup of the experimental apparatuswhich included the double hot thermocouple, the ob-servation system and computer data acquisitlon system.Thedata acquisition systemmakesit possible to measureand control the sample temperature continuously andhas a two channel D/A (digital-analog: 0-5 DCvolt)interface that can control the hot thermocouples in-
dependently. Thesample is 3mmin diameter; therefore,
an optical microscope connected to a CCDcamerawasused to allow observation of the sample. As the videosignal does not have the information of experimentaltime and temperature, a superimposer of time andcharacters which exhibits the experimental conditions
was connected to the video system. The computer has
an imagecapturing system which allows a moredetailed
analysis of the crystallization phenomena,allows real
time digital storage of the signal and a]10ws "post
mortem" analysis of the rate of crystal growth.
C 1998 ISIJ
~o:,U
oCLEoh
Oo'*sc:l
oaEoH
Fig.
~O:5
OCLE,D
H
1500
1480
1460
1440
1420
1400
1380
(a)
ISIJ International, Vol.
Melting Point bf CaF2=- 1418'C
155 160 165 170 175 180 185Time[s l
1500
900100 110 120 130 140 150 160 170 180
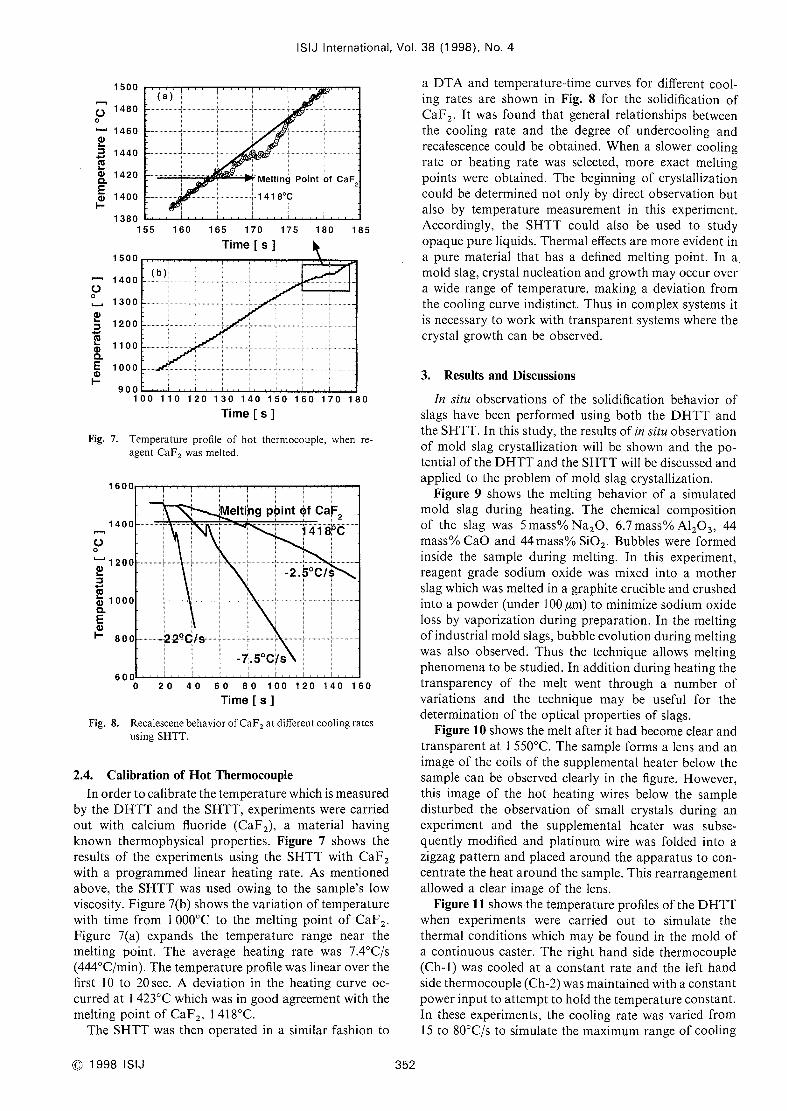
Time [s l7. Temperature profile of hot thermocouple, when re-
agent CaF2wasmelted.
1600
1400
1200
1ooo
800
600
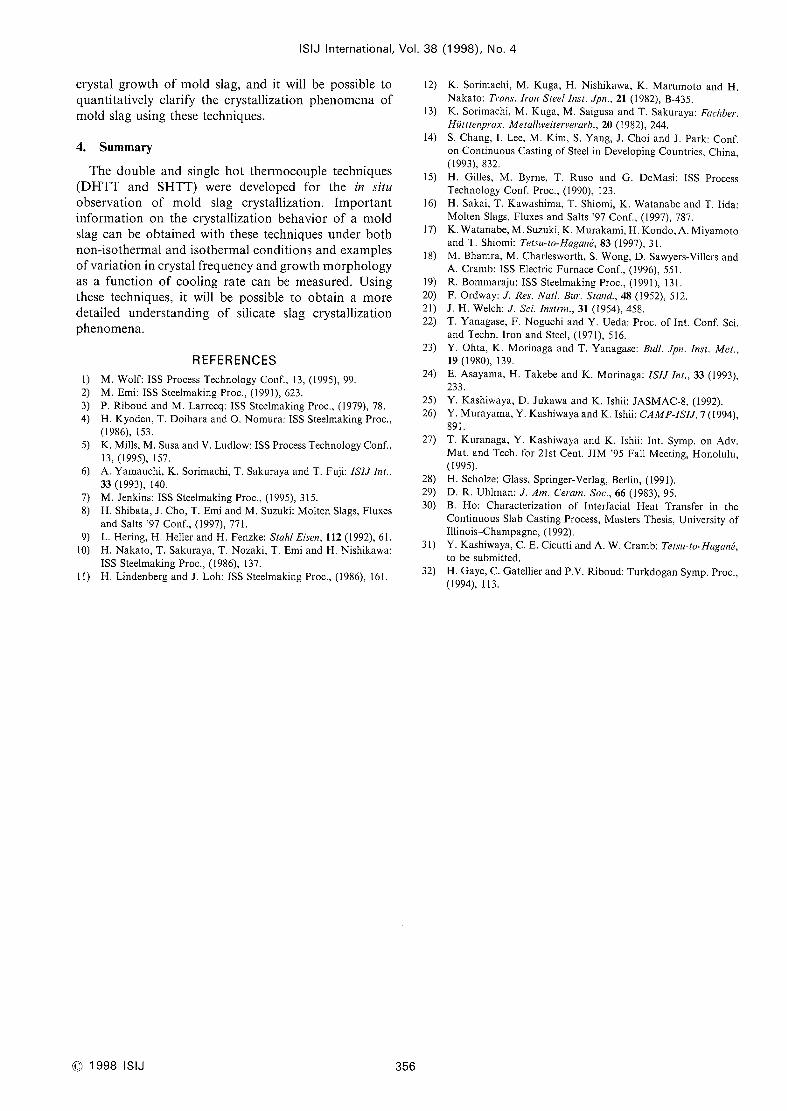
Fig. 8.
~Melti~9 pPint o~f Ca~2
_2.
~0cl~
_7;'5oc~S
O 20 40 60 80 100 120 140 160Time [s l
Recalescenebehavior of CaF2at diffcrent cooling rates
using SHTT.
2.4. Calibration of Hot ThermocoupleIn order to calibrate the temperature which is measured
by the DHTTand the SHTT,experiments were carried
out with calcium fluoride (CaF2), a material havingknown thermophysical properties. Figure 7 shows theresults of the experiments using the SHTTwith CaF2with a programmedlinear heating rate. As mentionedabove, the SHTTwas used owing to the sample's lowviscosity. Figure 7(b) showsthe variation of temperaturewith time from I OOO'Cto the melting point of CaF2'Figure 7(a) expands the temperature range near the
melting point. The average heating rate was 7.4'C/s(444'C/min). Thetemperature profile waslinear over thefirst 10 to 20 sec. A deviation in the heating curve oc-curred at 1423'C which was in goodagreementwith the
melting point of CaF2, 1418'C.The SHTTwas then operated in a similar fashion to
C 1998 ISIJ 352
38 (1 998), No. 4
a DTAand temperature-time curves for different cool-ing rates are shown in Fig. 8 for the solidification ofCaF2' It was found that general relationships betweenthe cooling rate and the degree of undercooling andrecalescence could be obtained. Whena slower coolingrate or heating rate was selected, more exact meitingpoints were obtained. The beginning of crystallization
could be determined not only by direct observation butalso by temperature measurementin this experiment.Accordingly, the SHTTcou]d also be used to study
opaquepure liquids. Thermal effects are moreevident in
a pure material that has a defined melting point. In amold slag, crystal nucleation and growth mayoccur overa wide range of temperature, making a deviation fromthe cooling curve indistinct. Thus in complex systems it
is necessary to work with transparent systems where thecrystal growth can be observed.
3. Results and Discussions
In situ observations of the solidification behavior ofslags have been performed using both the DHTTandthe SHTT.In this study, the results of in situ observationof mold slag crystallization will be shownand the po-tential of the DHTTand the SHTTwill be discussed andapplied to the problem of mold slag crystallization.
Figure 9shows the melting behavlor of a simulatedmold slag during heating. The chemical compositionof the slag was 5mass'/, Na20, 6.7mass~/* A1203, 44mass*/* CaOand 44mass"/* Si02' Bubbles were formedinside the sample during melting. In this experiment,reagent grade sodium oxide was mixed into a motherslag which wasmelted in a graphite crucible and crushedinto a powder(under 100pm) to minimize sodium oxideloss by vaporization during preparation. In the meltingof industria] mold slags, bubble evolution during melting
was also observed. Thus the technique allows meltingphenomenato be studied. In addition during heating the
transparency of the melt went through a number ofvariations and the technique may be useful for thedetermination of the optical properties of slags.
Figure 10 showsthe melt after it hadbecomeclear andtransparent at 1550'C. The sample forms a lens and animage of the coils of the supplemental heater below thesample can be observed clearly in the figure. However,this image of the hot heating wires below the sampledisturbed the observation of small crystals during anexperirnent and the supplemental heater was subse-quently modified and platinum wire was folded into azigzag pattern and placed around the apparatus to con-centrate the heat around the sample. This rearrangementallowed a clear image of the lens.
Figure ll showsthe temperature profiles of the DHTTwhen experiments were carried out to simulate thethermal conditions which maybe found in the mold of
a continuous caster. The right hand side thermocouple(Ch-1) was cooled at a constant rate and the left handside thermocouple (Ch-2) wasmaintained with aconstant
powerinput to attempt to hold the temperature constant.In these experiments, the cooling rate was varied from15 to 80'C/s to simulate the maximumrange of cooling

ISIJ International, Vol. 38 (1 998), No. 4
t * 0.5mm
Fig. 9. Result of i,1 situ observation bybehavior of a simulated mold6.8 o/* A1203. C/S= l)
DHTT. Meltingsiag. (5"/, Na20,
Fig. lO. Result of in situ observation by DHTTofasimulat-ed mold slag at 1550'C. (5"/, Na20, 6.8"/. Al203,C/S= I)
Fig. 14. Crystallization behavior of simulated mold slags.
(a) 50'C/s (3.80/, Na20, 6.80/0 Al203' C/S=1)
(b) 80'C/s (50/0 Na20, 6.7"/~ Al203' C/S=l)
of a simulated mold slag
with 50'C/s. (5 "/* Na20,
Fig. 15. Crystallization behavior of industrial mold slag by
SHTTin isothermal experiment for TTTdiagram(1 21 5'C).
Fig. 13. Crystallization behavior
when Ch-1 was cooled6.8 o/* Al203, C/S= l)
353 (,() 1998 ISIJ

ISIJ International, Vol. 38 (1998), No. 4
~1200
o:' Iooocs
a'
aE,D
F
1600
14ooCh-2
200
5O'Clsooo Os
Coolingstart
8008s
Crystalli-zation ;
600 start 13sCh-1
400
Oo
OCL
Eoh
1600
1500
1400
1300
1200
11OO
1OOO
900
800
ch-2 i:\~\'1 \
Is
ll \ 5.4s\ 'bb \_ ~~~r-
ll 'tl ' ltt'tl' 1 14sI.'L
bl\1,•.
10290 10300 1031O I 0320 10330Time [s J
Fig. Il. Tomperature profiles of double hot thermocoupleduring a non-isothermal experiment simulating the
continuous caster.
Ch-1
rates that might be foLmd in a continuous caster moldslag. In Fig. 11, Ch-1 wascooled with a rate of 50'C/sand the details of the results under other conditions will
be published in the near future.31)
The cooling rate of Ch-1 wasconstant for 8sec untilthe temperature reached 880'C. The temperature of Ch-2decreased from 1550 to 1450'C within 13 sec from thestart of cooling, even though the power input wascon-stant. Small crystals were observed after 8sec in videoimageand the cooling rate of Ch-2 changedat this time,because of the exothermic nature of crystallization. If
there wasno heat evolution inside the sample and Ch-1cooled with a constant rate, Ch-2 would have a constantcooling rate. In this case, the position of the deviationfrom a straight line occurred at the sametime as the in
situ observation of crystallization.
Oneof disadvantages of this methodarises due to thedifficulty in the determination of the temperature profilein the sample. It is posslble, however, to estimate the
temperature profile of sample between Ch-1 and Ch-2from the brightness of the recorded image. Figure 12shows the temperature distribution obtained from thebrightness of the recorded image. A CCDcamera cansense a broad range of spectra in which respective in-
tensities are not proportional to the temperature. It is
impossible to compare the temperature from the in-
tensities of emission between two different materials,however, within the same material, the intensity ofemission is proportional to the temperature over a short
range of temperatures. Thus we can estimate the tem-perature distributions in the sample from the brightnessof the image as the temperatures of the two points in
each image are known. In Fig. 12, the intensity ofbrightness of the sample in the vicinity of the Ch-1 andCh-2 thermocouple were assumedto be equal to the
temperature recorded by the thermocouples. Thenuslngthe coefficient derived from the measurement, the tem-perature distribution across the sample was estimated.The profiles were smooth (after I and 5.4s In Fig. 12)until crystals precipitated, and becameirregular afterthe crystal precipitated, probably due to the iatent heat
r~c', 1998 ISIJ 354
-0.5 0.5 1 1.5
Distance [mmJFig. 12. Variation oftemperature distributions of the sample
estimated from the image brightness.
of crystalllzation and a change in the emissivity due tothe presence of the crystal fraction. The temperaturedistributions within 0.8mmfrom Ch-1 (0.7mm fromCh-2) in Fig, 12 (1 and 5.4s) were almost flat with asteep gradient near Ch-2. Thedistance betweenCh-I andCh-2 increased with the decreasing temperature, becauseof the contraction of thermocouple. Thus the arrow inFig. 12 at Ch-1 is not vertical and reflects the extensionof the sample during the experiment.
Figure 13 shows the crystals precipitated from a5mass"/. Na20, 6.8masso/. Al203, 44mass"/oCaOand44masso/. Si02 Slag. It can be seen that there are anumberof distinct nucleation events in the sample. Inthis experiment, Ch-1 wascooled at 50'C/s. Becauseofa relatively high cooling rate, crystal growth near Ch-lis minimized and crystals coarsen near Ch-2, due to thehigher temperature and enhanced crystal growth bydiffusion. This result is typical of the type of crystal-lization that wasobserved in these slags. The frequencyof precipitated crystals could be varied by varying coolingrate. This crystallization phenomenonis typical of the typethat one would expect due to nucleation and growthfrom an undercooled melt. In addition the morphologyof the crystals varied from dendritic at high cooling ratesto blocky faceted crystals at lower cooling rates.
Figure 14 shows the effect of the cooling rate on themorphologyof crystal in simulated mold slags at 50'C/s(Fig. 14(a): 3.8mass"/o Na20, 6.8masso/* Al203, 45mass"/o CaOand 45 mass"/o Si02) and 80'C/s (Fig. 14(b):
5mass"/o Na20, 6.7 masso/. Al203, 44.3 masso/oCaOand44.3masso/oSi02))' Figure 14(a) is the image after 17sfrom the beginning of crystallization and Fig, 14(b) is
an imageafter 16s from the beginning of crystallization.If one comparesFig, 13 to Fig. 14 (a), one can see thatwhen the amount of sodium oxide is decreased, thefrequency of crystallization is decreased and a glassyphase is stabilized. Thus in this system the crystallizationfrequency is very sensitive to the sodium oxide contentin the slag. At higher cooling rates (Fig, 14 (b)) glass
formation can be clearly observed and the crystals arenot clearly visible but the heat signature denoting the
onset ofcrystallization can be clearly seen. In Fig. 14(b),
a fine crystal layer precipitated in the sample in the areawhere the heat signature was noted durlng visual ob-

ISIJ International, Vol,
servation. SEManalysis on a quenchedspecimen con-firmed the presence of small dendritic crystals in theglass in this region.
Figure 15 showsthe result of an isothermal experimentto determine the crystallization behavior of an industrial
mold slag used in the continuous casting of austenitic
stainless steels. Thechemical composition of the slag was37.8masso/*Si02, 33'3mass"I*CaO, 7.9mass"/oA1203,8.2mass"/o Na20 and 8.4mass"/. F. In this case, the
powderwasdecarburized by the manufacturer in orderto facilitate the experiment. The viscosity of industrial
mold slag wasquite low and it wasdifficult to ho]d the
sample between two thermocouples in the DHTTandthe SHTTwas used to allow crystallization to bemeasuredduring an isothermal hold. The sample wasmelted at 1500'C to eliminate the bubbles, held for
I~5min to allow homogenization, cooled to a given
temperature with a high cooling rate (;~~ 80'C/s) and thenheld for 30 to 60min until crystallization wascomplete.In all cases bubble formation was observed during the
melting process. Crystallization initiated within 10 to
400sec of isothermal holding (depending on the tem-perature) and the crystals grew for up to 45 min after theinitiation of crystallization.
It was found that the shape of the crystals and the
modeof crystal growth were quite different between theisothermal experiment and the nonisothermal experimentwhich simulated the cooling conditions of the continuouscaster. Thus both isothermal and nonisothermal experi-
1300Present study e
- 1250O' 1200 e o by H.Gaye, et al- .S1150
(41.5'/.Si02"33.9'/.CaOel -24.6'1.Al203)
'~'5L 110O eO eaE 1050 eO eH 1000 e e
950 7010Na205010Na20
900(CaO/SiO=1.0, 7'/.AI O)
1O I OO 1000 104
Time[s lFig. 16. Effects of Na20on TTTcurve obtained by present
study and Gayeet a/.
38 (1 998), No. 4
mentation will be important in the understanding of thebehavior of a mold slag in an actual system.
Thesetechniques appear to be quite versatile and havealready shownthat it is posslble to observe crysta] growthunder defined thermal conditions, to modify crystal fre-
quency and morphology with variations in the coo]ingrate and to measurethermal effects relating to crystal-lization simultaneously with observation of the phenom-ena. The technique allows the possibility of a fast andaccurate determination of both TTTand CCTcurves in
transparent slag systems.Figure 16 shows a TTTdiagram for limealumina-
silica slags containing sodium oxide. The beginning ofcrystallization wasdetermined by the direct observationusing DHTTor SHTT.To develop the TTTdiagram,X-ray diffractions were carried out to determine thecrystalline phase after quenching the sample to roomtemperature. TheTTTcurves for these slmulated moldslags containing 5o/. Na20and 7'/. Na20(the composi-tion of mother slag is 7mass"/o A1203, CaO/Si02= 1.0),
were obtained by the DHTTand are comparedwith thedata from Gayeet al.32) on a lime silica alumina slag
where the TTTwas determined by an isothermal holdand quench technique. The data for TTT curves on5masso/* Na20and 7mass"/* Na20had relatively largescattering, then the empirical formulae were used toexpressed the data. The details of the data and formu-lae will be published also. Although the compositionof slag in CaOSi02-Al203system was different fromthe present study, the results indicate that additions ofsodiumoxide cause a major alteration to the TTTcurve.The temperature of the nose decreased with the contentof sodiumoxide and the incubation time of crystallization
decreasedwith the sodiumoxide content. Thusthe critical
cooling rate to stabilize the glassy phase increased withincreasing sodium oxide content.
Figures 17(a) and 17(b) showthe crystal morphologycaptured during crystal growth in the simuiated slag meltcontaining 7"/* Na20at 1300 and I 140'C, respectively.
At the higher temperature (Fig, 17(a)), the crystal grewmacroscopically as an equiaxed dendrite. Figure 17(b)
shows a macroscopic cubic crystal, however, dendritic
growth was observed at the solidification front in eachface of the cube. Thus the morphology of crystaldrastica]ly changed with decreasing temperature. TheDHTTand the SHTTprovide new information about
Fig. 17. Crystal morphology precipitaled from undercooled melt.
(a) dendritic crystal at 1300'C (b) cubic crystal at I 140'C
355 O1998 ISIJ
ISIJ International. Vol. 38 (1998), No. 4
crystal growth of mold slag, and it will be possible toquantitatively clarify the crystallization phenomenaof
mold slag using these techniques.
4. Summary
The double and single hot thermocouple techniques
(DHTTand SHTT) were developed for the in situ
observation of mold slag crystallization. Importantinformation on the crystallization behavior of a moldslag can be obtained with these techniques under bothnon-isothermal and isothermal conditions and examplesof variation in crystal frequency andgrowth morphologyas a function of cooling rate can be measured. Usingthese techniques, it will be possible to obtain a moredetailed understanding of silicate slag crystallization
phenomena.
l)
2)
3)
4)
5)
6)
7)
8)
9)
lO)
l l)
REFERENCESM. Wolf: ISS Process Technology Conf., 13, (1995), 99.
M. Emi: ISS Steelmaking Proc., (1991), 623.P. Riboud and M. Larrecq: ISS Steelmaking Proc., (1979), 78.
H. Kyoden, T. Doihara and O. Nomura:ISS Steelmaking Proc.,
(1986), i53.
K. Mills, M. SusaandV. Ludlow: ISS Process Technology Conf,,13, (1995), i57.
A. Yamauchi, K. Sorimachi, T, Sakuraya and T. Fuji: ISIJ Int.,
33 (1993), 140.
M. Jenklns: ISS Steelmaking Proc., (1995), 315.
H. Shibata, J. Cho, T. Emiand M, Suzuki: Molten Slags, Fluxesand Salts '97 Conf., (1997), 771.
L. Hering, H. Heller and H. Fenzke: Stah! Eisen, I12 (1992), 61.
H. Nakato, T. Sakuraya, T. Nozaki, T. Emi and H. Nishikawa:ISS Steelmaking Proc., (1986), 137.
H. Lindenberg and J. Loh: ISS Steelmaking Proc,, (1986), 161,
l2)
13)
l4)
l5)
16)
l7)
18)
l9)
20)
21)
22)
23)
24)
25)
26)
27)
28)
29)
30)
31)
32)
K. Sorimachi. M. Kuga. H. Nishikawa, K. Marumotoand H.Nakato: T,'ans. 1,•on Stee! Inst. Jp,7.. 21 (1982). B-435.K. Sorimachi, M. Kuga. M. Saigusa and T. Sakuraya: Fac'hbe,'.
Hiitttenp,'ax. Metalhveile,'ve,'a,'b., 20 (1982), 244.S. Chang. I. Lee. M. Kim. S. Yang. J. Choi and J. Park: Conf.
on Continuous Casting of Steel in Developing Countries. China,(1993), 832.
H. Gilles. M. Byrne. T. Ruso and G. DeMasi: ISS ProcessTechnology Conf. Proc., (1990), 123.
H, Sakai. T. Kawashima.T. Shiomi, K. Watanabeand T Iida:
Molten Slags, Fluxes and Salts '97 Conf., (1997), 787.
K. Watanabe.M. Suzuki, K. Murakarni. H. Kondo.A. Miyamotoand T. Shiomi: Tc'tsu-to-Hagan~, 83 (1997), 31.
M. Bhamra,M. Charlesworth, S. Wong,D. Sawyers-Villers andA. Cramb: ISS Electric Furnace Conf., (1996), 551
.
R. Bommaraju:ISS Steelmaking Proc., (1991), 131.
F. Ordway: J. Res. Nal!. Bu,'. Stand., 48 (1952), 512.J. H. Welch: J. Sci. Inst,'m., 31 (1954), 458.T. Yanagase, F. Noguchi and Y. Ueda: Proc. of Int. Conf. Sci.
and Techn. Iron and Steel, (1971), 516.
Y. Ohta. K. Morinaga and T. Yanagase: Bull. Jpn. Inst. Met.,19 (1980), 139.
E. Asayama,H. Takebeand K. Morinaga: ISIJ Int., 33 (1993),
233.
Y. Kashiwaya, D. Jukawaand K. Ishii: JASMAC-8,(1992).
Y. Murayama,Y. Kashiwayaand K. Ishii: CAMP-ISIJ,7(1994),891.
T. Kuranaga. Y. Kashiwayaand K. Ishii: Int. Symp, on Adv.Mat. and Tech, for 2lst Cent. JIM '95 Fall Meeting. Honolulu,(1995).
H. Scholze: Glass. Springer-Verlag, Berlin, (1991).
D. R. Uhlman: J. Am. Ceram. Soc., 66 (1983), 95.
B. Ho: Characterization of Interfacial Heat Transfer in the
Continuous Slab Casting Process, Masters Thesis, University ofIllinoisChampagne, (1992).
Y. Kashiwaya, C. E. Cicutti and A. W.Cramb: Tc'tsu-to-Hagani,to be submitted.
H. Gaye, C. Gatellier and P.V. Riboud: TurkdoganSymp.Proc.,(1994), I13.
@1998 ISIJ 356
Recommended


![Jst bst [portfolio]](https://img.pdfslide.us/doc/110x75/547b8193b4af9fda158b4ed4/jst-bst-portfolio.jpg)