1
25 years of Emerging Markets Debt investingRoy ScheepeNN IP Senior EMD Client Portfolio Manager
Contact: ANA GASCA+ 34 91 769 41 [email protected]

2For professional investors use only, not for use in public
NN EMD Strategies in 25 years
• EMD Hard Currency 19931993
• EMD Local Currency19981998
• EM Corporate Debt20052005
• EMD Local Bond20072007
• EMD Opportunities20112011
• Frontier Markets Debt (HC)20132013
2018 • EMD Short Duration NEW!
3For professional investors use only, not for use in public
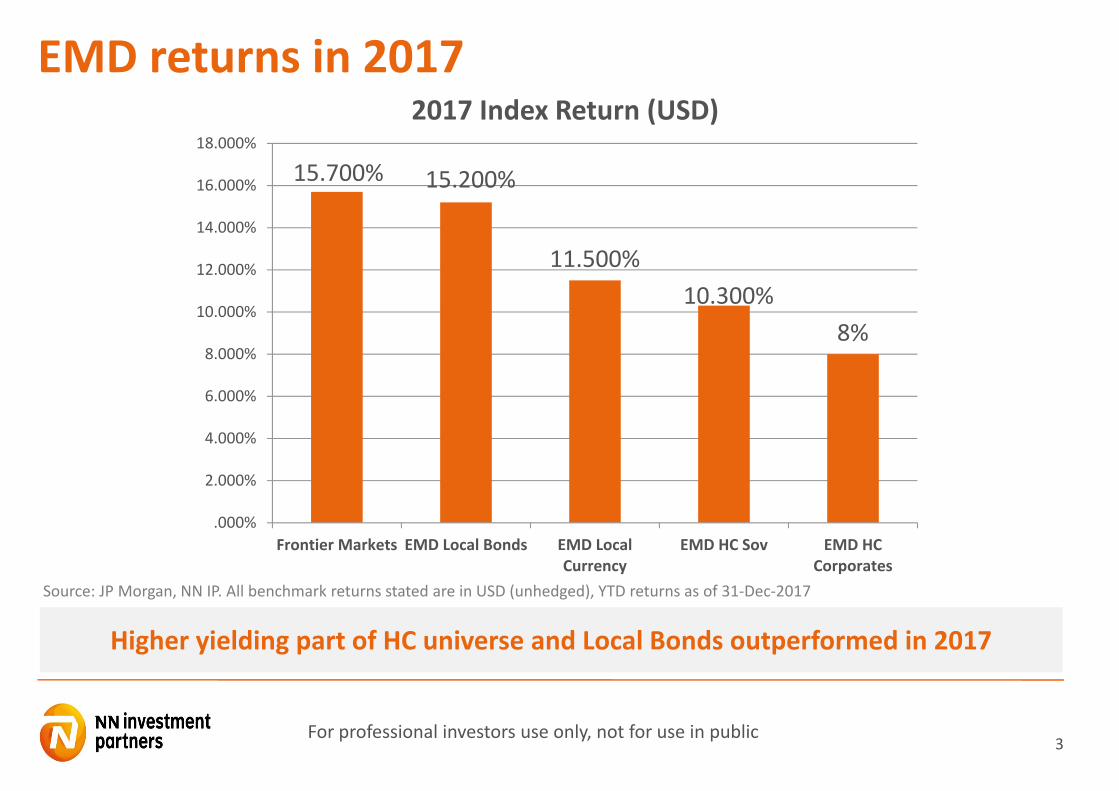
EMD returns in 2017
Source: JP Morgan, NN IP. All benchmark returns stated are in USD (unhedged), YTD returns as of 31‐Dec‐2017
2017 Index Return (USD)
15.700% 15.200%
11.500%10.300%
8%
.000%
2.000%
4.000%
6.000%
8.000%
10.000%
12.000%
14.000%
16.000%
18.000%
Frontier Markets EMD Local Bonds EMD LocalCurrency
EMD HC Sov EMD HCCorporates
Higher yielding part of HC universe and Local Bonds outperformed in 2017
4For professional investors use only, not for use in public
60
100
140
180
220
260
300
340
380
420
460
500
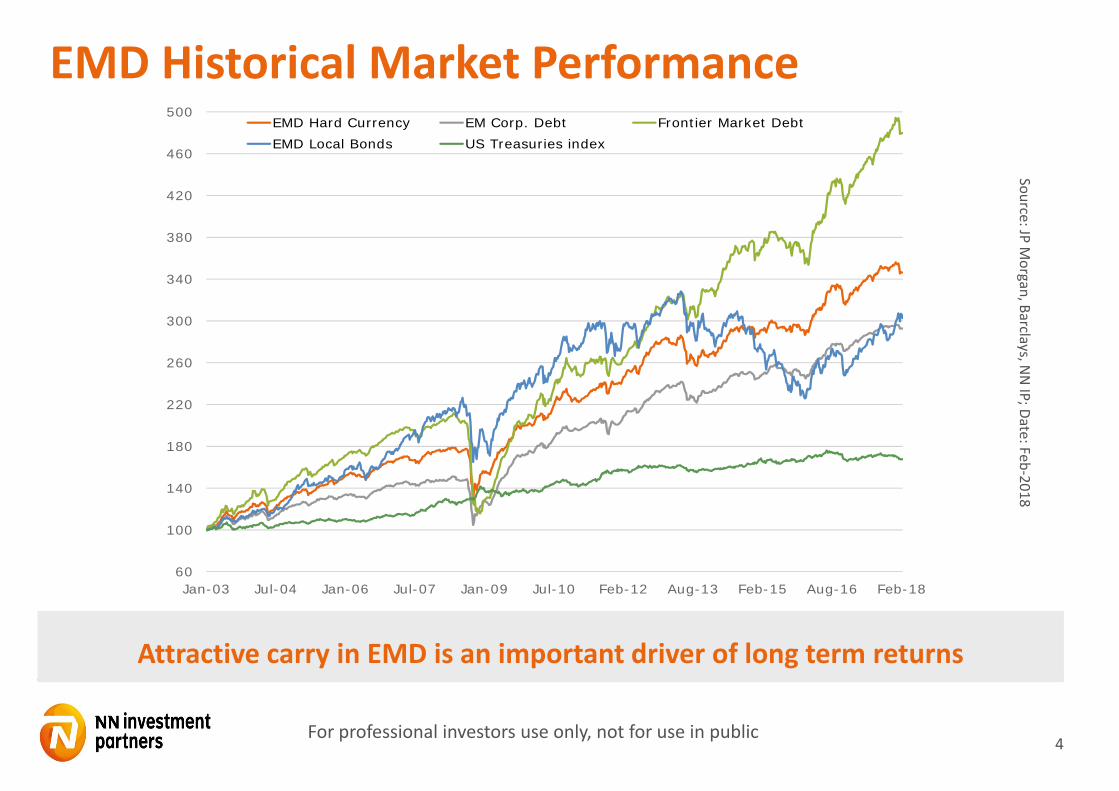
Jan-03 Jul-04 Jan-06 Jul-07 Jan-09 Jul-10 Feb-12 Aug-13 Feb-15 Aug-16 Feb-18
EMD Hard Currency EM Corp. Debt Frontier Market DebtEMD Local Bonds US Treasuries index
Source: JP Morgan, Barclays, N
N IP; Date: Feb‐2018
EMD Historical Market Performance
Attractive carry in EMD is an important driver of long term returns

5For professional investors use only, not for use in public
Risk‐Return of EMD Sub‐asset Classes
In the long run, EMD shows favourable risk/return – compared to other asset classes
Sources: JP Morgan, Bloomberg, TR Eikon. Benchmarks used are Barclays US Treasury, JPM US IG Corporates, JPM US HY, JPM ELMI+, JPM EMBI Global Diversified, JPM CEMBI Diversified, JPM GBI‐EM Global Diversified, JPM NEXGEM, MSCI World , MSCI EAFE and MSCI Emerging Markets.
6For professional investors use only, not for use in public
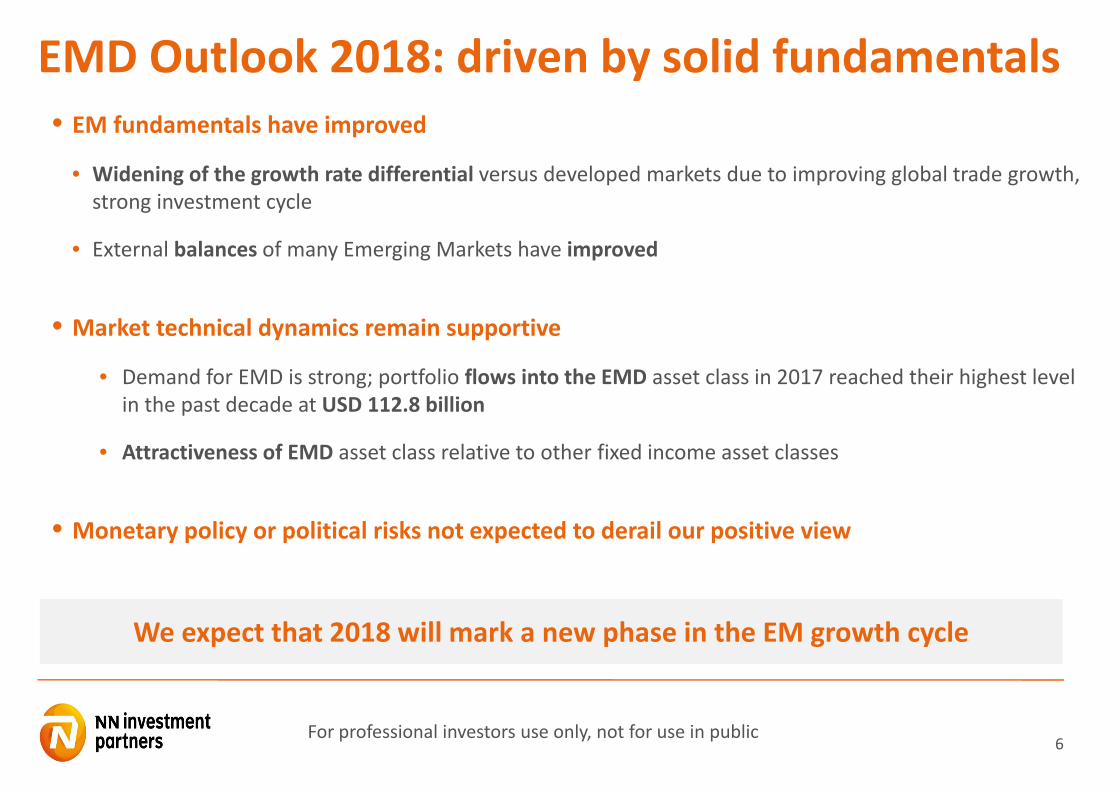
EMD Outlook 2018: driven by solid fundamentals• EM fundamentals have improved
• Widening of the growth rate differential versus developed markets due to improving global trade growth, strong investment cycle
• External balances of many Emerging Markets have improved
• Market technical dynamics remain supportive
• Demand for EMD is strong; portfolio flows into the EMD asset class in 2017 reached their highest level in the past decade at USD 112.8 billion
• Attractiveness of EMD asset class relative to other fixed income asset classes
• Monetary policy or political risks not expected to derail our positive view
We expect that 2018 will mark a new phase in the EM growth cycle

7For professional investors use only, not for use in public
EM fundamentalsIMF expects EM average growth +4.9% (vs +1.6% for G7) over next 3 years
Widening of the growth rate differential versus developed markets with positive contributions from EM domestic demand, investment and net exports
-4
-2
0
2
4
6
8
10
1980 1984 1988 1992 1996 2000 2004 2008 2012 2016 2020
GDP growth rates
Major advanced economies (G7) Emerging MarketsGrowth differential
8For professional investors use only, not for use in public
-1.0
0.0
1.0
2.0
3.0
4.0
5.0
6.0
7.0
8.0
9.0
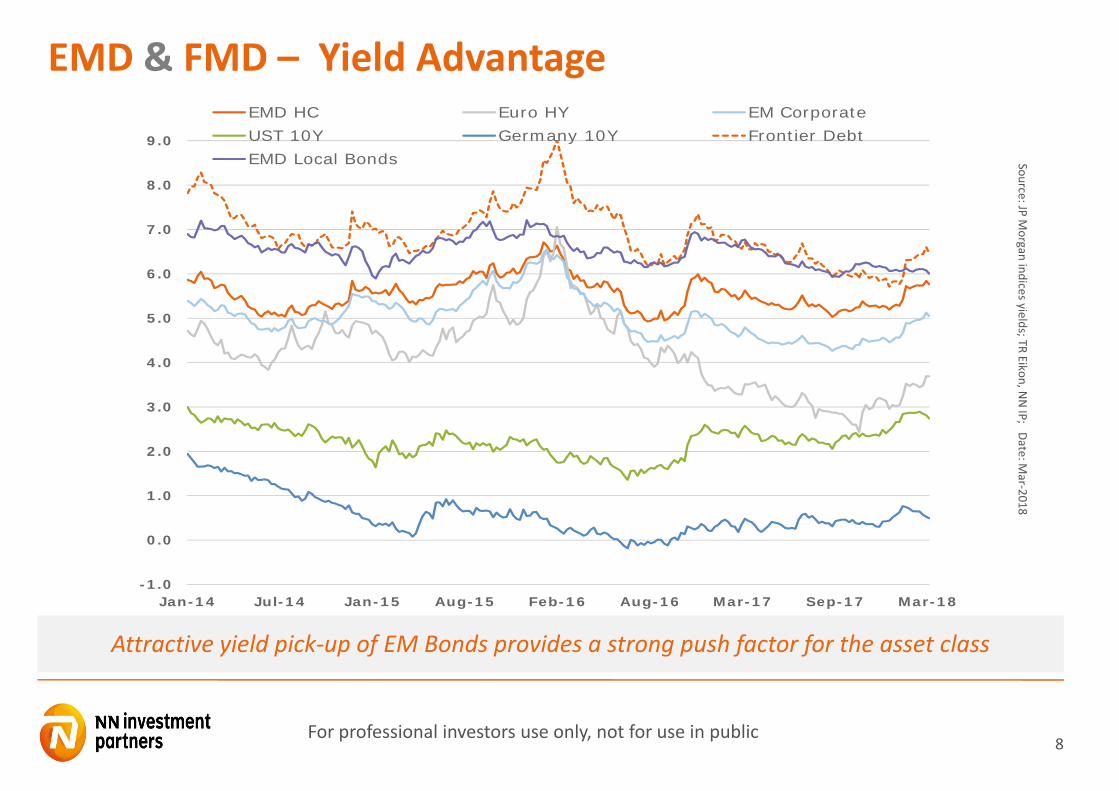
Jan-14 Jul-14 Jan-15 Aug-15 Feb-16 Aug-16 Mar-17 Sep-17 Mar-18
EMD HC Euro HY EM CorporateUST 10Y Germany 10Y Frontier DebtEMD Local Bonds Source: JP M
organ indices yields; TR Eikon, NN IP; Date: M
ar‐2018
EMD & FMD – Yield Advantage
Attractive yield pick‐up of EM Bonds provides a strong push factor for the asset class
9For professional investors use only, not for use in public
The Case for NN IP Emerging Market Debt
• Long and strong track record: A true pioneer in EMD investing
• Proven multi site approach
• Full range of EMD capabilities
• Structured, research driven investment process
• Integrated risk management
• Strong performance results

10
Investment Services
Roy ScheepeSr. Client Portfolio Manager
Girish PatilSr. Portfolio Specialist EMD
Joyce TanPortfolio Specialist Asian Debt
Multi‐Asset
21 professionals
EM Corp. + Asian HC
Joep HuntjensLead PM
Exp. since 1996(SG)
Luis Olguin, CFAPM (USA)
Annemieke ColdeweijerPM (NL)
EM Hard Currency
Marco Ruijer, CFALead PM
Exp. since 1998(USA)
Jared Lou, CFAPM (USA)
Leo Hu, CFAPM (SG)
Yvette BabbPM (NL)
Thai Le PM (NL)
Nora Szokol, CFAPM (NL)
EM Local Currency
Lewis Jones, CFA, FRMLead PM
Exp. since 2004(USA)
Daniel WoodPM (NL)
Yvette BabbPM (NL)
Johnny Chen, CFAPM (SG)
Annika WongImplementation
(NL)
EMD Blended
Marcelo Assalin, CFALead PM
Exp. since 1996(NL)
Global Credit
40 professionals
Global Fixed Income
9 professionals
Global Trading
18 professionals
Emerging Market Debt Team20 Investment Professionals with 13 yrs. average experience
Marcelo Assalin, CFAHead EMD
Experience since 1996
EMD Corporate Analysts
Mariana Villalba, CFA Zoia Korepanova Wee Lee Cheng
(NL) (NL) (SG)
Shilpa Singhal, CFA Vacancy Filled Clement Chong(SG) (SG) (SG)
GILT Oversight
Han Rijken
experience since 1992
11For professional investors use only, not for use in public
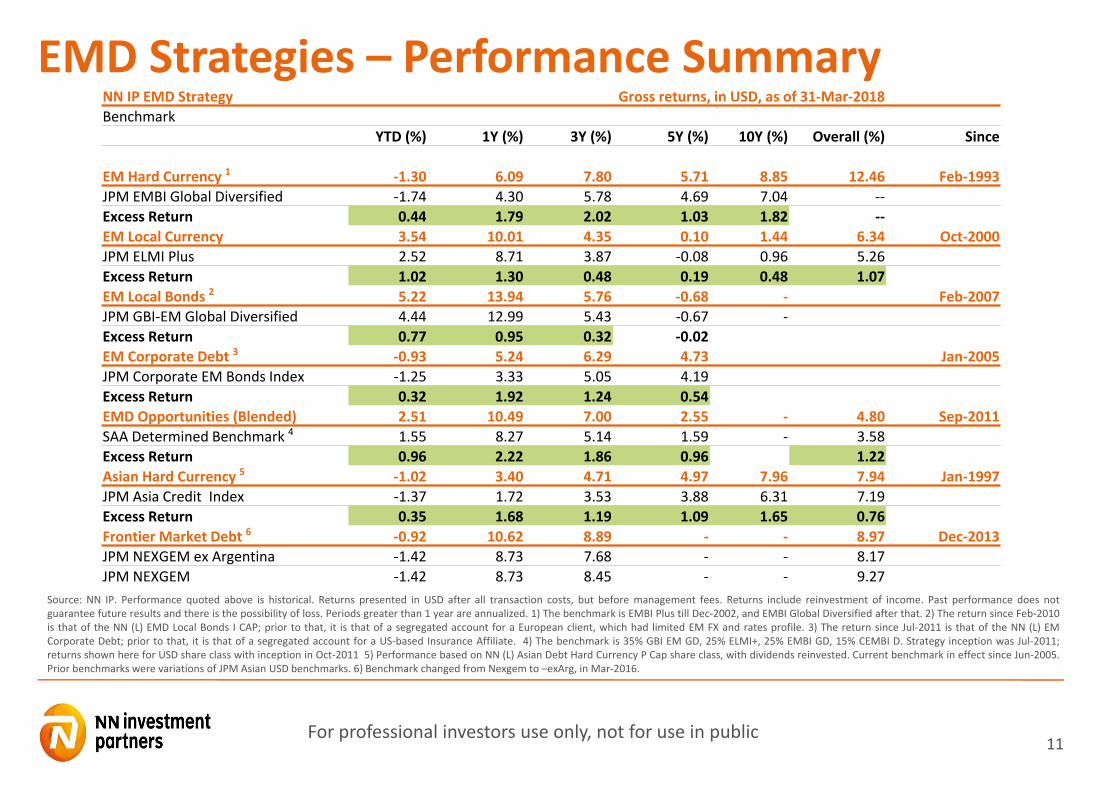
EMD Strategies – Performance Summary
Source: NN IP. Performance quoted above is historical. Returns presented in USD after all transaction costs, but before management fees. Returns include reinvestment of income. Past performance does notguarantee future results and there is the possibility of loss. Periods greater than 1 year are annualized. 1) The benchmark is EMBI Plus till Dec‐2002, and EMBI Global Diversified after that. 2) The return since Feb‐2010is that of the NN (L) EMD Local Bonds I CAP; prior to that, it is that of a segregated account for a European client, which had limited EM FX and rates profile. 3) The return since Jul‐2011 is that of the NN (L) EMCorporate Debt; prior to that, it is that of a segregated account for a US‐based Insurance Affiliate. 4) The benchmark is 35% GBI EM GD, 25% ELMI+, 25% EMBI GD, 15% CEMBI D. Strategy inception was Jul‐2011;returns shown here for USD share class with inception in Oct‐2011 5) Performance based on NN (L) Asian Debt Hard Currency P Cap share class, with dividends reinvested. Current benchmark in effect since Jun‐2005.Prior benchmarks were variations of JPM Asian USD benchmarks. 6) Benchmark changed from Nexgem to –exArg, in Mar‐2016.
NN IP EMD Strategy Gross returns, in USD, as of 31‐Mar‐2018Benchmark
YTD (%) 1Y (%) 3Y (%) 5Y (%) 10Y (%) Overall (%) Since
EM Hard Currency 1 ‐1.30 6.09 7.80 5.71 8.85 12.46 Feb‐1993JPM EMBI Global Diversified ‐1.74 4.30 5.78 4.69 7.04 ‐‐Excess Return 0.44 1.79 2.02 1.03 1.82 ‐‐EM Local Currency 3.54 10.01 4.35 0.10 1.44 6.34 Oct‐2000JPM ELMI Plus 2.52 8.71 3.87 ‐0.08 0.96 5.26Excess Return 1.02 1.30 0.48 0.19 0.48 1.07EM Local Bonds 2 5.22 13.94 5.76 ‐0.68 ‐ Feb‐2007JPM GBI‐EM Global Diversified 4.44 12.99 5.43 ‐0.67 ‐Excess Return 0.77 0.95 0.32 ‐0.02EM Corporate Debt 3 ‐0.93 5.24 6.29 4.73 Jan‐2005JPM Corporate EM Bonds Index ‐1.25 3.33 5.05 4.19Excess Return 0.32 1.92 1.24 0.54EMD Opportunities (Blended) 2.51 10.49 7.00 2.55 ‐ 4.80 Sep‐2011SAA Determined Benchmark 4 1.55 8.27 5.14 1.59 ‐ 3.58Excess Return 0.96 2.22 1.86 0.96 1.22Asian Hard Currency 5 ‐1.02 3.40 4.71 4.97 7.96 7.94 Jan‐1997JPM Asia Credit Index ‐1.37 1.72 3.53 3.88 6.31 7.19Excess Return 0.35 1.68 1.19 1.09 1.65 0.76Frontier Market Debt 6 ‐0.92 10.62 8.89 ‐ ‐ 8.97 Dec‐2013JPM NEXGEM ex Argentina ‐1.42 8.73 7.68 ‐ ‐ 8.17JPM NEXGEM ‐1.42 8.73 8.45 ‐ ‐ 9.27

12For professional investors use only, not for use in public
25 years investing in EMD
1. Multilateral organizations like IMF/World Bank instrumental in driving structural and
institutional reform in Emerging Markets over the last 25 years
2. Do not underestimate geopolitics
3. Market volatility can create investment opportunities
4. In the end, political pragmatism prevails
5. ESG is an important factor in determining how well a country prepares for the challenges
of the future
Key observations

13For professional investors use only, not for use in public
ESG Integration in EM Sovereign Debt investment process
• Proprietary sovereign rating model to assess the creditworthiness of EM sovereign issuers
• ESG factors determine how well a country prepares for the challenges of the future
• Macroeconomic and ESG factors are an integral part of our analysts scorecards.
• ESG scoring model produces quarterly scores for each of the (over 70) EM countries.
• Consistent ranking methodology across countries
• Political Process, Financial and Economic Strength, Competitiveness and Sovereign Risk Scores

14For professional investors use only, not for use in public
NN EMD: 25 years young and still learning
• NN EMD Hard Currency Fund celebrated 25 years anniversary in Feb 2018
• Since inception a total gross return of 1697% vs 811% (benchmark)
• AuM of USD 5.2 bln
• Invests in over 71 countries
Key take aways
Data as of end of Feb 2018

15For professional investors use only, not for use in public
NN (L) EMD Hard CurrencyHistorical Performance
0
200
400
600
800
1,000
1,200
1,400
1,600
1,800 Fund Benchmark
Source NN IP; date as of 31 Dec 2017Ratings: Morningstar overall rating, I CAP USD, at 31 Jan 2018

16For professional investors use only, not for use in public
25 years of EMD: Regional split
From a primarily LatAM focus in 1993, the asset class has become truly global
00
10
20
30
40
50
60
70
80
90
100
Dec-93 Dec-05 Dec-17
Africa Asia LatAm MidEast Europe
Historical Development
17For professional investors use only, not for use in public
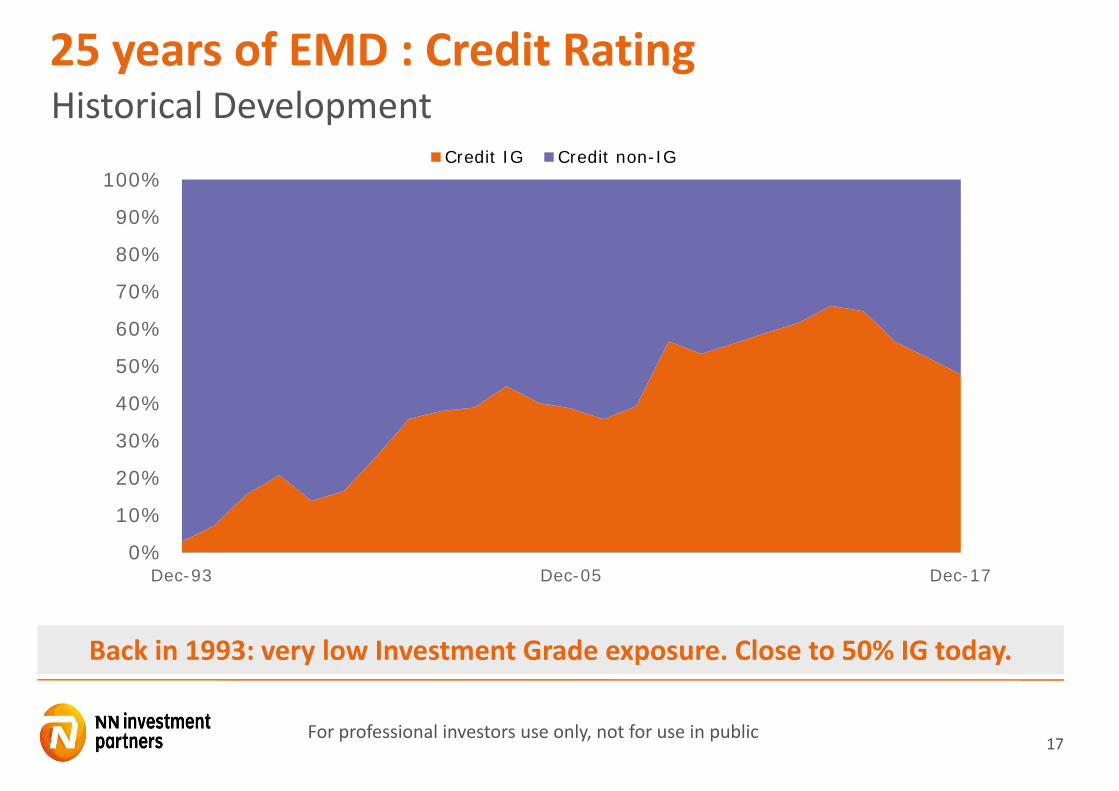
25 years of EMD : Credit Rating
Back in 1993: very low Investment Grade exposure. Close to 50% IG today.
0%
10%
20%
30%
40%
50%
60%
70%
80%
90%
100%
Dec-93 Dec-05 Dec-17
Credit IG Credit non-IG
Historical Development
18For professional investors use only, not for use in public
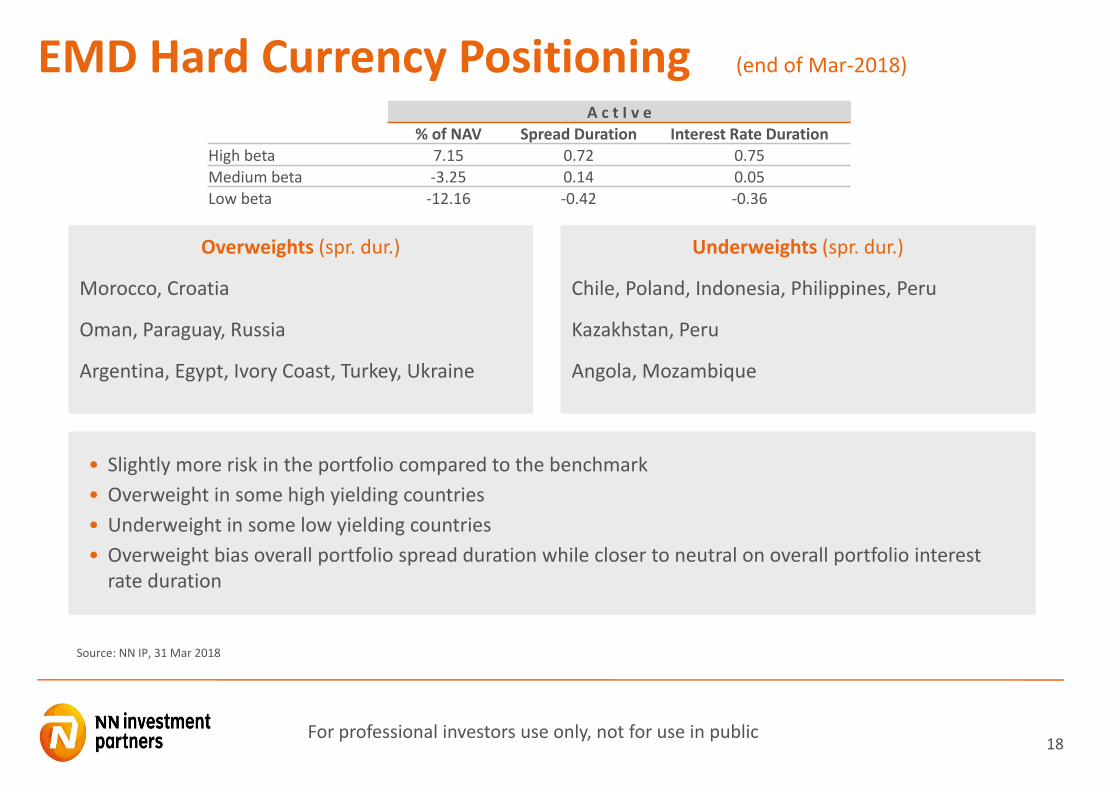
EMD Hard Currency Positioning (end of Mar‐2018)
Overweights (spr. dur.)
Morocco, Croatia
Oman, Paraguay, Russia
Argentina, Egypt, Ivory Coast, Turkey, Ukraine
Underweights (spr. dur.)
Chile, Poland, Indonesia, Philippines, Peru
Kazakhstan, Peru
Angola, Mozambique
• Slightly more risk in the portfolio compared to the benchmark• Overweight in some high yielding countries• Underweight in some low yielding countries• Overweight bias overall portfolio spread duration while closer to neutral on overall portfolio interest rate duration
A c t I v e% of NAV Spread Duration Interest Rate Duration
High beta 7.15 0.72 0.75Medium beta ‐3.25 0.14 0.05Low beta ‐12.16 ‐0.42 ‐0.36
Source: NN IP, 31 Mar 2018
19For professional investors use only, not for use in public
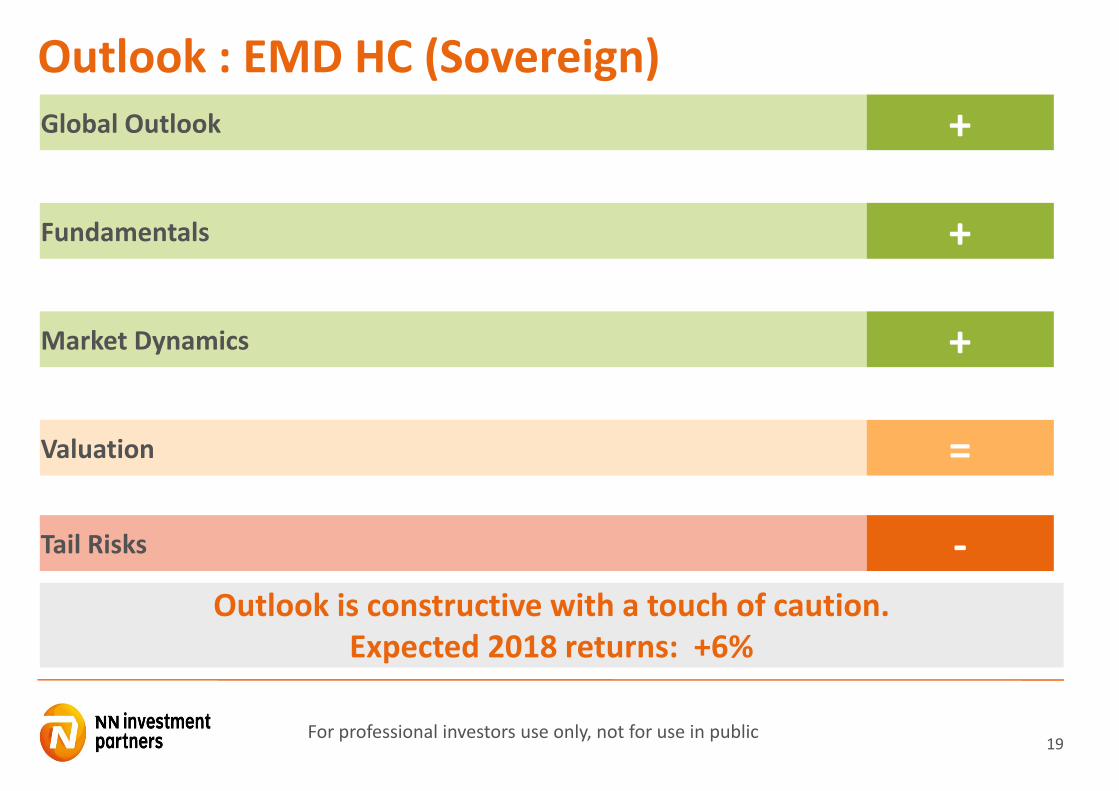
Outlook : EMD HC (Sovereign)Global Outlook +
Fundamentals +
Market Dynamics +
Valuation =
Tail Risks ‐Outlook is constructive with a touch of caution.
Expected 2018 returns: +6%

20
NN Frontier Markets Debt
Opportunity for the future
21For professional investors use only, not for use in public
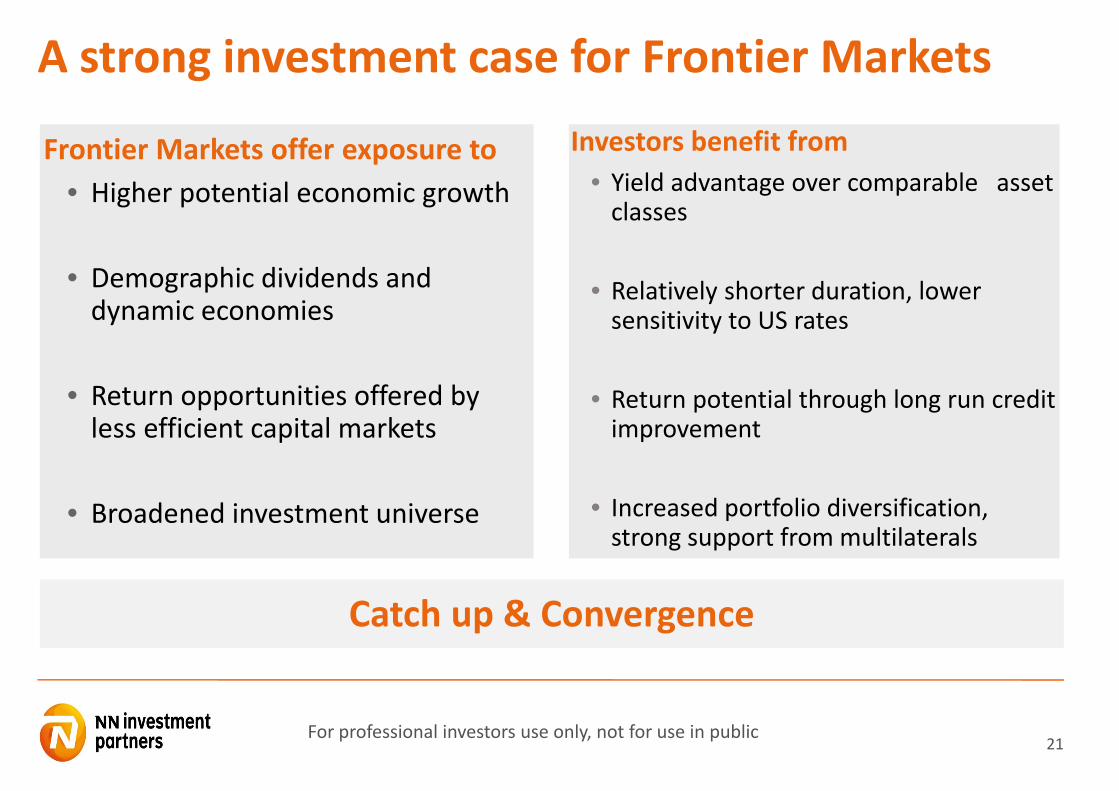
A strong investment case for Frontier Markets
Frontier Markets offer exposure to• Higher potential economic growth
• Demographic dividends and dynamic economies
• Return opportunities offered by less efficient capital markets
• Broadened investment universe
Catch up & Convergence
Investors benefit from• Yield advantage over comparable asset classes
• Relatively shorter duration, lower sensitivity to US rates
• Return potential through long run credit improvement
• Increased portfolio diversification, strong support from multilaterals

22For professional investors use only, not for use in public
Strong GDP Growth Forecasts for Frontier Markets
00
01
02
03
04
05
06
DM World EM and FM
%Average growth over next two years - IMF projections

23For professional investors use only, not for use in public
But, Risks are Contained
77% of frontier market countries are under either IMF, OBOR or both.
IMF and One Belt One Road (“OBOR”) are the key mitigating factors
EgyptSri Lanka
Paraguay
IraqNigeria
Cameron
Senegal
Gabon
Honduras
Georgia
TajikistanBelarus
Ecuador
Ethiopia
Angola
Bolivia
Azerbaijan
Pakistan
Vietnam
Armenia
Tunisia
GhanaJordan
Mongolia
Jamaica
Ivory Coast
KenyaOBORIMF
Maldives
El Salvador
Suriname
Guatemala
Zambia
Namibia
Costa Rica
Mozambique
Belize

24
Why EMD Short Duration (HC) now?
25For professional investors use only, not for use in public
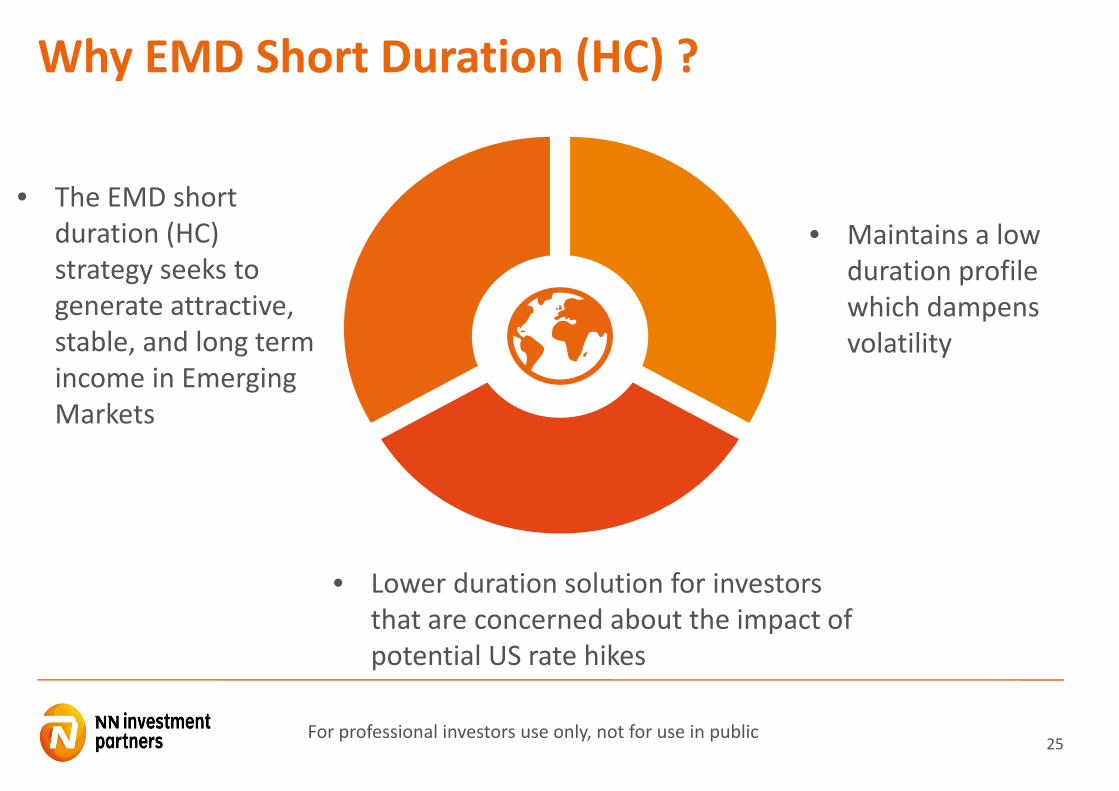
Why EMD Short Duration (HC) ?
• The EMD short duration (HC) strategy seeks to generate attractive, stable, and long term income in Emerging Markets
• Maintains a low duration profile which dampens volatility
• Lower duration solution for investors that are concerned about the impact of potential US rate hikes

26
The EMD Short Duration Strategy seeks to generate stable, and long term income in Emerging Markets
The strategy is especially appealing in periods of rising interest rates
Low duration profile dampens volatility
The fund invests in Sovereign and Corporate bonds from Emerging Market issuers and have an average Investment Grade rating
Investment process applies the same methodology as NN EMD Hard Currency Sovereign and Corporate strategies
NN Emerging Market Short Duration HCKey objectives and benefits
27
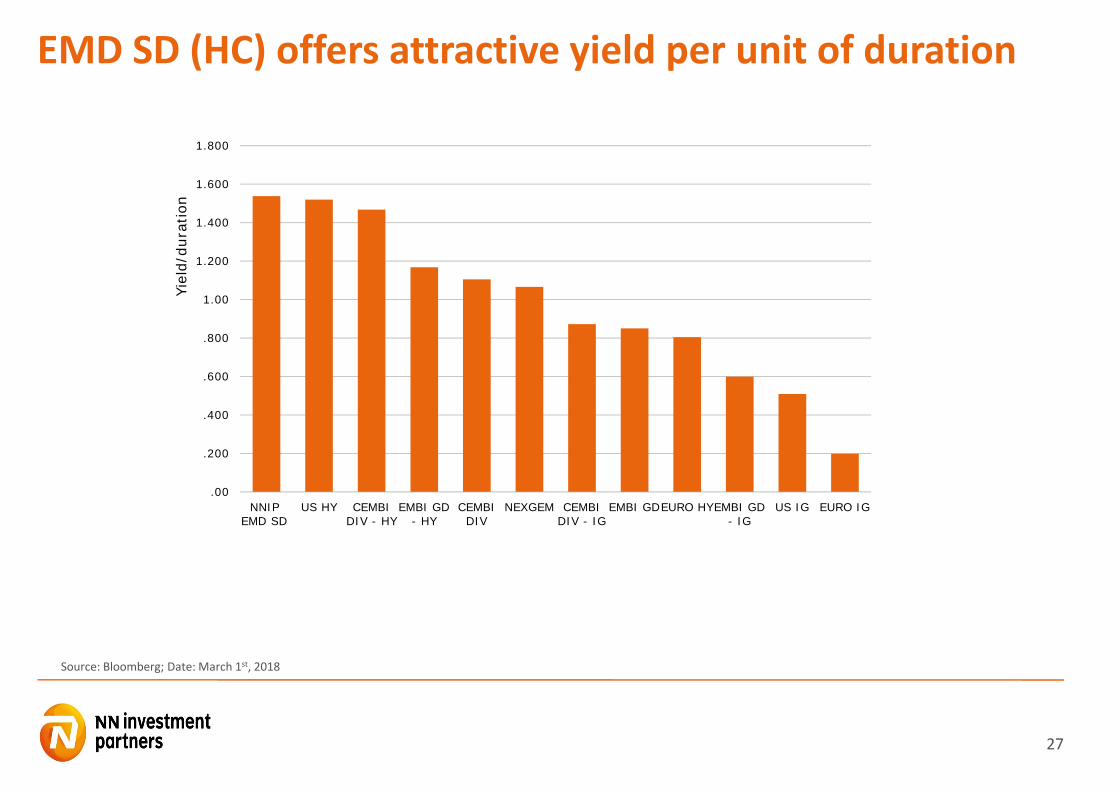
Source: Bloomberg; Date: March 1st, 2018
EMD SD (HC) offers attractive yield per unit of duration
.00
.200
.400
.600
.800
1.00
1.200
1.400
1.600
1.800
NNIPEMD SD
US HY CEMBIDIV - HY
EMBI GD- HY
CEMBIDIV
NEXGEM CEMBIDIV - IG
EMBI GDEURO HYEMBI GD- IG
US IG EURO IG
Yiel
d/du
ratio
n

28
NN Emerging Market Short Duration HC
RatingsWeighted average rating BBB‐Individual lines bonds B‐ or higher
MaturityMax 5 year maturity on bond levelWeighted Average Duration 2.7 yrs
Hard Currency Universe Taking advantage of both sovereign and corporate exposure:• Corporate 34.3%• Quasi 35.6%• Sovereign/sub‐sov 28.1%• Supra 2.0%
Issues124 issues across 41 countriesAverage portfolio yield 3.8%
Regional allocationUniverse regional allocation:Asia Pacific 25.6%Europe 35.2%LatAM 37.2%Supra 2.0%
29For professional investors use only, not for use in public
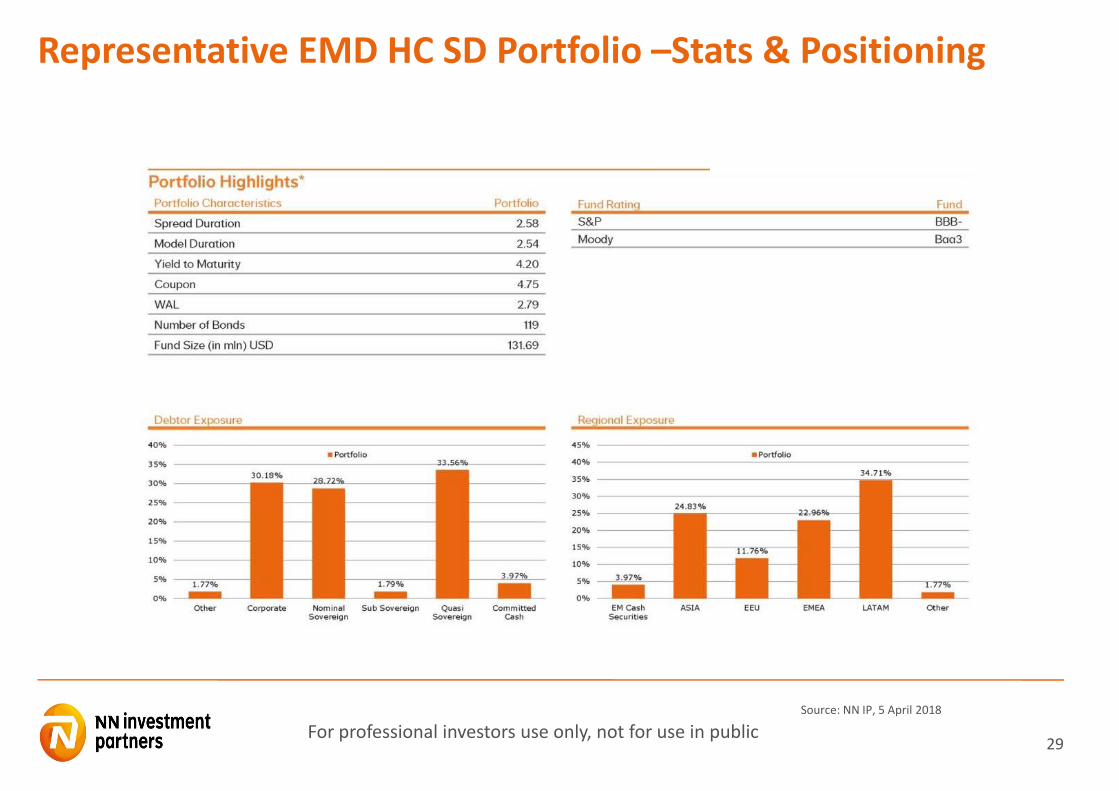
Representative EMD HC SD Portfolio –Stats & Positioning
Source: NN IP, 5 April 2018
30For professional investors use only, not for use in public
Summary
• A true pioneer in EMD investing with comprehensive strategy/funds offering
• Dedicated global EMD team located across 3 regional investment centers
• Good long term performance results across strategies
• AuM of about USD 10.4 billion in global EMD (as of March‐2018)

31For professional investors use only, not for use in public
Contact Details
Please visit our website www.nnip.com for more in detail information on NN Investment Partners and our products.
Or contact our local Sales representative:
ANA GASCA+ 34 91 769 41 02

32For professional investors use only, not for use in public
DisclaimerThe information contained in this document is provided as a service to professional investors and is only intended for professional investors as defined in your jurisdiction. The information should neither be regarded as an offer nor a solicitation to buy, sell or otherwise deal with any investment referred to herein nor as investment advice and is not intended for distribution to, or use by, any person in any country (including the United States) where the investment funds and services referred to are not authorized or registered for distribution or in which the dissemination of information on the funds or services is forbidden. It is the reader’s responsibility to comply with the laws and regulations of any applicable law.
Notice to residents of PortugalNN Investment Partners Holdings N.V. is duly passported into Portugal to provide certain investment services in such jurisdiction on a cross‐border basis and is registered for such purposes with the Portuguese Securities Market Commission (Comissão do Mercado de Valores Mobiliários, the “CMVM”) and is therefore authorised to conduct the marketing (comercialização) of funds in Portugal. The CMVM has received a passporting notification under Directive 2009/65/EC of the European Parliament and of the Council and the Commission Regulation (EU) 584/2010 enabling the fund to be distributed to the public in Portugal.Past performance is not indicative of future results. The value of investments and the return of the investments may undergo positive and negative fluctuations. Some funds may make use of leverage facilities, derivatives or invest up to 100% of their total net assets in unlisted securities, possibly deriving from so‐called developing (emerging) countries. This can involve specific risks of which investors should be aware, among which risks related to political and economic stability, currency exchange rates as well as applicable foreign taxes and accounting standards. Any other products or securities that are mentioned on this website have their own particular terms and conditions, which also should be consulted before entering into any transaction.
For more detailed information about the investment fund mentioned in this document, we refer to the prospectus and the corresponding supplements. In relation to the investment funds mentioned in this document, a Key Investor Information Document has been published containing all necessary information about the products, the costs and risks which may occur. Do not take unnecessary risks. Read the Key Investor Information Document. The prospectus, supplements and the Key Investor Information Document are available on the following website www.nnip.com.
The content of this document is based upon sources of information believed to be reliable. However, no guarantee, warranty or representation, express or implied, is given as to the accuracy or completeness of the information herein; and neither NN Investment Partners Holdings N.V., nor any other company or unit belonging to the NN Group, nor any of its officers, directors or employees accept any liability or responsibility in respect to any such information. Any information given in this document may be subject to change without notice.
The content of this document is owned or licensed by NN Investment Partners Holdings N.V. or its third‐party providers and is protected by applicable copyrights, trademarks, and/or other intellectual property rights. The content is only meant for personal, non‐commercial use and may not be multiplied and/or distributed in any manner.
This disclaimer and any claims arising out of or in connection with the terms and conditions of this disclaimer are governed by Dutch law.
Recommended