Copyright 2016, Kinsale Trading LLC. All Rights Reserved. www.sevensreport.com
October 20, 2016
Equities
Market Recap
Stocks rallied for a second straight day thanks to higher
oil, although the gains were modest and stocks finished
off their best levels of the day. The S&P 500 rose 022%.
Stocks were flat initially Wednesday as Chinese econom-
ic data largely met expectations (which isn’t a negative,
but not exactly a positive, either, given current market
valuations). Earnings continued to roll in and there were
some more decent beats, especially from the banks, but
overall the results aren’t materially changing anyone’s
outlook on the markets (it’s still way too early).
Stocks opened slightly lower but then rebounded and
were flat heading into the weekly oil inventory data.
That data was bullish (more on that later) and combined
with jawboning from the Saudi Oil minster crude oil shot
higher and pulled stocks up with it. The S&P 500 rallied
immediately following the inventory release and then
took a short pause for the close in Europe before rallying
throughout the afternoon.
Energy was the sector pulling the market higher and that
continued through oil’s close despite the fact that oil hit
its intraday high earlier in the morning. But with oil
closed, stocks gave back about half the day’s gains and
closed quietly.
Trading Color
The major indices all traded generally in line with one
another, but beneath the surface Wednesday for a sec-
ond straight day the rotation out of safety and into cycli-
cals was back on. Specifically, of the nine SPDRs we track
only three—utilities, healthcare and consumer staples—
Pre 7:00 Look
Futures and int’l shares are flat to slightly higher as the last
Presidential Debate and some overnight Fed comments are
digested ahead of the ECB Announcement this morning.
Economically, British Retail Sales was the latest data point
to disappoint (0.0% vs. E: 0.2%), as Brexit woes continue.
Econ Today: ECB Press Conference (8:30 a.m.), Jobless
Claims (E: 250K), Philly Fed Survey (7.0), Existing Home
Sales (E: 5.350M). Fed Speak: Dudley (8:30 a.m. ET)
Earnings Today: AAL ($1.68), VZ ($0.99), MSFT ($$0.68), BK
($0.81), TRV ($2.37).
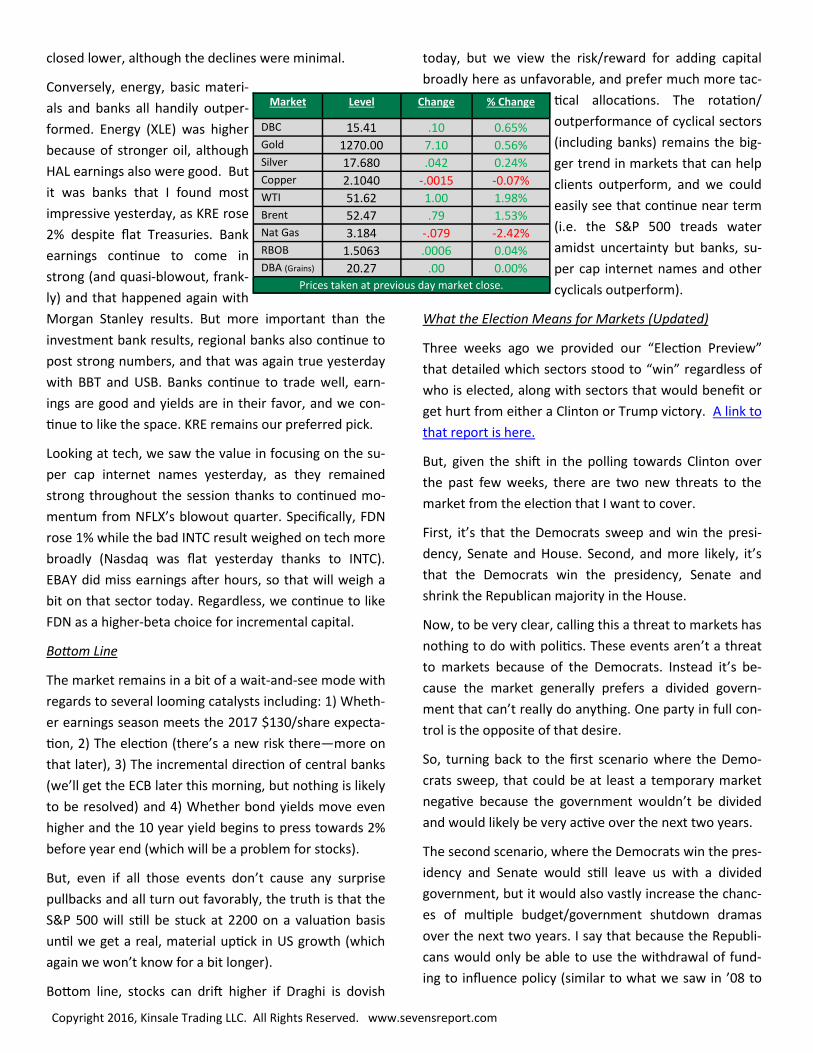
Regional Banks (KRE): Banks are closing in on 52 week
highs, and if banks can continue to rally that will help
support the broad market.
Market Level Change % Change
S&P 500 Futures 2140.25 2.25 0.11%
U.S. Dollar (DXY) 98.005 .065 0.07%
Gold 1270.80 .90 0.07%
WTI 51.28 -.54 -1.04%
10 Year 1.752 .003 0.17%
Market Level Change % Change
Dow 18,202.62 40.68 0.22% TSX 14,840.49 88.24 0.60% Stoxx 50 3,065.34 9.40 0.31% FTSE 7,015.54 -6.38 -0.09% Nikkei 17,235.50 236.59 1.39% Hang Seng 23,374.40 69.43 0.30% ASX 5,442.14 6.78 0.12%
Prices taken at previous day market close.
Copyright 2016, Kinsale Trading LLC. All Rights Reserved. www.sevensreport.com
closed lower, although the declines were minimal.
Conversely, energy, basic materi-
als and banks all handily outper-
formed. Energy (XLE) was higher
because of stronger oil, although
HAL earnings also were good. But
it was banks that I found most
impressive yesterday, as KRE rose
2% despite flat Treasuries. Bank
earnings continue to come in
strong (and quasi-blowout, frank-
ly) and that happened again with
Morgan Stanley results. But more important than the
investment bank results, regional banks also continue to
post strong numbers, and that was again true yesterday
with BBT and USB. Banks continue to trade well, earn-
ings are good and yields are in their favor, and we con-
tinue to like the space. KRE remains our preferred pick.
Looking at tech, we saw the value in focusing on the su-
per cap internet names yesterday, as they remained
strong throughout the session thanks to continued mo-
mentum from NFLX’s blowout quarter. Specifically, FDN
rose 1% while the bad INTC result weighed on tech more
broadly (Nasdaq was flat yesterday thanks to INTC).
EBAY did miss earnings after hours, so that will weigh a
bit on that sector today. Regardless, we continue to like
FDN as a higher-beta choice for incremental capital.
Bottom Line
The market remains in a bit of a wait-and-see mode with
regards to several looming catalysts including: 1) Wheth-
er earnings season meets the 2017 $130/share expecta-
tion, 2) The election (there’s a new risk there—more on
that later), 3) The incremental direction of central banks
(we’ll get the ECB later this morning, but nothing is likely
to be resolved) and 4) Whether bond yields move even
higher and the 10 year yield begins to press towards 2%
before year end (which will be a problem for stocks).
But, even if all those events don’t cause any surprise
pullbacks and all turn out favorably, the truth is that the
S&P 500 will still be stuck at 2200 on a valuation basis
until we get a real, material uptick in US growth (which
again we won’t know for a bit longer).
Bottom line, stocks can drift higher if Draghi is dovish
today, but we view the risk/reward for adding capital
broadly here as unfavorable, and prefer much more tac-
tical allocations. The rotation/
outperformance of cyclical sectors
(including banks) remains the big-
ger trend in markets that can help
clients outperform, and we could
easily see that continue near term
(i.e. the S&P 500 treads water
amidst uncertainty but banks, su-
per cap internet names and other
cyclicals outperform).
What the Election Means for Markets (Updated)
Three weeks ago we provided our “Election Preview”
that detailed which sectors stood to “win” regardless of
who is elected, along with sectors that would benefit or
get hurt from either a Clinton or Trump victory. A link to
that report is here.
But, given the shift in the polling towards Clinton over
the past few weeks, there are two new threats to the
market from the election that I want to cover.
First, it’s that the Democrats sweep and win the presi-
dency, Senate and House. Second, and more likely, it’s
that the Democrats win the presidency, Senate and
shrink the Republican majority in the House.
Now, to be very clear, calling this a threat to markets has
nothing to do with politics. These events aren’t a threat
to markets because of the Democrats. Instead it’s be-
cause the market generally prefers a divided govern-
ment that can’t really do anything. One party in full con-
trol is the opposite of that desire.
So, turning back to the first scenario where the Demo-
crats sweep, that could be at least a temporary market
negative because the government wouldn’t be divided
and would likely be very active over the next two years.
The second scenario, where the Democrats win the pres-
idency and Senate would still leave us with a divided
government, but it would also vastly increase the chanc-
es of multiple budget/government shutdown dramas
over the next two years. I say that because the Republi-
cans would only be able to use the withdrawal of fund-
ing to influence policy (similar to what we saw in ’08 to
Market Level Change % Change
DBC 15.41 .10 0.65% Gold 1270.00 7.10 0.56% Silver 17.680 .042 0.24%
Copper 2.1040 -.0015 -0.07% WTI 51.62 1.00 1.98% Brent 52.47 .79 1.53% Nat Gas 3.184 -.079 -2.42% RBOB 1.5063 .0006 0.04% DBA (Grains) 20.27 .00 0.00%
Prices taken at previous day market close.
Copyright 2016, Kinsale Trading LLC. All Rights Reserved. www.sevensreport.com
’12). And, to that point, current government funding is
due to expire December 9th, so if this is the outcome of
the election, that date will all of a sudden become more
important.
Either way, because of the recent shift in the polls, the
election now is a potential headwind for stocks.
Economics
Housing Starts
September Housing Starts dropped to 1.047M (saar)
vs. (E) 1.180M (saar)
Takeaway
This number was actually much better than the weak
headline implied, as single family housing starts, which is
the important subset of this number because it gives a
read into the residential/single family housing market,
rose 8.1% in September. But the headline was dragged
down by a 38% (!) drop in multi-family housing starts.
So, again, from a residential housing standpoint, this was
a good number.
And, the permits portion of the report also signaled fur-
ther strength (permits lead housing starts by about three
-six months). Single family permits rose 0.4% in Septem-
ber, implying steady starts into year end. Bottom line,
this headline was shockingly bad, but from a single-
family housing market standpoint (which again is most
important to markets) the numbers were good, and a
welcome break on the trend of soft housing data.
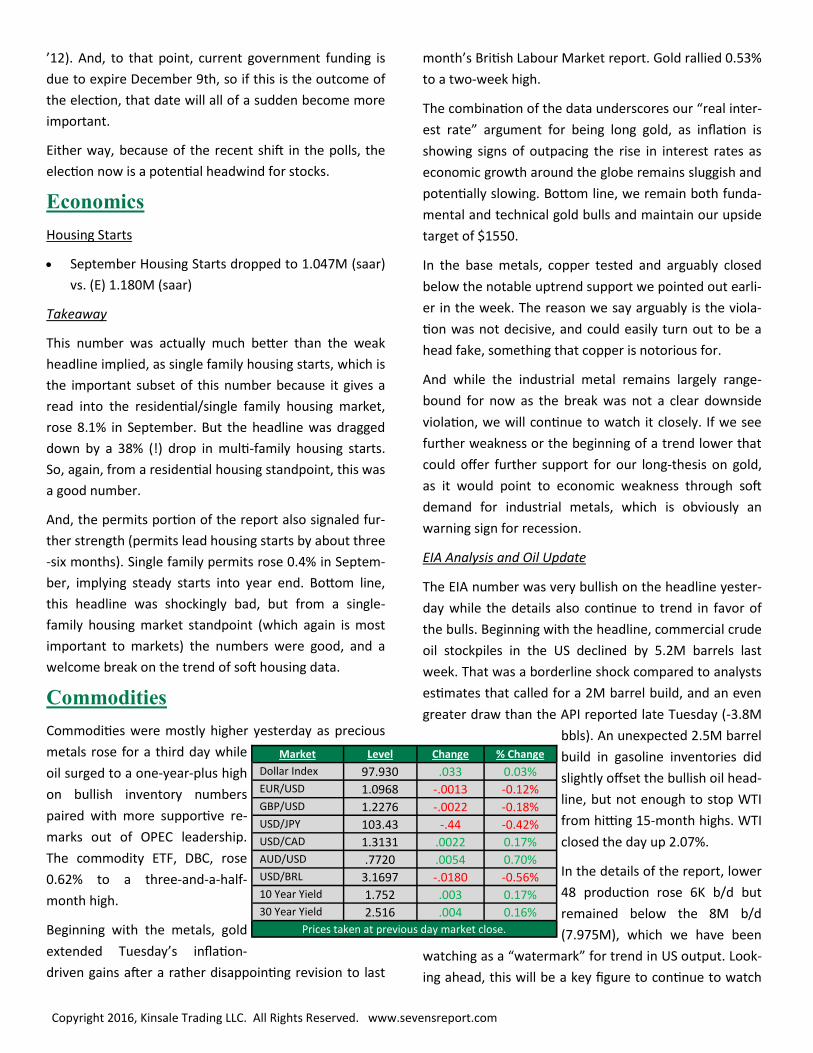
Commodities
Commodities were mostly higher yesterday as precious
metals rose for a third day while
oil surged to a one-year-plus high
on bullish inventory numbers
paired with more supportive re-
marks out of OPEC leadership.
The commodity ETF, DBC, rose
0.62% to a three-and-a-half-
month high.
Beginning with the metals, gold
extended Tuesday’s inflation-
driven gains after a rather disappointing revision to last
month’s British Labour Market report. Gold rallied 0.53%
to a two-week high.
The combination of the data underscores our “real inter-
est rate” argument for being long gold, as inflation is
showing signs of outpacing the rise in interest rates as
economic growth around the globe remains sluggish and
potentially slowing. Bottom line, we remain both funda-
mental and technical gold bulls and maintain our upside
target of $1550.
In the base metals, copper tested and arguably closed
below the notable uptrend support we pointed out earli-
er in the week. The reason we say arguably is the viola-
tion was not decisive, and could easily turn out to be a
head fake, something that copper is notorious for.
And while the industrial metal remains largely range-
bound for now as the break was not a clear downside
violation, we will continue to watch it closely. If we see
further weakness or the beginning of a trend lower that
could offer further support for our long-thesis on gold,
as it would point to economic weakness through soft
demand for industrial metals, which is obviously an
warning sign for recession.
EIA Analysis and Oil Update
The EIA number was very bullish on the headline yester-
day while the details also continue to trend in favor of
the bulls. Beginning with the headline, commercial crude
oil stockpiles in the US declined by 5.2M barrels last
week. That was a borderline shock compared to analysts
estimates that called for a 2M barrel build, and an even
greater draw than the API reported late Tuesday (-3.8M
bbls). An unexpected 2.5M barrel
build in gasoline inventories did
slightly offset the bullish oil head-
line, but not enough to stop WTI
from hitting 15-month highs. WTI
closed the day up 2.07%.
In the details of the report, lower
48 production rose 6K b/d but
remained below the 8M b/d
(7.975M), which we have been
watching as a “watermark” for trend in US output. Look-
ing ahead, this will be a key figure to continue to watch
Market Level Change % Change
Dollar Index 97.930 .033 0.03% EUR/USD 1.0968 -.0013 -0.12%
GBP/USD 1.2276 -.0022 -0.18% USD/JPY 103.43 -.44 -0.42% USD/CAD 1.3131 .0022 0.17% AUD/USD .7720 .0054 0.70% USD/BRL 3.1697 -.0180 -0.56% 10 Year Yield 1.752 .003 0.17% 30 Year Yield 2.516 .004 0.16%
Prices taken at previous day market close.
Copyright 2016, Kinsale Trading LLC. All Rights Reserved. www.sevensreport.com
as further declines could support a further move higher
in prices while a reversal back above 8M barrels a day
would have an equal and opposite effect.
Outside the data, Saudi Oil Minister Khalid al-Falih con-
tinued to jawbone support for the recent speculative
rally, as he said he believes that markets have seen the
worst of the price plunge of recent years and that funda-
mentals were improving as supply and demand were
rebalancing. And while the renewed decline in US pro-
duction is mildly supportive of prices, the fact that the
rest of the world is pumping at full throttle and the only
policy to prevent global producers from producing more
in the coming months is an “understanding to agree”
that came from last month’s meeting in Algiers.
Bottom line, oil is still solidly trending higher and anyone
who knows technical analysis will tell you not to fight the
trend. And while the sizeable supply draws of recent;
declining imports, and slipping output in the US all seem
supportive, the long-term outlook for oil is not overly
bullish considering there is still no firm policy in place to
control global production. Moreover, output is hovering
at or near record highs outside of the US, and at some
point high enough prices will bring US producers back
into the market as they tap into their DUC (drilled but
uncompleted) wells. Unless OPEC actually agrees, that
means more supply out of the US, and that would be a
bearish development as it would delay rebalancing the
supply/demand imbalance.
Bottom Line
The several notable developments in the commodities
market of recent; rallying oil prices, signs of weakness in
the copper market, and a bullish uptrend developing in
gold are collectively not very optimistic signals for the
global economy or risk assets in general. Oil potentially
breaking back towards $60/barrel will have an inflation-
ary impact while copper breaking down flashes a warn-
ing sign of global recession.
And while there are a ton of takeaways for other asset
classes, those two developments are both supportive of
the rally in gold over the medium term, as they support
the argument that inflation will likely outpace a rise in
interest rates.
Currencies & Bonds
It was another quiet day in the currency and bond mar-
kets as there was no market-moving economic data and
everyone was looking ahead to the ECB meeting this
morning. The Dollar Index was basically unchanged.
The only real mover in the currency markets yesterday
was the Aussie, which rallied 0.70% on the in-line Chi-
nese economic data, which caused further short cover-
ing. But while the rally was decent and the Aussie is back
up towards the upper end of the mid-to-high .70s trad-
ing range, the bottom line is that the near-term direction
policy for the Reserve Bank of Australia is lower, and we
may see that in November if the September inflation
reading, released in a few weeks, misses expectations.
I’d rather be a seller of Aussie with a stop at the recent
high (.7818) than a buyer.
Elsewhere in currencies it was quiet. As mentioned, the
Dollar Index was flat as there wasn’t any important Fed
speak, and Housing Starts didn’t move markets. The eu-
ro also was flat, as expected, ahead of the ECB. Looking
at the euro, watch 1.0976 and 1.0947. Those are the two
recent low ticks, and if they are broken on Draghi being
surprisingly dovish then we could see an acceleration
lower in the euro (which will push the Dollar Index
through 98, and that could be a headwind on stocks).
The pound, yen and loonie were all little changed (there
was a Bank of Canada rate announcement, but no
change was made, as expected).
Turning to bonds, the 30-year Treasury closed yesterday
unchanged and the 10-year yield didn’t even move one
basis point, as global bond markets were on hold ahead
of the ECB meeting today. The 10-year yield remains
comfortably in the middle of the 1.70% - 1.80% trading
range, and unless we get a dovish or hawkish shock from
the ECB, things will stay that way near term.
Have a good day,
Tom
Copyright 2016, Kinsale Trading LLC. All Rights Reserved. www.sevensreport.com
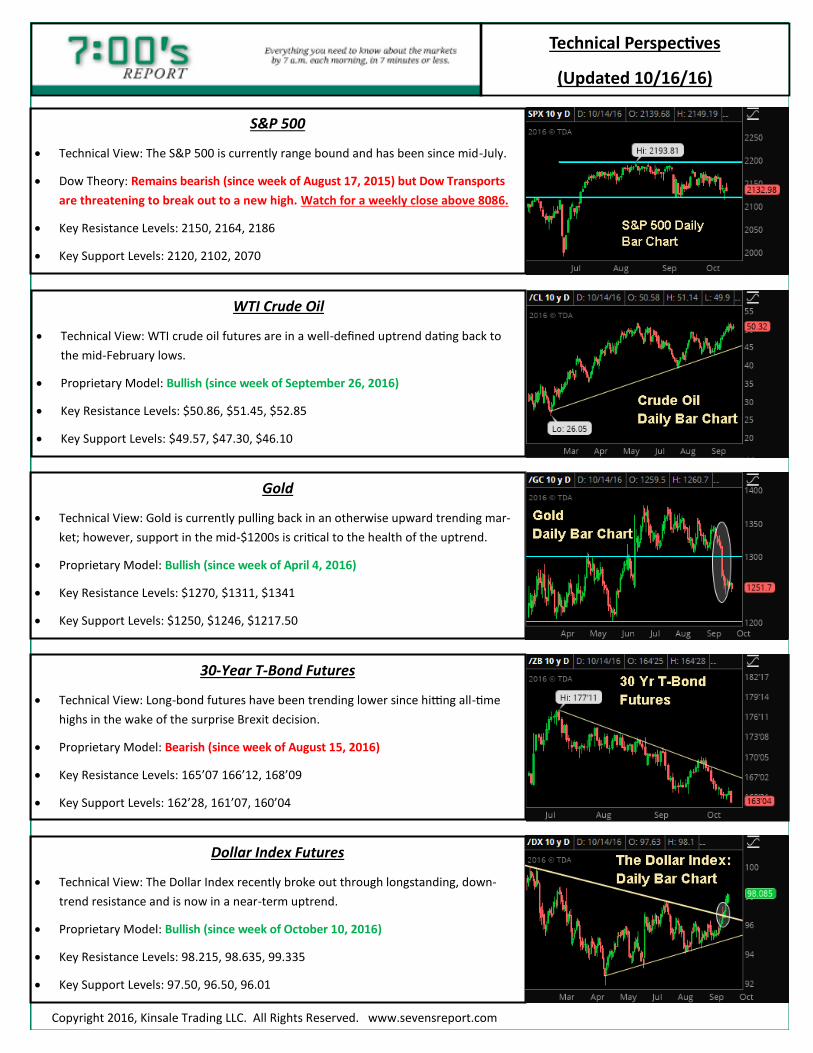
Technical Perspectives
(Updated 10/16/16)
S&P 500
Technical View: The S&P 500 is currently range bound and has been since mid-July.
Dow Theory: Remains bearish (since week of August 17, 2015) but Dow Transports
are threatening to break out to a new high. Watch for a weekly close above 8086.
Key Resistance Levels: 2150, 2164, 2186
Key Support Levels: 2120, 2102, 2070
WTI Crude Oil
Technical View: WTI crude oil futures are in a well-defined uptrend dating back to
the mid-February lows.
Proprietary Model: Bullish (since week of September 26, 2016)
Key Resistance Levels: $50.86, $51.45, $52.85
Key Support Levels: $49.57, $47.30, $46.10
Gold
Technical View: Gold is currently pulling back in an otherwise upward trending mar-
ket; however, support in the mid-$1200s is critical to the health of the uptrend.
Proprietary Model: Bullish (since week of April 4, 2016)
Key Resistance Levels: $1270, $1311, $1341
Key Support Levels: $1250, $1246, $1217.50
30-Year T-Bond Futures
Technical View: Long-bond futures have been trending lower since hitting all-time
highs in the wake of the surprise Brexit decision.
Proprietary Model: Bearish (since week of August 15, 2016)
Key Resistance Levels: 165’07 166’12, 168’09
Key Support Levels: 162’28, 161’07, 160’04
Dollar Index Futures
Technical View: The Dollar Index recently broke out through longstanding, down-
trend resistance and is now in a near-term uptrend.
Proprietary Model: Bullish (since week of October 10, 2016)
Key Resistance Levels: 98.215, 98.635, 99.335
Key Support Levels: 97.50, 96.50, 96.01

Copyright 2016, Kinsale Trading LLC. All Rights Reserved. www.sevensreport.com
Disclaimer: The 7:00’s Report is protected by federal and international copyright laws. Kinsale Trading, LLC is the publisher of the newsletter and owner of all
rights therein, and retains property rights to the newsletter. The Newsletter may not be forwarded, copied, downloaded, stored in a retrieval system or oth-
erwise reproduced or used in any form or by any means without express written permission from Kinsale Trading LLC. The information contained in the
7:00’s Report is not necessarily complete and its accuracy is not guaranteed. Neither the information contained in The 7:00’s Report or any opinion expressed
in The 7:00’s Report constitutes a solicitation for the purchase of any future or security referred to in the Newsletter. The Newsletter is strictly an informa-
tional publication and does not provide individual, customized investment or trading advice to its subscribers. SUBSCRIBERS SHOULD VERIFY ALL CLAIMS
AND COMPLETE THEIR OWN RESEARCH AND CONSULT A REGISTERED FINANCIAL PROFESSIONAL BEFORE INVESTING IN ANY INVESTMENTS MENTIONED IN
THE PUBLICATION. INVESTING IN SECURITIES, OPTIONS AND FUTURES IS SPECULATIVE AND CARRIES A HIGH DEGREE OF RISK, AND SUBSCRIBERS MAY LOSE
MONEY TRADING AND INVESTING IN SUCH INVESTMENTS.
Fundamental Market View (Updated 10/16/16)
Near-Term General US Stock Market Outlook
This is designed to provide a snapshot of our near-term (1 month) outlook for stocks. For general equity market ex-posure, we use a mix of SPHB (S&P 500 High Beta) and SPLV (S&P 500 Low Volatility) to create an aggressive, neu-
tral or defensive stance on general equity market exposure.
Near Term Stock Market
Outlook:
Defensive SPHB: 25% SPLV: 75%
Stocks dropped 1% last week as soft Chinese economic data combined with a
strong US dollar to pressure markets. Going forward, higher bond yields and a
higher dollar will continue to create a headwind on stocks, and we remain cautious
on markets broadly given a lack of any real, positive near-term catalysts.
Tactical Allocation Ideas:
What’s Outperforming: Defensive Sectors (XLU/XLP, FXG), Short Duration TIPS ETF (VTIP), Super Cap Internet/Social Media Stocks (AMZN, FB, GOOGL, LNKD, FDN is a good internet ETF). Top Contrarian Idea (if you are a bull: Banks KRE).
What’s Underperforming: Europe (HEDJ/VGK), Retail (XRT), Tech (AAPL related supply chain), Healthcare (especially special-ty pharma and biotech stocks), Small Caps.
Long Term Fundamental Outlook for Other Asset Classes
Fundamental
Outlook Market Intelligence
Commodities Neutral
Commodities continued to rally last week, driven higher by energy. Notably, commodities rallied de-
spite the stronger US dollar, although if the dollar continues to surge towards par that will become a
headwind. Bigger picture, in the near term, worries about supply are helping push energy commodi-
ties higher. Longer term, the supply/demand outlook is not particularly favorable. Gold, meanwhile,
sits near multi-month lows; however, inflation is firm and that will support gold prices.
US Dollar Neutral
The Dollar Index rose to an eight-month high last week as markets continue to price in the reality of
marginally more hawkish policy from the Fed. The dollar rally came despite any real dollar positive
events or catalysts, and instead is just markets acknowledging the massive (and widening) gulf be-
tween incremental Fed policy (tighter) and other central banks (stable to easier).
Treasuries Bearish
Treasury yields were little changed last week, but that’s notable in so much as Treasuries didn’t rise/
yields fall despite the drop in stocks. That again reinforces our opinion that the near-term trend for
bonds is lower. Rising yields are a steady and growing headwind on stocks, and if the 10-year yield
moves through 1.80% and towards 2.00% that will begin to pressure equities.
This page is meant to provide a general outlook for the path of each major asset class and is updated at the start of each week.
Recommended