
© OCR 2016 H081/02 Turn over [601/8665/3] DC (…) R10052/12
Oxford Cambridge and RSA
AS Level Geography H081/02 Geographical debates Sample Question Paper
Date – Morning/Afternoon Time allowed: 1 hour 30 minutes
You must have:
• the Resource Booklet
• the OCR 12-page Answer Booklet
(OCR 12 sent with general stationary)
You may use:
• a ruler (cm/mm)
• a piece of string
• a scientific or graphical calculator
* 0 0 0 0 0 0 *
INSTRUCTIONS
• Use black ink. You may use an HB pencil for graphs and diagrams. • Section A: Choose one topic and answer all parts of the question in the topic.
• Section B – Synoptic questions: Choose one topic and answer all parts of the question in
the topic. You must use your knowledge and understanding from across the course of
study to answer these questions.
• Section C: Choose one topic and answer one question in the topic.
• Write your answer to each question in the Answer Booklet.
• Additional paper may be used if required but you must clearly show your candidate number, centre number and question number(s).
• Do not write in the bar codes. • The separate Resource Booklet will be found inside this document.
INFORMATION
• The total mark for this paper is 68. • The marks for each question are shown in brackets [ ].
• Quality of extended responses will be assessed in questions marked with an asterisk (*).
• This document consists of 12 pages.
SPECIMEN
© OCR 2016 H081/02
2
Section A
Choose one topic and answer all parts of the question in the topic.
Topic 2.1 Climate Change 1 (a) Explain how ice cores are used to reconstruct past climate.
[4]
(b) Suggest why one EDC’s greenhouse gas emissions have changed over time.
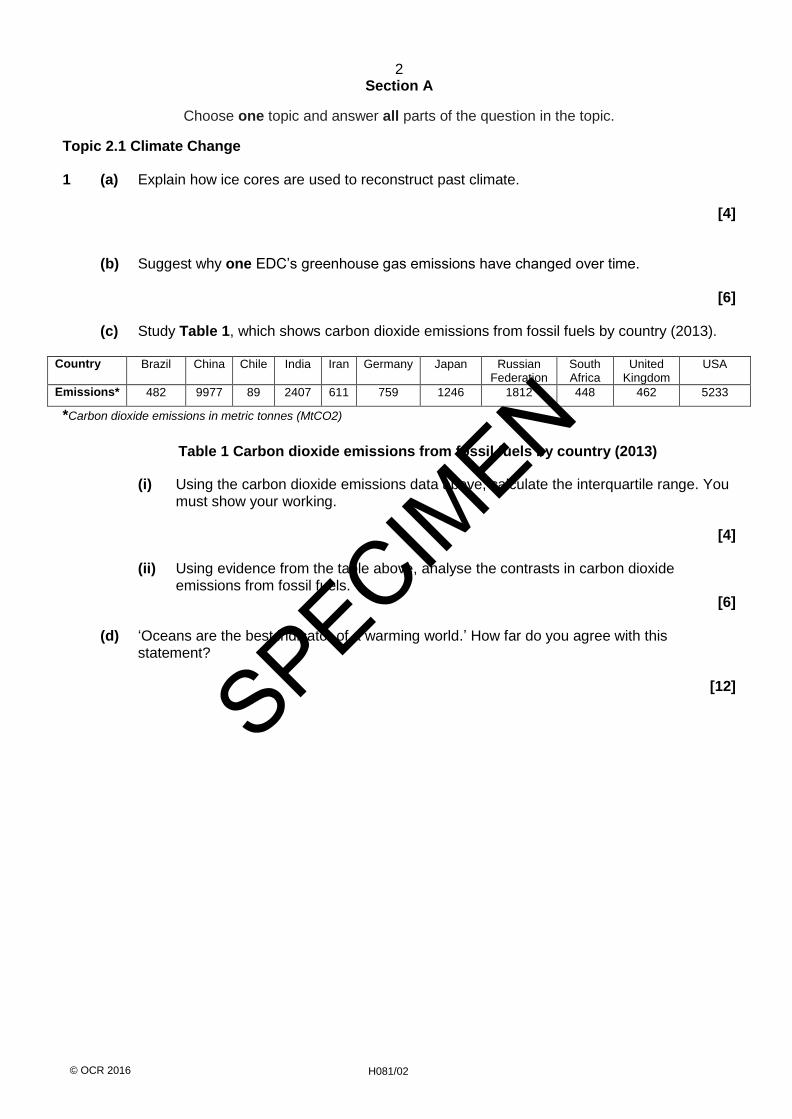
[6] (c) Study Table 1, which shows carbon dioxide emissions from fossil fuels by country (2013).
Country Brazil China Chile India Iran Germany Japan Russian Federation
South Africa
United Kingdom
USA
Emissions* 482 9977 89 2407 611 759 1246 1812 448 462 5233
*Carbon dioxide emissions in metric tonnes (MtCO2)
Table 1 Carbon dioxide emissions from fossil fuels by country (2013)
(i) Using the carbon dioxide emissions data above, calculate the interquartile range. You must show your working.
[4]
(ii) Using evidence from the table above, analyse the contrasts in carbon dioxide
emissions from fossil fuels. [6]
(d) ‘Oceans are the best indicator of a warming world.’ How far do you agree with this
statement?
[12]
SPECIMEN

© OCR 2016 H081/02
3
Turn over
Topic 2.2 Disease Dilemmas 2 (a) Explain disease diffusion using the Hägerstrand model.
[4]
(b) Suggest why one country experiencing air pollution has seen incidences of cancer change
over time.
[6]
(c) Study Table 2, which shows tuberculosis incidence for 2015 (in thousands).
Country Bangladesh Brazil China India Kenya South Africa
Thailand Uganda Tanzania Vietnam Zimbabwe
Incidence 360 90 930 2200 110 450 120 61 170 130 42
(WHO dataset 2015)
Table 2 Tuberculosis incidence for 2015 (in thousands)
(i) Using the tuberculosis incidence data above, calculate the interquartile range. You
must show your working.
[4]
(ii) Using evidence from the table above, analyse the contrasts in tuberculosis incidence.
[6]
(d) ‘Affluence is one of the main causes of noncommunicable disease.’ How far do you agree with this statement?
[12]
SPECIMEN

© OCR 2016 H081/02
4
Topic 2.3 Exploring Oceans
3 (a) Explain the vertical variations in ocean water salinity.
[4]
(b) Suggest why the management of one oil spill can be environmentally challenging.
[6]
(c) Study Table 3, which shows weight (lbs) of plastic collected during the 2013 ocean clean up
Country Argentina Australia Bangladesh Brazil Canada Egypt Germany India Japan Kuwait Malaysia
Weight of plastic
8,018
242
2,311
70,036
199,557
368
1,344
233,648
65,315
44
8,142
*Pounds (lbs) of plastic collected
Table 3 Weight (lbs) of plastic collected during the 2013 ocean clean up
(i) Using the weight of plastic data above, calculate the interquartile range. You must
show your working.
[4]
(ii) Using evidence from the table above, analyse the contrasts in weight of plastic collected.
[6]
(d) ‘Oceans present hazardous obstacles to human activities.’ How far do you agree with this
statement?
[12]
SPECIMEN
© OCR 2016 H081/02
5
Turn over
Topic 2.4 Future of Food
4 (a) Explain the physical conditions required for growing food.
[4]
(b) Suggest why one indigenous group’s food security can change over time.
[6]
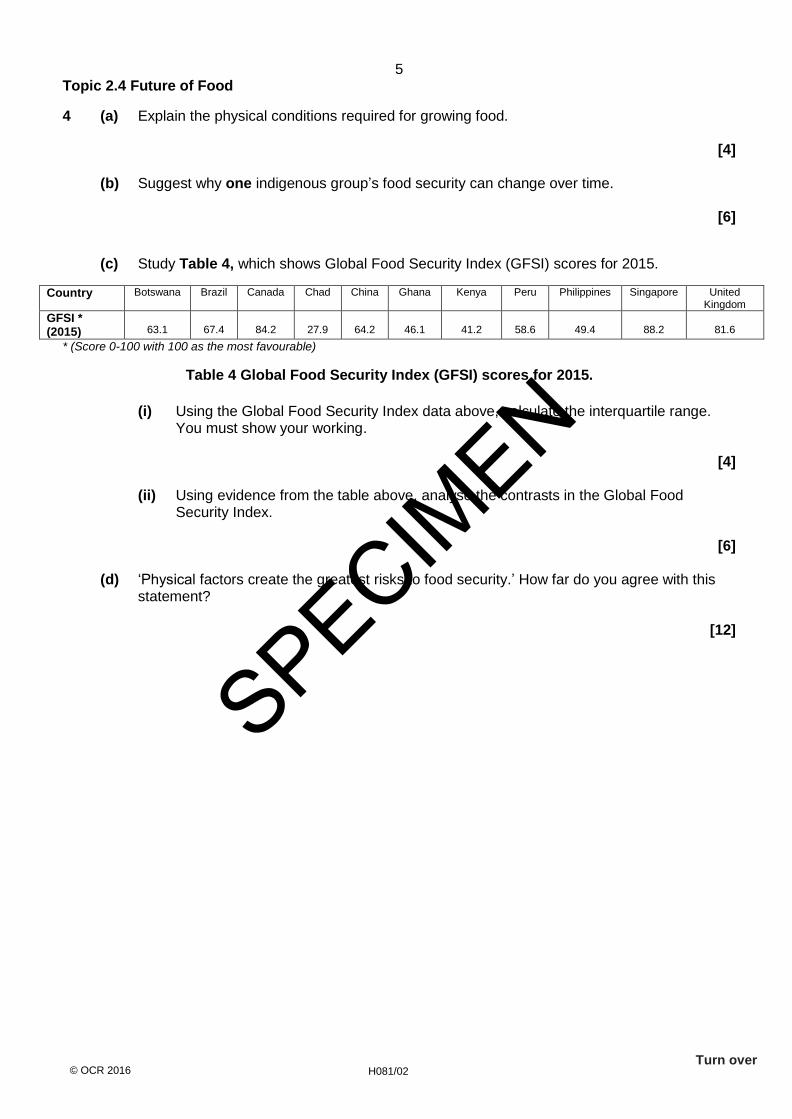
(c) Study Table 4, which shows Global Food Security Index (GFSI) scores for 2015.
Country Botswana Brazil Canada Chad China Ghana Kenya Peru Philippines Singapore United Kingdom
GFSI * (2015)
63.1
67.4
84.2
27.9
64.2
46.1
41.2
58.6
49.4
88.2
81.6
* (Score 0-100 with 100 as the most favourable)
Table 4 Global Food Security Index (GFSI) scores for 2015.
(i) Using the Global Food Security Index data above, calculate the interquartile range.
You must show your working.
[4]
(ii) Using evidence from the table above, analyse the contrasts in the Global Food Security Index.
[6]
(d) ‘Physical factors create the greatest risks to food security.’ How far do you agree with this
statement?
[12]
SPECIMEN

© OCR 2016 H081/02
6
Topic 2.5 Hazardous Earth
5 (a) Explain how fossil records can be used as evidence of continental drift and plate tectonics theory.
[4]
(b) Suggest why people experience varying impacts resulting from one volcanic eruption.
[6]
(c) Study Table 5, which shows sulphur dioxide gas emission rates for Kilauea volcano (East Rift Zone), Hawaii.
Year 2000 2001 2002 2003 2004 2005 2006 2007 2008 2009 2010
Gas emission rate *
1570 1580 1380 1420 1230 2240 2010 1660 2219 1131 504
*Daily average gas emission in metric tonne (1000kg)/year, USGS
Table 5 Sulphur dioxide gas emission rates for Kilauea volcano (East Rift Zone), Hawaii.
(i) Using the sulphur dioxide gas emissions data above, calculate the interquartile range. You must show your working.
[4]
(ii) Using evidence from the table above, analyse the contrasts in the sulphur dioxide gas
emission rates.
[6]
(d) ‘People have to live in tectonically active locations.’ How far do you agree with this statement?
[12]
SPECIMEN

© OCR 2016 H081/02
7
Turn over
Section B – Synoptic questions
Choose one topic and answer all parts of the question in the topic. You must use your
knowledge and understanding from across the course of study to answer these questions.
Topic 2.1 Climate Change
6 (a) With reference to Fig. 1, suggest how climate change influences geomorphic processes in landscape systems.
[8]
(b) Examine how climate change impacts human use of landscape systems.
[8]
Topic 2.2 Disease Dilemmas 7 (a) With reference to Fig. 2, suggest how responses to disease are influenced by landscape systems.
[8] (b) Examine how far the same physical factors influence disease outbreaks and landscape
systems.
[8]
Topic 2.3 Exploring Oceans
8 (a) With reference to Fig. 3, suggest how clean ocean waters influence a sense of place identity.
[8]
(b) Examine how living in an island community affects people’s perception of place.
[8]
Topic 2.4 Future of Food
9 (a) With reference to Fig. 4, suggest how the globalisation of the food industry influences place identity.
[8]
(b) Examine how food security can impact social inequality. [8]
Topic 2.5 Hazardous Earth
10 (a) With reference to Fig. 5, suggest how living in tectonically active areas influences place profiles.
[8]
(b) Examine how volcanic eruptions can influence people’s emotional attachment to a place.
[8]
SPECIMEN
© OCR 2016 H081/02
8
Section C
Choose one topic and answer one question in the topic.
Topic 2.1 Climate Change
11* ‘There is considerable doubt that the world has warmed steadily since the late nineteenth century.’ How far do you agree with this statement?
[20]
Or
12* Examine how successful international organisations have been in dealing with climate change.
[20]
Topic 2.2 Disease Dilemmas
13* Examine the view that communicable diseases are dealt with more successfully than noncommunicable diseases.
[20]
Or
14* Examine the extent to which technology can reduce threats from disease.
[20]
Topic 2.3 Exploring Oceans
15* Examine the extent to which oceanic waters are being altered by human activity.
[20]
Or
16* Assess the effectiveness of various stakeholders in the management of an oceanic resource.
[20]
SPECIMEN

© OCR 2016 H081/02
9
Topic 2.4 Future of Food
17* Examine the extent to which food security can impact on people’s lives.
[20]
Or
18* ‘Globalisation of the food industry creates more opportunities than issues.’ How far do you agree with this statement?
[20]
Topic 2.5 Hazardous Earth
19* ‘Environmental impacts of tectonic hazards are more significant than economic impacts.’ How far
do you agree with this statement?
[20]
Or
20* ‘Managing hazards in Advanced Countries (ACs) is more successful than any other area of the world.’ How far do you agree with this statement?
[20]
SPECIMEN
© OCR 2016 H081/02
10
BLANK PAGE
SPECIMEN

© OCR 2016 H081/02
11
BLANK PAGE
SPECIMEN

© OCR 2016 H081/02
12
Copyright Information:
OCR is committed to seeking permission to reproduce all third-party content that it uses in the assessment materials. OCR has attempted to
identify and contact all copyright holders whose work is used in this paper. To avoid the issue of disclosure of answer-related information to
candidates, all copyright acknowledgements are reproduced in the OCR Copyright Acknowledgements booklet. This is produced for each
series of examinations and is freely available to download from our public website (www.ocr.org.uk) after the live examination series.
If OCR has unwittingly failed to correctly acknowledge or clear any third-party content in this assessment material, OCR will be happy to correct
its mistake at the earliest possible opportunity.
For queries or further information please contact the Copyright Team, First Floor, 9 Hills Road, Cambridge CB2 1GE.
OCR is part of the Cambridge Assessment Group; Cambridge Assessment is the brand name of University of Cambridge Local Examinations
Syndicate (UCLES), which is itself a department of the University of Cambridge.
SPECIMEN

R10052/12
…day June 20XX – Morning/Afternoon
AS Level Geography
H081/02 Geographical debates
SAMPLE MARK SCHEME Duration: 1 hour 30 minutes
MAXIMUM MARK 68
DRAFT
This document consists of 88 pages
SPECIMEN
H081/02 Mark Scheme June 20xx
2
MARKING INSTRUCTIONS PREPARATION FOR MARKING
SCORIS
1. Make sure that you have accessed and completed the relevant training packages for on-screen marking: scoris assessor Online Training; OCR Essential Guide to Marking.
2. Make sure that you have read and understood the mark scheme and the question paper for this unit. These are posted on the RM Cambridge Assessment Support Portal http://www.rm.com/support/ca
3. Log-in to scoris and mark the required number of practice responses (“scripts”) and the required number of standardisation responses.
YOU MUST MARK 10 PRACTICE AND 10 STANDARDISATION RESPONSES BEFORE YOU CAN BE APPROVED TO MARK LIVE SCRIPTS.
TRADITIONAL
Before the Standardisation meeting you must mark at least 10 scripts from several centres. For this preliminary marking you should use pencil and
follow the mark scheme. Bring these marked scripts to the meeting.
MARKING
1. Mark strictly to the mark scheme.
2. Marks awarded must relate directly to the marking criteria.
3. The schedule of dates is very important. It is essential that you meet the scoris 50% and 100% (traditional 50% Batch 1 and 100% Batch 2) deadlines. If you experience problems, you must contact your Team Leader (Supervisor) without delay.
4. If you are in any doubt about applying the mark scheme, consult your Team Leader by telephone, email or via the scoris messaging system.
SPECIMEN
H081/02 Mark Scheme June 20xx
3
5. Work crossed out: a. where a candidate crosses out an answer and provides an alternative response, the crossed out response is not marked and gains no
marks b. if a candidate crosses out an answer to a whole question and makes no second attempt, and if the inclusion of the answer does not
cause a rubric infringement, the assessor should attempt to mark the crossed out answer and award marks appropriately. 6. Always check the pages (and additional objects if present) at the end of the response in case any answers have been continued there. If the
candidate has continued an answer there then add a tick to confirm that the work has been seen.
7. There is a NR (No Response) option. Award NR (No Response) - if there is nothing written at all in the answer space - OR if there is a comment which does not in any way relate to the question (e.g. ‘can’t do’, ‘don’t know’) - OR if there is a mark (e.g. a dash, a question mark) which isn’t an attempt at the question. Note: Award 0 marks – for an attempt that earns no credit (including copying out the question).
8. The scoris comments box is used by your Team Leader to explain the marking of the practice responses. Please refer to these comments when checking your practice responses. Do not use the comments box for any other reason. If you have any questions or comments for your Team Leader, use telephone, email or the scoris messaging system.
9. Assistant Examiners will send a brief report on the performance of candidates to their Team Leader (Supervisor) via email by the end of the marking period. The report should contain notes on particular strengths displayed as well as common errors or weaknesses. Constructive criticism of the question paper/mark scheme is also appreciated.
SPECIMEN

H081/02 Mark Scheme June 20xx
4
10. Annotations
Annotation Meaning
SPECIMEN

H081/02 Mark Scheme June 20xx
5
11. Subject-specific Marking Instructions
INTRODUCTION Your first task as an Examiner is to become thoroughly familiar with the material on which the examination depends. This material includes:
the specification, especially the assessment objectives
the question paper and its rubrics
the mark scheme.
You should ensure that you have copies of these materials. You should ensure also that you are familiar with the administrative procedures related to the marking process. These are set out in the OCR booklet Instructions for Examiners. If you are examining for the first time, please read carefully Appendix 5 Introduction to Script Marking: Notes for New Examiners. Please ask for help or guidance whenever you need it. Your first point of contact is your Team Leader.
SPECIMEN
H081/02 Mark Scheme June 20xx
6
USING THE MARK SCHEME
Please study this Mark Scheme carefully. The Mark Scheme is an integral part of the process that begins with the setting of the question paper and
ends with the awarding of grades. Question papers and Mark Schemes are developed in association with each other so that issues of
differentiation and positive achievement can be addressed from the very start.
This Mark Scheme is a working document; it is not exhaustive; it does not provide ‘correct’ answers. The Mark Scheme can only provide ‘best
guesses’ about how the question will work out, and it is subject to revision after we have looked at a wide range of scripts.
The Examiners’ Standardisation Meeting will ensure that the Mark Scheme covers the range of candidates’ responses to the questions, and that all
Examiners understand and apply the Mark Scheme in the same way. The Mark Scheme will be discussed and amended at the meeting, and
administrative procedures will be confirmed. Co-ordination scripts will be issued at the meeting to exemplify aspects of candidates’ responses and
achievements; the co-ordination scripts then become part of this Mark Scheme.
Before the Standardisation Meeting, you should read and mark in pencil a number of scripts, in order to gain an impression of the range of
responses and achievement that may be expected.
In your marking, you will encounter valid responses which are not covered by the Mark Scheme: these responses must be credited. You will
encounter answers which fall outside the ‘target range’ of Bands for the paper which you are marking. Please mark these answers according to the
marking criteria.
Please read carefully all the scripts in your allocation and make every effort to look positively for achievement throughout the ability range. Always
be prepared to use the full range of marks.
SPECIMEN

H081/02 Mark Scheme June 20xx
7
LEVELS OF RESPONSE QUESTIONS: The indicative content indicates the expected parameters for candidates’ answers, but be prepared to recognise and credit unexpected approaches where they show relevance. Using ‘best-fit’, decide first which set of level descriptors best describes the overall quality of the answer. Once the level is located, adjust the mark concentrating on features of the answer which make it stronger or weaker following the guidelines for refinement. Highest mark: If clear evidence of all the qualities in the level descriptors is shown, the HIGHEST Mark should be awarded.
Lowest mark: If the answer shows the candidate to be borderline (i.e. they have achieved all the qualities of the levels below and show limited evidence of meeting the criteria of the level in question) the LOWEST mark should be awarded.
Middle mark: This mark should be used for candidates who are secure in the level. They are not ‘borderline’ but they have only achieved some of the qualities in the level descriptors. Be prepared to use the full range of marks. Do not reserve (e.g.) highest level marks ‘in case’ something turns up of a quality you have not yet
seen. If an answer gives clear evidence of the qualities described in the level descriptors, reward appropriately.
Quality of extended response will be assessed in questions marked with an (*). Quality of extended response is not attributed to any single
assessment objective but instead is assessed against the entire response for the question.
SPECIMEN
H081/02 Mark Scheme June 20xx
8
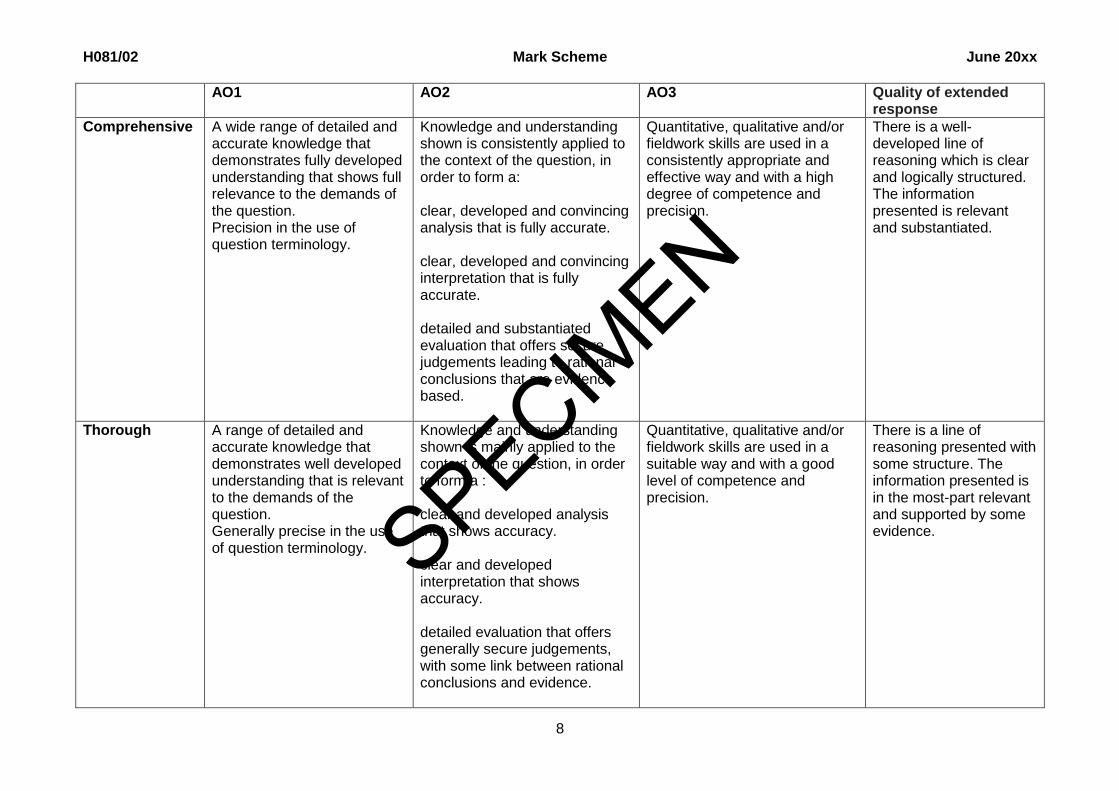
AO1 AO2 AO3 Quality of extended response
Comprehensive A wide range of detailed and accurate knowledge that demonstrates fully developed understanding that shows full relevance to the demands of the question. Precision in the use of question terminology.
Knowledge and understanding shown is consistently applied to the context of the question, in order to form a: clear, developed and convincing analysis that is fully accurate. clear, developed and convincing interpretation that is fully accurate. detailed and substantiated evaluation that offers secure judgements leading to rational conclusions that are evidence based.
Quantitative, qualitative and/or fieldwork skills are used in a consistently appropriate and effective way and with a high degree of competence and precision.
There is a well-developed line of reasoning which is clear and logically structured. The information presented is relevant and substantiated.
Thorough A range of detailed and accurate knowledge that demonstrates well developed understanding that is relevant to the demands of the question. Generally precise in the use of question terminology.
Knowledge and understanding shown is mainly applied to the context of the question, in order to form a : clear and developed analysis that shows accuracy. clear and developed interpretation that shows accuracy. detailed evaluation that offers generally secure judgements, with some link between rational conclusions and evidence.
Quantitative, qualitative and/or fieldwork skills are used in a suitable way and with a good level of competence and precision.
There is a line of reasoning presented with some structure. The information presented is in the most-part relevant and supported by some evidence. SPECIM
EN
H081/02 Mark Scheme June 20xx
9
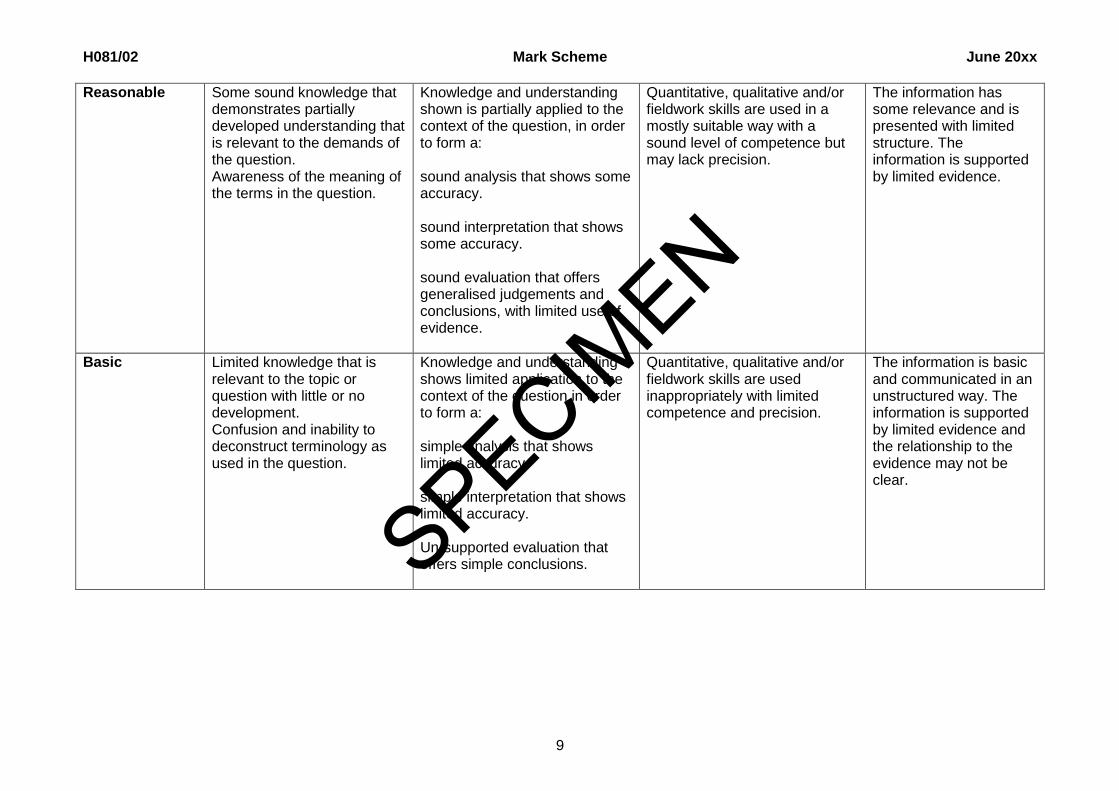
Reasonable Some sound knowledge that demonstrates partially developed understanding that is relevant to the demands of the question. Awareness of the meaning of the terms in the question.
Knowledge and understanding shown is partially applied to the context of the question, in order to form a: sound analysis that shows some accuracy. sound interpretation that shows some accuracy. sound evaluation that offers generalised judgements and conclusions, with limited use of evidence.
Quantitative, qualitative and/or fieldwork skills are used in a mostly suitable way with a sound level of competence but may lack precision.
The information has some relevance and is presented with limited structure. The information is supported by limited evidence.
Basic Limited knowledge that is relevant to the topic or question with little or no development. Confusion and inability to deconstruct terminology as used in the question.
Knowledge and understanding shows limited application to the context of the question in order to form a: simple analysis that shows limited accuracy. simple interpretation that shows limited accuracy. Un-supported evaluation that offers simple conclusions.
Quantitative, qualitative and/or fieldwork skills are used inappropriately with limited competence and precision.
The information is basic and communicated in an unstructured way. The information is supported by limited evidence and the relationship to the evidence may not be clear.
SPECIMEN
H081/02 Mark Scheme June 20xx
10
Question Answer Marks Guidance
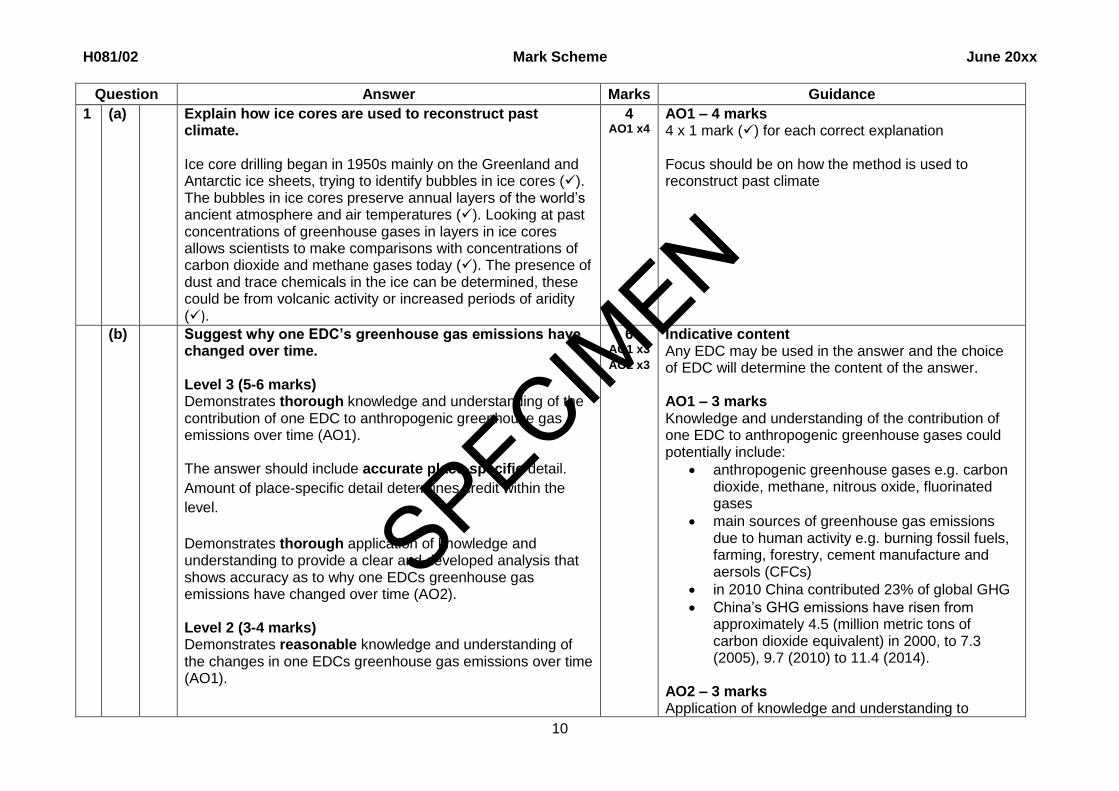
1 (a) Explain how ice cores are used to reconstruct past climate. Ice core drilling began in 1950s mainly on the Greenland and Antarctic ice sheets, trying to identify bubbles in ice cores (). The bubbles in ice cores preserve annual layers of the world’s ancient atmosphere and air temperatures (). Looking at past concentrations of greenhouse gases in layers in ice cores allows scientists to make comparisons with concentrations of carbon dioxide and methane gases today (). The presence of dust and trace chemicals in the ice can be determined, these could be from volcanic activity or increased periods of aridity ().
4 AO1 x4
AO1 – 4 marks 4 x 1 mark () for each correct explanation Focus should be on how the method is used to reconstruct past climate
(b) Suggest why one EDC’s greenhouse gas emissions have changed over time. Level 3 (5-6 marks) Demonstrates thorough knowledge and understanding of the contribution of one EDC to anthropogenic greenhouse gas emissions over time (AO1). The answer should include accurate place-specific detail.
Amount of place-specific detail determines credit within the
level.
Demonstrates thorough application of knowledge and understanding to provide a clear and developed analysis that shows accuracy as to why one EDCs greenhouse gas emissions have changed over time (AO2). Level 2 (3-4 marks) Demonstrates reasonable knowledge and understanding of the changes in one EDCs greenhouse gas emissions over time (AO1).
6 AO1 x3 AO2 x3
Indicative content Any EDC may be used in the answer and the choice of EDC will determine the content of the answer. AO1 – 3 marks Knowledge and understanding of the contribution of one EDC to anthropogenic greenhouse gases could potentially include:
anthropogenic greenhouse gases e.g. carbon dioxide, methane, nitrous oxide, fluorinated gases
main sources of greenhouse gas emissions due to human activity e.g. burning fossil fuels, farming, forestry, cement manufacture and aersols (CFCs)
in 2010 China contributed 23% of global GHG
China’s GHG emissions have risen from approximately 4.5 (million metric tons of carbon dioxide equivalent) in 2000, to 7.3 (2005), 9.7 (2010) to 11.4 (2014).
AO2 – 3 marks Application of knowledge and understanding to
SPECIMEN
H081/02 Mark Scheme June 20xx
11
Question Answer Marks Guidance
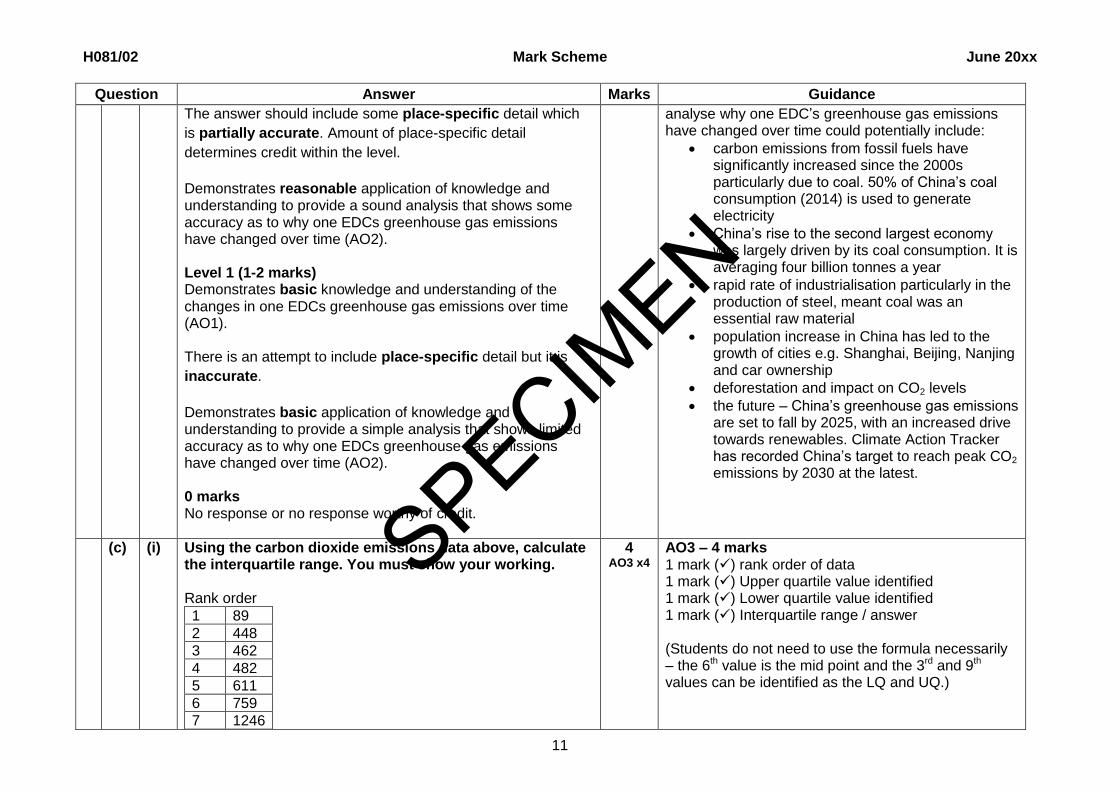
The answer should include some place-specific detail which
is partially accurate. Amount of place-specific detail
determines credit within the level.
Demonstrates reasonable application of knowledge and understanding to provide a sound analysis that shows some accuracy as to why one EDCs greenhouse gas emissions have changed over time (AO2). Level 1 (1-2 marks) Demonstrates basic knowledge and understanding of the changes in one EDCs greenhouse gas emissions over time (AO1). There is an attempt to include place-specific detail but it is
inaccurate.
Demonstrates basic application of knowledge and understanding to provide a simple analysis that shows limited accuracy as to why one EDCs greenhouse gas emissions have changed over time (AO2). 0 marks No response or no response worthy of credit.
analyse why one EDC’s greenhouse gas emissions have changed over time could potentially include:
carbon emissions from fossil fuels have significantly increased since the 2000s particularly due to coal. 50% of China’s coal consumption (2014) is used to generate electricity
China’s rise to the second largest economy was largely driven by its coal consumption. It is averaging four billion tonnes a year
rapid rate of industrialisation particularly in the production of steel, meant coal was an essential raw material
population increase in China has led to the growth of cities e.g. Shanghai, Beijing, Nanjing and car ownership
deforestation and impact on CO2 levels
the future – China’s greenhouse gas emissions are set to fall by 2025, with an increased drive towards renewables. Climate Action Tracker has recorded China’s target to reach peak CO2 emissions by 2030 at the latest.
(c) (i) Using the carbon dioxide emissions data above, calculate the interquartile range. You must show your working. Rank order
1 89
2 448
3 462
4 482
5 611
6 759
7 1246
4 AO3 x4
AO3 – 4 marks 1 mark () rank order of data 1 mark () Upper quartile value identified 1 mark () Lower quartile value identified 1 mark () Interquartile range / answer (Students do not need to use the formula necessarily – the 6th value is the mid point and the 3rd and 9th values can be identified as the LQ and UQ.)
SPECIMEN
H081/02 Mark Scheme June 20xx
12
Question Answer Marks Guidance
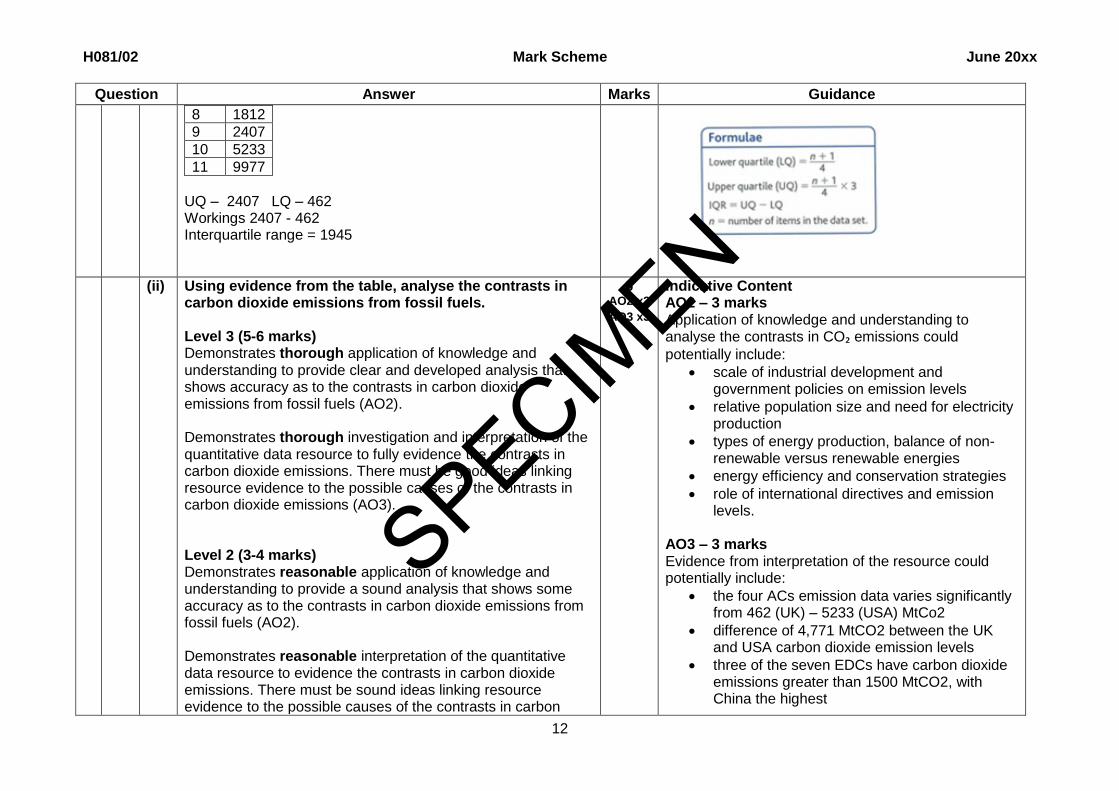
8 1812
9 2407
10 5233
11 9977
UQ – 2407 LQ – 462 Workings 2407 - 462 Interquartile range = 1945
(ii) Using evidence from the table, analyse the contrasts in carbon dioxide emissions from fossil fuels. Level 3 (5-6 marks) Demonstrates thorough application of knowledge and understanding to provide clear and developed analysis that shows accuracy as to the contrasts in carbon dioxide emissions from fossil fuels (AO2). Demonstrates thorough investigation and interpretation of the quantitative data resource to fully evidence the contrasts in carbon dioxide emissions. There must be good ideas linking resource evidence to the possible causes of the contrasts in carbon dioxide emissions (AO3). Level 2 (3-4 marks) Demonstrates reasonable application of knowledge and understanding to provide a sound analysis that shows some accuracy as to the contrasts in carbon dioxide emissions from fossil fuels (AO2). Demonstrates reasonable interpretation of the quantitative data resource to evidence the contrasts in carbon dioxide emissions. There must be sound ideas linking resource evidence to the possible causes of the contrasts in carbon
6 AO2 x3 AO3 x3
Indicative Content AO2 – 3 marks Application of knowledge and understanding to analyse the contrasts in CO₂ emissions could
potentially include:
scale of industrial development and government policies on emission levels
relative population size and need for electricity production
types of energy production, balance of non-renewable versus renewable energies
energy efficiency and conservation strategies
role of international directives and emission levels.
AO3 – 3 marks Evidence from interpretation of the resource could potentially include:
the four ACs emission data varies significantly from 462 (UK) – 5233 (USA) MtCo2
difference of 4,771 MtCO2 between the UK and USA carbon dioxide emission levels
three of the seven EDCs have carbon dioxide emissions greater than 1500 MtCO2, with China the highest
SPECIMEN
H081/02 Mark Scheme June 20xx
13
Question Answer Marks Guidance
dioxide emissions (AO3). Level 1 (1-2 marks) Demonstrates basic application of knowledge and understanding to provide a simple analysis that shows limited accuracy as to the contrasts in carbon dioxide emissions from fossil fuels (AO2). Demonstrates basic interpretation of the quantitative data resource providing limited evidence of contrasts in carbon dioxide emissions. There will be limited ideas about contrasts to carbon dioxide emissions with limited or no link to resource evidence (AO3). 0 marks No response or no response worthy of credit.
China has higher CO₂ emissions than nine of
the other countries combined
Brazil has the lowest CO₂ emissions of the
EDCS.
(d) ‘Oceans are the best indicator of a warming world’. How far do you agree with this statement? Level 4 (10-12 marks) Demonstrates comprehensive knowledge and understanding of evidence the world has warmed (AO1). Demonstrates comprehensive application of knowledge and understanding to provide a detailed and substantiated evaluation that offers secure judgements leading to rational conclusions that are evidence based as to whether oceans are the best climate indicator (AO2). This will be shown by including well-developed ideas about whether oceans are the best climate indicator Level 3 (7-9 marks) Demonstrates thorough knowledge and understanding of evidence the world has warmed (AO1). Demonstrates thorough application of knowledge and
12 AO1 x6 AO2 x6
Indicative Content AO1 – 6 marks Knowledge and understanding of evidence the world has warmed could potentially include:
oceans play a key role in absorbing heat, as greenhouse gases trap more energy from the sun, the oceans are absorbing more heat resulting in an increase in sea surface temperature
IPCC suggests most convincing evidence of ocean heating can be found in the Arctic, North Atlantic, Eastern Pacific and Indian Oceans
sea surface temperatures increased globally over the 20th century. These temperatures have been higher in the last three decades since the late 1880s
IPCC > 0.1oC per decade in the upper 75m ocean and 0.015oC per decade at 700m depth
Antarctic water, the coldest, deep water ocean is showing signs of warming
other evidence the world has warmed such as
SPECIMEN
H081/02 Mark Scheme June 20xx
14
Question Answer Marks Guidance
understanding to provide a detailed evaluation that offers generally secure judgements, with some link between rational conclusions and evidence as to whether oceans are the best climate indicator (AO2). This will be shown by including well-developed ideas about whether expanding oceans are the best climate indicator. Level 2 (4-6 marks) Demonstrates reasonable knowledge and understanding of evidence the world has warmed (AO1). Demonstrates reasonable application of knowledge and understanding to provide a sound evaluation that offers generalised judgements and conclusions, with limited use of evidence as to whether oceans are the best climate indicator (AO2). This will be shown by including developed ideas about whether expanding oceans are the best climate indicator. Level 1 (1-3 marks) Demonstrates basic knowledge and understanding of evidence the world has warmed (AO1). Demonstrates basic application of knowledge and understanding to provide an un-supported evaluation that offers simple conclusions as to whether oceans are the best climate indicator (AO2). This will be shown by including simple ideas about whether expanding oceans are the best climate indicator. 0 marks No response or no response worthy of credit.
increases in surface or atmospheric temperatures, shrinking of valley glaciers and ice sheets, rising sea level, increasing atmospheric water vapour, decreasing snow cover and sea ice.
AO2 – 6 marks Application of knowledge and understanding to evaluate whether oceans are the best climate indicator of a warming world could potentially include:
lack of long term data for heat / thermal expansion of oceans compared to ice core data to show atmospheric temperature changes
evidence of ocean cooling in some sub-polar gyres such as North Pacific and North Atlantic
climate indictors often interrelated such as ocean temperatures, thermal expansion and sea level rise or melting of ice and ocean temperatures
change in ocean systems occur over much longer periods than the atmosphere. Interactions between the oceans and atmosphere occur slowly over months and years as does the movement of water within oceans. Therefore it takes many more years to adapt to and reflect climate change
tracking ocean heat contributes to an understanding of long term climate trends as the heat energy stored deep in the ocean is gradually released into the atmosphere
focus on a range of indicators gives a more comprehensive understanding of climate change.
SPECIMEN
H081/02 Mark Scheme June 20xx
15
Question Answer Marks Guidance
2 (a) Explain disease diffusion using the Hägerstrand model. Diffusion means a disease is transmitted to a new location (relocation diffusion) (). A disease spreads from a source location to a new area (). The spread of disease could be contagious from one directly infected person to another non-infected person (). The spread of disease can be affected by barriers such as distance (a natural barrier) ().
4 AO1 x4
AO1 – 4 marks 1 mark () for each correct explanation Focus should be on the Hägerstrand model to explain disease diffusion
(b) Suggest why one country experiencing air pollution has seen incidences of cancer change over time. Level 3 (5-6 marks) Demonstrates thorough knowledge and understanding of how one country experiencing air pollution has seen incidences of cancer change over time (AO1). The answer should include accurate place-specific detail.
Amount of place-specific detail determines credit within the
level.
Demonstrates thorough application of knowledge and understanding to provide a clear and developed analysis that shows accuracy as to why one country experiencing air pollution has seen incidences of cancer change over time (AO2). Level 2 (3-4 marks) Demonstrates reasonable knowledge and understanding of how one country experiencing air pollution has seen incidences of cancer change over time (AO1). The answer should include some place-specific detail which
is partially accurate. Amount of place-specific detail
determines credit within the level.
6 AO1 x3 AO2 x3
Indicative content Any country may be used in the answer and the choice of country will determine the content of the answer. AO1 – 3 marks Knowledge and understanding of how one country experiencing air pollution has seen incidences of cancer change over time could potentially include:
evidence that outdoor air pollution, e.g. particulate matter which is carcinogenic to humans, as well as exhaust and industrial fumes, has been linked to lung cancer through changes in DNA e.g. International Agency for Research on Cancer (2013)
40,000 people approximately die prematurely in the UK each year due to air pollution
nature of air pollution has changed over time and related disease / cancer risk e.g. 1940s/50s sulphur dioxide from soot, 1960s/80s carbon monoxide from lead, 1980/2000s nitrogen dioxide from particulates and by 2014, 50% of our new cars were diesel
particulate matter (also known as particle pollution) of 2.5 micrometers (in diameter) and nitrogen dioxide have similar harmful effects and are linked to lung cancer
incidences of lung cancer in the UK have
SPECIMEN
H081/02 Mark Scheme June 20xx
16
Question Answer Marks Guidance
Demonstrates reasonable application of knowledge and understanding to provide a sound analysis that shows some accuracy as to why one country experiencing air pollution has seen incidences of cancer change over time (AO2). Level 1 (1-2 marks) Demonstrates basic knowledge and understanding of the how one country experiencing air pollution has seen incidences of cancer change over time (AO1). There is an attempt to include place-specific detail but it is
inaccurate.
Demonstrates basic application of knowledge and understanding to provide a simple analysis that shows limited accuracy as to why one country experiencing air pollution has seen incidences of cancer change over time (AO2). 0 marks No response or no response worthy of credit.
decreased for men by approximately 57% but increased for women by 63% between 1972 and 2013, this however includes smoking habits particularly in the 1970s -1980s. In 2013, 45,000 people were diagnosed with lung cancer
AO2 – 3 marks Application of knowledge and understanding to analyse why one country experiencing air pollution has seen incidences of cancer change over time could potentially include:
longer term exposure to air pollution decreases lung function
increase in concentration of particulate matter to 10 micrometers per m3 led to a corresponding increase in lung cancer risk
technology advances to record, model and predict air pollutants and an improved understanding of the link with lung cancer
higher concentration of cars on the roads with increased congestion and stationary traffic contributing atmospheric pollutants
changes in government policy such as an increased use of renewable energy, electric cars and emission rates from factories are monitored or filters added
UK government committee on the medical effects of air pollutants is closely monitoring levels and the effects on cancer (COMEAP).
SPECIMEN
H081/02 Mark Scheme June 20xx
17
Question Answer Marks Guidance
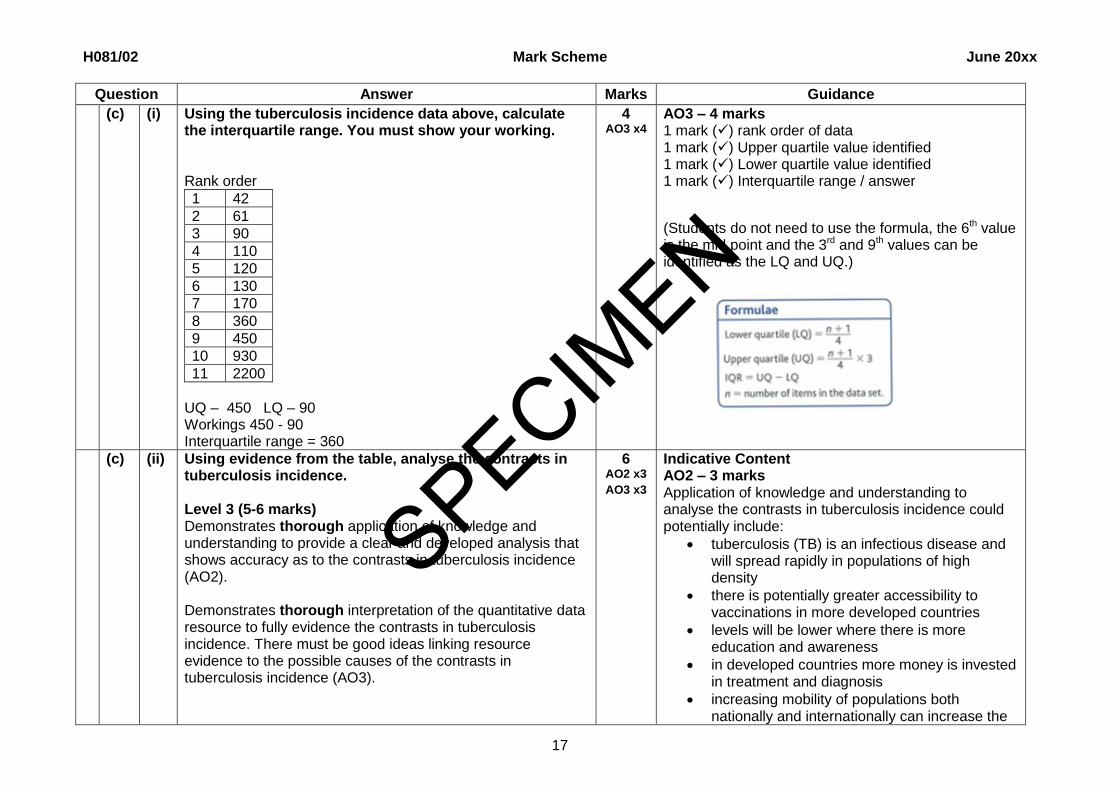
(c) (i) Using the tuberculosis incidence data above, calculate the interquartile range. You must show your working. Rank order
1 42
2 61
3 90
4 110
5 120
6 130
7 170
8 360
9 450
10 930
11 2200
UQ – 450 LQ – 90 Workings 450 - 90 Interquartile range = 360
4 AO3 x4
AO3 – 4 marks 1 mark () rank order of data 1 mark () Upper quartile value identified 1 mark () Lower quartile value identified 1 mark () Interquartile range / answer
(Students do not need to use the formula, the 6th value is the mid point and the 3rd and 9th values can be identified as the LQ and UQ.)
(c) (ii) Using evidence from the table, analyse the contrasts in tuberculosis incidence. Level 3 (5-6 marks) Demonstrates thorough application of knowledge and understanding to provide a clear and developed analysis that shows accuracy as to the contrasts in tuberculosis incidence (AO2). Demonstrates thorough interpretation of the quantitative data resource to fully evidence the contrasts in tuberculosis incidence. There must be good ideas linking resource evidence to the possible causes of the contrasts in tuberculosis incidence (AO3).
6 AO2 x3 AO3 x3
Indicative Content AO2 – 3 marks Application of knowledge and understanding to analyse the contrasts in tuberculosis incidence could potentially include:
tuberculosis (TB) is an infectious disease and will spread rapidly in populations of high density
there is potentially greater accessibility to vaccinations in more developed countries
levels will be lower where there is more education and awareness
in developed countries more money is invested in treatment and diagnosis
increasing mobility of populations both nationally and internationally can increase the
SPECIMEN
H081/02 Mark Scheme June 20xx
18
Question Answer Marks Guidance
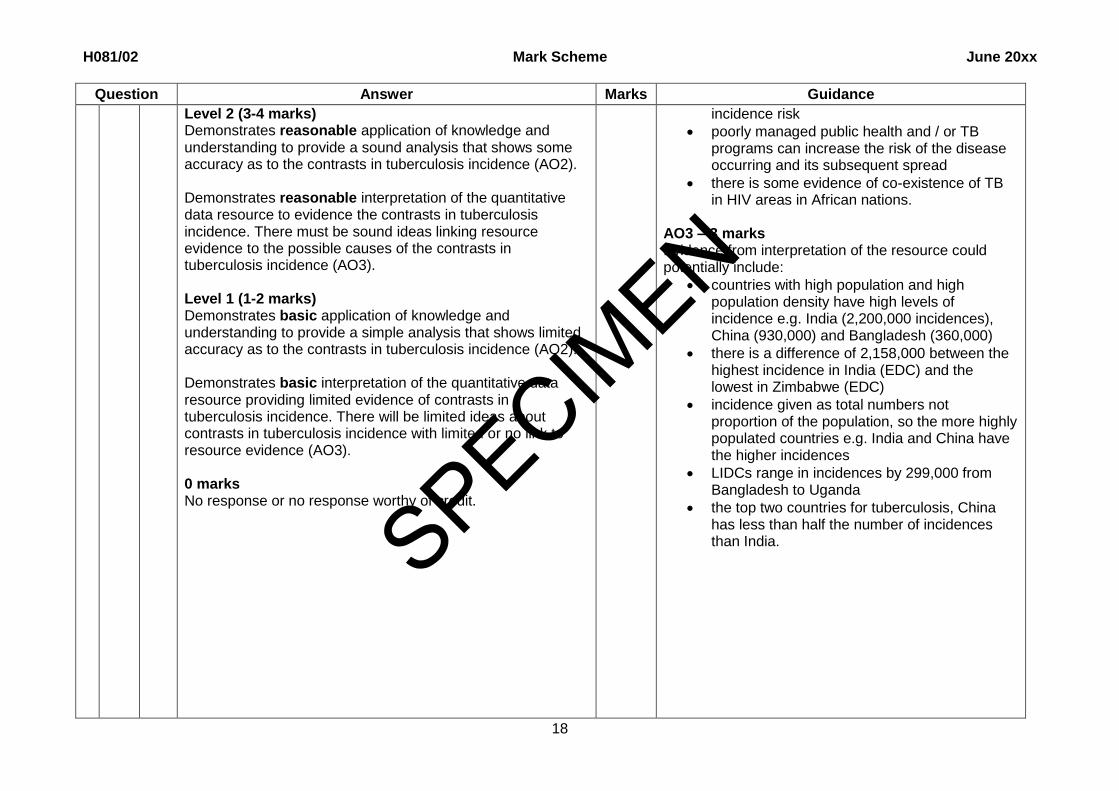
Level 2 (3-4 marks) Demonstrates reasonable application of knowledge and understanding to provide a sound analysis that shows some accuracy as to the contrasts in tuberculosis incidence (AO2). Demonstrates reasonable interpretation of the quantitative data resource to evidence the contrasts in tuberculosis incidence. There must be sound ideas linking resource evidence to the possible causes of the contrasts in tuberculosis incidence (AO3). Level 1 (1-2 marks) Demonstrates basic application of knowledge and understanding to provide a simple analysis that shows limited accuracy as to the contrasts in tuberculosis incidence (AO2). Demonstrates basic interpretation of the quantitative data resource providing limited evidence of contrasts in tuberculosis incidence. There will be limited ideas about contrasts in tuberculosis incidence with limited or no link to resource evidence (AO3). 0 marks No response or no response worthy of credit.
incidence risk
poorly managed public health and / or TB programs can increase the risk of the disease occurring and its subsequent spread
there is some evidence of co-existence of TB in HIV areas in African nations.
AO3 – 3 marks Evidence from interpretation of the resource could potentially include:
countries with high population and high population density have high levels of incidence e.g. India (2,200,000 incidences), China (930,000) and Bangladesh (360,000)
there is a difference of 2,158,000 between the highest incidence in India (EDC) and the lowest in Zimbabwe (EDC)
incidence given as total numbers not proportion of the population, so the more highly populated countries e.g. India and China have the higher incidences
LIDCs range in incidences by 299,000 from Bangladesh to Uganda
the top two countries for tuberculosis, China has less than half the number of incidences than India.
SPECIMEN

H081/02 Mark Scheme June 20xx
19
Question Answer Marks Guidance
(d) ‘Affluence is one of the main causes of noncommunicable disease’. How far do you agree with this statement? Level 4 (10-12 marks) Demonstrates comprehensive knowledge and understanding of affluence as a cause of noncommunicable disease (AO1). Demonstrates comprehensive application of knowledge and understanding to provide a detailed and substantiated evaluation that offers secure judgements leading to rational conclusions that are evidence based as to whether affluence is one of the main causes of noncommunicable disease (AO2). This will be shown by including well-developed ideas about whether affluence is one of the main causes of noncommunicable disease. Level 3 (7-9 marks) Demonstrates thorough knowledge and understanding of affluence as a cause of noncommunicable disease (AO1). Demonstrates thorough application of knowledge and understanding to provide a detailed evaluation that offers generally secure judgements, with some link between rational conclusions and evidence as to whether affluence is one of the main causes of noncommunicable disease (AO2). This will be shown by including well-developed ideas about whether affluence is one of the main causes of noncommunicable disease. Level 2 (4-6 marks) Demonstrates reasonable knowledge and understanding of affluence as cause of noncommunicable disease. (AO1). Demonstrates reasonable application of knowledge and
12 AO1 x6 AO2 x6
Indicative content AO1 – 6 marks Knowledge and understanding of affluence as a cause of noncommunicable disease could potentially include:
noncommunicable disease could be caused by nutrition deficiencies (e.g. rickets), lifestyle (e.g. heart disease) and genetic (e.g. stroke)
rising standards of living impact upon susceptibility to disease and influence the countries epidemiological transition
reasons why ACs have a higher prevalence for noncommunicable diseases (diseases of affluence) e.g. modern diet, alcohol consumption and more sedentary lifestyles
social causes of noncommunicable disease e.g. tobacco exposure, harmful use of alcohol, social isolation, stress, anxiety and depression
economic causes of noncommunicable disease e.g. cheaper high fat and sugary foods (diet high in saturated fat is a risk for strokes and cardio-vascular disease)
cultural causes of noncommunicable disease e.g. physical inactivity, high cholesterol, obesity, ethnic origin and gender
environmental factors e.g. air pollution and links to incidences of cancer.
AO2 – 6 marks Application of knowledge and understanding to evaluate whether affluence is one of the main causes of noncommunicable disease could potentially include:
more sedentary lifestyle due to changing work habits, increased use of technology, longer working day (commuting), cost of gym memberships / leisure facilities, home entertainment systems, means people’s BMI is gradually increasing therefore their disease risk
SPECIMEN
H081/02 Mark Scheme June 20xx
20
Question Answer Marks Guidance
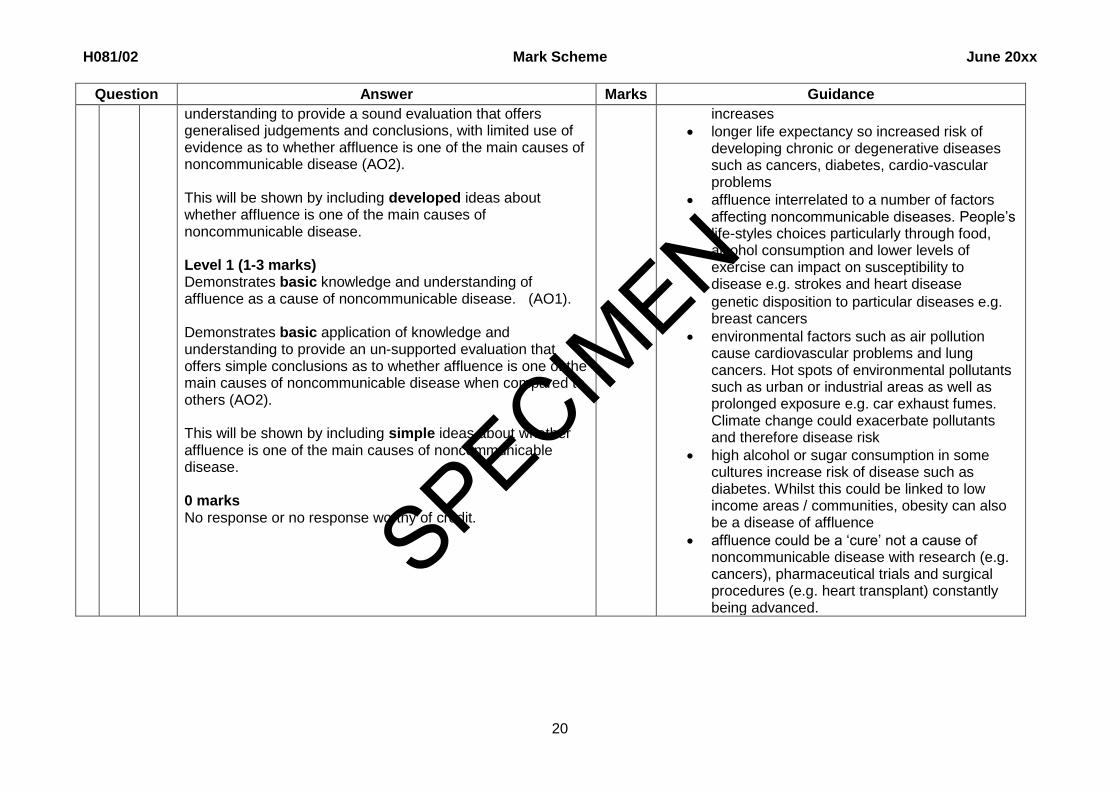
understanding to provide a sound evaluation that offers generalised judgements and conclusions, with limited use of evidence as to whether affluence is one of the main causes of noncommunicable disease (AO2). This will be shown by including developed ideas about whether affluence is one of the main causes of noncommunicable disease. Level 1 (1-3 marks) Demonstrates basic knowledge and understanding of affluence as a cause of noncommunicable disease. (AO1). Demonstrates basic application of knowledge and understanding to provide an un-supported evaluation that offers simple conclusions as to whether affluence is one of the main causes of noncommunicable disease when compared to others (AO2). This will be shown by including simple ideas about whether affluence is one of the main causes of noncommunicable disease. 0 marks No response or no response worthy of credit.
increases
longer life expectancy so increased risk of developing chronic or degenerative diseases such as cancers, diabetes, cardio-vascular problems
affluence interrelated to a number of factors affecting noncommunicable diseases. People’s life-styles choices particularly through food, alcohol consumption and lower levels of exercise can impact on susceptibility to disease e.g. strokes and heart disease
genetic disposition to particular diseases e.g. breast cancers
environmental factors such as air pollution cause cardiovascular problems and lung cancers. Hot spots of environmental pollutants such as urban or industrial areas as well as prolonged exposure e.g. car exhaust fumes. Climate change could exacerbate pollutants and therefore disease risk
high alcohol or sugar consumption in some cultures increase risk of disease such as diabetes. Whilst this could be linked to low income areas / communities, obesity can also be a disease of affluence
affluence could be a ‘cure’ not a cause of noncommunicable disease with research (e.g. cancers), pharmaceutical trials and surgical procedures (e.g. heart transplant) constantly being advanced.
SPECIMEN
H081/02 Mark Scheme June 20xx
21
Question Answer Marks Guidance
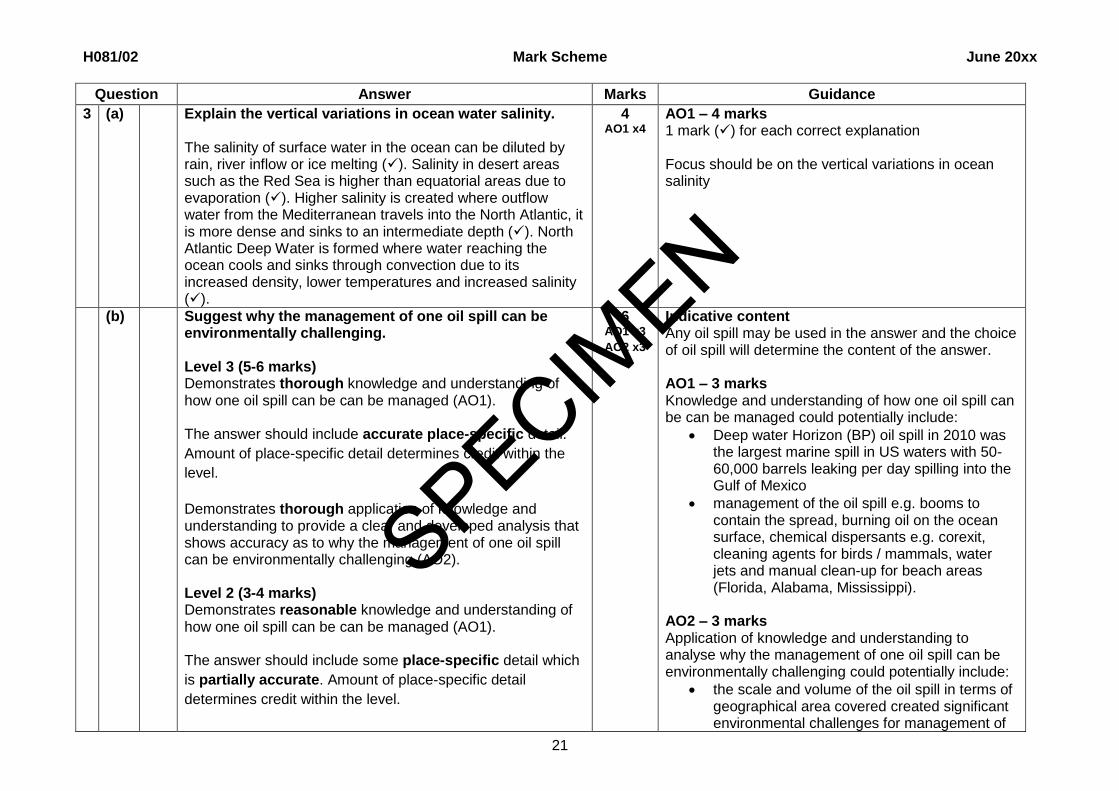
3 (a) Explain the vertical variations in ocean water salinity. The salinity of surface water in the ocean can be diluted by rain, river inflow or ice melting (). Salinity in desert areas such as the Red Sea is higher than equatorial areas due to evaporation (). Higher salinity is created where outflow water from the Mediterranean travels into the North Atlantic, it is more dense and sinks to an intermediate depth (). North Atlantic Deep Water is formed where water reaching the ocean cools and sinks through convection due to its increased density, lower temperatures and increased salinity ().
4 AO1 x4
AO1 – 4 marks 1 mark () for each correct explanation Focus should be on the vertical variations in ocean salinity
(b) Suggest why the management of one oil spill can be environmentally challenging. Level 3 (5-6 marks) Demonstrates thorough knowledge and understanding of how one oil spill can be can be managed (AO1). The answer should include accurate place-specific detail.
Amount of place-specific detail determines credit within the
level.
Demonstrates thorough application of knowledge and understanding to provide a clear and developed analysis that shows accuracy as to why the management of one oil spill can be environmentally challenging (AO2). Level 2 (3-4 marks) Demonstrates reasonable knowledge and understanding of how one oil spill can be can be managed (AO1). The answer should include some place-specific detail which
is partially accurate. Amount of place-specific detail
determines credit within the level.
6 AO1 x3 AO2 x3
Indicative content Any oil spill may be used in the answer and the choice of oil spill will determine the content of the answer. AO1 – 3 marks Knowledge and understanding of how one oil spill can be can be managed could potentially include:
Deep water Horizon (BP) oil spill in 2010 was the largest marine spill in US waters with 50-60,000 barrels leaking per day spilling into the Gulf of Mexico
management of the oil spill e.g. booms to contain the spread, burning oil on the ocean surface, chemical dispersants e.g. corexit, cleaning agents for birds / mammals, water jets and manual clean-up for beach areas (Florida, Alabama, Mississippi).
AO2 – 3 marks Application of knowledge and understanding to analyse why the management of one oil spill can be environmentally challenging could potentially include:
the scale and volume of the oil spill in terms of geographical area covered created significant environmental challenges for management of
SPECIMEN
H081/02 Mark Scheme June 20xx
22
Question Answer Marks Guidance
Demonstrates reasonable application of knowledge and understanding to provide a sound analysis that shows some accuracy as to why the management of one oil spill can be environmentally challenging (AO2). Level 1 (1-2 marks) Demonstrates basic knowledge and understanding of how one oil spill can be can be managed (AO1). There is an attempt to include place-specific detail but it is
inaccurate.
Demonstrates basic application of knowledge and understanding to provide a simple analysis that shows limited accuracy as to why the management of one oil spill can be environmentally challenging (AO2). 0 marks No response or no response worthy of credit.
the oil spill. The continued flow of oil for 11 weeks at approx. 50,000 barrels a day e.g. by early June 125 miles of Louisiana’s coast had seen oil washed up
the severity and range of environmental impacts on marine ecosystems e.g. chemicals leached into the marine environment were absorbed travelled through the food chain. Tuna and amberjacks saw significant increases in their cardio toxicity
extensive damage to wildlife habitats e.g. sea birds, wetlands and beach areas (Florida)
storm conditions (particularly high winds) created environmental challenges as attempts to contain the oil spill using containment booms (21,000ft) failed to stop the spread of the slick
controlled burns as the oil floated (as it is hydrophobic) on the ocean surface and chemical dispersants had environmental impacts of their own e.g. carbon dioxide emissions or cancer causing toxins
long term environmental monitoring and management is difficult e.g. fishermen reported deformed fish 2 – 3 years after the spill, as well as significantly decreased fish stocks e.g. blue fin tuna, scientists not sure if this is from the chemical dispersants or the oil leak itself
SPECIMEN
H081/02 Mark Scheme June 20xx
23
Question Answer Marks Guidance
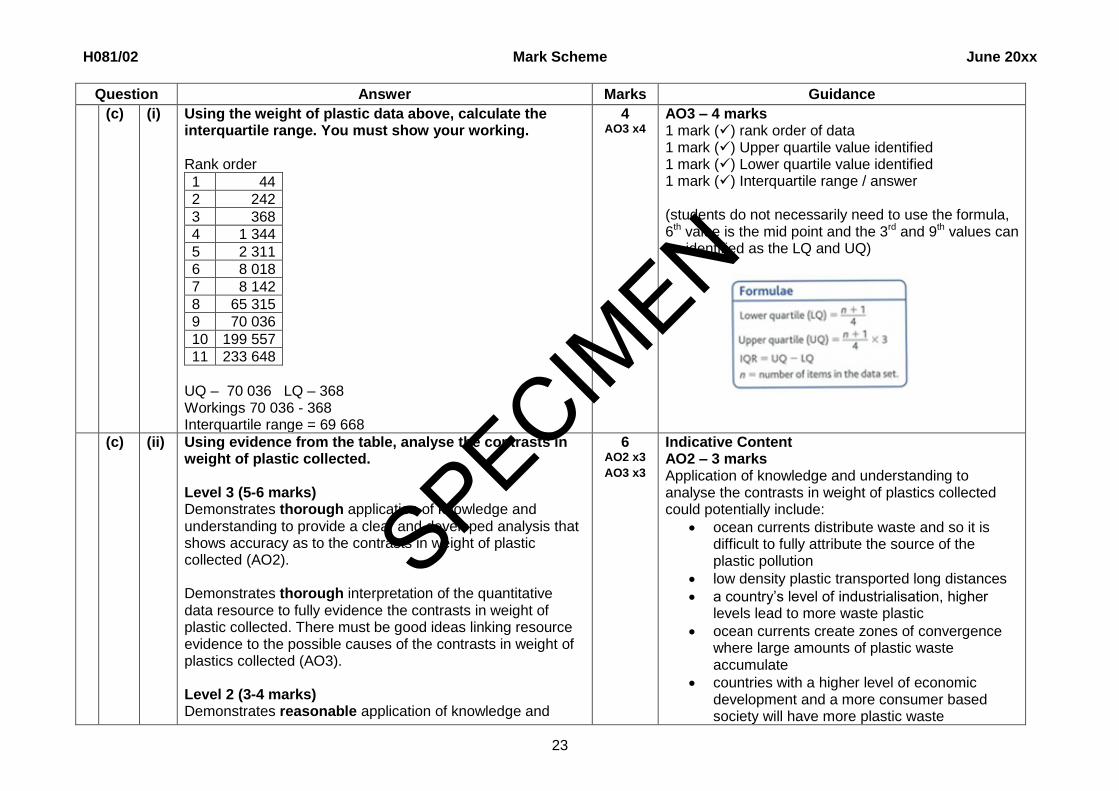
(c) (i) Using the weight of plastic data above, calculate the interquartile range. You must show your working. Rank order
1 44
2 242
3 368
4 1 344
5 2 311
6 8 018
7 8 142
8 65 315
9 70 036
10 199 557
11 233 648
UQ – 70 036 LQ – 368 Workings 70 036 - 368 Interquartile range = 69 668
4 AO3 x4
AO3 – 4 marks 1 mark () rank order of data 1 mark () Upper quartile value identified 1 mark () Lower quartile value identified 1 mark () Interquartile range / answer (students do not necessarily need to use the formula, 6th value is the mid point and the 3rd and 9th values can be identified as the LQ and UQ)
(c) (ii) Using evidence from the table, analyse the contrasts in weight of plastic collected. Level 3 (5-6 marks) Demonstrates thorough application of knowledge and understanding to provide a clear and developed analysis that shows accuracy as to the contrasts in weight of plastic collected (AO2). Demonstrates thorough interpretation of the quantitative data resource to fully evidence the contrasts in weight of plastic collected. There must be good ideas linking resource evidence to the possible causes of the contrasts in weight of plastics collected (AO3). Level 2 (3-4 marks) Demonstrates reasonable application of knowledge and
6 AO2 x3 AO3 x3
Indicative Content AO2 – 3 marks Application of knowledge and understanding to analyse the contrasts in weight of plastics collected could potentially include:
ocean currents distribute waste and so it is difficult to fully attribute the source of the plastic pollution
low density plastic transported long distances
a country’s level of industrialisation, higher levels lead to more waste plastic
ocean currents create zones of convergence where large amounts of plastic waste accumulate
countries with a higher level of economic development and a more consumer based society will have more plastic waste
SPECIMEN
H081/02 Mark Scheme June 20xx
24
Question Answer Marks Guidance
understanding to provide a sound analysis that shows some accuracy as to the contrasts in weight of plastic collected (AO2). Demonstrates reasonable interpretation of the quantitative data resource to evidence the contrasts in weight of plastics collected. There must be sound ideas linking resource evidence to the possible causes of the contrasts in weight of plastics collected (AO3). Level 1 (1-2 marks) Demonstrates basic application of knowledge and understanding to provide a simple analysis that shows limited accuracy as to the contrasts in weight of plastics collected (AO2). Demonstrates basic interpretation of the quantitative data resource providing limited evidence of contrasts in weight of plastics collected. There will be limited ideas about contrasts in weight of plastics collected (AO3). 0 marks No response or no response worthy of credit.
plastic is less expensive to manufacture, it is widely available and overused across the development spectrum
plastic accumulated from commercial fishing nets
AO3 – 3 marks Evidence from interpretation of the resource could potentially include:
high levels in ACs such as Canada e.g. 199, 557 lbs and industrialised EDCs such as India e.g. 233,648 lbs
wide contrast between the highest and lowest, difference of 233,604lb
ACs not always the highest scores e.g. Australia 242lbs. Difference of approximately 199,300lbs between the highest and lowest weight of plastic in ACs
countries surrounded by sea not always highest e.g. Japan (4th) and Australia (10th)
North Atlantic and North Pacific are highly polluted with plastics, this can account for high levels in Canada.
(d) ‘Oceans present hazardous obstacles to human activities’. How far do you agree with this statement? Level 4 (10-12 marks) Demonstrates comprehensive knowledge and understanding of hazardous obstacles and human activities in oceans (AO1). Demonstrates comprehensive application of knowledge and understanding to provide a detailed and substantiated evaluation that offers secure judgements leading to rational conclusions that are evidence based as to whether oceans present hazardous obstacles to human activity (AO2).
12 AO1 x6 AO2 x6
Indicative Content AO1 – 6 marks Knowledge and understanding of hazardous obstacles and human activity in oceans could potentially include:
the distribution of 21st century piracy
the use of oceans as escape routes for migrants e.g. North Africa to Europe
the direction and type of trade across the oceans
a marine conflict zone where countries dispute ocean territory areas e.g. South China Sea
human activities in oceans e.g. use of biological
SPECIMEN
H081/02 Mark Scheme June 20xx
25
Question Answer Marks Guidance
This will be shown by including well-developed ideas about whether oceans present hazardous obstacles to human activity. Level 3 (7-9 marks) Demonstrates thorough knowledge and understanding of hazardous obstacles and human activities in oceans (AO1). Demonstrates thorough application of knowledge and understanding to provide a detailed evaluation that offers generally secure judgements, with some link between rational conclusions and evidence as to whether oceans present hazardous obstacles (AO2). This will be shown by including well-developed ideas about whether oceans present hazardous obstacles to human activity. Level 2 (4-6 marks) Demonstrates reasonable knowledge and understanding of hazardous obstacles and human activities in oceans (AO1). Demonstrates reasonable application of knowledge and understanding to provide a sound evaluation that offers generalised judgements and conclusions, with limited use of evidence as to whether oceans present obstacles to human activity (AO2). This will be shown by including developed ideas about whether oceans present obstacles to human activity. Level 1 (1-3 marks) Demonstrates basic knowledge and understanding of hazardous obstacles and human activities in oceans (AO1). Demonstrates basic application of knowledge and
and energy resources, extraction of sea bed minerals
oceans present hazardous obstacles which are physical / natural e.g. relief of ocean basins, currents, ecosystem predators, warming temperatures.
AO2 –6 marks Application of knowledge and understanding to evaluate whether oceans present hazardous obstacles to human activity could potentially include: the value of oceans for energy resources –
however, ocean basin relief and currents can provide challenges for oil and gas production due to drilling a wellbore in the seabed in deepwater areas. One of the world's deepest hubs is currently the Perdido in the Gulf of Mexico, floating in 2,438 meters of water
deep sea mining for minerals takes place on the ocean floor approximately 1,400 up to 3,700 below the surface e.g. Papua New Guinea and New Zealand. The hydrothermal vents create sulfide deposits, which contain valuable metals e.g. silver, gold, copper, manganese, cobalt, and zinc. The obstacles presented by the ocean are the accessibility of the mineral deposits due to their deep sea / sea bed locations
territorial waters such as the South China Sea can be sources of conflict as they are shipping routes and have great value to a number of countries. The South China Sea has two chains of islands with mineral resources and the area has high fish stocks. Disputes between China, Vietnam and the Philippines in particular relate to the geographical position of the islands, trade routes and access to resources
SPECIMEN

H081/02 Mark Scheme June 20xx
26
Question Answer Marks Guidance
understanding to provide an un-supported evaluation that offers simple conclusions as to whether oceans present obstacles to human activity (AO2). This will be shown by including simple ideas about the obstacles oceans present and different human activities. 0 marks No response or no response worthy of credit.
a number of human activities create hazardous obstacles within the oceans such as mineral and energy resource extraction as pollutants impact marine ecosystems. The ocean can be used as a ‘dumping ground’ for waste products e.g. plastics and nuclear waste this affects ocean temperatures and the marine ecosystems
oceans can provide escape routes e.g. Mediterranean sea. Whilst this stretch of sea from North Africa to Europe could be seen to be less hazardous e.g. currents, lighter winds, warmer temperatures the obstacles are very real for migrants such as exposure, boats are densely packed with people in poor conditions, with boats capsizing and many unable to swim
piracy off the coast of Somalia has been a threat to international shipping with economic impacts as shipping expenses are increased. It’s thought the causes of piracy from the early 2000s were in response to illegal fishing by foreign boats and the dumping of toxic waste by foreign boats, both of which affected local fishermen from using the coastal waters and being able to earn a living so they formed armed groups.
SPECIMEN

H081/02 Mark Scheme June 20xx
27
Question Answer Marks Guidance
4 (a) Explain the physical conditions required for growing food. Variable temperatures, light intensity and duration are required for crops, any reduction in these can affect yields (). Water is essential for germination and plant growth and for certain biological functions (). Photosynthesis involves the absorption of CO₂ from the air and plants require O₂ for
respiration (). Soils contain the mixture of mineral and organic matter for plant growth e.g. nitrogen ().
4 AO1 x4
AO1 – 4 marks 1 mark () for each correct explanation Focus should be on the physical conditions for growing food.
(b) Suggest why one indigenous group’s food security can change over time. Level 3 (5-6 marks) Demonstrates thorough knowledge and understanding of the threats to indigenous group’s food security (AO1). The answer should include accurate place-specific detail.
Amount of place-specific detail determines credit within the
level.
Demonstrates thorough application of knowledge and understanding to provide a clear and developed analysis that shows accuracy as to why one indigenous group’s food security can change over time (AO2). Level 2 (3-4 marks) Demonstrates reasonable knowledge and understanding of the threats to indigenous group’s food security (AO1). The answer should include some place-specific detail which
is partially accurate. Amount of place-specific detail
determines credit within the level.
Demonstrates reasonable application of knowledge and understanding to provide a sound analysis that shows some
6 AO1 x3 AO2 x3
Indicative content Any indigenous group may be used in the answer and the choice of indigenous group will determine the content of the answer. AO1 – 3 marks Knowledge and understanding of the threats to indigenous group’s food security could potentially include:
Nunavut indigenous Inuit people from the Canadian Arctic survive largely by harvesting plants and animals at a subsistence level, their food insecurity is 5 times the national average
climate change is threatening the Nunavut’s subsistence farming culture e.g. animal migration patterns or plants not adapting as quickly as the climate is warming
the accessibility of food supplies and availability of healthy food especially for impoverished communities e.g. nearly 70% of households find it hard to access affordable / nutritious food
reliance on food supplies from outside the area this is particularly important for remote communities
SPECIMEN
H081/02 Mark Scheme June 20xx
28
Question Answer Marks Guidance
accuracy as to why one indigenous group’s food security can change over time (AO2). Level 1 (1-2 marks) Demonstrates basic knowledge and understanding of the threats to indigenous group’s food security (AO1). There is an attempt to include place-specific detail but it is
inaccurate.
Demonstrates basic application of knowledge and understanding to provide a simple analysis that shows limited accuracy as to why one indigenous group’s food security can change over time (AO2). 0 marks No response or no response worthy of credit.
AO2 – 3 marks Application of knowledge and understanding to analyse why one indigenous group’s food security can change over time could potentially include:
climate change / changing environmental conditions e.g. warmer weather, thinner ice, variable snowfall (e.g. difficult for animals foraging), unpredictable weather (e.g. prevents food arriving by air)
wildlife stocks declining so fewer numbers for hunting (e.g. Muskoxen), health of wildlife, changing migration routes due to climate change (e.g. more challenging to hunt as they are further from community groups)
rising costs e.g. farming equipment makes it challenging to grow and produce food
changing diets and food practices through the potential modernisation of communities, with considerable numbers of people with low incomes e.g. hunting has become more a weekend activity and people prefer to eat local food
need for more food processing facilities close to the Nunavut, currently there are only 3 e.g. Kitikmoet Foods in Cambridge Bay
loss of traditional knowledge to hunt and harvest wildlife as it becomes more challenging to gain food from the environment
population growth is putting pressure on resources and their potential sustainability
international pressure to preserve the Arctic environment can be opposed to traditional hunting rights and practices
hunting as a tourist activity depletes wildlife stocks e.g. Muskoxen, Caribou or small game
SPECIMEN
H081/02 Mark Scheme June 20xx
29
Question Answer Marks Guidance
such as Arctic hares.
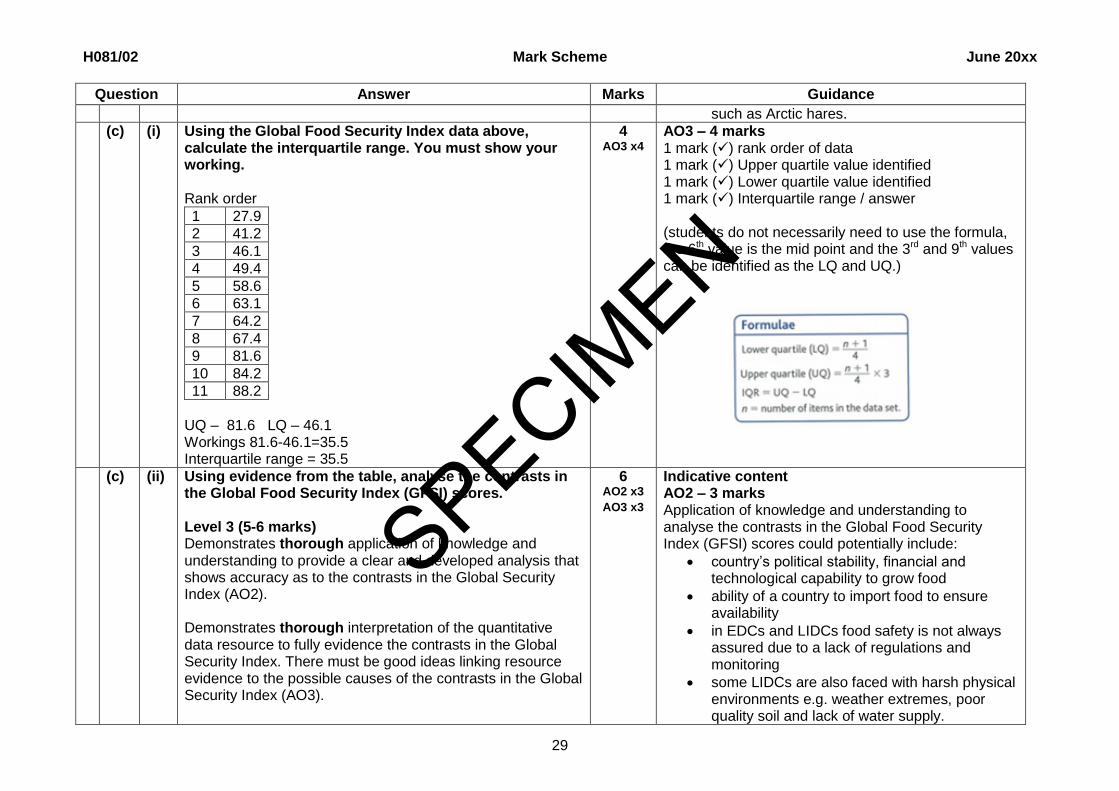
(c) (i) Using the Global Food Security Index data above, calculate the interquartile range. You must show your working. Rank order
1 27.9
2 41.2
3 46.1
4 49.4
5 58.6
6 63.1
7 64.2
8 67.4
9 81.6
10 84.2
11 88.2
UQ – 81.6 LQ – 46.1 Workings 81.6-46.1=35.5 Interquartile range = 35.5
4 AO3 x4
AO3 – 4 marks 1 mark () rank order of data 1 mark () Upper quartile value identified 1 mark () Lower quartile value identified 1 mark () Interquartile range / answer (students do not necessarily need to use the formula, the 6th value is the mid point and the 3rd and 9th values can be identified as the LQ and UQ.)
(c) (ii) Using evidence from the table, analyse the contrasts in the Global Food Security Index (GFSI) scores. Level 3 (5-6 marks) Demonstrates thorough application of knowledge and understanding to provide a clear and developed analysis that shows accuracy as to the contrasts in the Global Security Index (AO2). Demonstrates thorough interpretation of the quantitative data resource to fully evidence the contrasts in the Global Security Index. There must be good ideas linking resource evidence to the possible causes of the contrasts in the Global Security Index (AO3).
6 AO2 x3 AO3 x3
Indicative content AO2 – 3 marks Application of knowledge and understanding to analyse the contrasts in the Global Food Security Index (GFSI) scores could potentially include:
country’s political stability, financial and technological capability to grow food
ability of a country to import food to ensure availability
in EDCs and LIDCs food safety is not always assured due to a lack of regulations and monitoring
some LIDCs are also faced with harsh physical environments e.g. weather extremes, poor quality soil and lack of water supply.
SPECIMEN
H081/02 Mark Scheme June 20xx
30
Question Answer Marks Guidance
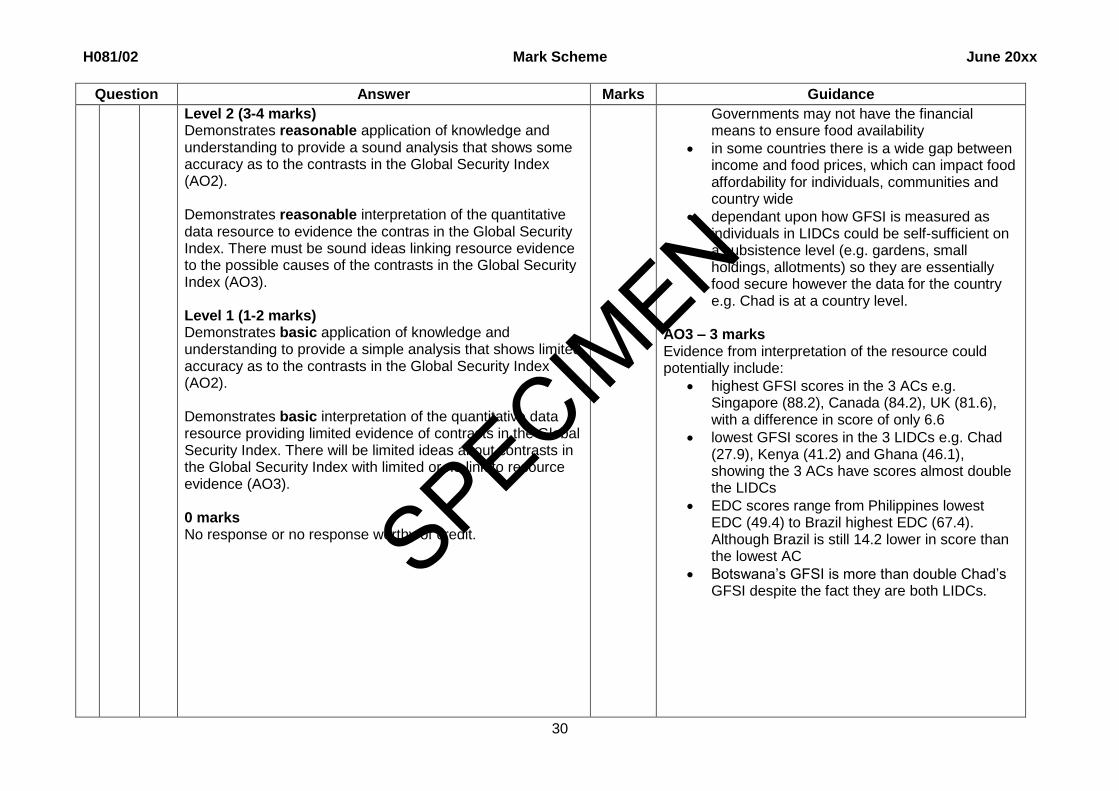
Level 2 (3-4 marks) Demonstrates reasonable application of knowledge and understanding to provide a sound analysis that shows some accuracy as to the contrasts in the Global Security Index (AO2). Demonstrates reasonable interpretation of the quantitative data resource to evidence the contras in the Global Security Index. There must be sound ideas linking resource evidence to the possible causes of the contrasts in the Global Security Index (AO3). Level 1 (1-2 marks) Demonstrates basic application of knowledge and understanding to provide a simple analysis that shows limited accuracy as to the contrasts in the Global Security Index (AO2). Demonstrates basic interpretation of the quantitative data resource providing limited evidence of contrasts in the Global Security Index. There will be limited ideas about contrasts in the Global Security Index with limited or no link to resource evidence (AO3). 0 marks No response or no response worthy of credit.
Governments may not have the financial means to ensure food availability
in some countries there is a wide gap between income and food prices, which can impact food affordability for individuals, communities and country wide
dependant upon how GFSI is measured as individuals in LIDCs could be self-sufficient on a subsistence level (e.g. gardens, small holdings, allotments) so they are essentially food secure however the data for the country e.g. Chad is at a country level.
AO3 – 3 marks Evidence from interpretation of the resource could potentially include:
highest GFSI scores in the 3 ACs e.g. Singapore (88.2), Canada (84.2), UK (81.6), with a difference in score of only 6.6
lowest GFSI scores in the 3 LIDCs e.g. Chad (27.9), Kenya (41.2) and Ghana (46.1), showing the 3 ACs have scores almost double the LIDCs
EDC scores range from Philippines lowest EDC (49.4) to Brazil highest EDC (67.4). Although Brazil is still 14.2 lower in score than the lowest AC
Botswana’s GFSI is more than double Chad’s GFSI despite the fact they are both LIDCs.
SPECIMEN
H081/02 Mark Scheme June 20xx
31
Question Answer Marks Guidance
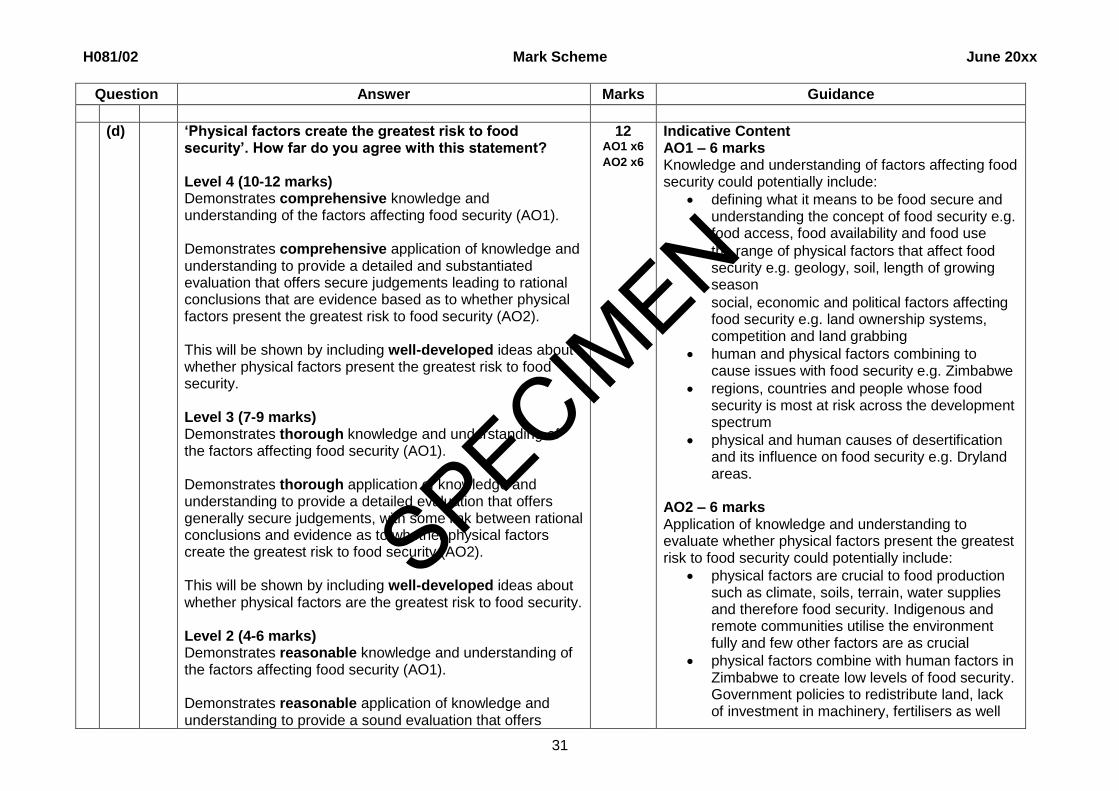
(d) ‘Physical factors create the greatest risk to food security’. How far do you agree with this statement? Level 4 (10-12 marks) Demonstrates comprehensive knowledge and understanding of the factors affecting food security (AO1). Demonstrates comprehensive application of knowledge and understanding to provide a detailed and substantiated evaluation that offers secure judgements leading to rational conclusions that are evidence based as to whether physical factors present the greatest risk to food security (AO2). This will be shown by including well-developed ideas about whether physical factors present the greatest risk to food security. Level 3 (7-9 marks) Demonstrates thorough knowledge and understanding of the factors affecting food security (AO1). Demonstrates thorough application of knowledge and understanding to provide a detailed evaluation that offers generally secure judgements, with some link between rational conclusions and evidence as to whether physical factors create the greatest risk to food security (AO2). This will be shown by including well-developed ideas about whether physical factors are the greatest risk to food security. Level 2 (4-6 marks) Demonstrates reasonable knowledge and understanding of the factors affecting food security (AO1). Demonstrates reasonable application of knowledge and understanding to provide a sound evaluation that offers
12 AO1 x6 AO2 x6
Indicative Content AO1 – 6 marks Knowledge and understanding of factors affecting food security could potentially include:
defining what it means to be food secure and understanding the concept of food security e.g. food access, food availability and food use
the range of physical factors that affect food security e.g. geology, soil, length of growing season
social, economic and political factors affecting food security e.g. land ownership systems, competition and land grabbing
human and physical factors combining to cause issues with food security e.g. Zimbabwe
regions, countries and people whose food security is most at risk across the development spectrum
physical and human causes of desertification and its influence on food security e.g. Dryland areas.
AO2 – 6 marks Application of knowledge and understanding to evaluate whether physical factors present the greatest risk to food security could potentially include:
physical factors are crucial to food production such as climate, soils, terrain, water supplies and therefore food security. Indigenous and remote communities utilise the environment fully and few other factors are as crucial
physical factors combine with human factors in Zimbabwe to create low levels of food security. Government policies to redistribute land, lack of investment in machinery, fertilisers as well
SPECIMEN

H081/02 Mark Scheme June 20xx
32
Question Answer Marks Guidance
generalised judgements and conclusions, with limited use of evidence as to whether physical factors are the greatest risk to food security (AO2). This will be shown by including developed ideas about whether physical factors present the greatest risk to food security. Level 1 (1-3 marks) Demonstrates basic knowledge and understanding of the factors affecting food security (AO1). Demonstrates basic application of knowledge and understanding to provide an un-supported evaluation that offers simple conclusions as to whether physical factors present the greatest risk to food security (AO2). This will be shown by including simple ideas about the factors affecting food security. 0 marks No response or no response worthy of credit.
as irrigation occurred alongside a physical environment with variable soil quality and rainfall. Zimbabwe’s growing population also put pressure on food availability.
even if physical conditions are favourable to food production, political decisions and government policy will impact food security e.g. Singapore. This has favourable conditions to grow food however the small geographical size of the island means there are severe pressures on space. They could quickly have issues with food security if they were unable to import all their food items. Physical factors are not as important to Singapore’s food security.
more advanced countries have the political and economic means to ensure food security even if physical conditions pose a threat, they can purchase land (issue of land grabbing) and/or import food
in LIDCs with harsh physical environments (e.g. drought and flooding) there is often a lack of investment, political and technological knowledge needed to overcome these difficulties e.g. famine in Ethiopia
access to food relates to not just supply but also income, markets and prices. Even if the physical environment allows sufficient food production people must still have the economic means to access it
for Malthus, when population outstrips food supplies, a ceiling is reached and a rebalancing leads to diminishing food supplies and population. In fragile physical environments such as the Sahel it takes very little population increase to place pressure on food security.
SPECIMEN
H081/02 Mark Scheme June 20xx
33
Question Answer Marks Guidance
5 (a) Explain how fossil records can be used as evidence of continental drift and plate tectonics theory. Fossils are the preserved traces of animals and plants found inside rock, they help date geological material (). The geographic distribution of fossils has helped to understand the spread of different species over time (). Anomalies in the distribution presented a problem for geologists as very similar fossils were discovered in rock masses separated by vast distances or oceans e.g. some of the same fossils were found in southern Africa and the tip of south America (). Similar fossilised remains of plants and animals found on different continents provided evidence for Wegener of continental drift ().
4 AO1 x4
AO1 – 4 marks 1 mark () for each correct explanation Focus should be on how fossils present evidence for continental drift and plate tectonics.
(b) Suggest why people experience varying impacts resulting from one volcanic eruption. Level 3 (5-6 marks) Demonstrates thorough knowledge and understanding of the impacts people experience as a result of one volcanic eruption (AO1). The answer should include accurate place-specific detail.
Amount of place-specific detail determines credit within the
level.
Demonstrates thorough application of knowledge and understanding to provide a clear and developed analysis that shows accuracy as to why people experience varying impacts resulting from one volcanic eruption (AO2). Level 2 (3-4 marks) Demonstrates reasonable knowledge and understanding of the impacts people experience as a result of one volcanic
6 AO1 x3 AO2 x3
Indicative content Any volcanic eruption may be used in the answer and the choice of volcanic eruption will determine the content of the answer. AO1 – 3 marks Knowledge and understanding of the impacts people experience as a result of one volcanic eruption could potentially include:
Eyjafjallajokull eruption had impacts on Iceland, e.g. lava flow, flooding and ash fallout, and a number of other countries in 2010 e.g. travel disruptions, air freight disruptions (e.g. FedEx), goods spoilt (e.g. African flowers destined for European markets)
social impacts e.g. loss of life, disruption to working week, threats to homes
economic impacts e.g. the fine grained ash plume grounded flights across Europe, damage to agricultural land as ash fell
environmental impacts e.g. Eyjafjallajokull glacier
SPECIMEN
H081/02 Mark Scheme June 20xx
34
Question Answer Marks Guidance
eruption (AO1). The answer should include some place-specific detail which
is partially accurate. Amount of place-specific detail
determines credit within the level.
Demonstrates reasonable application of knowledge and understanding to provide a sound analysis that shows some accuracy as to why people experience varying impacts resulting from one volcanic eruption (AO2). Level 1 (1-2 marks) Demonstrates basic knowledge and understanding of the impacts people experience as a result of one volcanic eruption (AO1). There is an attempt to include place-specific detail but it is
inaccurate.
Demonstrates basic application of knowledge and understanding to provide a simple analysis that shows limited accuracy as to why people experience varying impacts resulting from one volcanic eruption (AO2). 0 marks No response or no response worthy of credit.
underneath the volcano, melted and caused widespread flooding, local water supplies were contaminated by the ash, 3,000 tonnes of carbon dioxide into the air per day.
AO2 – 3 marks Application of knowledge and understanding to analyse why people experience varying impacts resulting from one volcanic eruption could potentially include:
release of fine dust particles and carbon dioxide e.g. 0.15 million tonnes each day and its effects on human health (e.g. breathing and lung capacity)
proximity to the volcanic eruption e.g. homes destroyed by the lava flows (which reached 3km from the volcanic fissure) and ash deposits
150 metre thick ice cap melted which caused major flooding and 700 people were evacuated from their homes, with 20 farms destroyed
potential gains from volcanic activity e.g. numbers of visitors to Eyjafjallajokull significantly increased for the first couple of years after the event
the ash from the volcanic eruption was rich in nutrients and benefitted farmers however the eruption consisted mainly of glass which is not easily soluble in water e.g. silica and aluminium
ash falling in water courses (rivers) or travelling there via surface runoff can potentially harm and irritate the gills of fish and aquatic ecosystems which through the food chain could be passed onto humans.
SPECIMEN
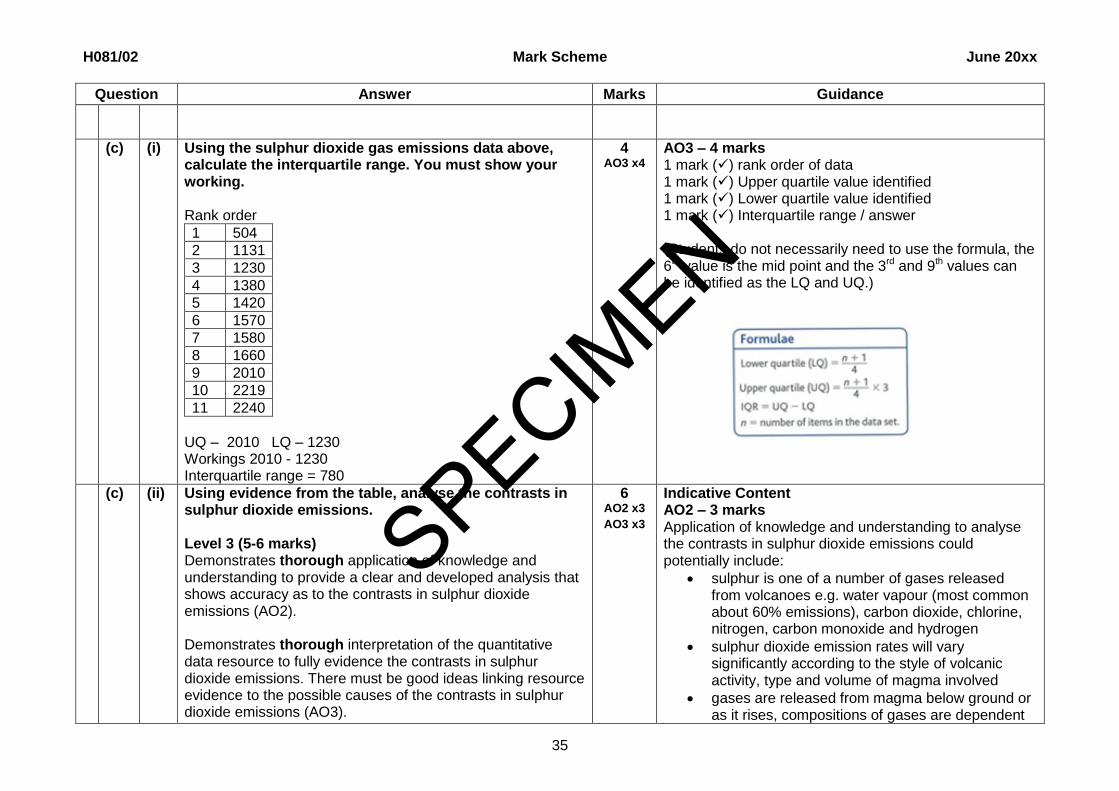
H081/02 Mark Scheme June 20xx
35
Question Answer Marks Guidance
(c) (i) Using the sulphur dioxide gas emissions data above, calculate the interquartile range. You must show your working. Rank order
1 504
2 1131
3 1230
4 1380
5 1420
6 1570
7 1580
8 1660
9 2010
10 2219
11 2240
UQ – 2010 LQ – 1230 Workings 2010 - 1230 Interquartile range = 780
4 AO3 x4
AO3 – 4 marks 1 mark () rank order of data 1 mark () Upper quartile value identified 1 mark () Lower quartile value identified 1 mark () Interquartile range / answer (Students do not necessarily need to use the formula, the 6th value is the mid point and the 3rd and 9th values can be identified as the LQ and UQ.)
(c) (ii) Using evidence from the table, analyse the contrasts in sulphur dioxide emissions. Level 3 (5-6 marks) Demonstrates thorough application of knowledge and understanding to provide a clear and developed analysis that shows accuracy as to the contrasts in sulphur dioxide emissions (AO2). Demonstrates thorough interpretation of the quantitative data resource to fully evidence the contrasts in sulphur dioxide emissions. There must be good ideas linking resource evidence to the possible causes of the contrasts in sulphur dioxide emissions (AO3).
6 AO2 x3 AO3 x3
Indicative Content AO2 – 3 marks Application of knowledge and understanding to analyse the contrasts in sulphur dioxide emissions could potentially include:
sulphur is one of a number of gases released from volcanoes e.g. water vapour (most common about 60% emissions), carbon dioxide, chlorine, nitrogen, carbon monoxide and hydrogen
sulphur dioxide emission rates will vary significantly according to the style of volcanic activity, type and volume of magma involved
gases are released from magma below ground or as it rises, compositions of gases are dependent
SPECIMEN

H081/02 Mark Scheme June 20xx
36
Question Answer Marks Guidance
Level 2 (3-4 marks) Demonstrates reasonable application of knowledge and understanding to provide a sound analysis that shows some accuracy as to the contrasts in sulphur dioxide emissions (AO2). Demonstrates reasonable interpretation of the quantitative data resource to evidence the contrasts in sulphur dioxide emissions. There must be sound ideas linking resource evidence to the possible causes of the contrasts in sulphur dioxide emissions (AO3). Level 1 (1-2 marks) Demonstrates basic application of knowledge and understanding to provide a simple analysis that shows limited accuracy as to the contrasts in sulphur dioxide emissions (AO2). Demonstrates basic interpretation of the quantitative data resource providing limited evidence of contrasts in sulphur dioxide emissions. There will be limited ideas about contrasts to sulphur dioxide emissions with limited or no link to resource evidence (AO3). 0 marks No response or no response worthy of credit.
on the movement of magma in the volcano
as magma moves upwards, pressure decreases and it becomes more fluid, at this stage gases dissolved in the magma come out of solution and form bubbles, these expand to propel the magma to the surface
satellite instruments can detect sulphur dioxide as it absorbs strongly in ultra-violet wavelengths and has low background concentrations in the atmosphere, this makes it ideal for volcanic gas monitoring.
AO3 – 3 marks Evidence from interpretation of the resource could potentially include:
2010 is the year showing the lowest emissions which are approximately ¼ of the value for 2005, the year showing the highest emissions.
for 3 years, 2008, 2006, 2005 the emissions are over 2 000 metric tonnes/year.
7 years have values which are roughly comparable, and range from 1131 (2009) to 1580 (2001)
the average emission for Kilauea volcano is 1,540, at least six years are above average.
(d) ‘People have to live in tectonically active locations’. How far do you agree with this statement? Level 4 (10-12 marks) Demonstrates comprehensive knowledge and understanding of the reasons for living in tectonically active areas (AO1). Demonstrates comprehensive application of knowledge and
12 AO1 x6 AO2 x6
Indicative Content AO1 – 6 marks Knowledge and understanding of reasons why people live in tectonically active areas, could potentially include:
reasons why people choose to live in tectonically active locations, either areas prone to volcanic eruptions and / or earthquake activity
measures used to help people living in tectonically active areas (prone to volcanic eruptions and / or
SPECIMEN
H081/02 Mark Scheme June 20xx
37
Question Answer Marks Guidance
understanding to provide a detailed and substantiated evaluation that offers secure judgements leading to rational conclusions that are evidence based as to whether people have to live in tectonically active locations (AO2). This will be shown by including well-developed ideas about whether people have to live in tectonically active locations. Level 3 (7-9 marks) Demonstrates thorough knowledge and understanding of the reasons why people live in tectonically active locations (AO1). Demonstrates thorough application of knowledge and understanding to provide a detailed evaluation that offers generally secure judgements, with some link between rational conclusions and evidence as to whether people have to live in tectonically active locations (AO2). This will be shown by including well-developed ideas about whether people have to live in tectonically active areas. Level 2 (4-6 marks) Demonstrates reasonable knowledge and understanding of the reasons why people live in tectonically active areas (AO1). Demonstrates reasonable application of knowledge and understanding to provide a sound evaluation that offers generalised judgements and conclusions, with limited use of evidence as to whether people have to live in tectonically active areas (AO2). This will be shown by including developed ideas about whether people have to live in tectonically active areas. Level 1 (1-3 marks) Demonstrates basic knowledge and understanding of the
earthquake activity) e.g. mitigation against vulnerability, the event and losses
changes in the frequency and impacts of tectonic hazards over time
the degree of risk posed by a hazard and the probability of the hazard event occurring
possible future strategies to cope with the risks from tectonic hazards.
AO2 – 6 marks Application of knowledge and understanding to evaluate whether people have to live in tectonically active locations, could potentially include:
people have choices but these may be restricted by their economic wealth, low income populations may be less mobile
cost benefit analysis of moving, the economic and social benefits may outweigh the cost and risk perception e.g. San Francisco / California
balance of risk perception with frequency of hazard event. Populations may be highly resilient to a frequently occurring hazard such as an earthquake as it becomes ‘the norm’ e.g. Tokyo
resource or hazard debate – volcanic areas provide rich organic soils, minerals to mine and attractions for tourism, economic benefits outweigh the risk
advances in mitigation strategies such as prevention, prediction and preparation makes people feel less vulnerable e.g. Japan and the level of technological advancement with shock absorbing foundations, shatter proof glass, flexible cables for gas and electricity
there is now a greater awareness of tectonic hazards, the existence of early warning systems and the availability and readiness of emergency
SPECIMEN

H081/02 Mark Scheme June 20xx
38
Question Answer Marks Guidance
reasons why people live in tectonically active areas (AO1). Demonstrates basic application of knowledge and understanding to provide an un-supported evaluation that offers simple conclusions as to whether people have to live in tectonically active areas (AO2). This will be shown by including simple ideas about whether people have to live in tectonically active areas. 0 marks No response or no response worthy of credit.
personnel, particularly in ACs
cultural significance (eruptions happen if the gods are unhappy), abundant food supplies and economic benefits living near volcano so populations wont / don’t want to move. The benefits hugely outweigh the risks e.g. Philippines even though perceived as LIDC / EDC and poverty could be a key factor these areas are resource rich and so it’s a misperception that people ‘have’ to live there
if populations have lived with the tectonic hazard risk e.g. volcanic eruption but it has not occurred in their lifetime or their parents / grandparents, the perception of risk may be lowered
greater warning signs with a volcano, build up to eruption (earthquake activity and gas emissions), evacuation is possible compared to an earthquake which is a rapid onset hazard so can’t be predicted
SPECIMEN

H081/02 Mark Scheme June 20xx
39
Question Answer Marks Guidance
6 (a) Using Fig.1, suggest how climate change influences geomorphic processes in landscape systems. Level 3 (6-8 marks) Demonstrates thorough knowledge and understanding of climate change and geomorphic processes in landscape systems (AO1). Demonstrates thorough application of knowledge and understanding to provide a clear and developed interpretation that shows accuracy of how climate change influences geomorphic processes in landscape systems (AO2). This will be shown by including well-developed ideas linking resource evidence on climate change to geomorphic processes. There are clear attempts to make synoptic links between content from different parts of the course of study. Level 2 (3-5 marks) Demonstrates reasonable knowledge and understanding of climate change and geomorphic processes in landscape systems (AO1). Demonstrates reasonable application of knowledge and understanding to provide a sound interpretation that shows some accuracy of how climate change influences geomorphic processes (AO2). This will be shown by including developed ideas linking resource evidence on climate change to geomorphic processes.
8 AO1 x4 AO2 x4
Indicative Content AO1 – 4 marks Knowledge and understanding of climate change and geomorphic processes in landscape systems, could potentially include:
evidence the world has warmed since the late nineteenth century including increased atmospheric water vapour and atmospheric temperatures
geomorphic processes e.g. weathering, mass movement, erosion, transportation and deposition
specific weathering and erosion processes will depend on the landscape system e.g. coasts (marine erosion, aeolian deposition), glaciation (glacial erosion processes) or drylands (aeolian erosion).
AO2 – 4 marks Application of knowledge and understanding to interpret how climate change influences geomorphic processes in landscape systems, could potentially include:
from Fig.1, higher amounts of precipitation particularly at the equator, alongside higher temperatures creating faster rates of erosion
evidence from Fig.1 shows significantly lower levels of precipitation between the equator and 40°N and S, coupled with rising global temperatures could exacerbate aeolian erosion processes
impact of increased temperature on weathering processes, in some areas mechanical weathering may decrease due to less severe frosts, chemical weathering generally increases with a rise in temperature
rising temperatures can lead to changes in glacial
SPECIMEN

H081/02 Mark Scheme June 20xx
40
There are some attempts to make synoptic links between content from different parts of the course of study but these are not always relevant. Level 1 (1-2 marks) Demonstrates basic knowledge and understanding of climate change and geomorphic processes in landscape systems (AO1). Demonstrates basic application of knowledge and understanding to provide a simple interpretation that shows limited accuracy of how climate change influences geomorphic processes (AO2). There will be simple ideas linking resource evidence on climate change to geomorphic processes. There are limited attempts to make synoptic links between content from different parts of the course of study. 0 marks No response or no response worthy of credit
meltwater, which initially creates a larger volume of water for erosion and the drop in velocity can create areas of deposition
more precipitation means greater influence of chemical weathering processes on rocks from CO₂ dissolved in rainwater
global sea level changes will lead to increased wave energy and impact rates of coastal erosion
increase in temperatures leads to shrinking of ice sheets and glaciers leaving soil and rock surfaces exposed to weathering and erosion
global temperature rise, warm sea surfaces and increased evaporation giving rise to storm conditions especially in the tropics. As storms reach landfall they erode coastlines and deposit materials inland.
(b) Examine how climate change impacts human use of landscape systems. Level 3 (6-8 marks) Demonstrates thorough knowledge and understanding of climate change impacts and human use of landscape systems (AO1). Demonstrates thorough application of knowledge and understanding to provide a clear and developed analysis that shows accuracy of how climate change impacts human use of landscape systems (AO2). There must be well-developed ideas of how climate change impacts on human use of landscape systems.
8 AO1 x4 AO2 x4
Indicative Content AO1 – 4 marks Knowledge and understanding of climate change impacts and human use of landscape systems, could potentially include:
climate change with a particular focus on increases in surface, atmospheric and ocean temperatures
rising sea level
changes to ecosystems e.g. species extinction
extreme weather e.g. droughts and flooding
human use of landscape systems such as coastal management, water supply and economic development e.g. trade, tourism, resource extraction, dam construction.
SPECIMEN

H081/02 Mark Scheme June 20xx
41
There are clear attempts to make synoptic links between content from different parts of the course of study. Level 2 (3-5 marks) Demonstrates reasonable knowledge and understanding of climate change impacts and human use of landscape systems (AO1). Demonstrates reasonable application of knowledge and understanding to provide a sound analysis that shows some accuracy of how climate change may impact on human use of landscape systems (AO2). There must be developed ideas of how climate change impacts on human use of landscape systems. There are some attempts to make synoptic links between content from different parts of the course of study but these are not always relevant. Level 1 (1-2 marks) Demonstrates basic knowledge and understanding of climate change impacts and human uses of landscape systems (AO1). Demonstrates basic application of knowledge and understanding to provide a simple analysis that shows limited accuracy of how climate change may impact on human use of a physical landscape (AO2). This will be shown by including simple ideas of how climate change impacts on human use of landscape systems. There are limited attempts to make synoptic links between content from different parts of the course of study. 0 marks
AO2 – 4 marks Application of knowledge and understanding to analyse how climate change impacts human use of landscape systems, could potentially include: Coastal landscapes:
rising atmospheric and ocean temperatures leading to sea level rise provides challenges for coastal communities who need to mitigate the risk of flooding e.g. Bangladesh or Tuvalu. This is exacerbated by their currently low lying coastlines
ocean ecosystems can be damaged by changes in temperatures, rising sea levels, increased storm conditions and this impacts on food supplies e.g. fish as a natural resource
as climate change can increase coastal flooding, rates of erosion and deposition as well as alter flows of energy and materials along the coast, in turn influencing sediment cells.
Glaciated landscapes:
thawing of permafrost through increasing global temperatures could lead to areas becoming increasingly accessible for resource extraction e.g. oil and natural gas
melting glaciers in places such as the Himalayas provide vital supplies of drinking water. With warming atmospheric temperatures, glaciers are shrinking and greater rates of evaporation could diminish these water supplies
in glaciated landscapes hydro-electric power provides power supplies however the changing climate is influencing precipitation and temperature patterns. With more unpredictable precipitation, seasons and lower levels of snow melt, water supplies for HEP are variable. Low levels of water could lead to deposition of material / sediments, making HEP a challenge.
SPECIMEN

H081/02 Mark Scheme June 20xx
42
No response or no response worthy of credit. Dryland landscapes:
water shortages from warming temperatures and drought conditions will lead to sediment deposition, silting up of rivers and preventing dams from operating and providing water supplies
a warmer climate or more volatile weather (greater wind speeds) could challenge economic activities linked with tourism such as dune buggying or camping, therefore protecting the landscape system from over use such as dune erosion
aeolian processes could occur at a more rapid rate with greater extremes of weather. As temperatures increase more places will be susceptible to these processes making them increasingly challenging for people to inhabit.
SPECIMEN
H081/02 Mark Scheme June 20xx
43
Question Answer Marks Guidance
7 (a) Using Fig 2, suggest how responses to disease are influenced by landscape systems. Level 3 (6-8 marks) Demonstrates thorough knowledge and understanding of responses to disease and landscape systems (AO1). Demonstrates thorough application of knowledge and understanding to provide a clear and developed interpretation that shows accuracy of how responses to disease are influenced by landscape systems (AO2). This will be shown by including well-developed ideas linking resource evidence on responses to disease outbreaks to landscape systems. There are clear attempts to make synoptic links between content from different parts of the course of study. Level 2 (3-5 marks) Demonstrates reasonable knowledge and understanding of responses to disease and landscape systems (AO1). Demonstrates reasonable application of knowledge and understanding to provide a sound interpretation that shows some accuracy of how responses to disease are influenced by landscape systems (AO2). This will be shown by including developed ideas linking resource evidence on responses to disease outbreaks to landscape systems. There are some attempts to make synoptic links between content from different parts of the course of study but these are not always relevant.
8 AO1 x4 AO2 x4
Indicative Content AO1 – 4 marks Knowledge and understanding of responses to disease and landscape systems, could potentially include:
physical barriers e.g. relief, natural hazards, excess water, remoteness of communities have positive and negative effects on mitigation strategies and response efforts in dealing with disease
direct and indirect strategies used by government and international agencies to mitigate against the disease and respond to outbreaks
role of international organisations e.g. World Health Organization in providing strategies to combat disease
role of an NGO in dealing with a disease outbreak
flows of energy and material through landscape systems
physical factors affecting landscape systems e.g. climate, wind, geology, relief
human activity and economic development in landscape systems e.g. power supplies (HEP).
AO2 – 4 marks Application of knowledge and understanding to interpret how responses to disease are influenced by landscape systems could potentially include:
Fig. 2 shows an Ebola centre in a cleared area of a dense forest environment. Access would be challenging due to the remote nature of the treatment centre
the relief /terrain would influence the building of the Ebola treatment centre (in Fig. 2) and an understanding of the geology would be necessary for transport networks, building foundations and
SPECIMEN
H081/02 Mark Scheme June 20xx
44
Level 1 (1-2 marks) Demonstrates basic knowledge and understanding of responses to disease and landscape systems (AO1). Demonstrates basic application of knowledge and understanding to provide a simple interpretation that shows limited accuracy of how responses to disease are influenced by landscape systems. (AO2). There will be simple ideas linking resource evidence on responses to disease outbreaks to landscape systems. There are limited attempts to make synoptic links between content from different parts of the course of study. 0 marks No response or no response worthy of credit
burying the deceased
immediate responses to a disease outbreak e.g. government and NGO providing clean water supplies could be challenged by accessibility within landscape systems and the role of climate
response to diseases longer term e.g. vaccination programs where the landscape system could provide supplies of energy e.g. HEP to power medical centres, especially in more remote locations
landscapes can be dynamic and therefore change this can present physical obstacles to medical supply routes
mobility of medical personnel to respond to diseases at a national and international scale may be influenced and restricted by difficult terrain and variable relief.
(b) Examine how far the same physical factors affect disease outbreaks and landscape systems. Level 3 (6-8 marks) Demonstrates thorough knowledge and understanding of how physical factors affect disease outbreaks and how physical factors affect landscape systems (AO1). Demonstrates thorough application of knowledge and understanding to provide a clear and developed analysis that shows accuracy of how the same physical factors affect disease outbreaks and landscape systems (AO2). There must be well-developed ideas about how physical factors affect disease outbreaks and landscape systems. There are clear attempts to make synoptic links between content from different parts of the course of study.
8 AO1 x4 AO2 x4
Indicative Content AO1 – 4 marks Knowledge and understanding of how the physical factors affect disease outbreaks and how physical factors affect landscape systems could potentially include:
global patterns of temperature, precipitation, relief and water sources and how they affect patterns of disease
physical factors influence vectors of disease such as mosquitoes
seasonal variations affect disease outbreaks such as drought or monsoons
climate change can provide the conditions for emerging infectious diseases
geographical area covered by a hazard and the influence of the risk and outbreak of disease
a range of physical factors influence landscape systems e.g. geology, climate (precipitation totals
SPECIMEN

H081/02 Mark Scheme June 20xx
45
Level 2 (3-5 marks) Demonstrates reasonable knowledge and understanding of how physical factors affect disease outbreaks and how physical factors affect landscape systems (AO1). Demonstrates reasonable application of knowledge and understanding to provide a sound analysis that shows some accuracy of how the same physical factors affect disease outbreaks and landscape systems (AO2). There must be developed ideas about how physical factors affect disease outbreaks and landscape systems. There are some attempts to make synoptic links between content from different parts of the course of study but these are not always relevant. Level 1 (1-2 marks) Demonstrates basic knowledge and understanding of how physical factors affect disease outbreaks and how physical factors affect landscape systems (AO1). Demonstrates basic application of knowledge and understanding to provide simple analysis that shows limited accuracy of how the same physical factors affect disease outbreaks and landscape systems (AO2). This will be shown by including simple ideas about how physical factors affect disease outbreaks and landscape systems. There are limited attempts to make synoptic links between content from different parts of the course of study. 0 marks No response or no response worthy of credit.
and patterns), latitude, altitude and relief
some physical factors affecting landscape systems are specific to the landscape chosen e.g. coasts – wind, waves, tides and global pattern of ocean currents. Glaciated – relief and aspect on microclimate and glacier movement. Drylands – availability of sediment.
AO2 – 4 marks Application of knowledge and understanding to analyse how the same physical factors affect disease outbreaks and landscape systems could potentially include:
on a basic level it seems there are similar physical factors e.g. precipitation and relief affecting disease outbreaks and landscape systems however this is very much determined by the type of disease and the individual landscape system
physical factors themselves can vary significantly in terms of their rates, frequency, patterns and variability which will affect disease outbreaks and landscape systems alike e.g. higher rates of rainfall (monsoon conditions) can encourage a disease outbreak (cholera) and exaggerate processes in landscape systems e.g. rates of erosion
outbreaks of disease can vary in size from a small number of people infected in a restricted geographical area through to a country wide scale. A combination of physical factors can combine to influence the scale of the outbreak in the same way as they can affect landscape systems
some physical factors are particularly significant to disease outbreaks such as temperature and proximity to water sources. Whilst temperature is significant for landscape systems it can be linked to the rate of processes (erosion and weathering)
SPECIMEN

H081/02 Mark Scheme June 20xx
46
which in turn affect landscape systems (and features created) whereas other physical factors such as precipitation have a direct effect on the landscape system
outbreaks of disease can also be determined by vectors e.g. mosquitoes, here a combination of warm and wet conditions encourage them to thrive and spread diseases e.g. malaria. The same physical factors can enhance processes in landscape systems e.g. soil erosion.
SPECIMEN
H081/02 Mark Scheme June 20xx
47
Question Answer Marks Guidance
8 (a) Using Fig.3, suggest how clean ocean waters influence a sense of place identity. Level 3 (6-8 marks) Demonstrates thorough knowledge and understanding of oceans waters and sense of place identity (AO1). Demonstrates thorough application of knowledge and understanding to provide a clear and developed interpretation that shows accuracy of how clean waters influence a sense of place identity (AO2). This will be shown by including well-developed ideas linking resource evidence on clean waters to a sense of place. There are clear attempts to make synoptic links between content from different parts of the course of study. Level 2 (3-5 marks) Demonstrates reasonable knowledge and understanding of oceans waters and sense of place identity (AO1). Demonstrates reasonable application of knowledge and understanding to provide a sound interpretation that shows some accuracy of how clean waters influence a sense of place identity (AO2). This will be shown by including developed ideas linking resource evidence on clean waters to a sense of place. There are some attempts to make synoptic links between content from different parts of the course of study but these are not always relevant. Level 1 (1-2 marks)
8 AO1 x4 AO2 x4
Indicative Content. AO1 – 4 marks Knowledge and understanding of clean ocean waters and sense of place identity, could potentially include:
the global distribution of the world’s oceans
variety of pollutants that affect ocean systems
how pollution can spread around the world via oceanic circulation
shaping place identity through demographic, socio-economic, cultural, political, built and natural characteristics
past and present connections that shape place identity
how people perceive places in different ways based on their identity e.g. age, gender, sexuality, religion and role.
AO2 – 4 marks Application of knowledge and understanding to interpret how clean waters influence a sense of place identity could potentially include:
extent to which clean ocean waters create a sense of place identity, which can be positive or negative e.g. an environment in which people can feel a sense of connection whether it is through personal choices, their work, the geographical location or the natural area
the impact of clean ocean waters on a sense of place identity for different groups of people e.g. tourists, business owners, local residents
where clean ocean waters are challenged through pollution this could potentially impact peoples economic capacity and social standing, and therefore their sense of place identity. This may be a changing factor over time and so
SPECIMEN
H081/02 Mark Scheme June 20xx
48
Demonstrates basic knowledge and understanding of oceans waters and sense of place identity (AO1). Demonstrates basic application of knowledge and understanding to provide a simple interpretation that shows limited accuracy of how clean waters influence a sense of place identity (AO2). There will be simple ideas linking resource evidence on responses to disease outbreaks to landscape systems. There are limited attempts to make synoptic links between content from different parts of the course of study. 0 marks No response or no response worthy of credit
communities with distinct cultural and demographic characteristics lose their sense of identity and the ocean environment begins to change e.g. small island communities
Fig. 3, demonstrates that for a number of places such as China, India, Brazil, Indonesia and Japan they are protecting their coastal areas and yet this does not easily correlate with them having waters which aren’t as clean. These countries are across the development spectrum, it is not clear whether they are the ones causing the pollution or experiencing it through currents
evidence from Fig 3 shows that in general clean waters invoke a sense of place as they are a natural resource and they help shape the profile of a place as locals, tourists and businesses can enjoy them for leisure and economic pursuits, anomalies are Somalia and Canada.
(b) Examine how living in an island community affects people’s perception of place. Level 3 (6-8 marks) Demonstrates thorough knowledge and understanding of life in an island community and people’s perception of place (AO1). Demonstrates thorough application of knowledge and understanding to provide a clear and developed analysis that shows accuracy of how living in an island community affects people’s perception of place (AO2). There must be well-developed ideas about how living in an island community affects people’s perception of place. There are clear attempts to make synoptic links between content from different parts of the course of study.
8 AO1 x4 AO2 x4
Indicative Content: AO1 – 4 marks Knowledge and understanding of life in an island community and people’s perception of place could potentially include:
threats to island communities
changing ways of life in island communities in response to food supplies, climate change, sea level rise, trade routes or geo-political relations
short term and long term adaptations by governments and communities
how people will perceive places in different ways according to their age, gender, religion and role
how level of emotional attachment to place can influence people’s behaviour and activities in a place
how local communities shape the place they live AO2 – 4 marks
SPECIMEN

H081/02 Mark Scheme June 20xx
49
Level 2 (3-5 marks) Demonstrates reasonable knowledge and understanding of life in an island community and people’s perception of place (AO1). Demonstrates reasonable application of knowledge and understanding to provide a sound analysis that shows some accuracy of how living in an island community affects people’s perception of place (AO2). There must be developed ideas about how living in an island community affects people’s perception of place. There are some attempts to make synoptic links between content from different parts of the course of study but these are not always relevant. Level 1 (1-2 marks) Demonstrates basic knowledge and understanding of life in an island community and people’s perception of place (AO1). Demonstrates basic application of knowledge and understanding to provide a simple analysis that shows limited accuracy of how living in an island community affects people’s perception of place (AO2). This will be shown by including simple ideas about how living in an island community affects people’s perception of place. There are limited attempts to make synoptic links between content from different parts of the course of study. 0 marks No response or no response worthy of credit.
Application of knowledge and understanding to analyse whether living in an island affects people’s perception of place could potentially include:
whether an island community can affect people’s perceptions of that place positively and negatively depending on their level of emotional attachment e.g. how long families have lived there, the types of jobs people have (if they commute off the island to work, people could be less emotionally attached) how involved people are in the community
unique geographical characteristics help shape the cultural traditions of the people e.g. Hawaii, this may influence people’s perception of their place either as a resident or a visitor (tourist) e.g. festivals, aesthetic beauty, recreation and food supplies
influence of global connections (through flows of money, trade and the media) can drive changes in places and people’s perceptions may be fluid and changing
threats to island communities e.g. sea level rise, overfishing, pollution, coastal erosion, decline of coral reefs can change ways of life and potentially erode people’s perception of place as food supplies start to decline, once beautiful areas are less appealing for recreation due to pollution
ocean as a shared resource and source of isolation (geographical remoteness) and how islands build that sense of community and the players involved e.g. community groups (fishing, festivals, parents), local government through to groups of Pacific islands working together.
SPECIMEN

H081/02 Mark Scheme June 20xx
50
Question Answer Marks Guidance
9 (a) Using Fig.4, suggest how the globalisation of the food industry influences place identity. Level 3 (6-8 marks) Demonstrates thorough knowledge and understanding of the globalisation of the food industry and place identity (AO1). Demonstrates thorough application of knowledge and understanding to provide a clear and developed interpretation that shows accuracy of how globalisation of the food industry influences place identity (AO2). This will be shown by including well-developed ideas linking resource evidence on the globalisation of the food industry to place identity. There are clear attempts to make synoptic links between content from different parts of the course of study. Level 2 (3-5 marks) Demonstrates reasonable knowledge and understanding of the globalisation of the food industry and place identity (AO1). Demonstrates reasonable application of knowledge and understanding to provide a sound interpretation that shows some accuracy of how globalisation of the food industry influences place identity (AO2). This will be shown by including developed ideas linking resource evidence on globalisation of the food industry to place identity. There are some attempts to make synoptic links between content from different parts of the course of study but these are
8 AO1 x4 AO2 x4
Indicative content. AO1 – 4 marks Knowledge and understanding of the globalisation of the food industry and place identity could potentially include:
influence of globalisation on the food industry such as increased demand and global tastes
globalisation of the food industry involves greater interconnectedness, increased transnational flows of food, new transport routes and improved access to global food sources
globalisation of the food industry creates a number of opportunities including technological innovation and consumer choice
demographic, socio-economic, cultural, political, built and natural characteristics that shape a place identity
past and present connections that shape the place identity
how shifting flows of people, resources, money, investment and ideas shape the profile of places.
AO2 – 4 marks Application of knowledge and understanding to interpret how globalisation of the food industry influences place identity could potentially include:
Fig. 4 shows, there is now a range of food sources available to the consumer and a variety of food types from different countries. These shifting flows of food resources create a sense of place identity by shaping the socio-economic and cultural profile
different cultural groups living abroad can access their preferred style of food and it may be from their country of origin, as Fig 4 demonstrates
SPECIMEN
H081/02 Mark Scheme June 20xx
51
not always relevant. Level 1 (1-2 marks) Demonstrates basic knowledge and understanding of the globalisation of the food industry and place identity (AO1). Demonstrates basic application of knowledge and understanding to provide a simple interpretation that shows limited accuracy of how globalisation of the food industry influences place identity (AO2). There will be simple ideas linking resource evidence on globalisation of the food industry to place identity. There are limited attempts to make synoptic links between content from different parts of the course of study. 0 marks No response or no response worthy of credit.
improved access to global food sources has increased consumer’s access to different foods and it is these present connections that shape the place identity e.g. multi-cultural area, Asian influence and community
migration helps shape the cultural profile of places. Food and retail outlets are part of the process that creates a clear place identity
the cultural mix of a place can be reflected in a very tangible way through the food outlets and allow residents to gain a cultural identity with their place
local communities can shape the place they live in and give a distinct identity through the introduction of ‘native’ food outlets relating to their culture.
(b) Examine how food security can impact social inequality. Level 3 (6-8 marks) Demonstrates thorough knowledge and understanding of food security and social inequality (AO1). Demonstrates thorough application of knowledge and understanding to provide a clear and developed analysis that shows accuracy of how food security can impact social inequality (AO2). There must be well-developed ideas about how social inequality can impact food security. There are clear attempts to make synoptic links between content from different parts of the course of study. Level 2 (3-5 marks) Demonstrates reasonable knowledge and understanding of
8 AO1 x4 AO2 x4
Indicative content. AO1 – 4 marks Knowledge and understanding of food security and social inequality could potentially include:
food security relates to the ability of all people at all times to have access to sufficient, safe and nutritious food. Food security varies within and between places
social, economic, political factors affecting food security e.g. landownership or land grabbing
human and physical factors have combined to cause issues with food security e.g. Zimbabwe with poor weather affecting harvests as well as government land reform and agricultural policies
regions, countries and people whose food security is most at risk across the development spectrum
concept of social inequality and how this is measured through indices such as housing,
SPECIMEN
H081/02 Mark Scheme June 20xx
52
food security and social inequality (AO1). Demonstrates reasonable application of knowledge and understanding to provide a sound analysis that shows some accuracy of how food security can impact social inequality (AO2). There must be developed ideas about how social inequality can impact food security. There are some attempts to make synoptic links between content from different parts of the course of study but these are not always relevant. Level 1 (1-2 marks) Demonstrates basic knowledge and understanding of food security and social inequality (AO1). Demonstrates basic application of knowledge and understanding to provide a simple analysis that shows limited accuracy of how food security can impact social inequality (AO2). This will be shown by including simple ideas about how social inequality can impact food security. There are limited attempts to make synoptic links between content from different parts of the course of study. 0 marks No response or no response worthy of credit.
healthcare, education, employment and access to services
how and why spatial patterns of social inequalities vary both within and between places
how structural economic change impacts patterns of social opportunities and inequality for people and places.
AO2 – 4 marks Application of knowledge and understanding to analyse how food security can impact social inequality could potentially include:
access and affordability of food is an issue across the development spectrum, whilst LIDCs traditionally have less access to food and a lack of money to buy food, this can be evident in ACs e.g. food banks, soup kitchens. Lack of access to food and it being unaffordable could be an indicator / indices of social inequality
education about what constitutes a healthy diet e.g. nutritional requirements for different groups of people for example children in remote rural areas in LIDCs
foods low in nutritional content and high in food enhancers, salt, and fat are often low cost and therefore the only affordable option to the lowest income groups. Whilst people might be seen to be more food secure the uneven distribution of this resource could create social inequality
organic and some health foods are often high cost and therefore unaffordable to disadvantaged sections of society
for more remote communities across the development spectrum, individuals can be food secure through their own gardens, livestock, access to natural resources and so they are creating opportunities through circumstance and
SPECIMEN
H081/02 Mark Scheme June 20xx
53
so social inequality is potentially lower
a range of factors (that are often interrelated) can influence food security e.g. Darfur has to contend with harsh physical conditions within the Sahel as the region is environmentally fragile and drought prone alongside a civil war which has badly damaged infrastructure. This has created a region where food security is low with high levels of social inequality. The social inequality has been a result of lack of access to land, water and food supplies some of which is the natural environment as well as political instability.
SPECIMEN
H081/02 Mark Scheme June 20xx
54
Question Answer Marks Guidance
10 (a) Using Fig.5, suggest how living in tectonically active areas influences place profiles. Level 3 (6-8 marks) Demonstrates thorough knowledge and understanding of life in tectonically active areas and place profiles (AO1). Demonstrates thorough application of knowledge and understanding to provide a clear and developed interpretation that shows accuracy of how living in tectonically active areas influences place profiles (AO2). This will be shown by including well-developed ideas linking resource evidence on tectonically active areas to place profiles. There are clear attempts to make synoptic links between content from different parts of the course of study. Level 2 (3-5 marks) Demonstrates reasonable knowledge and understanding of life in tectonically active areas and place profiles (AO1). Demonstrates reasonable application of knowledge and understanding to provide a sound interpretation that shows some accuracy of how living in tectonically active areas influences place profiles (AO2). This will be shown by including developed ideas linking resource evidence on tectonically active areas to place profiles. There are some attempts to make synoptic links between content from different parts of the course of study but these
8 AO1 x4 AO2 x4
Indicative content. AO1 – 4 marks Knowledge and understanding of place profiles could potentially include:
reasons why people choose to live in tectonically active locations as a result of volcanic eruptions and / or earthquake activity
the impacts people experience as a result of volcanic eruptions and / or earthquake activity
economic, environmental impacts on a country as a result of volcanic eruptions and / or earthquake activity
demographic, socio-economic, cultural, political, built and natural characteristics that shape a place identity
past and present connections that shape the place identity
how shifting flows of people, resources, money, investment and ideas shape the profile of places.
AO2 – 4 marks Application of knowledge and understanding to interpret how living in tectonically active areas influences place profiles, could potentially include:
Fig. 5, the cartoon shows a man’s understanding of a hazardous environment which may not match reality depending on the past connections that have shaped the identity of Christchurch
the outrage on the man’s face in the cartoon (fig.5) and his statement suggest the newspaper indicates the scale of the Christchurch earthquake to the reader e.g. death toll, and this in time could influence the place profile through economic impacts or outmigration due to the tectonic hazard
SPECIMEN
H081/02 Mark Scheme June 20xx
55
are not always relevant. Level 1 (1-2 marks) Demonstrates basic knowledge and understanding of life in tectonically active areas and place profiles (AO1). Demonstrates basic application of knowledge and understanding to provide a simple interpretation that shows limited accuracy of how living in tectonically active areas can influence place profiles (AO2). This will be shown by including developed ideas linking resource evidence on tectonically active areas to place profiles. There are limited attempts to make synoptic links between content from different parts of the course of study. 0 marks No response or no response worthy of credit
living in a tectonically active area may influence place profiles through the built and natural environments. The built environment could include hazard prevention measures e.g. shock absorbing foundations or shatter proof glass. The natural environment could be shaped by previous volcanic eruptions and so be aesthetically pleasing and fertile soils offer farming potential and therefore economic gains
living in a tectonically active area may influence place profiles through cultural characteristics. Culturally some communities offer sacrifices to volcanoes as they think Gods determine their eruptions. Some cities run earthquake drills due to the common occurrence of the hazard this may worry local people therefore encouraging them to move away creating shifting flows of people
tectonically active areas may have little influence on place profiles due to shifting flows of money and technology which allow for greater mitigation against the earthquake hazard. The resident population may become accustomed to the frequency of the tectonic activity and this becomes part of their day to day life.
(b) Examine how volcanic eruptions can influence people’s emotional attachment to a place. Level 3 (6-8 marks) Demonstrates thorough knowledge and understanding of volcanic eruptions and people’s emotional attachment to place (AO1). Demonstrates thorough application of knowledge and understanding to provide a clear and developed analysis that shows accuracy of how volcanic eruptions can influence emotional attachment to place (AO2). There must be well-developed ideas about how volcanic
8 AO1 x4 AO2 x4
Indicative content. AO1 – 4 marks Knowledge and understanding of volcanic eruptions and people’ emotional attachment to a place, could potentially include:
reasons why people choose to live in tectonically active locations as a result of volcanic eruptions
the impacts people experience as a result of volcanic eruptions
economic and environmental impacts on a country as a result of volcanic eruptions
the degree of risk posed by a hazard and the probability
how and why people perceive places in different
SPECIMEN
H081/02 Mark Scheme June 20xx
56
eruptions influence emotional attachment to place. There are clear attempts to make synoptic links between content from different parts of the course of study. Level 2 (3-5 marks) Demonstrates reasonable knowledge and understanding of volcanic eruptions and people’s emotional attachment to place (AO1). Demonstrates reasonable application of knowledge and understanding to provide a sound analysis that shows some accuracy of how volcanic eruptions influence emotional attachment to place (AO2). There must be developed ideas about how volcanic eruptions influence emotional attachment to place. There are some attempts to make synoptic links between content from different parts of the course of study but these are not always relevant. Level 1 (1-2 marks) Demonstrates basic knowledge and understanding of volcanic eruptions and people’s emotional attachment to place (AO1). Demonstrates basic application of knowledge and understanding to provide a simple analysis that shows limited accuracy of how climate volcanic eruptions influence emotional attachment to place (AO2). This will be shown by including simple ideas about how volcanic eruptions influence emotional attachment to place. There are limited attempts to make synoptic links between content from different parts of the course of study.
ways based on their identity e.g. age, gender, sexuality, religion and role
how level of emotional attachment to place can influence people’s behaviour and activities in a place.
AO2 – 4 marks Application of knowledge and understanding to analyse how volcanic eruptions influence emotional attachment to place could potentially include:
the degree of risk posed by a volcano and how that is translated and conveyed between generations can impact on an individuals and communities perceptions and this will influence their level of emotional attachment e.g. remote communities attach a lot of cultural significance to living near a volcano, it is part of their community and identity
some communities believe a volcano is inhabited by a God / Gods e.g. In Bali locals sleep with their heads towards the volcano. Indonesian’s offer sacrifices to the volcanoes such as goats, money and chickens to bring them prosperity. People’s emotional attachment to the place has a significant impact on their behaviour and culture
volcanic eruptions have influenced people’s activities in the area of Naples, Italy around Mount Vesuvius. Two large eruptions thousands of years ago left thick deposits of tephra which have weathered to form rich, fertile soils. This area is abundant for farming and there are a number of tourist related economic activities
Iceland utilises its tectonic and volcanic activity for economic gain through tourism and geothermal energy and it is very much a part of the countries identity. The geothermal energy and tourism (geysers, volcanoes, geothermal spas) are very much part of people’s daily lives and their way of
SPECIMEN
H081/02 Mark Scheme June 20xx
57
0 marks No response or no response worthy of credit.
supporting themselves, producing food (greenhouses) and a source of revenue (tours, hotels etc.) therefore their emotional attachment to their home / place
perception of volcanic eruptions depends on probability of it happening, the scale of the event and technological advancement to mitigate against the risk. Despite Montserrat last erupting in 1995, the inhabitants from the south of the island still no longer live there as they were evacuated off the island or to the north. Despite people’s emotional attachment to their home, a strong fishing community and tourism industry the continued eruptions have made it too risky to return and there has been very little / no clean up. The perception of risk before 1995 was low as the previous eruption was 300 years ago and yet the long term effects have been devastating on individuals and the community of Montserrat
impact of volcanic eruptions may not be felt in someone’s lifetime but they gain all benefits of living in a beautiful area due to the volcano, soils, farming, tourism potential. They could be emotionally attached to the place due to their family and personal circumstances and the volcanic eruption is not a particular reality to them.
SPECIMEN
H081/02 Mark Scheme June 20xx
58
Question Answer Marks Guidance
11* ‘There is considerable doubt that the world has warmed steadily since the late nineteenth century.’ How far do you agree with this statement? AO1 Level 4 (8-10 marks) Demonstrates comprehensive knowledge and understanding of evidence the world has warmed since the late nineteenth century. Level 3 (5–7 marks) Demonstrates thorough knowledge and understanding of evidence the world has warmed since the late nineteenth century. Level 2 (3-4 marks) Demonstrates reasonable knowledge and understanding of evidence the world has warmed since the late nineteenth century. Level 1 (1–2 marks) Demonstrates basic knowledge and understanding of the evidence the world has warmed since the late nineteenth century. 0 marks No response or no response worthy of credit. AO2 Level 4 (8–10 marks) Demonstrates comprehensive application of knowledge and understanding to provide a clear, developed and convincing analysis that is fully accurate of the evidence of climate change.
20 AO1 x10 AO2 x10
Indicative content AO1 – 10 marks
Knowledge and understanding of evidence that the world has steadily warmed since the late nineteenth century could potentially include:
increase in surface, atmospheric and oceanic temperatures e.g. average surface warming of 0.89oC since late 19th century to 2012
shrinking and thinning of valley glaciers and ice sheets e.g. Greenland and Antarctic ice sheets both shrinking; glaciers likewise in Alps, Andes, Himalayas and Rockies
rising sea levels e.g. globally,19cm since 1900
increasing atmospheric water vapour e.g. increased precipitation being registered in mid-latitude Europe and parts of North America
decreasing extent and thickness of sea ice e.g. Arctic reducing by 4% per decade since 1970s; Antarctica by 1.5% per decade since 1970s
changes in nature (phenology) e.g. spring starting earlier, migration patterns of birds / insects changing
decreasing snow cover means the highly reflective nature of snow can no longer stop heat from the sun’s energy being absorbed by the ground.
AO2 – 10 marks
Application of knowledge and understanding to analyse and evaluate whether there is considerable doubt the world has warmed steadily since the late nineteenth century could potentially include:
rates of change e.g. most of increase (warming)
SPECIMEN
H081/02 Mark Scheme June 20xx
59
Question Answer Marks Guidance
Demonstrates comprehensive application of knowledge and understanding to provide a detailed and substantiated evaluation that offers secure judgements leading to rational conclusions that are evidence based as to whether the world has steadily warmed since the late nineteenth century. Level 3 (5–7 marks) Demonstrates thorough application of knowledge and understanding to provide a clear and developed analysis that shows accuracy of the evidence of climate change. Demonstrates thorough application of knowledge and understanding to provide a detailed evaluation that offers generally secure judgements, with some link between rational conclusions and evidence as to whether the world has steadily warmed since the late nineteenth century. Level 2 (3–4 marks) Demonstrates reasonable application of knowledge and understanding to provide a sound analysis that shows some accuracy of the evidence of climate change. Demonstrates reasonable application of knowledge and understanding to provide a sound evaluation that offers generalised judgements and conclusions, with limited use of evidence as to whether the world has steadily warmed since the late nineteenth century. Level 1 (1–2 marks) Demonstrates basic application of knowledge and understanding to provide a simple analysis that shows limited accuracy of the evidence of climate change. Demonstrates basic application of knowledge and understanding to provide an un-supported evaluation that offers simple conclusions as to whether the world has steadily warmed since the late nineteenth century.
since 1900 occurred in two distinct periods, 1910 – 1945 and since 1980; rate and direction of change not been constant e.g. relatively cool period during 1960s and 1970s
the evidence in the context of different named locations (examples) and comment on whether or not the evidence available allows a judgement to be made about the increase in global temperature e.g. early 20th century warming concentrated in North Atlantic; 1946 – 1975 there was significant cooling in North Atlantic and much of Northern Hemisphere; same period witnessed warming in much of Southern Hemisphere. Whilst some glaciers have been advancing other (90% of observed) glaciers are receding and or thinning
the role of the media and different interest groups in shaping the public image of climate change e.g. growing status of IPCC; influence of national reports e.g. Stern in UK; increasing public role taken up by bodies such as Met Office; role of diverse range of NGOs such as Christian Aid / Greenpeace and RSPB; role and status given to climate sceptics e.g. Nigel Lawson / lobby groups such as those sponsored by some energy companies
international political response to climate change (which began at the Earth Summit in Rio de Janeiro, 1995), this is now very much part of the UN global agenda e.g. COP21 (Paris 2015). The convention set out a framework for action aimed at stabilising atmospheric concentrations of greenhouse gases. The aim was also to create a legally binding and universal agreement on climate, with the aim of keeping global warming below 2 oC
how historical evidence can be less reliable and why current research e.g. pre-1950 far fewer
SPECIMEN
H081/02 Mark Scheme June 20xx
60
Question Answer Marks Guidance
0 marks No response or no response worthy of credit. Quality of extended response
Level 4
There is a well-developed line of reasoning which is clear and
logically structured. The information presented is relevant and
substantiated.
Level 3
There is a line of reasoning presented with some structure. The
information presented is in the most-part relevant and
supported by some evidence.
Level 2
The information has some relevance and is presented with
limited structure. The information is supported by limited
evidence.
Level 1
The information is basic and communicated in an unstructured way. The information is supported by limited evidence and the relationship to the evidence may not be clear.
meteorological recording stations around the globe compared to a much denser network since; improved accuracy and reliability of instruments; new technologies to measure variables such as satellites; use of super-computers to improve data manipulation; upper air observations made systematically since 1940s; sub-surface oceanic temperatures made since 1940s; use of advanced radar and sonar to measure sea ice thickness; increasing number of glaciers now under regular and frequent observation.
SPECIMEN
H081/02 Mark Scheme June 20xx
61
Question Answer Marks Guidance
12* Examine how successful international organisations have been in dealing with climate change. AO1 Level 4 (8-10 marks) Demonstrates comprehensive knowledge and understanding of international organisations responses to climate change. Level 3 (5–7 marks) Demonstrates thorough knowledge and understanding of international organisations responses to climate change. Level 2 (3–4 marks) Demonstrates reasonable knowledge and understanding of international organisations responses to climate change. Level 1 (1–2 marks) Demonstrates basic knowledge and understanding of international organisations responses to climate change. 0 marks No response or no response worthy of credit. AO2 Level 4 (8–10 marks) Demonstrates comprehensive application of knowledge and understanding to provide a clear, developed and convincing analysis that is fully accurate of international organisations responses to climate change. Demonstrates comprehensive application of knowledge and understanding to provide a detailed and substantiated evaluation that offers secure judgements leading to rational conclusions that are evidence based as to how successful international organisations have been in dealing with climate
20 AO1 x10 AO2 x10
Indicative content AO1 – 10 marks
Knowledge and understanding of responses by international organisations to climate change could potentially include:
role of government and NGOs e.g. IPCC / UK Met Office / British Antarctic Survey / NOAA in research into the causes of climate change and in publicising their findings
trans-national government e.g. international conferences (e.g. Paris 2015; Copenhagen 2009; Bali 2007; Kyoto 1997) and their targets and agreements
trans-national and national government e.g. carbon trading e.g. EUETS (European Union Emission Trading Scheme)
the actions of non-governmental organisations such as pressure groups e.g. Friends of the Earth and NGOs e.g. WWF, in educating and promoting low-carbon living
an appreciation that responses can be at different scales (global, national and local initiatives) and at a governmental and non-governmental levels.
AO2 – 10 marks
Application of knowledge and understanding to analyse and evaluate how successful international organisations have been in dealing with climate change could potentially include:
the contested research and findings of groups such as IPCC / Met Office; the views of individuals and groups e.g. Profs Stott and Lomborg and a variety of think-tanks e.g. Nigel
SPECIMEN
H081/02 Mark Scheme June 20xx
62
Question Answer Marks Guidance
change. Level 3 (5–7 marks) Demonstrates thorough application of knowledge and understanding to provide a clear and developed analysis that shows accuracy of international organisations responses to climate change. Demonstrates thorough application of knowledge and understanding to provide a detailed evaluation that offers generally secure judgements, with some link between rational conclusions as to how successful international organisations have been in dealing with climate change. Level 2 (3–4 marks) Demonstrates reasonable application of knowledge and understanding to provide a sound analysis that shows some accuracy of international organisations responses to climate change. Demonstrates reasonable application of knowledge and understanding to provide a sound evaluation that offers generalised judgements and conclusions, with limited use of evidence as to how successful international organisations have been in dealing with climate change. Level 1 (1–2 marks) Demonstrates basic application of knowledge and understanding to provide a simple analysis that shows limited accuracy of international organisations responses to climate change. Demonstrates basic application of knowledge and understanding to provide an un-supported evaluation that offers simple conclusions as to how successful international organisations have been in dealing with climate change.
Lawson’s Global Warming Policy Foundation
trans-national government e.g. international conferences – complex ways they can be set up e.g. Kyoto not ratified until 2005, five years after the conference; no ‘teeth’ regarding those countries failing to meet their targets; some countries not ratifying
attempts by international organisations to cut greenhouse gas emissions such as energy efficiency and conservation, fuel shifts, geoengineering, carbon capture e.g. promotion / subsidy of renewable energy such as solar and wind
issue of ‘tragedy of the commons’ appropriate here; atmosphere is a shared resource which is not ‘owned’ by any one country and pollution (CO2) soon dispersed
successfulness of international organisations in outing climate change on the global agenda to ensure countries sign up to binding international agreements e.g. COP21
pros and cons of carbon trading schemes e.g. European Union Emission Trading System (ETS). From 2005, 11,000 power stations and industrial plants in 30 countries (make up 50% of Europe’s total) have their emissions capped. Companies can trade their allowances encouraging them to cut their emissions
fundamental issue of persuading general public to change their attitudes and behaviours e.g. shift from private to public transport
cost of national and international infrastructure schemes to reduce carbon production e.g. investment in transport; investment in renewable energies
challenges associated with effective mitigation,
SPECIMEN

H081/02 Mark Scheme June 20xx
63
Question Answer Marks Guidance
0 marks No response or no response worthy of credit. Quality of extended response
Level 4
There is a well-developed line of reasoning which is clear and
logically structured. The information presented is relevant and
substantiated.
Level 3
There is a line of reasoning presented with some structure. The
information presented is in the most-part relevant and
supported by some evidence.
Level 2
The information has some relevance and is presented with
limited structure. The information is supported by limited
evidence.
Level 1
The information is basic and communicated in an unstructured way. The information is supported by limited evidence and the relationship to the evidence may not be clear.
have implications for successfulness e.g. renewable energies, new technologies, high-tech subway stations, protecting carbon sinks (forests and oceans)
International organisations need to be encouraging a coordinated approach at a range of scales to ensure the success of strategies to deal with climate change e.g. agreements over greenhouse gas emissions.
SPECIMEN
H081/02 Mark Scheme June 20xx
64
Question Answer Marks Guidance
13* Examine the view that communicable diseases are dealt with more successfully than noncommunicable diseases. AO1 Level 4 (8-10 marks) Demonstrates comprehensive knowledge and understanding of strategies to deal with communicable and noncommunicable diseases. Level 3 (5–7 marks) Demonstrates thorough knowledge and understanding of strategies to deal with communicable and noncommunicable diseases. Level 2 (3-4 marks) Demonstrates reasonable knowledge and understanding of strategies to deal with communicable and noncommunicable diseases. Level 1 (1–2 marks) Demonstrates basic knowledge and understanding of strategies to deal with communicable and noncommunicable diseases. 0 marks No response or no response worthy of credit. AO2 Level 4 (8–10 marks) Demonstrates comprehensive application of knowledge and understanding to provide a clear, developed and convincing analysis that is fully accurate of strategies to deal with communicable and noncommunicable diseases.
20 AO1 x10 AO2 x10
Indicative content AO1 – 10 marks
Knowledge and understanding of the strategies to deal with communicable and noncommunicable diseases could potentially include:
basic distinction between communicable (infectious or contagious) diseases and noncommunicable (non-infectious or non-contagious) diseases e.g. measles and dementia
modes of transmission of communicable diseases e.g. by air (measles); by blood (HIV/AIDS); by water (cholera); by human contact (herpes); by non-human organisms (malaria) e.g. vectors (mosquitoes)
noncommunicable by nature do not spread e.g. disease from ageing (cancers, dementia); lifestyle diseases (obesity); disease linked with environmental change e.g. pollution
direct and indirect strategies used by government and international agencies aimed at tackling communicable e.g. smallpox, typhoid, ebola and noncommunicable diseases e.g. cancers and dementia
role of international organisations e.g. World Health Organization and their strategies to combat diseases for both communicative and noncommunicative
role of an NGO in dealing with a disease outbreak at a national and local level e.g. HIV / AIDS or Ebola
AO2 – 10 marks
SPECIMEN

H081/02 Mark Scheme June 20xx
65
Question Answer Marks Guidance
Demonstrates comprehensive application of knowledge and understanding to provide a detailed and substantiated evaluation that offers secure judgements leading to rational conclusions that are evidence based as to whether communicable diseases are dealt with more successfully than noncommunicable diseases. Level 3 (5–7 marks) Demonstrates thorough application of knowledge and understanding to provide a clear and developed analysis that shows accuracy of strategies to deal with communicable and noncommunicable diseases. Demonstrates thorough application of knowledge and understanding to provide a detailed evaluation that offers generally secure judgements, with some link between rational conclusions and evidence as to whether communicable diseases are dealt with more successfully than noncommunicable diseases. Level 2 (3–4 marks) Demonstrates reasonable application of knowledge and understanding to provide a sound analysis that shows some accuracy of strategies to deal with communicable and noncommunicable diseases. Demonstrates reasonable application of knowledge and understanding to provide a sound evaluation that offers generalised judgements and conclusions, with limited use of evidence as to whether communicable diseases are dealt with more successfully than noncommunicable diseases. Level 1 (1–2 marks) Demonstrates basic application of knowledge and understanding to provide a simple analysis that shows limited accuracy of strategies to deal with communicable and noncommunicable diseases.
Application of knowledge and understanding to analyse and evaluate whether communicable diseases are dealt with more successfully than noncommunicable diseases could potentially include:
wide range of causes of disease and this is very much dependant on the disease itself. The fact that some diseases can be passed on to humans via animals, vectors and other humans means these diseases have the potential to become more prevalent due to their rate of spread. Any strategies therefore need to combat the rate of spread and minimise the impacts
social factors affecting the spread of disease e.g. level of education in a country which influences quality and quantity of health care; level of education of individuals which influences their knowledge and understanding about disease and its spread including attitudes towards vaccination; attitudes and life styles such as death rites, sexual relationships, obesity; migration patterns
economic factors affecting the spread of disease e.g. financial resources of a country to provide health care; financial resources of individuals to provide their own health care such as access to health care, quality of housing, quality and quantity of diet; financial resources to afford supply of clean water and treatment of polluted water / sewage
political factors affecting the spread of disease e.g. approaches to spending on health care; attitudes towards vaccination / immunisation programmes such as compulsory or not; measures adopted when an outbreak occurs e.g. border controls; the impact of political
SPECIMEN
H081/02 Mark Scheme June 20xx
66
Question Answer Marks Guidance
Demonstrates basic application of knowledge and understanding to provide an un-supported evaluation that offers simple conclusions as to whether communicable diseases are dealt with more successfully than noncommunicable diseases. 0 marks No response or no response worthy of credit.
Quality of extended response
Level 4
There is a well-developed line of reasoning which is clear and
logically structured. The information presented is relevant and
substantiated.
Level 3
There is a line of reasoning presented with some structure. The
information presented is in the most-part relevant and
supported by some evidence.
Level 2
The information has some relevance and is presented with
limited structure. The information is supported by limited
evidence.
Level 1
The information is basic and communicated in an unstructured way. The information is supported by limited evidence and the relationship to the evidence may not be clear.
tension / war on the spread of disease
physical / environmental factors affecting the spread of disease e.g. climate; weather patterns such as monsoon; life cycles of vectors such as insects; obstacles to distributing health care such as remote mountain regions or dense tropical forest
for a communicable disease such as H1N1 swine ‘flu or SARS the global scale of the outbreak compared to a local scale disease ‘cluster’ e.g. measles outbreak in South Wales 2012-3. The global scale of H1N1 and / or SARS has implications for how they are dealt with due to the number of national and international agencies involved, level of coordination, funding and at what time period the disease is ‘caught’ will affect rate of spread and containment
noncommunicable diseases can be mitigated over longer period with strategies escalating in scale of response e.g. national campaign (Stoptober and ACT F.A.S.T – strokes) versus an individual doctor. The success in dealing with these diseases can be down to people’s lifestyle choices through diet, exercise, non-smoking, alcohol and sugar consumption.
SPECIMEN
H081/02 Mark Scheme June 20xx
67
Question Answer Marks Guidance
14* Examine the extent to which technology can reduce the threats of disease. AO1 Level 4 (8-10 marks) Demonstrates comprehensive knowledge and understanding of different ways to reduce threats from disease. Level 3 (5–7 marks) Demonstrates thorough knowledge and understanding of different ways to reduce threats from disease. Level 2 (3-4 marks) Demonstrates reasonable knowledge and understanding of different ways to reduce threats from disease. Level 1 (1–2 marks) Demonstrates basic knowledge and understanding of different ways to reduce threats from disease. 0 marks No response or no response worthy of credit. AO2 Level 4 (8–10 marks) Demonstrates comprehensive application of knowledge and understanding to provide a clear, developed and convincing analysis that is fully accurate of how different ways to reduce threats from disease are aided by technology. Demonstrates comprehensive application of knowledge and understanding to provide a detailed and substantiated evaluation that offers secure judgements leading to rational conclusions that are evidence based as to the extent to which
20 AO1 x10 AO2 x10
Indicative content AO1 – 10 marks
Knowledge and understanding of the different ways to reduce threats from disease could potentially include:
prediction e.g. monitoring of population for early detection of disease e.g. screening programmes
prediction e.g. forecast likely strain of disease such as ‘flu so that technology (vaccines) can be prepared
prevention e.g. immunisation programmes such as smallpox, polio and measles
prevention - technology used to distribute medicines e.g. refrigeration for some vaccines
prevention e.g. technology used to treat and distribute clean water and dispose sewage safely
treatment e.g. use of bio-technology such as scanners to give more precise internal image thereby aiding surgery, radio-therapy and machines carrying out advanced analysis of biopsy samples
treatment and prevention e.g. lasers, key-hole surgery, transplants, radio- and chemo-therapy
drug manufacturing (e.g. biotechnology) and global flows for distribution, top down strategies to deal with disease risk and eradication
medicines from nature and their medicinal importance for disease.
AO2 – 10 marks
Application of knowledge and understanding to
SPECIMEN

H081/02 Mark Scheme June 20xx
68
Question Answer Marks Guidance
technology can reduce threats from disease. Level 3 (5–7 marks) Demonstrates thorough application of knowledge and understanding to provide a clear and developed analysis that shows accuracy of how different ways to reduce threats from disease are aided by technology. Demonstrates thorough application of knowledge and understanding to provide a detailed evaluation that offers generally secure judgements, with some link between rational conclusions and evidence as to the extent to which technology can reduce threats from disease. Level 2 (3–4 marks) Demonstrates reasonable application of knowledge and understanding to provide a sound analysis that shows some accuracy of how different ways to reduce threats from disease are aided by technology. Demonstrates reasonable application of knowledge and understanding to provide a sound evaluation that offers generalised judgements and conclusions, with limited use of evidence as to the extent to which technology can reduce threats from disease. Level 1 (1–2 marks) Demonstrates basic application of knowledge and understanding to provide a simple analysis that shows limited accuracy of how different ways to reduce threats from disease are aided by technology. Demonstrates basic application of knowledge and understanding to provide an un-supported evaluation that offers simple conclusions as to the extent to which technology can reduce threats from disease.
analyse and evaluate the extent to which technology can reduce the threats of disease could potentially include:
reducing the threats of disease requires prediction technologies, global monitoring to ensure effective mitigation strategies at international and national scales e.g. GIS, disease prediction models, biotech research, national data gathering (UK breast cancer study of 100,000 women)
a clear divide exists across the development continuum regarding ability of countries to provide technology to combat disease; medical technology often requires much capital and human resourcing
differential provision of technology (vaccination programs) within a country e.g. urban – rural contrasts as well as regional differences such as core-periphery
some disease threats are proving difficult to combat e.g. some cancers, Alzheimer’s, sleeping sickness, dengue fever
the emergence of resistant bacteria due to the over-use of technology in the form of antibiotics e.g. anti-malarial resistant mosquitoes
political factors influencing the use of technology e.g. HIV/AIDs drug manufacturers owned by ACs charging high prices and patenting of drugs affecting access by LIDCs to these products
social factors acting against technology such as attitudes towards sexual relations and intra-venous drug use for example in the spread of HIV/AIDs; attitudes towards life-style causes of disease e.g. tobacco and alcohol and certain
SPECIMEN

H081/02 Mark Scheme June 20xx
69
Question Answer Marks Guidance
0 marks No response or no response worthy of credit. Quality of extended response
Level 4
There is a well-developed line of reasoning which is clear and
logically structured. The information presented is relevant and
substantiated.
Level 3
There is a line of reasoning presented with some structure. The
information presented is in the most-part relevant and
supported by some evidence.
Level 2
The information has some relevance and is presented with
limited structure. The information is supported by limited
evidence.
Level 1
The information is basic and communicated in an unstructured way. The information is supported by limited evidence and the relationship to the evidence may not be clear.
types of food / diet linked to obesity
sliding scale of technology, for isolated communities solar panels on a medical centre to refrigerate medicines reduces the threat or the WHO / UN providing mosquito nets as part of the Millennium Development Goals through to patenting of drugs e.g. global drug manufacturing (GlaxoSmithKline)
technology to reduce the disease threat can be relative e.g. medicinal plants from nature can be used to combat diseases and / or the symptoms of and for some communities refining their use (e.g. cooking, drying etc.) could be a low tech solution.
SPECIMEN

H081/02 Mark Scheme June 20xx
70
Question Answer Marks Guidance
15* Examine the extent to which oceanic waters are being altered by human activity. AO1 Level 4 (8-10 marks) Demonstrates comprehensive knowledge and understanding of the human activities altering oceanic waters. Level 3 (5–7 marks) Demonstrates thorough knowledge and understanding of the human activities altering oceanic waters. Level 2 (3–4 marks) Demonstrates reasonable knowledge and understanding of the human activities altering oceanic waters. Level 1 (1–2 marks) Demonstrates basic knowledge and understanding of the human activities altering oceanic waters. 0 marks No response or no response worthy of credit. AO2 Level 4 (8–10 marks) Demonstrates comprehensive application of knowledge and understanding to provide a clear, developed and convincing analysis that is fully accurate of how human activities alter oceanic waters. Demonstrates comprehensive application of knowledge and understanding to provide a detailed and substantiated evaluation that offers secure judgements leading to rational conclusions that are evidence based of the extent to which human activities alter oceanic waters.
20 AO1 x10 AO2 x10
Indicative content AO1 – 10 marks
Knowledge and understanding of how human activities are altering oceanic waters, could potentially include:
rising temperatures of ocean waters due to enhanced greenhouse effect caused by human activities and the effects on marine environments e.g. coral bleaching
rising sea level due to thermal expansion of water (primary reason) and transfer of land-ice / snow to oceans
changes in ocean currents e.g. North Atlantic circulation due to increased flows of fresh water from ice / snow melt due to global warming
extent and thickness of sea ice both in Arctic and around the Antarctic e.g. ice shelves
use and management of ocean biological resources, energy resources and sea bed minerals
major sources of pollutants e.g. fossil fuels, domestic and industrial waste (plastics, nuclear waste, oil spill) and the impact on marine ecosystems
acidification of ocean waters due to absorption of CO2 from the atmosphere
human activities on land can lead to alterations in oceanic water e.g. deforestation leads to increases in sediment levels in rivers. These transport sediment into coastal oceanic waters increasing turbidity which can effect ecosystems such as corals e.g. Great Barrier Reef
AO2 – 10 marks
Application of knowledge and understanding to
SPECIMEN
H081/02 Mark Scheme June 20xx
71
Question Answer Marks Guidance
Level 3 (5–7 marks) Demonstrates thorough application of knowledge and understanding to provide a clear and developed analysis that shows accuracy of how human activities alter oceanic waters. Demonstrates thorough application of knowledge and understanding to provide a detailed evaluation that offers generally secure judgements, with some link between rational conclusions and evidence of the extent to which extent to which human activities alter oceanic waters. Level 2 (3–4 marks) Demonstrates reasonable application of knowledge and understanding to provide a sound analysis that shows some accuracy of how human activities alter oceanic waters. Demonstrates reasonable application of knowledge and understanding to provide a sound evaluation that offers generalised judgements and conclusions, with limited use of evidence of the extent to which human activities alter oceanic waters. Level 1 (1–2 marks) Demonstrates basic application of knowledge and understanding to provide a simple analysis that shows limited accuracy how which human activities alter oceanic waters. Demonstrates basic application of knowledge and understanding to provide an un-supported evaluation that offers simple conclusions of the extent to which human activities alter oceanic waters. 0 marks No response or no response worthy of credit.
analyse and evaluate the extent to which oceanic waters are being altered by human activity could potentially include:
the extent to which anthropogenic climate change has affected the nature of the ocean’s water in terms of acidity, the current rate of acidification has not been seen in the last 400,000 years. Ocean science is relatively new, meaning that knowledge and understanding of oceanic processes requires much more research
rising oceanic water temperatures linked to global warming and atmospheric CO2 levels, current rate of increase in CO2 exceeds rates recorded in past 800,000 years (Antarctic ice cores)
reductions in annual average Arctic sea ice accelerating, satellite and submarine data now conclusive
melting of Antarctic ice less clear; some small ice shelves have collapsed e.g. Larsen A in 1995 although others not so affected e.g. Wilkins
some rivers naturally high in suspended sediments which means that coastal oceanic waters close to their mouths have relatively high sediment content. However, human activity (e.g. deforestation and sea-bed mining) known to add high volumes of sediment into oceanic waters
Deep Water Horizon oil well explosion (2010), the oil spill was approximately 3.2 million barrels over 87 days, with a huge environmental impact. The marshlands of the Gulf coast were covered in oil, the fishing industry saw large impacts on fish stocks (shrimp) as well as the impact on birds, turtles and dolphins in the marine ecosystem
biological resource extraction (fishing), with advances in fishing equipment, larger ships with tracking technologies mean fish stocks are now being significantly reduced. Fishing techniques
SPECIMEN
H081/02 Mark Scheme June 20xx
72
Question Answer Marks Guidance
Quality of extended response
Level 4
There is a well-developed line of reasoning which is clear and
logically structured. The information presented is relevant and
substantiated.
Level 3
There is a line of reasoning presented with some structure. The
information presented is in the most-part relevant and
supported by some evidence.
Level 2
The information has some relevance and is presented with
limited structure. The information is supported by limited
evidence.
Level 1
The information is basic and communicated in an unstructured way. The information is supported by limited evidence and the relationship to the evidence may not be clear.
such as dredging and trawling cause impacts to marine habitats and organisms on the sea bed
extent of oceanic waters being altered depends on the ability of oceans to absorb, filter and distribute a variety of waste products. A number of international and national strategies have been put in place to protect the ocean e.g. fishing quotas, marine pollution conventions, UN World Ocean Assessment.
SPECIMEN

H081/02 Mark Scheme June 20xx
73
Question Answer Marks Guidance
16* Assess the effectiveness of stakeholders in the management of one oceanic resource. AO1 Level 4 (8-10 marks) Demonstrates comprehensive knowledge and understanding of how stakeholders manage an oceanic resource. Level 3 (5-7 marks) Demonstrates thorough knowledge and understanding of how stakeholders manage an oceanic resource. Level 2 (3–4 marks) Demonstrates reasonable knowledge and understanding of how stakeholders manage an oceanic resource. Level 1 (1–2 marks) Demonstrates basic knowledge and understanding of how stakeholders manage an oceanic resource. 0 marks No response or no response worthy of credit. AO2 Level 4 (8–10 marks) Demonstrates comprehensive application of knowledge and understanding to provide a clear, developed and convincing analysis that is fully accurate of how stakeholders manage an oceanic resource. Demonstrates comprehensive application of knowledge and understanding to provide a detailed and substantiated evaluation that offers secure judgements leading to rational conclusions that are evidence based as to the effectiveness of various stakeholders in the management of an oceanic resource.
20 AO1 x10 AO2 x10
Indicative content AO1 – 10 marks
Knowledge and understanding of one oceanic resource and the stakeholders involved in its management could potentially include:
use and management of renewable biological resources e.g. fish, whales and krill
use and management of ocean energy resources e.g. oil, gas, wave and tidal
use and management of sea-bed minerals as non-renewable resources e.g. ferrous (iron ore and manganese) and non-ferrous (gold and copper)
management strategies for ocean resources e.g. quotas, whaling rights, international treaties, marine conservation areas, access to areas of the sea and international laws
there will be a variety of stakeholders involved in the management of ocean resources at a range of scales e.g. small island communities, national governments – territorial waters, Exclusive Economic Zones, trans-national governments e.g. EU - Common Fisheries Policy and international agencies such as the United Nations e.g. UNCLOS agreement.
AO2 – 10 marks
Application of knowledge and understanding to analyse and evaluate the effectiveness of stakeholders in the management of one oceanic resource could potentially include:
the relative importance of the approach of a range of stakeholders e.g. whaling is a very contested resource with differing positions being strongly defended by various nations e.g. Japan and Norway compared to Australia
SPECIMEN

H081/02 Mark Scheme June 20xx
74
Question Answer Marks Guidance
Level 3 (5–7 marks) Demonstrates thorough application of knowledge and understanding to provide a clear and developed analysis that shows accuracy of how stakeholders manage an oceanic resource. Demonstrates thorough application of knowledge and understanding to provide a detailed evaluation that offers generally secure judgements, with some link between rational conclusions and evidence as to the effectiveness of various stakeholders in the management of an oceanic resource. Level 2 (3–4 marks) Demonstrates reasonable application of knowledge and understanding to provide a sound analysis that shows some accuracy of how stakeholders manage an oceanic resource. Demonstrates reasonable application of knowledge and understanding to provide a sound evaluation that offers generalised judgements and conclusions, with limited use of evidence as to the effectiveness of various stakeholders in the management of an oceanic resource. Level 1 (1–2 marks) Demonstrates basic application of knowledge and understanding to provide a simple analysis that shows limited accuracy of how stakeholders manage an oceanic resource. Demonstrates basic application of knowledge and understanding to provide an un-supported evaluation that offers simple conclusions as to the effectiveness of various stakeholders in the management of an oceanic resource. 0 marks No response or no response worthy of credit.
the effectiveness of the various stakeholders in the management of an oceanic resource e.g. EU and fisheries; International Whaling Commission and whale catches for ‘scientific’ purposes; managing activities though treaties and laws (‘high seas’) also the idea of the ‘tragedy of the commons’ where resources are depleted
whether collaborative approaches from stakeholders have been more effective e.g. EU Common Fisheries Policy or the Antarctic Treaty
how the values, attitudes, socio-economic status and political context of the stakeholders influence the use and management of the resource e.g. the cultural importance of whales in Japan and amongst various Inuit peoples; political influence of governments on off-shore oil and gas exploitation e.g. US, Norway and UK
the resilience of the resource and key thresholds to initiate management e.g. resources such as fish and whales are potentially renewable whereas minerals and energy resources are non-renewable and finite in nature
different species of fish / whales have different thresholds for effective management and possess varying levels of resilience e.g. recovery of cod stocks in North Sea. However, accurate and reliable data e.g. stock levels can be difficult to obtain.
SPECIM
EN
H081/02 Mark Scheme June 20xx
75
Question Answer Marks Guidance
Quality of extended response
Level 4
There is a well-developed line of reasoning which is clear and
logically structured. The information presented is relevant and
substantiated.
Level 3
There is a line of reasoning presented with some structure.
The information presented is in the most-part relevant and
supported by some evidence.
Level 2
The information has some relevance and is presented with
limited structure. The information is supported by limited
evidence.
Level 1
The information is basic and communicated in an unstructured way. The information is supported by limited evidence and the relationship to the evidence may not be clear.
SPECIMEN
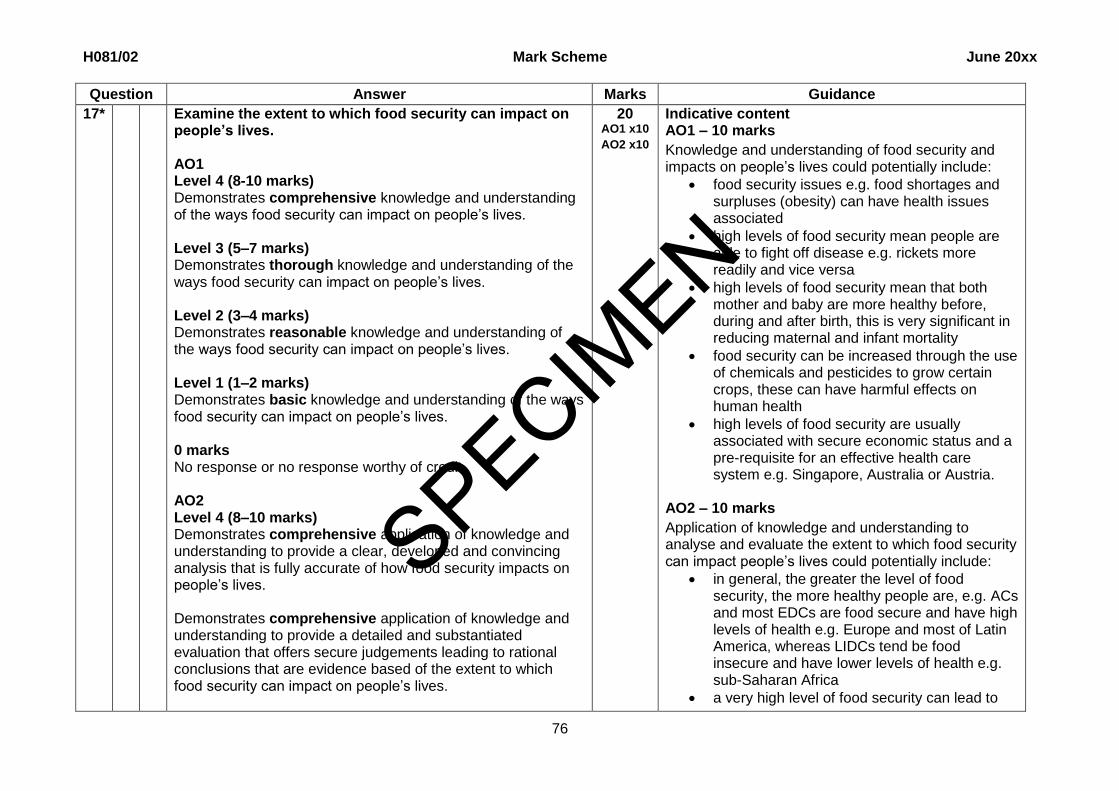
H081/02 Mark Scheme June 20xx
76
Question Answer Marks Guidance
17* Examine the extent to which food security can impact on people’s lives. AO1 Level 4 (8-10 marks) Demonstrates comprehensive knowledge and understanding of the ways food security can impact on people’s lives. Level 3 (5–7 marks) Demonstrates thorough knowledge and understanding of the ways food security can impact on people’s lives. Level 2 (3–4 marks) Demonstrates reasonable knowledge and understanding of the ways food security can impact on people’s lives. Level 1 (1–2 marks) Demonstrates basic knowledge and understanding of the ways food security can impact on people’s lives. 0 marks No response or no response worthy of credit. AO2 Level 4 (8–10 marks) Demonstrates comprehensive application of knowledge and understanding to provide a clear, developed and convincing analysis that is fully accurate of how food security impacts on people’s lives. Demonstrates comprehensive application of knowledge and understanding to provide a detailed and substantiated evaluation that offers secure judgements leading to rational conclusions that are evidence based of the extent to which food security can impact on people’s lives.
20 AO1 x10 AO2 x10
Indicative content AO1 – 10 marks
Knowledge and understanding of food security and impacts on people’s lives could potentially include:
food security issues e.g. food shortages and surpluses (obesity) can have health issues associated
high levels of food security mean people are able to fight off disease e.g. rickets more readily and vice versa
high levels of food security mean that both mother and baby are more healthy before, during and after birth, this is very significant in reducing maternal and infant mortality
food security can be increased through the use of chemicals and pesticides to grow certain crops, these can have harmful effects on human health
high levels of food security are usually associated with secure economic status and a pre-requisite for an effective health care system e.g. Singapore, Australia or Austria.
AO2 – 10 marks
Application of knowledge and understanding to analyse and evaluate the extent to which food security can impact people’s lives could potentially include:
in general, the greater the level of food security, the more healthy people are, e.g. ACs and most EDCs are food secure and have high levels of health e.g. Europe and most of Latin America, whereas LIDCs tend be food insecure and have lower levels of health e.g. sub-Saharan Africa
a very high level of food security can lead to
SPECIMEN
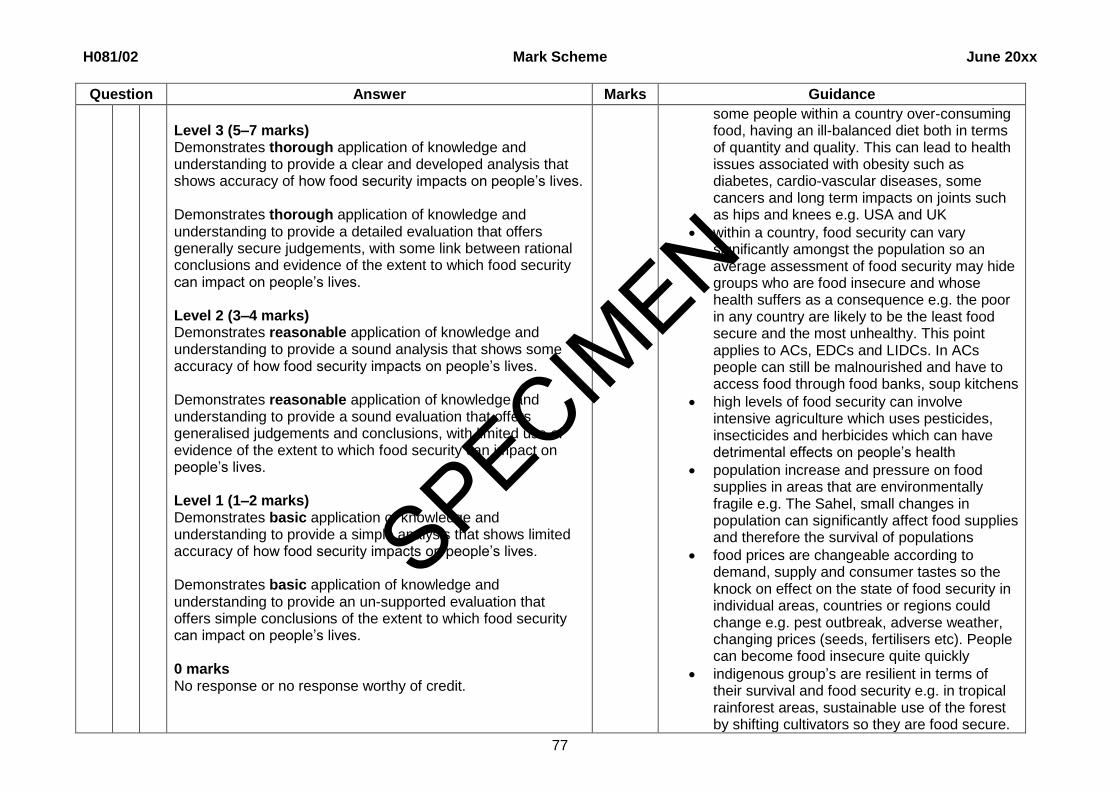
H081/02 Mark Scheme June 20xx
77
Question Answer Marks Guidance
Level 3 (5–7 marks) Demonstrates thorough application of knowledge and understanding to provide a clear and developed analysis that shows accuracy of how food security impacts on people’s lives. Demonstrates thorough application of knowledge and understanding to provide a detailed evaluation that offers generally secure judgements, with some link between rational conclusions and evidence of the extent to which food security can impact on people’s lives. Level 2 (3–4 marks) Demonstrates reasonable application of knowledge and understanding to provide a sound analysis that shows some accuracy of how food security impacts on people’s lives. Demonstrates reasonable application of knowledge and understanding to provide a sound evaluation that offers generalised judgements and conclusions, with limited use of evidence of the extent to which food security can impact on people’s lives. Level 1 (1–2 marks) Demonstrates basic application of knowledge and understanding to provide a simple analysis that shows limited accuracy of how food security impacts on people’s lives. Demonstrates basic application of knowledge and understanding to provide an un-supported evaluation that offers simple conclusions of the extent to which food security can impact on people’s lives. 0 marks No response or no response worthy of credit.
some people within a country over-consuming food, having an ill-balanced diet both in terms of quantity and quality. This can lead to health issues associated with obesity such as diabetes, cardio-vascular diseases, some cancers and long term impacts on joints such as hips and knees e.g. USA and UK
within a country, food security can vary significantly amongst the population so an average assessment of food security may hide groups who are food insecure and whose health suffers as a consequence e.g. the poor in any country are likely to be the least food secure and the most unhealthy. This point applies to ACs, EDCs and LIDCs. In ACs people can still be malnourished and have to access food through food banks, soup kitchens
high levels of food security can involve intensive agriculture which uses pesticides, insecticides and herbicides which can have detrimental effects on people’s health
population increase and pressure on food supplies in areas that are environmentally fragile e.g. The Sahel, small changes in population can significantly affect food supplies and therefore the survival of populations
food prices are changeable according to demand, supply and consumer tastes so the knock on effect on the state of food security in individual areas, countries or regions could change e.g. pest outbreak, adverse weather, changing prices (seeds, fertilisers etc). People can become food insecure quite quickly
indigenous group’s are resilient in terms of their survival and food security e.g. in tropical rainforest areas, sustainable use of the forest by shifting cultivators so they are food secure.
SPECIMEN

H081/02 Mark Scheme June 20xx
78
Question Answer Marks Guidance
Quality of extended response
Level 4
There is a well-developed line of reasoning which is clear and
logically structured. The information presented is relevant and
substantiated.
Level 3
There is a line of reasoning presented with some structure. The
information presented is in the most-part relevant and
supported by some evidence.
Level 2
The information has some relevance and is presented with
limited structure. The information is supported by limited
evidence.
Level 1
The information is basic and communicated in an unstructured way. The information is supported by limited evidence and the relationship to the evidence may not be clear.
However, challenges to their food security are created by declining soil fertility, soil erosion and flooding
large scale commercial agriculture in tropical rainforest areas can be unsustainable creating lasting impacts on the environment and its ability to be able to support resident populations. Rates of deforestation affect the biodiversity of the forest, creates soil erosion and land degradation as soils are overgrazed and planted.
SPECIMEN

H081/02 Mark Scheme June 20xx
79
Question Answer Marks Guidance
18* ‘Globalisation of the food industry creates more opportunities than issues.’ How far do you agree with this statement. AO1 Level 4 (8-10 marks) Demonstrates comprehensive knowledge and understanding of opportunities and issues created by globalisation of the food industry. Level 3 (5–7 marks) Demonstrates thorough knowledge and understanding of opportunities and issues created by globalisation of the food industry. Level 2 (3–4 marks) Demonstrates reasonable knowledge and understanding of opportunities and issues created by globalisation of the food industry. Level 1 (1–2 marks) Demonstrates basic knowledge and understanding of opportunities and issues created by globalisation of the food industry. 0 marks No response or no response worthy of credit. AO2 Level 4 (8–10 marks) Demonstrates comprehensive application of knowledge and understanding to provide a clear, developed and convincing analysis that is fully accurate as to how globalisation of the food industry creates opportunities and issues. Demonstrates comprehensive application of knowledge and understanding to provide a detailed and substantiated
20 AO1 x10 AO2 x10
Indicative content AO1 – 10 marks
Knowledge and understanding of opportunities and issues created by globalisation of the food industry could potentially include:
influence of globalisation on the food industry e.g. increased demand (e.g. meat) and global tastes (e.g. western foods in China)
the roles of TNCs and agribusinesses involved in food production e.g. Unilever and Monsanto
the roles of TNCs and other businesses involved in food processing, transport, distribution and retailing e.g. Nestlé, Unilever and Walmart
the roles of governments and organisations e.g. trans-national (EU / UN / FAO / WTO), national e.g. UK, on agricultural policies and other policies impacting on food production e.g. environmental programmes.
AO2 – 10 marks
Application of knowledge and understanding to analyse and evaluate whether the globalisation of the food industry creates more opportunities than issues could potentially include:
the role of key players who influence production within the global food system and the extent to which they bring about change e.g. the use of GM crops; the loss of family farms to agribusinesses
the role of food processors, distributors and retailers on the global food system e.g. the role of TNC retailers e.g. Walmart in determining what farmers grow, where and when
the role of players/stakeholders e.g. FAO and WTO on the global food system e.g. the generally positive view of the FAO in improving food security and achieving rural development
SPECIMEN

H081/02 Mark Scheme June 20xx
80
Question Answer Marks Guidance
evaluation that offers secure judgements leading to rational conclusions that are evidence based as to whether the globalisation of the food industry creates more opportunities than issues. Level 3 (5–7 marks) Demonstrates thorough application of knowledge and understanding to provide a clear and developed analysis that shows accuracy as to how globalisation of the food industry creates opportunities and issues. Demonstrates thorough application of knowledge and understanding to provide a detailed evaluation that offers generally secure judgements, with some link between rational conclusions and evidence as to whether the globalisation of the food industry creates more opportunities than issues. Level 2 (3–4 marks) Demonstrates reasonable application of knowledge and understanding to provide a sound analysis that shows some accuracy as to how globalisation of the food industry creates opportunities and issues. Demonstrates reasonable application of knowledge and understanding to provide a sound evaluation that offers generalised judgements and conclusions, with limited use of evidence as to whether the globalisation of the food industry creates more opportunities than issues. Level 1 (1–2 marks) Demonstrates basic application of knowledge and understanding to provide a simple analysis that shows limited accuracy as to how globalisation of the food industry creates opportunities and issues. Demonstrates basic application of knowledge and
compared to the WTO which to some serves the best interests of ACs more than others such as the LIDCs
the role of changing consumer tastes as a result of globalisation on the global food system e.g. increased demand for ‘exotic’ and staple foods all year round in ACs such as strawberries, avocados and runner beans
the effect of rising demand for meat in EDCs and LIDCs as living standards for some of their populations rise and the ‘westernisation’ of diets through globalisation processes e.g. East and South East Asia
the extent to which climate change is causing change to the global food system e.g. the availability of water, hotter temperatures or the spread of certain pests. Agricultural produce could be genetically modified to cope with these changes
food miles have increased due to the globalisation of food as it moves from farm to plate. Food largely travelling by air and HGVs with increasing levels of air pollution, high environmental impacts
globalisation of the fast food industry links with Americanisation and what they represent in terms of western culture e.g. Coca Cola and McDonalds. This desire in some countries / cultures is leading to growing amounts of obesity
technological innovations in farming e.g. digital soil mapping in data sparse regions such as Africa, hydroponics using mineral-enriched water, electronics giants using indoor vegetable farms such as Sharp, growing strawberries in Dubai or Sony growing lettuce and radishes in Japan.
SPECIMEN
H081/02 Mark Scheme June 20xx
81
Question Answer Marks Guidance
understanding to provide an un-supported evaluation that offers simple conclusions as to whether the globalisation of the food industry creates more opportunities than issues. 0 marks No response or no response worthy of credit. Quality of extended response
Level 4
There is a well-developed line of reasoning which is clear and
logically structured. The information presented is relevant and
substantiated.
Level 3
There is a line of reasoning presented with some structure.
The information presented is in the most-part relevant and
supported by some evidence.
Level 2
The information has some relevance and is presented with
limited structure. The information is supported by limited
evidence.
Level 1
The information is basic and communicated in an unstructured way. The information is supported by limited evidence and the relationship to the evidence may not be clear.
SPECIMEN
H081/02 Mark Scheme June 20xx
82
Question Answer Marks Guidance
19* ‘Environmental impacts of tectonic hazards are more significant than economic impacts.’ How far do you agree with this statement?
AO1 Level 4 (8-10 marks) Demonstrates comprehensive knowledge and understanding of the environmental and economic impacts of tectonic hazards. Level 3 (5–7 marks) Demonstrates thorough knowledge and understanding of the environmental and economic impacts of tectonic hazards. Level 2 (3–4 marks) Demonstrates reasonable knowledge and understanding of the environmental and economic impacts of tectonic hazards. Level 1 (1–2 marks) Demonstrates basic knowledge and understanding of the environmental and economic impacts of tectonic hazards. 0 marks No response or no response worthy of credit. AO2 Level 4 (8–10 marks) Demonstrates comprehensive application of knowledge and understanding to provide a clear, developed and convincing analysis that is fully accurate as to whether environmental impacts of tectonic hazards are more significant than economic impacts. Demonstrates comprehensive application of knowledge and understanding to provide a detailed and substantiated evaluation that offers secure judgements leading to rational
20 AO1 x10 AO2 x10
Indicative content AO1 – 10 marks
Knowledge and understanding of the environmental and economic impacts of tectonic hazards could potentially include:
probability of the tectonic hazard event occurring again contrasting types of tectonic hazards (disaster risk equation is appropriate here)
the relationship between the frequency and type of tectonic hazard and their environmental impacts e.g. the impacts of earthquakes at a destructive zone compared to a constructive zone; contrasts in types of volcanic eruptions
environmental impacts of tectonic hazards (dependant on case studies and hazards chosen) e.g. pyroclastic flows, lahars, landslides, flooding, soil liquefaction, ecosystem / habitat destruction
economic impacts of tectonic hazards (dependant on case studies and hazards chosen) e.g. destruction of homes, businesses, transport and infrastructure networks, planning for prediction, mitigation and modifying
levels of economic impact can be relative to levels of development, technological advancement in prediction and prevention methods e.g. contrast between ACs (Japan) and EDCs and LIDCs (Indonesia / Nepal)
numbers of people affected due to increasing population or reduction in people affected due to progress in monitoring, prediction, prevention and planning e.g. contrast between earthquakes and volcanic eruptions.
AO2 – 10 marks
SPECIMEN
H081/02 Mark Scheme June 20xx
83
Question Answer Marks Guidance
conclusions that are evidence based as to whether environmental impacts of tectonic hazards are more significant than economic impacts. Level 3 (5–7 marks) Demonstrates thorough application of knowledge and understanding to provide a clear and developed analysis that shows accuracy as to whether environmental impacts of tectonic hazards are more significant than economic impacts. Demonstrates thorough application of knowledge and understanding to provide a detailed evaluation that offers generally secure judgements, with some link between rational conclusions and evidence as to whether environmental impacts of tectonic hazards are more significant than economic impacts. Level 2 (3–4 marks) Demonstrates reasonable application of knowledge and understanding to provide a sound analysis that shows some accuracy of as to whether environmental impacts of tectonic hazards are more significant than economic impacts. Demonstrates reasonable application of knowledge and understanding to provide a sound evaluation that offers generalised judgements and conclusions, with limited use of evidence as to whether environmental impacts of tectonic hazards are more significant than economic impacts. Level 1 (1–2 marks) Demonstrates basic application of knowledge and understanding to provide a simple analysis that shows limited accuracy of as to whether environmental impacts of tectonic hazards are more significant than economic impacts. Demonstrates basic application of knowledge and understanding to provide an un-supported evaluation that
Application of knowledge and understanding to analyse and evaluate whether the environmental impacts of tectonic hazards are more significant than economic impacts could potentially include:
extent to which tectonic hazards have caused greater environmental impacts than economic impacts. The contrast between a high energy event in a remote location compared to a similar event in a densely populated region e.g. Ghorka compared to Kathmandu in Nepal (April 2015)
types of tectonic hazard and their impacts, earthquakes are more challenging to predict and a sudden onset hazard, however, volcanoes show a build-up of activity through gas emissions, rising heat and seismic activity (earthquakes). Mitigation strategies for earthquakes in some ACs (e.g. Japan) can significantly reduce the impacts however this is more challenging for volcanoes as the nature of eruptions (size, speed, direction, primary and secondary impacts) varies
development of areas in hazard prone regions has caused impacts to vary e.g. contrasts between ACs such as Japan and EDCs and LIDCs such as Indonesia and Nepal in terms of monetary impacts
it is challenging to evaluate the environmental and economic impacts of tectonic hazards due to their scale, intensity, duration, resilience, who and what is affected
the ability of places (at a range of scales and across the development spectrum) to respond and recover from tectonic events could be useful in evaluating the impacts. This could be more pertinent to economic impacts
impacts can be positive as well as short and long term e.g. ash fall from volcanic eruptions
SPECIMEN

H081/02 Mark Scheme June 20xx
84
Question Answer Marks Guidance
offers simple conclusions as to whether environmental impacts of tectonic hazards are more significant than economic impacts. 0 marks No response or no response worthy of credit. Quality of extended response
Level 4
There is a well-developed line of reasoning which is clear and
logically structured. The information presented is relevant and
substantiated.
Level 3
There is a line of reasoning presented with some structure. The
information presented is in the most-part relevant and
supported by some evidence.
Level 2
The information has some relevance and is presented with
limited structure. The information is supported by limited
evidence.
Level 1
The information is basic and communicated in an unstructured way. The information is supported by limited evidence and the relationship to the evidence may not be clear.
provides minerals for agriculture. Some lava flows take time to weather, in the long term minerals and nutrients will be released. Volcanic eruptions can generate tourist revenues e.g. Mt Etna in Sicily, tours, helicopter flights, school groups and scientific study.
SPECIMEN
H081/02 Mark Scheme June 20xx
85
Question Answer Marks Guidance
20* ‘Managing hazards in Advanced Countries (ACs) is more successful than any other area of the world.’ How far do you agree with this statement? AO1 Level 4 (8-10 marks) Demonstrates comprehensive knowledge and understanding of the management of tectonic hazards. Level 3 (5–7 marks) Demonstrates thorough knowledge and understanding of the management of tectonic hazards. Level 2 (3–4 marks) Demonstrates reasonable knowledge and understanding of the management of tectonic hazards. Level 1 (1–2 marks) Demonstrates basic knowledge and understanding of the management of tectonic hazards. 0 marks No response or no response worthy of credit. AO2 Level 4 (8–10 marks) Demonstrates comprehensive application of knowledge and understanding to provide a clear, developed and convincing analysis that is fully accurate of the differences in managing hazards in Advanced Countries (ACs) compared to the rest of the world. Demonstrates comprehensive application of knowledge and understanding to provide a detailed and substantiated evaluation that offers secure judgements leading to rational conclusions that are evidence based as to whether managing hazards in Advanced Countries (ACs) is an easier task than
20 AO1 x10 AO2 x10
Indicative content AO1 – 10 marks
Knowledge and understanding of how tectonic hazards are managed could potentially include:
attempts and abilities to mitigate against the event e.g. land use zoning, education, emergency planning and rescue
attempts and abilities to manage vulnerability and exposure e.g. prediction and warning
the relationship between disaster and response in the context of contrasting economic contexts e.g. rescue and emergency relief, longer term aid, insurance e.g. contrast between Japan, Chile, China and Nepal
attempts to mitigate against losses e.g. insurance, rescue and emergency relief
degree of risk posed by a hazard and the probability of the hazard event occurring.
AO2 – 10 marks
Application of knowledge and understanding to analyse and evaluate whether ACs can manage hazards more successfully than any other area of the world could potentially include:
links between economic development and technological development. Technology can play a very significant role in monitoring and prediction; in mitigation strategies; and in recovery e.g. contrast between Japan and Nepal
links between economic development and degree of vulnerability and exposure of communities
types of tectonic hazard and their impacts, earthquakes are more challenging to predict and a sudden onset hazard, however,
SPECIMEN
H081/02 Mark Scheme June 20xx
86
Question Answer Marks Guidance
managing hazards in the rest of the world. Level 3 (5–7 marks) Demonstrates thorough application of knowledge and understanding to provide a clear and developed analysis that shows accuracy of the differences in managing hazards in Advanced Countries (ACs) compared to the rest of the world. Demonstrates thorough application of knowledge and understanding to provide a detailed evaluation that offers generally secure judgements, with some link between rational conclusions and evidence as to whether managing hazards in advanced countries is an easier task than managing hazards in the rest of the world. Level 2 (3–4 marks) Demonstrates reasonable application of knowledge and understanding to provide a sound analysis that shows some accuracy of the differences in managing hazards in Advanced Countries (ACs) compared to the rest of the world. Demonstrates reasonable application of knowledge and understanding to provide a sound evaluation that offers generalised judgements and conclusions, with limited use of evidence as to whether managing hazards in advanced countries is an easier task than managing hazards in the rest of the world. Level 1 (1–2 marks) Demonstrates basic application of knowledge and understanding to provide a simple analysis that shows limited accuracy of the differences in managing hazards in Advanced Countries (ACs) compared to the rest of the world. Demonstrates basic application of knowledge and understanding to provide an un-supported evaluation that
volcanoes show a build-up of activity through gas emissions, rising heat and seismic activity (earthquakes). Mitigation strategies for earthquakes in some ACs (e.g. Japan) can significantly reduce the impacts however this is more challenging for volcanoes as the nature of eruptions (size, speed, direction, primary and secondary impacts) varies
links between scale (magnitude) of an earthquake and the ability of a society to manage it e.g. any AC will struggle to manage a very high energy earthquake e.g. Japan 2011
links between factors such as population density, building design and stability, infrastructure (gas and electricity pipes) and transport networks and the ability to manage earthquake hazards irrespective of economic status / level of development
that significant management can be achieved by EDCs and LIDCs e.g. Nepal in basic housing design, education and preparedness of population as well as the emergency services
understanding of hazards for management to be effective. Looking at what it means to be successful. ACs potentially have access to a greater range of monitoring equipment, prediction technologies / models to reduce vulnerability of populations however international support, experts and technologies are available to countries across the development spectrum e.g. Montserrat, consultants working with local government looking at resettling populations in the South West of the Island and the clean-up operation.
SPECIMEN
H081/02 Mark Scheme June 20xx
87
Question Answer Marks Guidance
offers simple conclusions as to whether managing hazards in advanced countries is an easier task than managing hazards in the rest of the world. 0 marks No response or no response worthy of credit. Quality of extended response
Level 4
There is a well-developed line of reasoning which is clear and
logically structured. The information presented is relevant and
substantiated.
Level 3
There is a line of reasoning presented with some structure.
The information presented is in the most-part relevant and
supported by some evidence.
Level 2
The information has some relevance and is presented with
limited structure. The information is supported by limited
evidence.
Level 1
The information is basic and communicated in an unstructured way. The information is supported by limited evidence and the relationship to the evidence may not be clear.
SPECIMEN
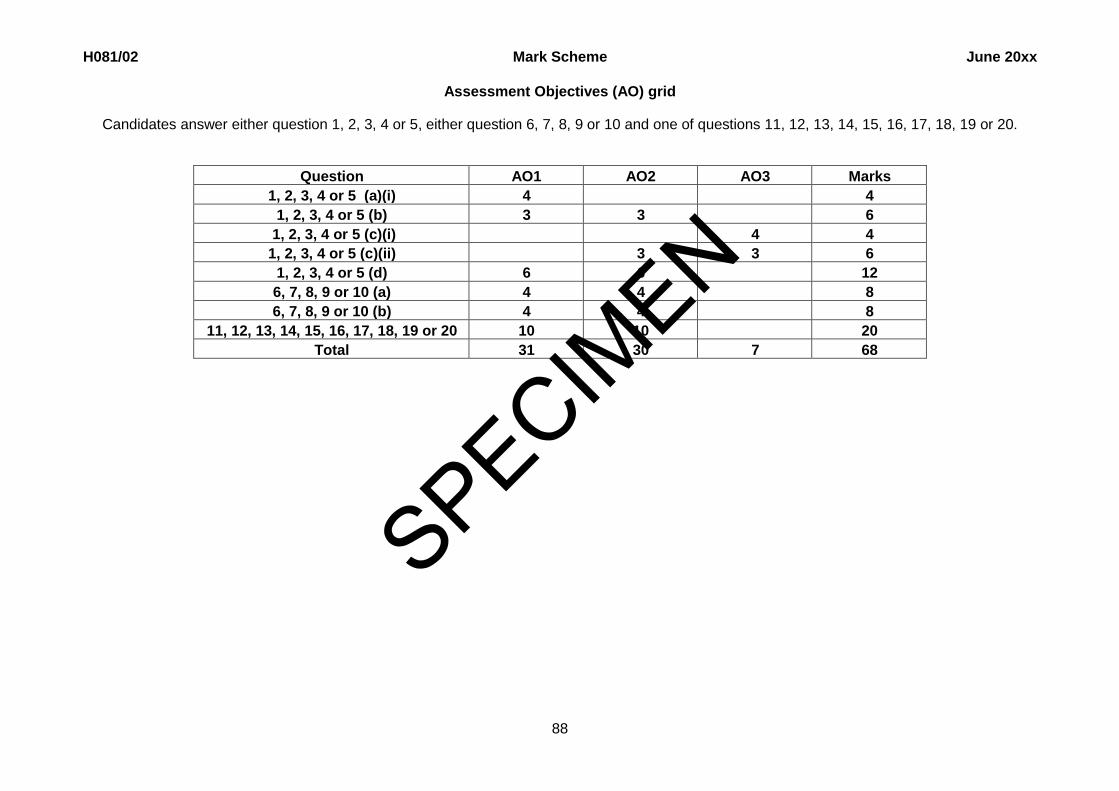
H081/02 Mark Scheme June 20xx
88
Assessment Objectives (AO) grid
Candidates answer either question 1, 2, 3, 4 or 5, either question 6, 7, 8, 9 or 10 and one of questions 11, 12, 13, 14, 15, 16, 17, 18, 19 or 20.
Question AO1 AO2 AO3 Marks
1, 2, 3, 4 or 5 (a)(i) 4 4
1, 2, 3, 4 or 5 (b) 3 3 6
1, 2, 3, 4 or 5 (c)(i) 4 4
1, 2, 3, 4 or 5 (c)(ii) 3 3 6
1, 2, 3, 4 or 5 (d) 6 6 12
6, 7, 8, 9 or 10 (a) 4 4 8
6, 7, 8, 9 or 10 (b) 4 4 8
11, 12, 13, 14, 15, 16, 17, 18, 19 or 20 10 10 20
Total 31 30 7 68
SPECIMEN
Recommended