Laurie Padman
I. Arzeno, R.C. Beardsley, R. Limeburner, B. Owens,
S.R. Springer, C.L. Stewart, M.J.M. Williams
+ G. Moholdt, H.A. Fricker, M.S. Dinniman, S.L. Howard
Sponsored by NSF & NASA
Ocean variability contributing to basal melt rate near the ice front of Ross Ice Shelf, Antarctica
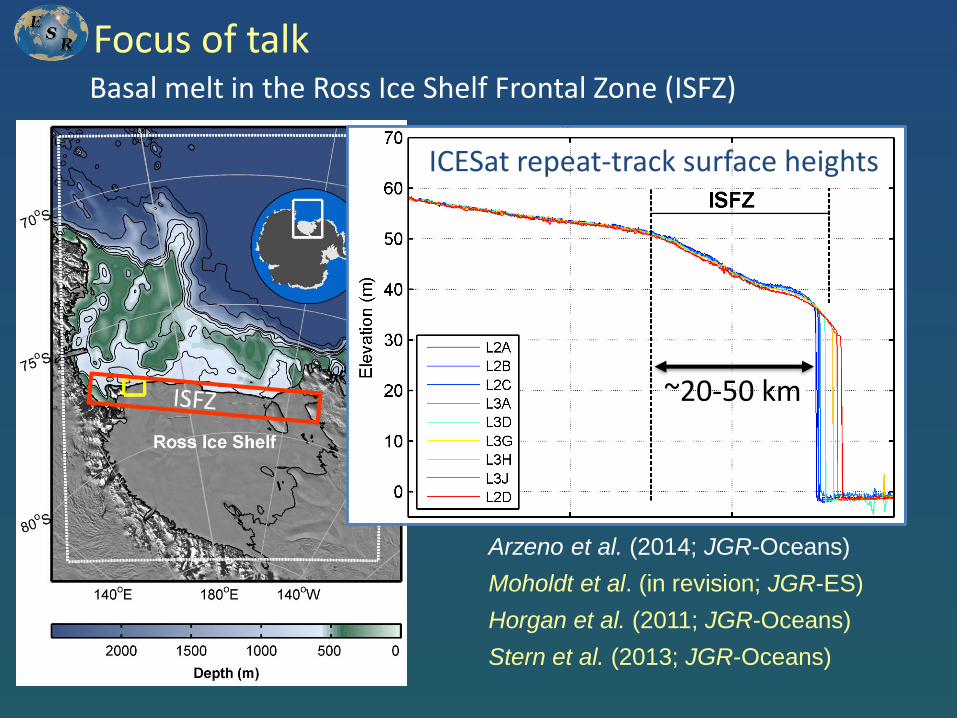
Focus of talk
ICESat repeat-track surface heights
~20-50 km
Arzeno et al. (2014; JGR-Oceans)
Moholdt et al. (in revision; JGR-ES)
Horgan et al. (2011; JGR-Oceans)
Stern et al. (2013; JGR-Oceans)
Basal melt in the Ross Ice Shelf Frontal Zone (ISFZ)
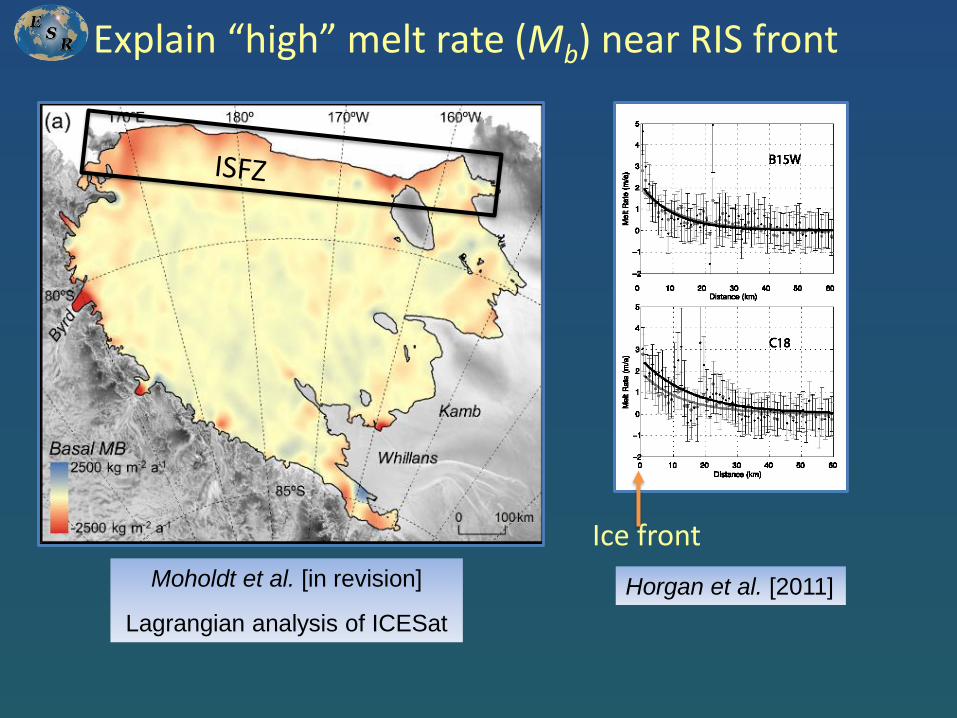
Explain “high” melt rate (Mb) near RIS front
Moholdt et al. [in revision]
Lagrangian analysis of ICESat
Horgan et al. [2011]
Ice front
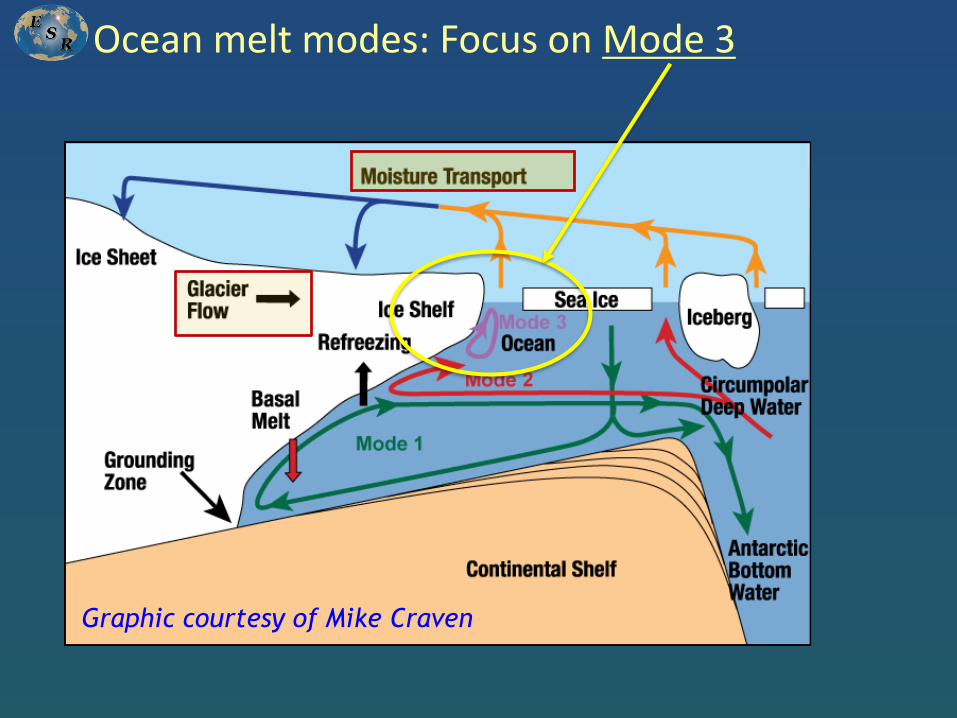
Ocean melt modes: Focus on Mode 3
Graphic courtesy of Mike Craven
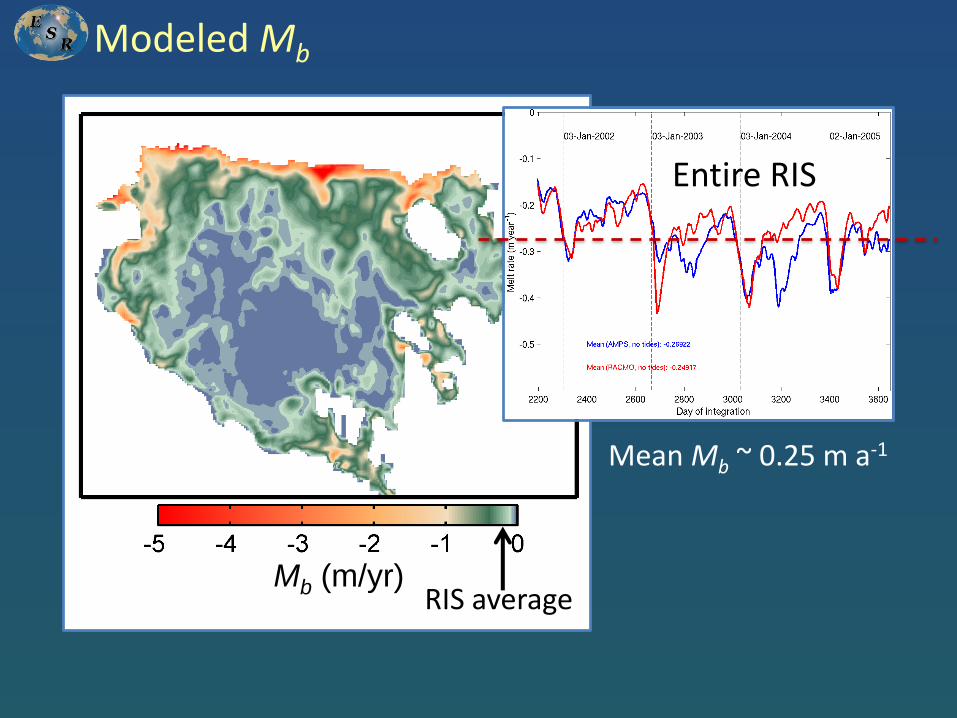
Modeled Mb
RIS averageMb (m/yr)
Entire RIS
Mean Mb ~ 0.25 m a-1
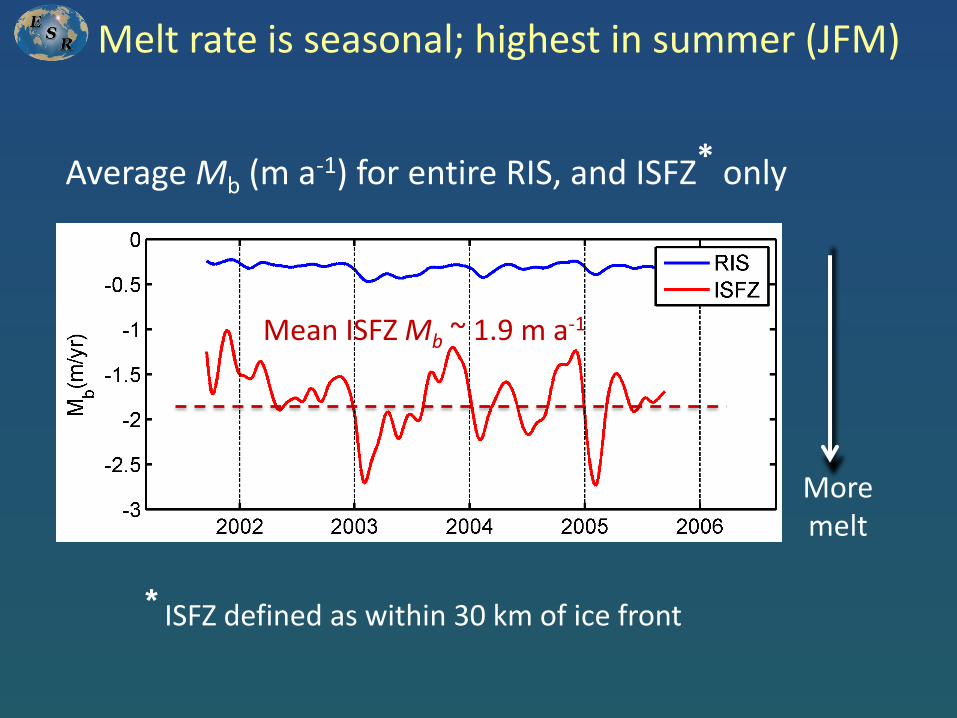
Melt rate is seasonal; highest in summer (JFM)
Average Mb (m a-1) for entire RIS, and ISFZ* only
Moremelt
Mean ISFZ Mb ~ 1.9 m a-1
* ISFZ defined as within 30 km of ice front
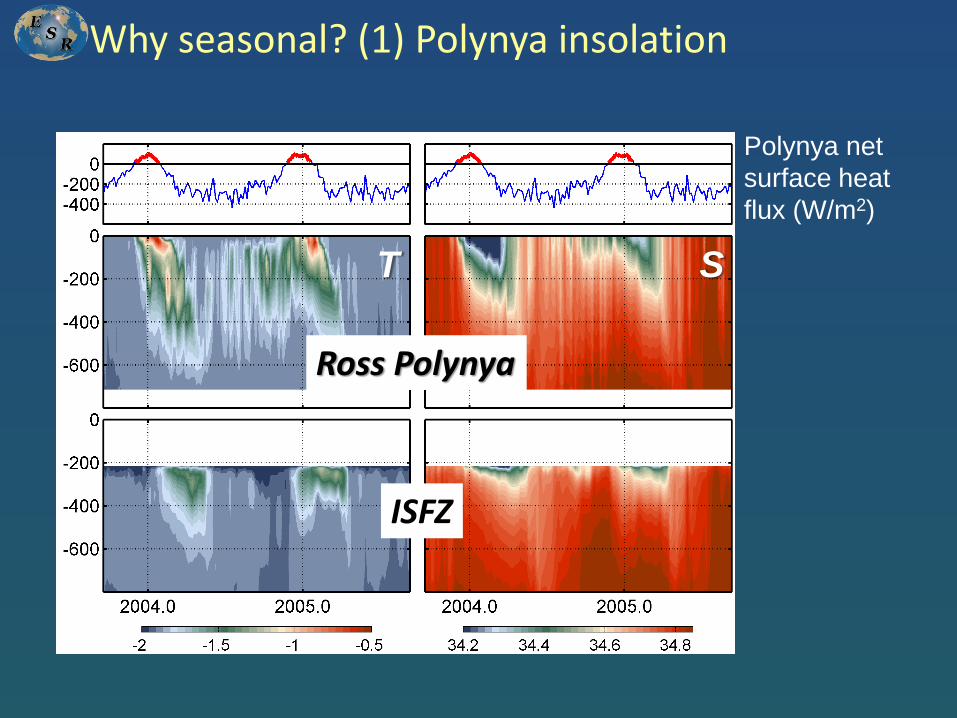
Why seasonal? (1) Polynya insolation
Ross Polynya
ISFZ
ST
Polynya net
surface heat
flux (W/m2)
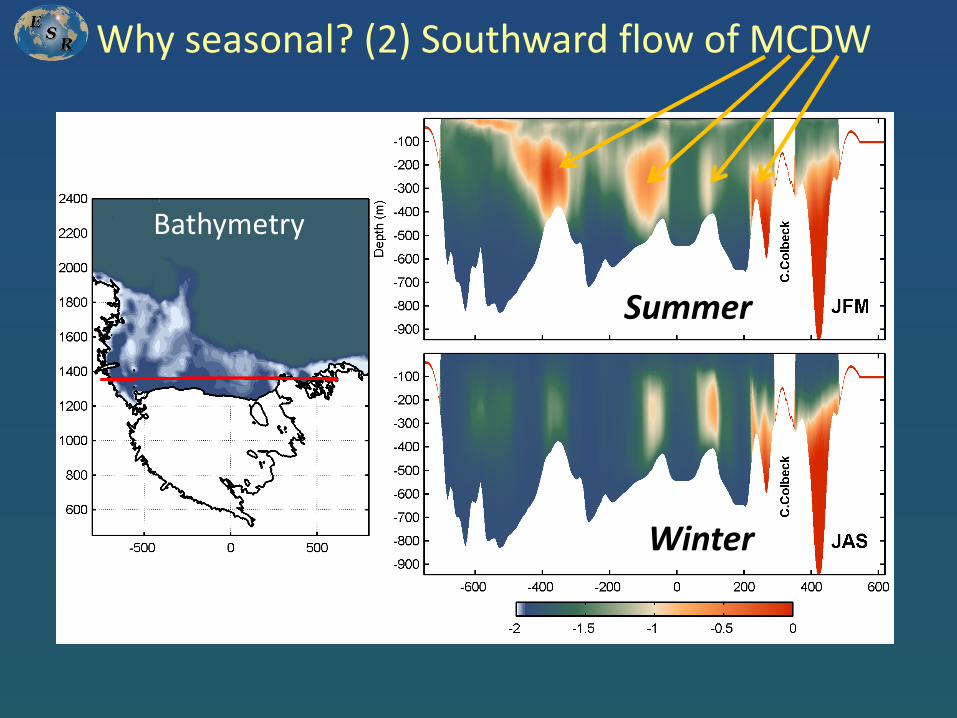
Why seasonal? (2) Southward flow of MCDW
Summer
Winter
Bathymetry
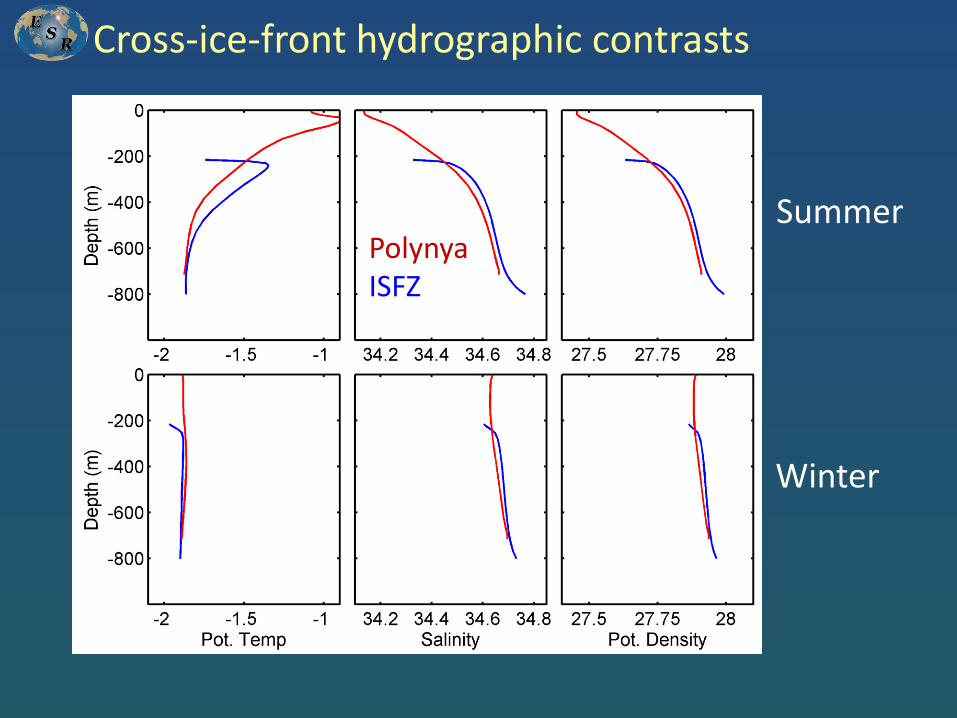
Cross-ice-front hydrographic contrasts
PolynyaISFZ
Summer
Winter
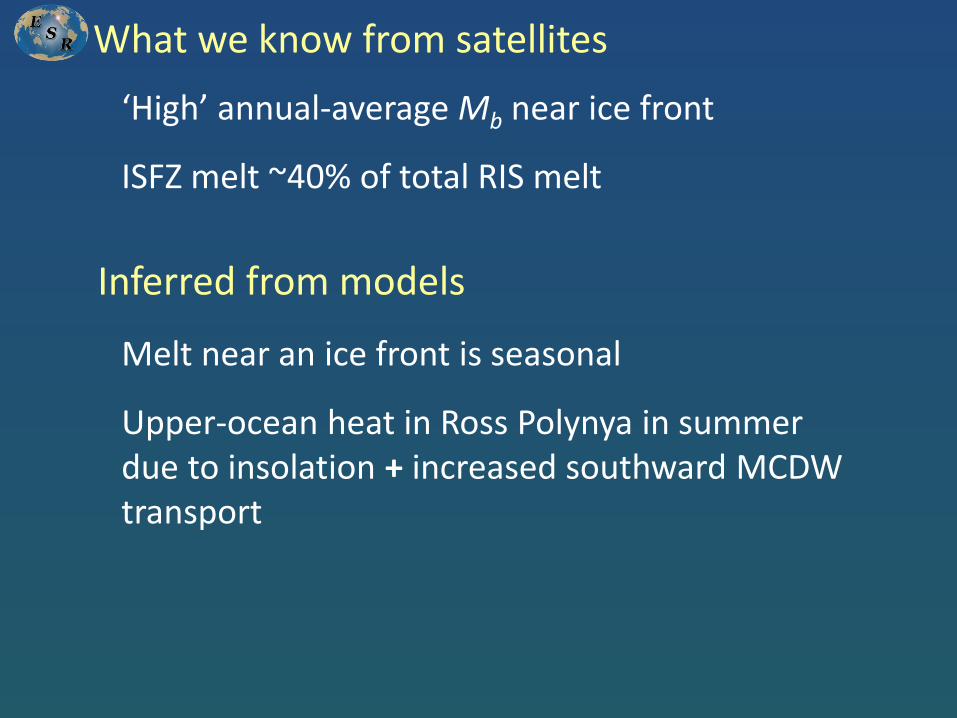
What we know from satellites
‘High’ annual-average Mb near ice front
ISFZ melt ~40% of total RIS melt
Melt near an ice front is seasonal
Upper-ocean heat in Ross Polynya in summer due to insolation + increased southward MCDW transport
Inferred from models
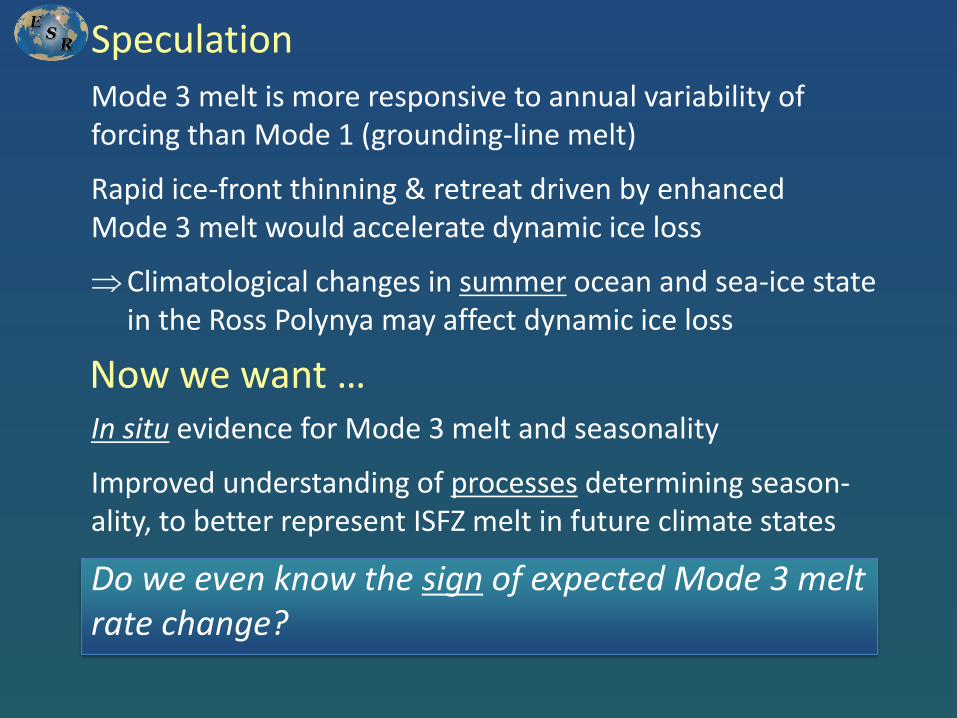
Mode 3 melt is more responsive to annual variability of forcing than Mode 1 (grounding-line melt)
Rapid ice-front thinning & retreat driven by enhanced Mode 3 melt would accelerate dynamic ice loss
Climatological changes in summer ocean and sea-ice state in the Ross Polynya may affect dynamic ice loss
In situ evidence for Mode 3 melt and seasonality
Improved understanding of processes determining season-ality, to better represent ISFZ melt in future climate states
Do we even know the sign of expected Mode 3 melt rate change?
Speculation
Now we want …
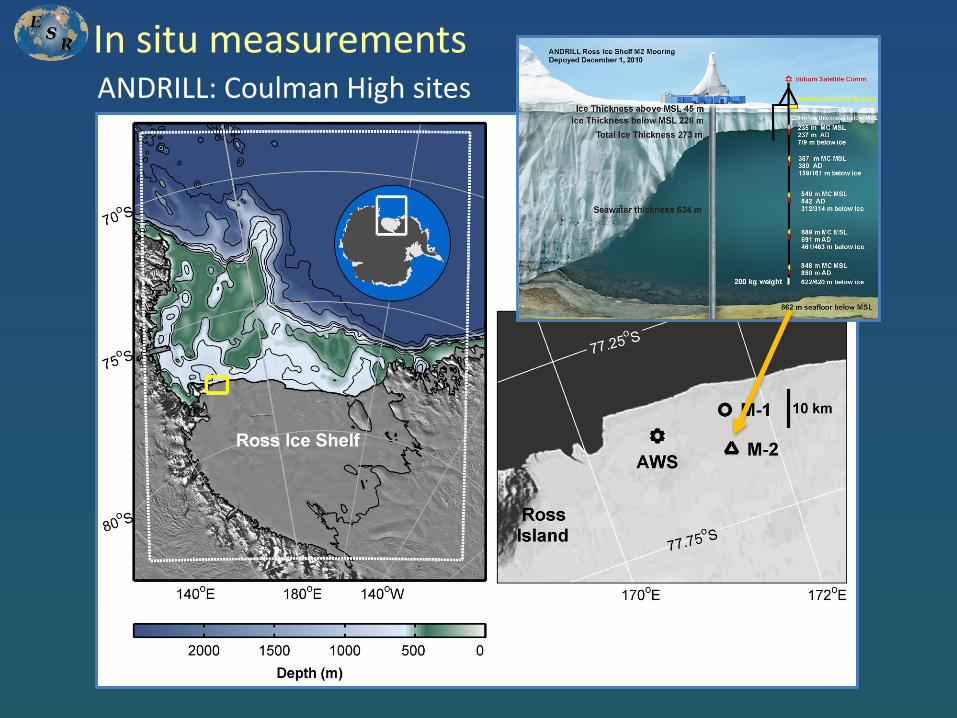
In situ measurementsANDRILL: Coulman High sites
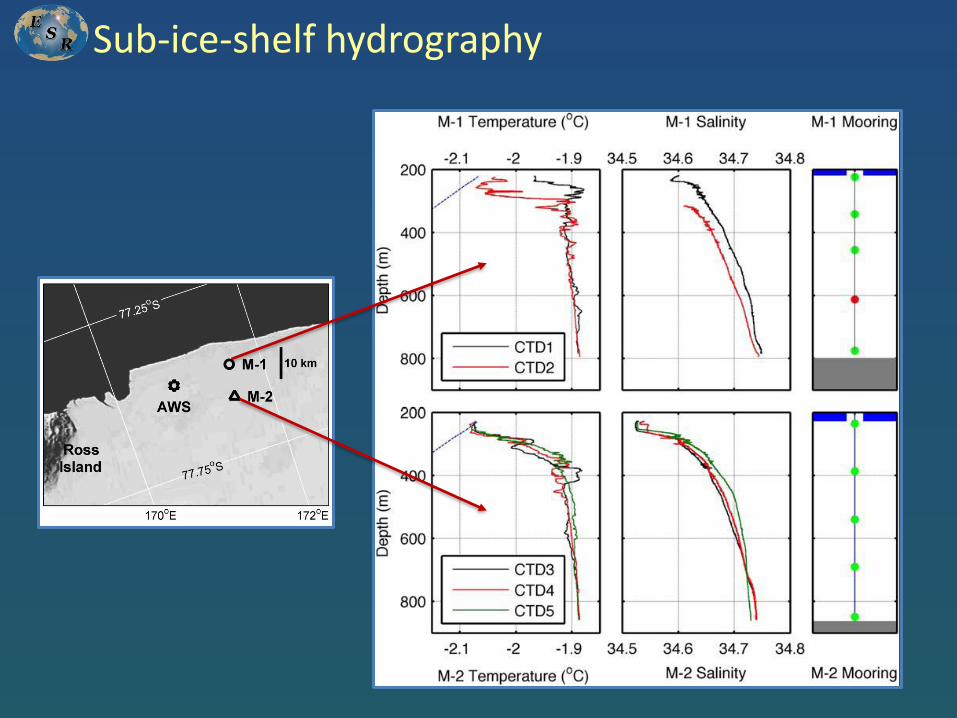
Sub-ice-shelf hydrography
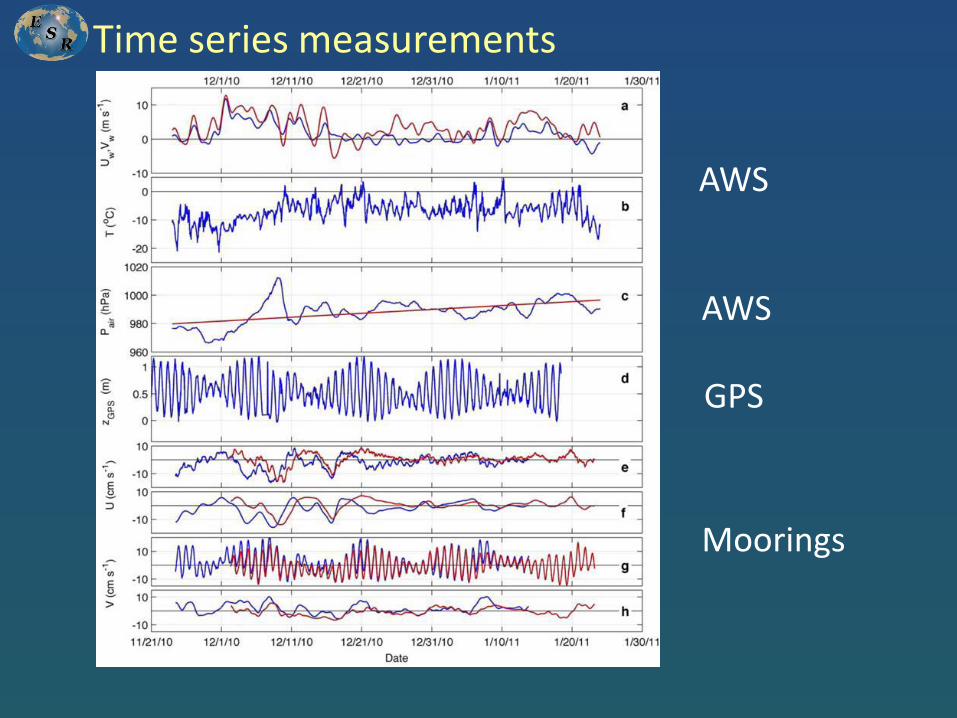
Time series measurements
AWS
AWS
GPS
Moorings
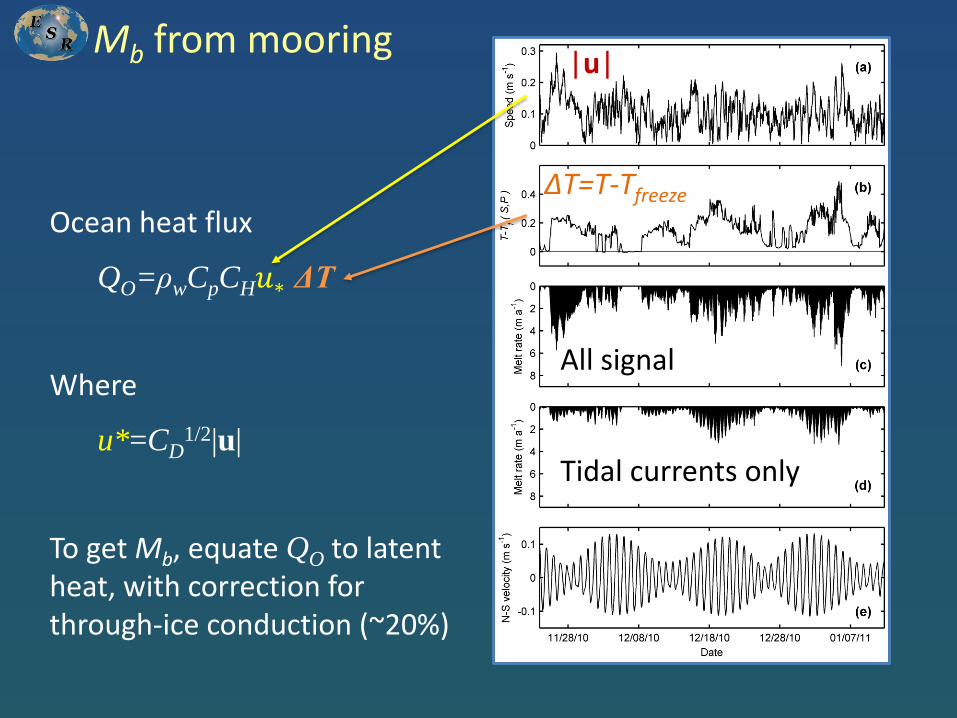
Mb from mooring
Ocean heat flux
QO=ρwCpCH𝑢∗ ΔT
Where
u*=CD1/2|u|
To get Mb, equate QO to latent heat, with correction for through-ice conduction (~20%)
ΔT=T-Tfreeze
|u|
All signal
Tidal currents only
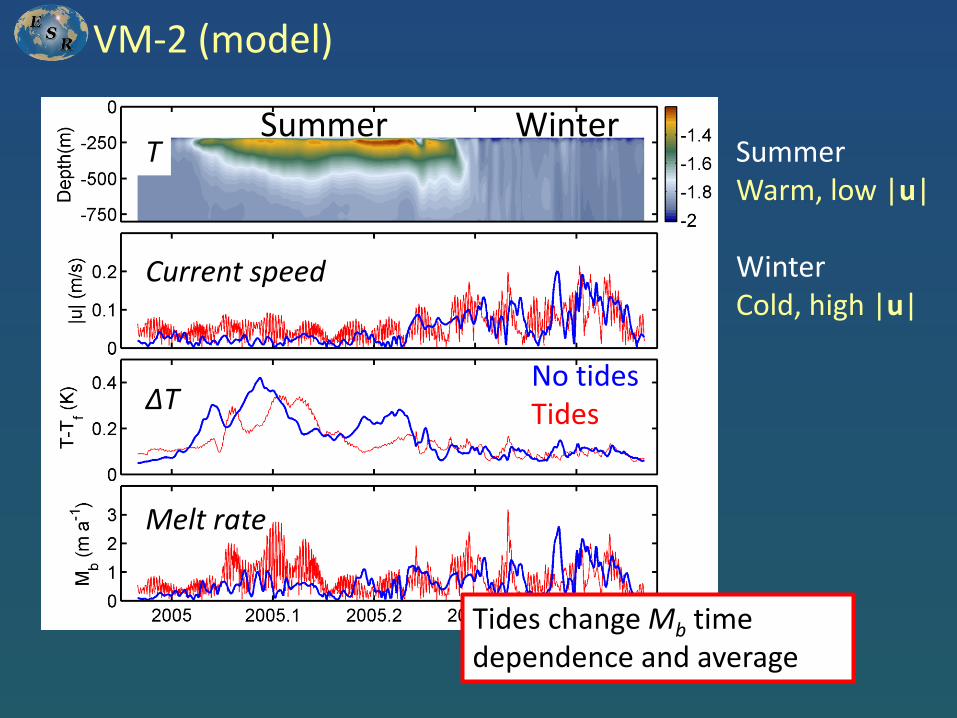
VM-2 (model)
T
Current speed
ΔT
Melt rate
No tidesTides
SummerWarm, low |u|
WinterCold, high |u|
Summer Winter
Tides change Mb time dependence and average
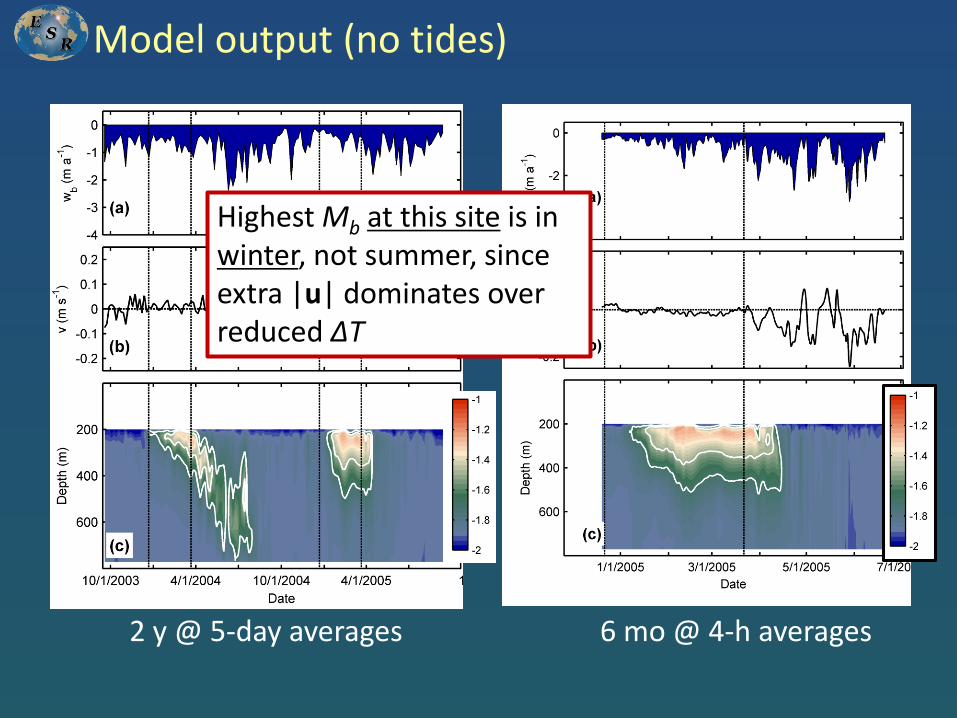
Model output (no tides)
2 y @ 5-day averages 6 mo @ 4-h averages
Highest Mb at this site is in winter, not summer, since extra |u| dominates over reduced ΔT
Not shown
Weather-band (period of days) variability is not correlated with local winds:
Eddies and/or topographic-trapped waves along the ice front
Strength of these processes depends on density gradients: cross-front, and vertical:
These change with stratification in Ross Polynya and buoyant meltwater fluxes to and within the ISFZ
Summary (Ross ISFZ basal melt rate Mb)
‘High’ Mb near ice front (~2 m a-1 cf <0.3 m a-1 overall)
ISFZ melt ~40% of net RIS melt
Seasonal cycle of warm upper-ocean water near the ice front; insolation + MCDW southward advection
But …
Mb depends on high-frequency ocean variability (tides, eddies, frontal instabilities) with energy that is out of phase with upper-ocean T; => more complex Mb(t) signal
Implies sensitivity to interactions between atmosphere, ocean, ice shelf and sea ice at short time and space scales
Thank you

End formal talk
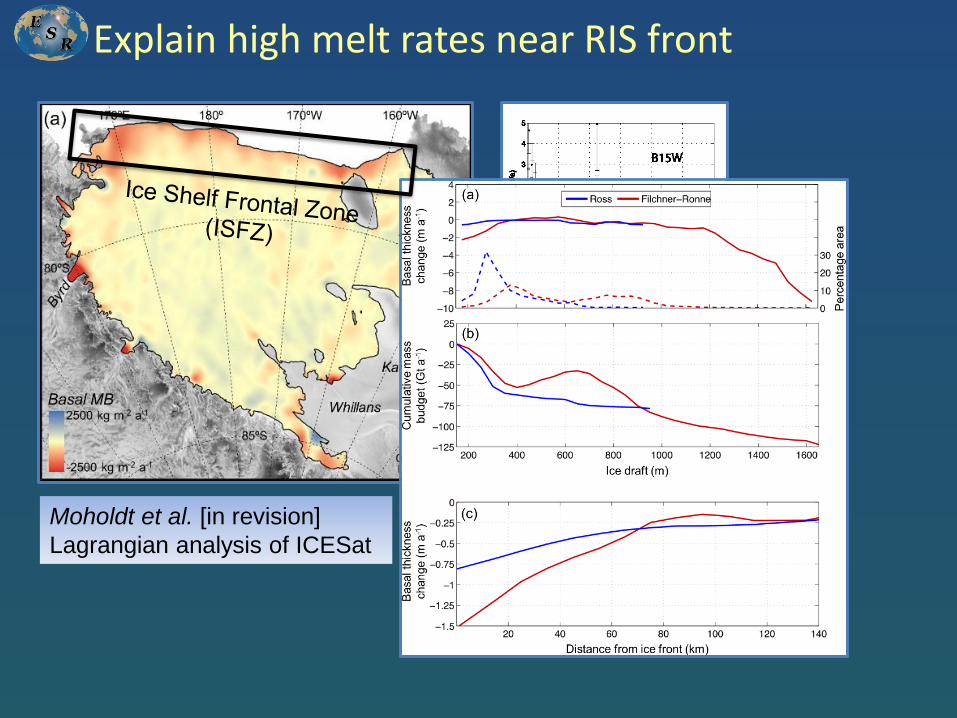
Explain high melt rates near RIS front
Moholdt et al. [in revision]
Lagrangian analysis of ICESat
Horgan et al. [2011]
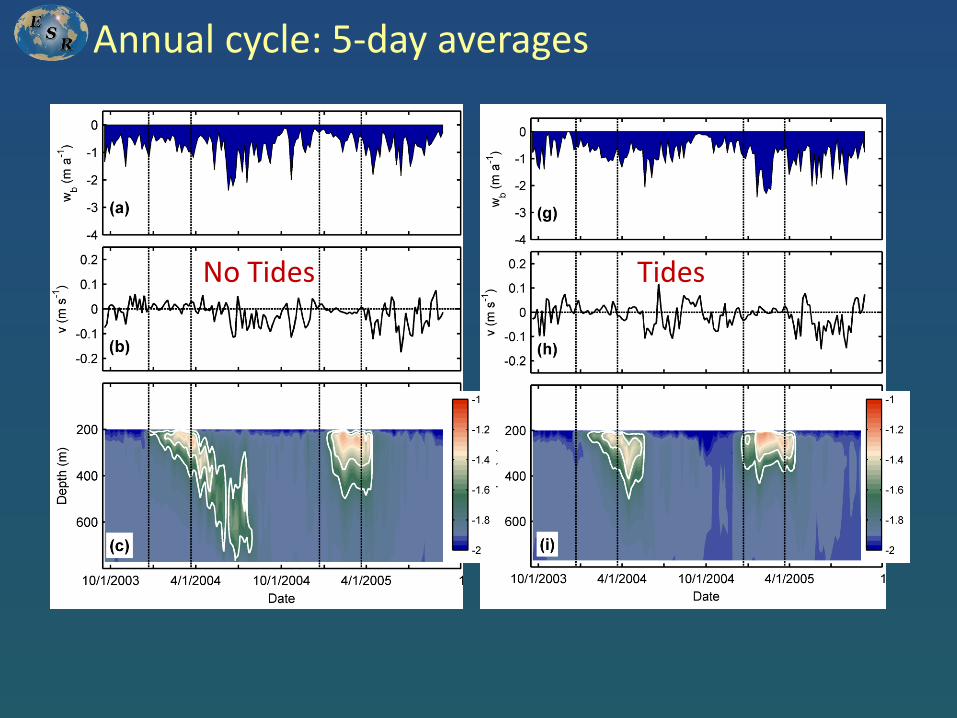
Annual cycle: 5-day averages
No Tides Tides
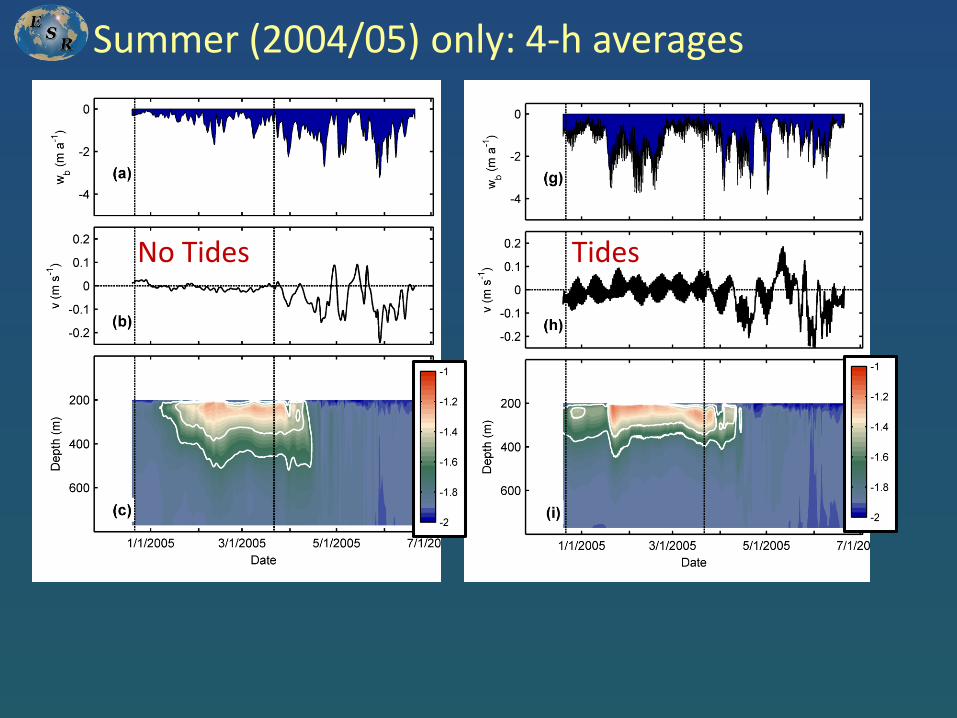
Summer (2004/05) only: 4-h averages
No Tides Tides
Summary (Ross ISFZ melt)
‘High’ melt rate near ice front (~2 m a-1 cf <0.3 m a-1 overall)
ISFZ melt ~40% of net RIS melt
Seasonal cycle as warm upper-ocean water gets to ice front; insolation + MCDW southward advection
Dependence on tides (~50%) and ‘weather-band’ (~50%)
W-B appears to be ‘frontal instability’, not local wind forcing, and so depends on ocean stratification differences between Ross Polynya water and water under ISFZ
Implies sensitivity to interactions between atmosphere, ocean, ice shelf and sea ice
Recommended