Chapter- IV Materials & Methods
48
I. MATERIALS AND METHODS:
A. Animal selection:
Adult Wistar rats of either sex weighing 150-200g were used in the
experiment. The animals had free access to laboratory chow diet and tap water. They
were housed in galvanized iron cages in a thermostatically controlled room (28±20 C)
and maintained in 12 h natural dark/light cycle. The study has been approved by
“Institutional Animal Ethics Committee”, KLE University’s College of Pharmacy,
Belgaum.
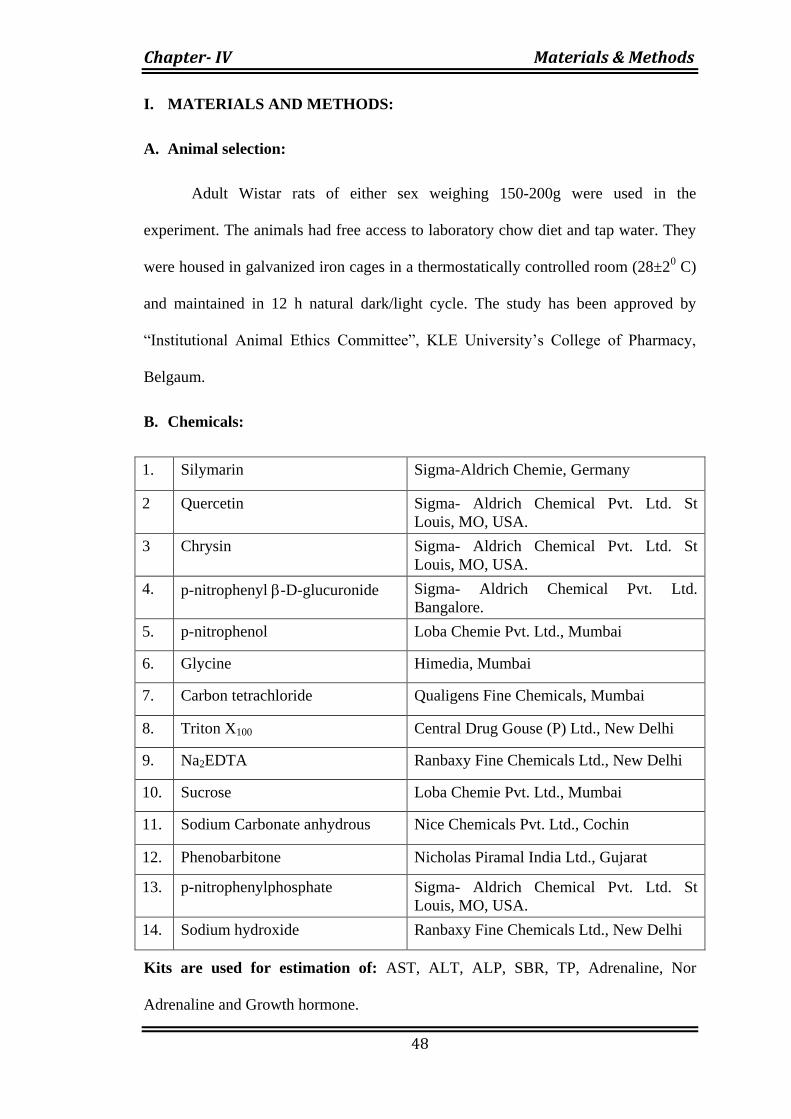
B. Chemicals:
1. Silymarin Sigma-Aldrich Chemie, Germany
2 Quercetin Sigma- Aldrich Chemical Pvt. Ltd. St
Louis, MO, USA.
3 Chrysin Sigma- Aldrich Chemical Pvt. Ltd. St
Louis, MO, USA.
4. p-nitrophenyl -D-glucuronide Sigma- Aldrich Chemical Pvt. Ltd.
Bangalore.
5. p-nitrophenol Loba Chemie Pvt. Ltd., Mumbai
6. Glycine Himedia, Mumbai
7. Carbon tetrachloride Qualigens Fine Chemicals, Mumbai
8. Triton X100 Central Drug Gouse (P) Ltd., New Delhi
9. Na2EDTA Ranbaxy Fine Chemicals Ltd., New Delhi
10. Sucrose Loba Chemie Pvt. Ltd., Mumbai
11. Sodium Carbonate anhydrous Nice Chemicals Pvt. Ltd., Cochin
12. Phenobarbitone Nicholas Piramal India Ltd., Gujarat
13. p-nitrophenylphosphate Sigma- Aldrich Chemical Pvt. Ltd. St
Louis, MO, USA.
14. Sodium hydroxide Ranbaxy Fine Chemicals Ltd., New Delhi
Kits are used for estimation of: AST, ALT, ALP, SBR, TP, Adrenaline, Nor
Adrenaline and Growth hormone.
Chapter- IV Materials & Methods
49
All other reagents used were of analytical grade.
C. Instruments:
a. Tissue homogenizer - Remi motors Ltd., Mumbai (India).
b. Centrifuge instrument - Bangalore Genei Pvt., Ltd Bangalore.
c. Electronic balance - Adrir dutt instrument Pvt., Ltd.
d. UV visible spectrophotometer- Shimadzu (UV number 1201) Japan.
e. Biochemistry auto analyzer (Rapid star - 21 plus).
D. Animal treatment
Suspension of flavonoids were prepared by using 1% w/v Carboxy Methyl
Cellulose (CMC) in water and the LD50 cutoff value was determined by OECD
guidelines.135
Acute toxicity studies revealed that Silymarin, Quercetin and Chrysin
did not cause any mortality in the doses tested and found to be safe up to 5000mg/kg,
therefore 1/10th and 1/20
th of acute toxicity, i.e. 250 and 500mg/kg, p.o, b.w. were
selected as daily dose in the experimental protocol.
The animals were randomly divided into 8 groups containing 18 animals in
each. Distilled water containing Phenobarbitone at the concentration of 500 mg/L was
the only source of drinking water for the rats 10 days prior to the first dose of CCl4
vapour and throughout the treatment period. Phenobarbitone was co-administered
with CCl4 to hastens the development of cirrhosis.136
Twenty animals were exposed to CCl4 vapors twice a week. After exposure to
CCl4 for 2 weeks, six rats were sacrificed 3 days after the last dose of CCl4. Similarly
six rats each were sacrificed after 6 weeks and 12 weeks of treatment with CCl4 (3
Chapter- IV Materials & Methods
50
days after the last dose of CCl4). Similarly, in the control group and flavonoid treated
groups, six rats each were sacrificed at the same time as CCl4 treated animals.
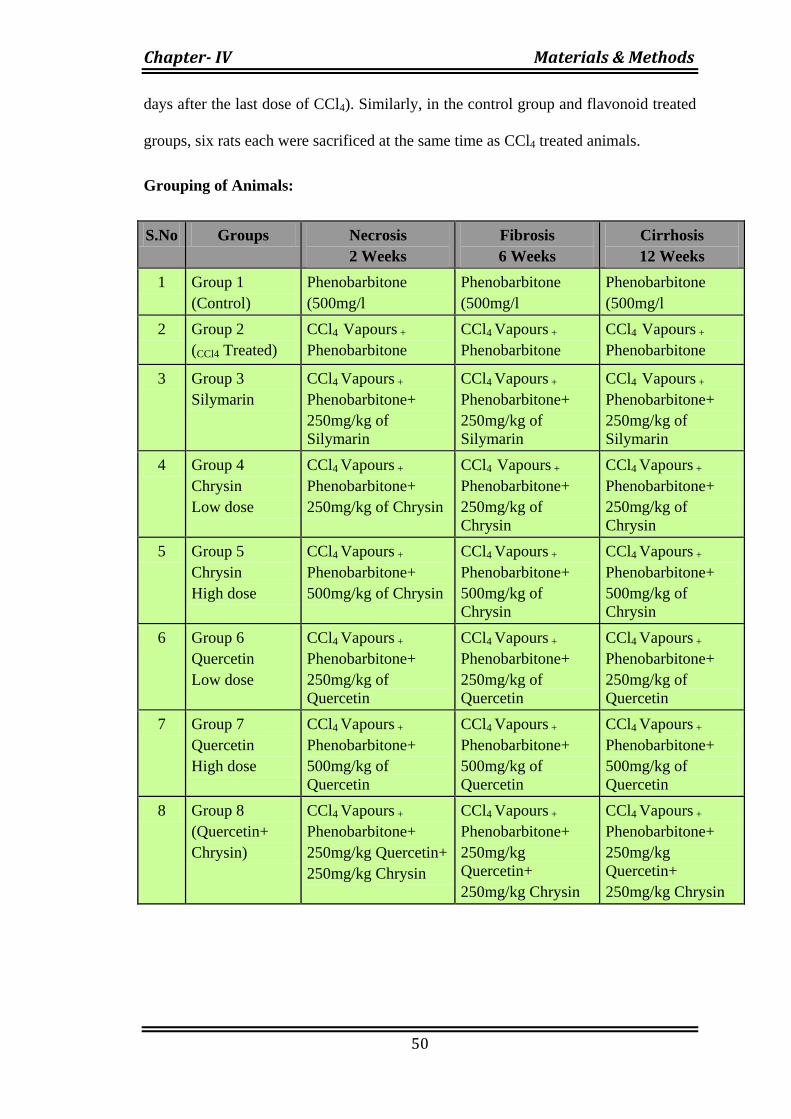
Grouping of Animals:
S.No Groups Necrosis
2 Weeks
Fibrosis
6 Weeks
Cirrhosis
12 Weeks
1 Group 1
(Control)
Phenobarbitone
(500mg/l
Phenobarbitone
(500mg/l
Phenobarbitone
(500mg/l
2 Group 2
(CCl4 Treated)
CCl4 Vapours +
Phenobarbitone
CCl4 Vapours +
Phenobarbitone
CCl4 Vapours +
Phenobarbitone
3 Group 3
Silymarin
CCl4 Vapours +
Phenobarbitone+
250mg/kg of
Silymarin
CCl4 Vapours +
Phenobarbitone+
250mg/kg of
Silymarin
CCl4 Vapours +
Phenobarbitone+
250mg/kg of
Silymarin
4 Group 4
Chrysin
Low dose
CCl4 Vapours +
Phenobarbitone+
250mg/kg of Chrysin
CCl4 Vapours +
Phenobarbitone+
250mg/kg of
Chrysin
CCl4 Vapours +
Phenobarbitone+
250mg/kg of
Chrysin
5 Group 5
Chrysin
High dose
CCl4 Vapours +
Phenobarbitone+
500mg/kg of Chrysin
CCl4 Vapours +
Phenobarbitone+
500mg/kg of
Chrysin
CCl4 Vapours +
Phenobarbitone+
500mg/kg of
Chrysin
6 Group 6
Quercetin
Low dose
CCl4 Vapours +
Phenobarbitone+
250mg/kg of
Quercetin
CCl4 Vapours +
Phenobarbitone+
250mg/kg of
Quercetin
CCl4 Vapours +
Phenobarbitone+
250mg/kg of
Quercetin
7 Group 7
Quercetin
High dose
CCl4 Vapours +
Phenobarbitone+
500mg/kg of
Quercetin
CCl4 Vapours +
Phenobarbitone+
500mg/kg of
Quercetin
CCl4 Vapours +
Phenobarbitone+
500mg/kg of
Quercetin
8 Group 8
(Quercetin+
Chrysin)
CCl4 Vapours +
Phenobarbitone+
250mg/kg Quercetin+
250mg/kg Chrysin
CCl4 Vapours +
Phenobarbitone+
250mg/kg
Quercetin+
250mg/kg Chrysin
CCl4 Vapours +
Phenobarbitone+
250mg/kg
Quercetin+
250mg/kg Chrysin
Chapter- IV Materials & Methods
51
II. SCREENING MODELS
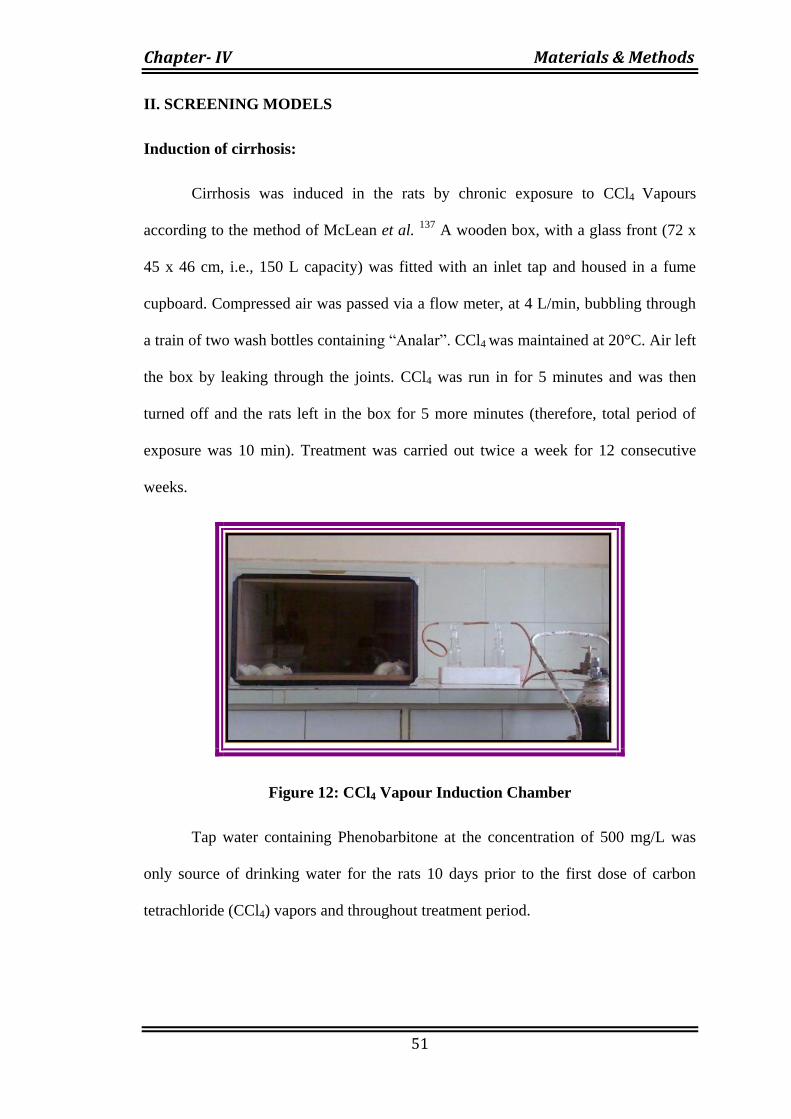
Induction of cirrhosis:
Cirrhosis was induced in the rats by chronic exposure to CCl4 Vapours
according to the method of McLean et al. 137
A wooden box, with a glass front (72 x
45 x 46 cm, i.e., 150 L capacity) was fitted with an inlet tap and housed in a fume
cupboard. Compressed air was passed via a flow meter, at 4 L/min, bubbling through
a train of two wash bottles containing “Analar”. CCl4 was maintained at 20°C. Air left
the box by leaking through the joints. CCl4 was run in for 5 minutes and was then
turned off and the rats left in the box for 5 more minutes (therefore, total period of
exposure was 10 min). Treatment was carried out twice a week for 12 consecutive
weeks.
Figure 12: CCl4 Vapour Induction Chamber
Tap water containing Phenobarbitone at the concentration of 500 mg/L was
only source of drinking water for the rats 10 days prior to the first dose of carbon
tetrachloride (CCl4) vapors and throughout treatment period.
Chapter- IV Materials & Methods
52
Phenobarbitone was co-administered with carbon tetrachloride since it has
been shown in earlier studies that Phenobarbitone hastens the development of
cirrhosis.36
Biochemical analysis
The animals were fasted overnight and blood was drawn by heart puncture
under light ether anaesthesia. The liver were excised, weighed and used for
biochemical analysis and histological assessment. Sera were separated from the blood
and used for the assay of N-acetyl glucosaminidase (NAG), β-glucuronidase (β- glc),
acid phosphatase, ALT, AST, ALP, SRBN and total protein activity at 2, 6 and 12
weeks. Adrenaline, nor adrenaline and growth hormone levels were estimated at the
end of 6 weeks of the study.
E. Histopathology
The animals were sacrificed at the end of 2, 6 and 12 weeks and liver sections
were subjected for histopathological studies. Slices of liver tissue were fixed in 10%
buffered formalin, processed and stained with Haematoxylin-Eosin, Foot’s reticulin
and Van Geison stains for histopathological observation at 20 – 80x magnification.
Preparation of the homogenate:
Liver homogenates were prepared as described by Kyaw et al.138
Briefly,
portion of the liver (approximately 250 mg) was homogenized in 10 ml of ice cold
0.25 M sucrose, 1mµ disodium EDTA in a potter-Elvehjem homogenizer. The
homogenate was divided into two equal parts, marked ‘maximal’ and ‘basal’. The
activity in the presence of Triton X100 denotes “maximal” or “total” activity and the
activity in the absence of Triton X100 denotes “basal” or “free” activity. They were
incubated at 370 C for one hour with gentle shaking now and then. The homogenates
Chapter- IV Materials & Methods
53
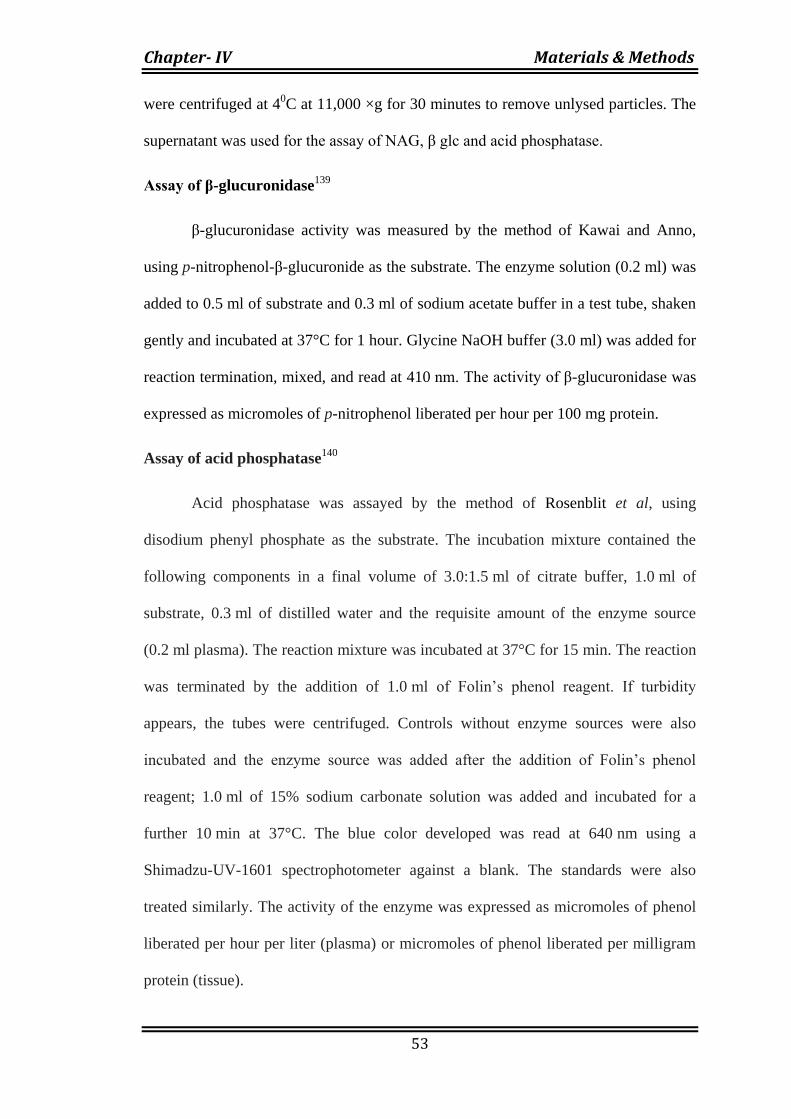
were centrifuged at 40C at 11,000 ×g for 30 minutes to remove unlysed particles. The
supernatant was used for the assay of NAG, β glc and acid phosphatase.
Assay of β-glucuronidase139
β-glucuronidase activity was measured by the method of Kawai and Anno,
using p-nitrophenol-β-glucuronide as the substrate. The enzyme solution (0.2 ml) was
added to 0.5 ml of substrate and 0.3 ml of sodium acetate buffer in a test tube, shaken
gently and incubated at 37°C for 1 hour. Glycine NaOH buffer (3.0 ml) was added for
reaction termination, mixed, and read at 410 nm. The activity of β-glucuronidase was
expressed as micromoles of p-nitrophenol liberated per hour per 100 mg protein.
Assay of acid phosphatase140
Acid phosphatase was assayed by the method of Rosenblit et al, using
disodium phenyl phosphate as the substrate. The incubation mixture contained the
following components in a final volume of 3.0:1.5 ml of citrate buffer, 1.0 ml of
substrate, 0.3 ml of distilled water and the requisite amount of the enzyme source
(0.2 ml plasma). The reaction mixture was incubated at 37°C for 15 min. The reaction
was terminated by the addition of 1.0 ml of Folin’s phenol reagent. If turbidity
appears, the tubes were centrifuged. Controls without enzyme sources were also
incubated and the enzyme source was added after the addition of Folin’s phenol
reagent; 1.0 ml of 15% sodium carbonate solution was added and incubated for a
further 10 min at 37°C. The blue color developed was read at 640 nm using a
Shimadzu-UV-1601 spectrophotometer against a blank. The standards were also
treated similarly. The activity of the enzyme was expressed as micromoles of phenol
liberated per hour per liter (plasma) or micromoles of phenol liberated per milligram
protein (tissue).
Chapter- IV Materials & Methods
54
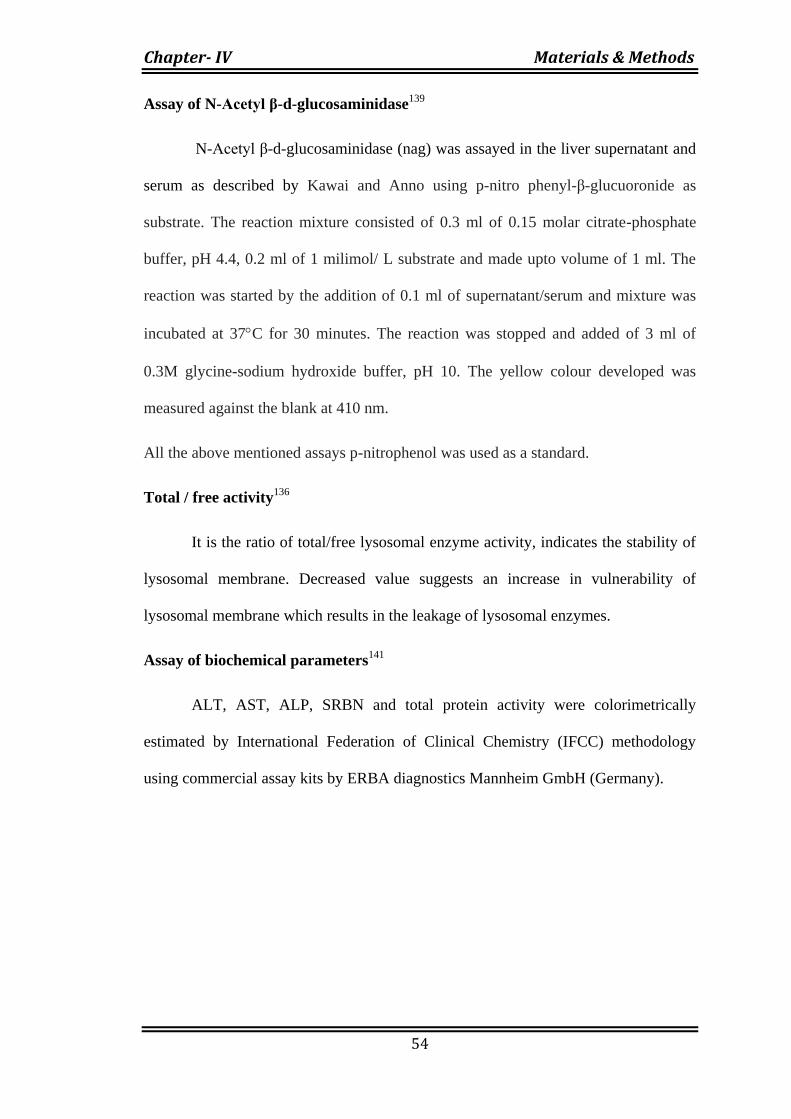
Assay of N-Acetyl β-d-glucosaminidase139
N-Acetyl β-d-glucosaminidase (nag) was assayed in the liver supernatant and
serum as described by Kawai and Anno using p-nitro phenyl-β-glucuoronide as
substrate. The reaction mixture consisted of 0.3 ml of 0.15 molar citrate-phosphate
buffer, pH 4.4, 0.2 ml of 1 milimol/ L substrate and made upto volume of 1 ml. The
reaction was started by the addition of 0.1 ml of supernatant/serum and mixture was
incubated at 37C for 30 minutes. The reaction was stopped and added of 3 ml of
0.3M glycine-sodium hydroxide buffer, pH 10. The yellow colour developed was
measured against the blank at 410 nm.
All the above mentioned assays p-nitrophenol was used as a standard.
Total / free activity136
It is the ratio of total/free lysosomal enzyme activity, indicates the stability of
lysosomal membrane. Decreased value suggests an increase in vulnerability of
lysosomal membrane which results in the leakage of lysosomal enzymes.
Assay of biochemical parameters141
ALT, AST, ALP, SRBN and total protein activity were colorimetrically
estimated by International Federation of Clinical Chemistry (IFCC) methodology
using commercial assay kits by ERBA diagnostics Mannheim GmbH (Germany).

Chapter- IV Materials & Methods
55
5. Assay procedure for estimation of biochemical parameters:
a. Estimation of AST (Aspartate serum Transaminase):
This reagent kit was intended for in-vitro quantitative determination of (AST)
activity in serum/plasma.
Method: International Federation of Clinical Chemistry (IFCC).
Principle:
AST Oxaloacetate + L- Glutamate. L-Aspertate+2-Oxoglutarate
Oxaloacetate + NADH MDH Malate + NAD
Sample pyruvate + NADH LDH L- Lactate + NAD
Clinical Significance:
AST occurs in all human tissues and present in large amounts in liver, renal,
cardiac and skeletal muscle tissue. AST Level increased in liver diseases, myocardial
infraction, muscular dystrophy and cholecystitis, where as decreased in patients
undergoing renal dialysis and those with B6 deficiency.
Reagent composition:
Reagent-1: AST Reagent
2-Oxaloglutarate 12 mmol/L
L-Aspartate 200 mmol/L
MDH ≥ 545 U/L
LDH ≥ 909 U/L
NADH (Yeast) ≥ 0.18 mmol/L
Tris Buffer (pH = 7.8± 0.1 at 25o C) 80 mmol/L
EDTA 5.0 mmol/L
Also contains fillers and stabilizers.
Chapter- IV Materials & Methods
56
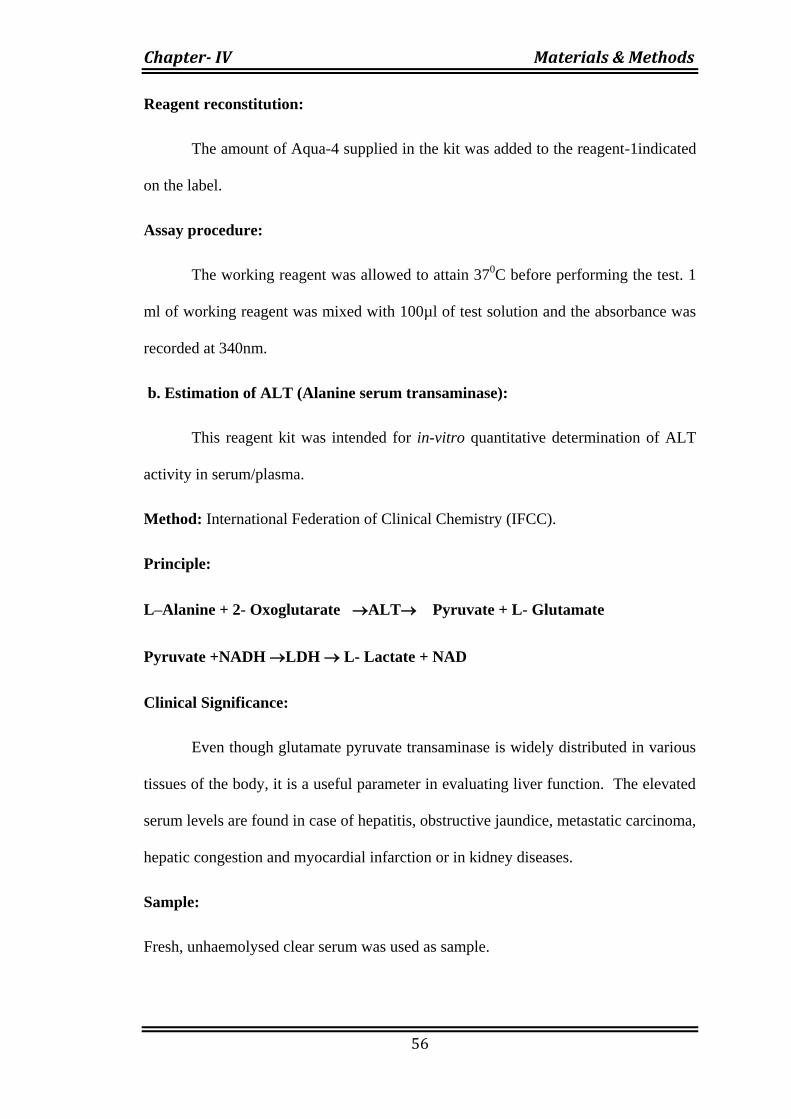
Reagent reconstitution:
The amount of Aqua-4 supplied in the kit was added to the reagent-1indicated
on the label.
Assay procedure:
The working reagent was allowed to attain 370C before performing the test. 1
ml of working reagent was mixed with 100µl of test solution and the absorbance was
recorded at 340nm.
b. Estimation of ALT (Alanine serum transaminase):
This reagent kit was intended for in-vitro quantitative determination of ALT
activity in serum/plasma.
Method: International Federation of Clinical Chemistry (IFCC).
Principle:
L–Alanine + 2- Oxoglutarate ALT Pyruvate + L- Glutamate
Pyruvate +NADH LDH L- Lactate + NAD
Clinical Significance:
Even though glutamate pyruvate transaminase is widely distributed in various
tissues of the body, it is a useful parameter in evaluating liver function. The elevated
serum levels are found in case of hepatitis, obstructive jaundice, metastatic carcinoma,
hepatic congestion and myocardial infarction or in kidney diseases.
Sample:
Fresh, unhaemolysed clear serum was used as sample.
Chapter- IV Materials & Methods
57
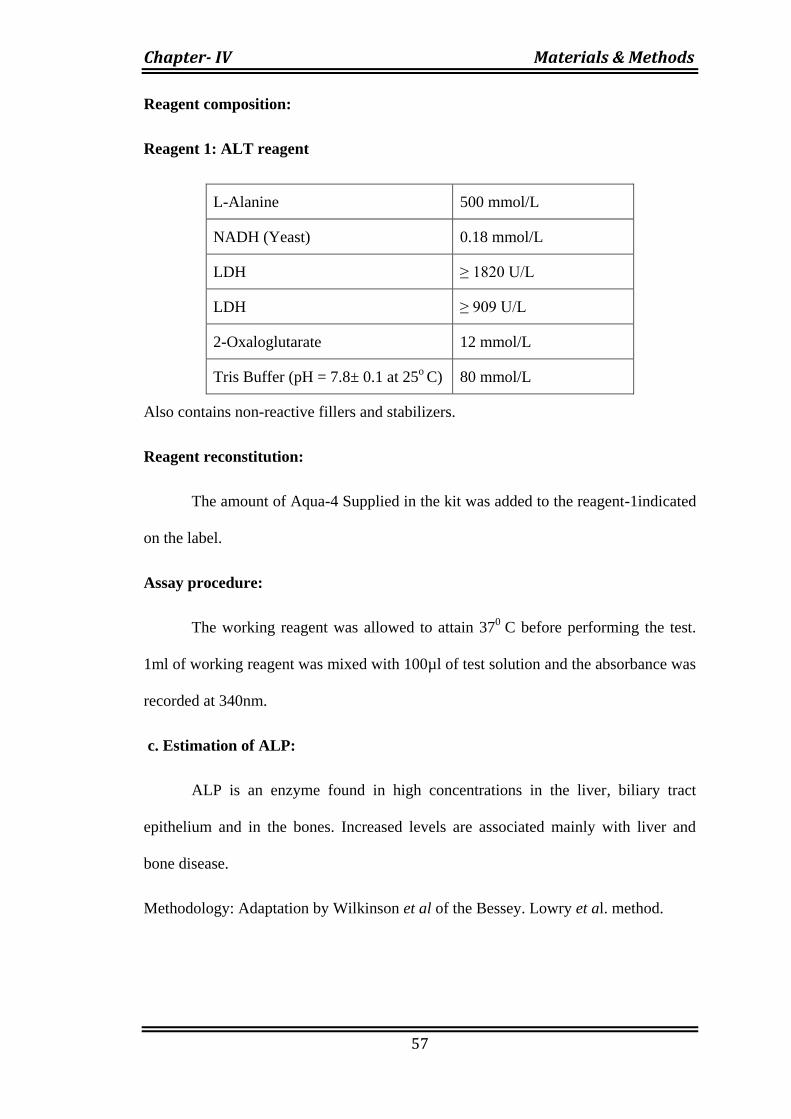
Reagent composition:
Reagent 1: ALT reagent
L-Alanine 500 mmol/L
NADH (Yeast) 0.18 mmol/L
LDH ≥ 1820 U/L
LDH ≥ 909 U/L
2-Oxaloglutarate 12 mmol/L
Tris Buffer (pH = 7.8± 0.1 at 25o C) 80 mmol/L
Also contains non-reactive fillers and stabilizers.
Reagent reconstitution:
The amount of Aqua-4 Supplied in the kit was added to the reagent-1indicated
on the label.
Assay procedure:
The working reagent was allowed to attain 370
C before performing the test.
1ml of working reagent was mixed with 100µl of test solution and the absorbance was
recorded at 340nm.
c. Estimation of ALP:
ALP is an enzyme found in high concentrations in the liver, biliary tract
epithelium and in the bones. Increased levels are associated mainly with liver and
bone disease.
Methodology: Adaptation by Wilkinson et al of the Bessey. Lowry et al. method.
Chapter- IV Materials & Methods
58
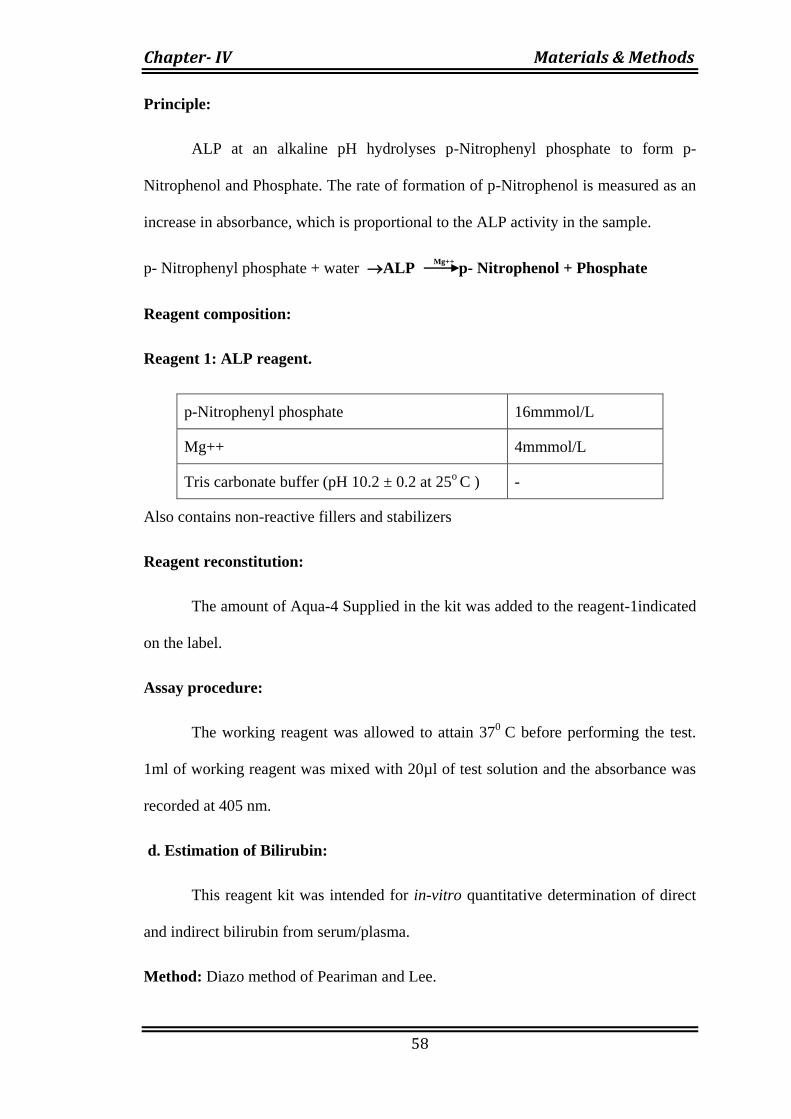
Principle:
ALP at an alkaline pH hydrolyses p-Nitrophenyl phosphate to form p-
Nitrophenol and Phosphate. The rate of formation of p-Nitrophenol is measured as an
increase in absorbance, which is proportional to the ALP activity in the sample.
p- Nitrophenyl phosphate + water ALP p- Nitrophenol + Phosphate
Reagent composition:
Reagent 1: ALP reagent.
p-Nitrophenyl phosphate 16mmmol/L
Mg++ 4mmmol/L
Tris carbonate buffer (pH 10.2 ± 0.2 at 25o C ) -
Also contains non-reactive fillers and stabilizers
Reagent reconstitution:
The amount of Aqua-4 Supplied in the kit was added to the reagent-1indicated
on the label.
Assay procedure:
The working reagent was allowed to attain 370
C before performing the test.
1ml of working reagent was mixed with 20µl of test solution and the absorbance was
recorded at 405 nm.
d. Estimation of Bilirubin:
This reagent kit was intended for in-vitro quantitative determination of direct
and indirect bilirubin from serum/plasma.
Method: Diazo method of Peariman and Lee.
Mg++

Chapter- IV Materials & Methods
59
Principle:
Bilirubin reacts with diazotized sulphanilic acid in acidic medium to form pink
colored azobilirubin with absorbance directly proportional to bilirubin concentration.
Direct bilirubin, being water soluble directly reacts in acidic medium. However
indirect or unconjugated bilirubin is solubilised using a surfactant and then it reacts
similar to direct bilirubin.
Reagent composition
Reagent 1: Total bilirubin reagent
Surfactant 1.00 %
HCl 100 m mol/L
Sulphanic acid 5 m mol/L
Reagent 2: Sodium Nitrate reagent
Sodium nitrate - 144 m mo/L
Reagent preparation:
Test Volume of
working
reagent
Add
Reagent 1 Reagent 2
Total bilirubin
10 ml 10 ml 0.2
25 ml 25 ml 0.5
50 ml 50 ml 1.0
100 ml 100 ml 2.0
Chapter- IV Materials & Methods
60
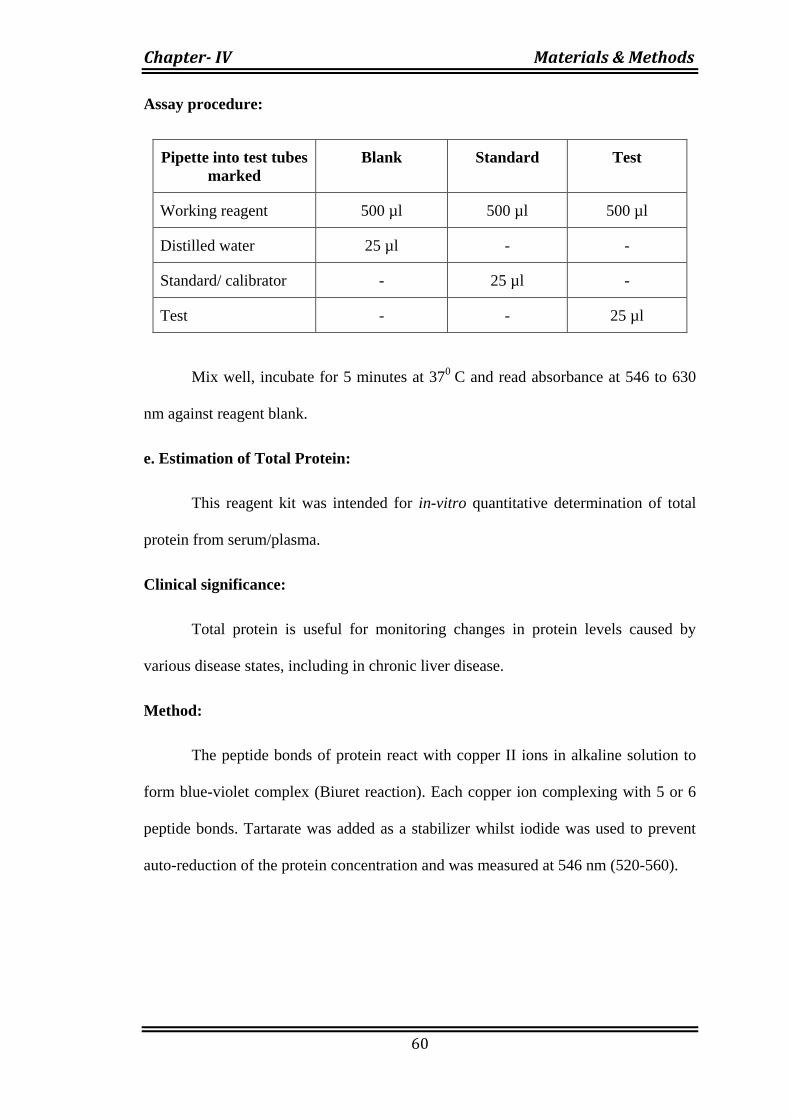
Assay procedure:
Pipette into test tubes
marked
Blank Standard Test
Working reagent 500 µl 500 µl 500 µl
Distilled water 25 µl - -
Standard/ calibrator - 25 µl -
Test - - 25 µl
Mix well, incubate for 5 minutes at 370
C and read absorbance at 546 to 630
nm against reagent blank.
e. Estimation of Total Protein:
This reagent kit was intended for in-vitro quantitative determination of total
protein from serum/plasma.
Clinical significance:
Total protein is useful for monitoring changes in protein levels caused by
various disease states, including in chronic liver disease.
Method:
The peptide bonds of protein react with copper II ions in alkaline solution to
form blue-violet complex (Biuret reaction). Each copper ion complexing with 5 or 6
peptide bonds. Tartarate was added as a stabilizer whilst iodide was used to prevent
auto-reduction of the protein concentration and was measured at 546 nm (520-560).
Chapter- IV Materials & Methods
61
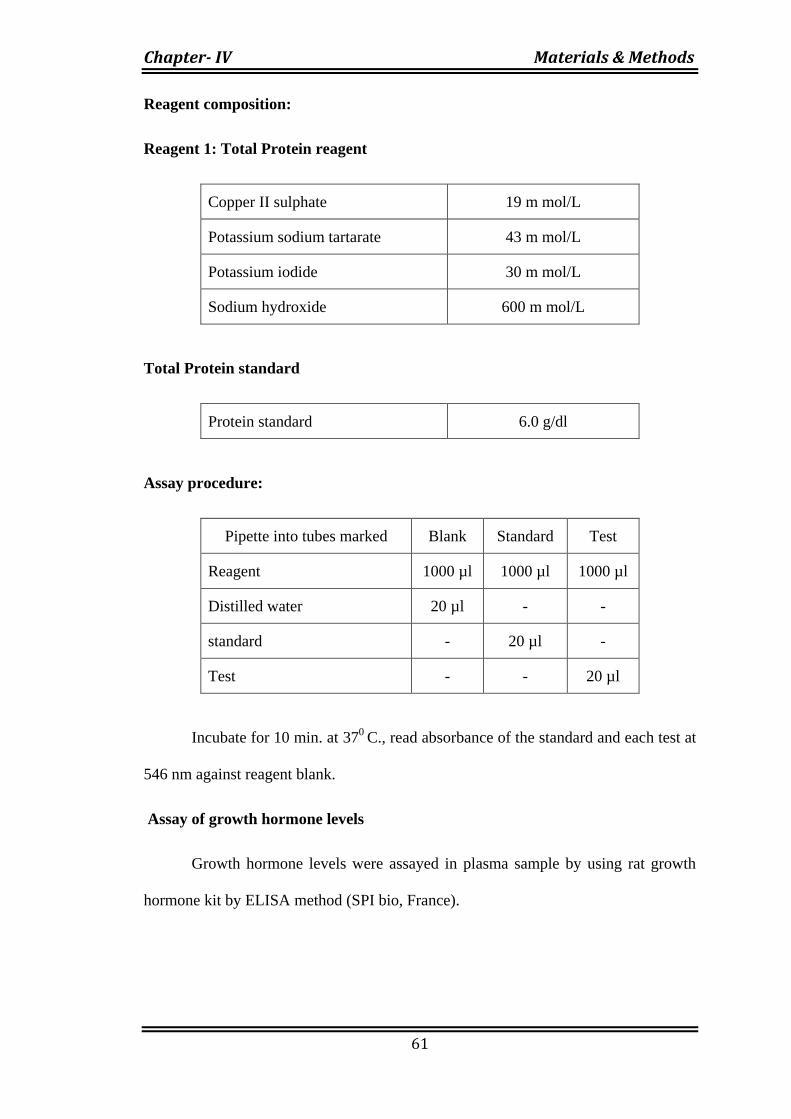
Reagent composition:
Reagent 1: Total Protein reagent
Copper II sulphate 19 m mol/L
Potassium sodium tartarate 43 m mol/L
Potassium iodide 30 m mol/L
Sodium hydroxide 600 m mol/L
Total Protein standard
Protein standard 6.0 g/dl
Assay procedure:
Pipette into tubes marked Blank Standard Test
Reagent 1000 µl 1000 µl 1000 µl
Distilled water 20 µl - -
standard - 20 µl -
Test - - 20 µl
Incubate for 10 min. at 370
C., read absorbance of the standard and each test at
546 nm against reagent blank.
Assay of growth hormone levels
Growth hormone levels were assayed in plasma sample by using rat growth
hormone kit by ELISA method (SPI bio, France).
Chapter- IV Materials & Methods
62
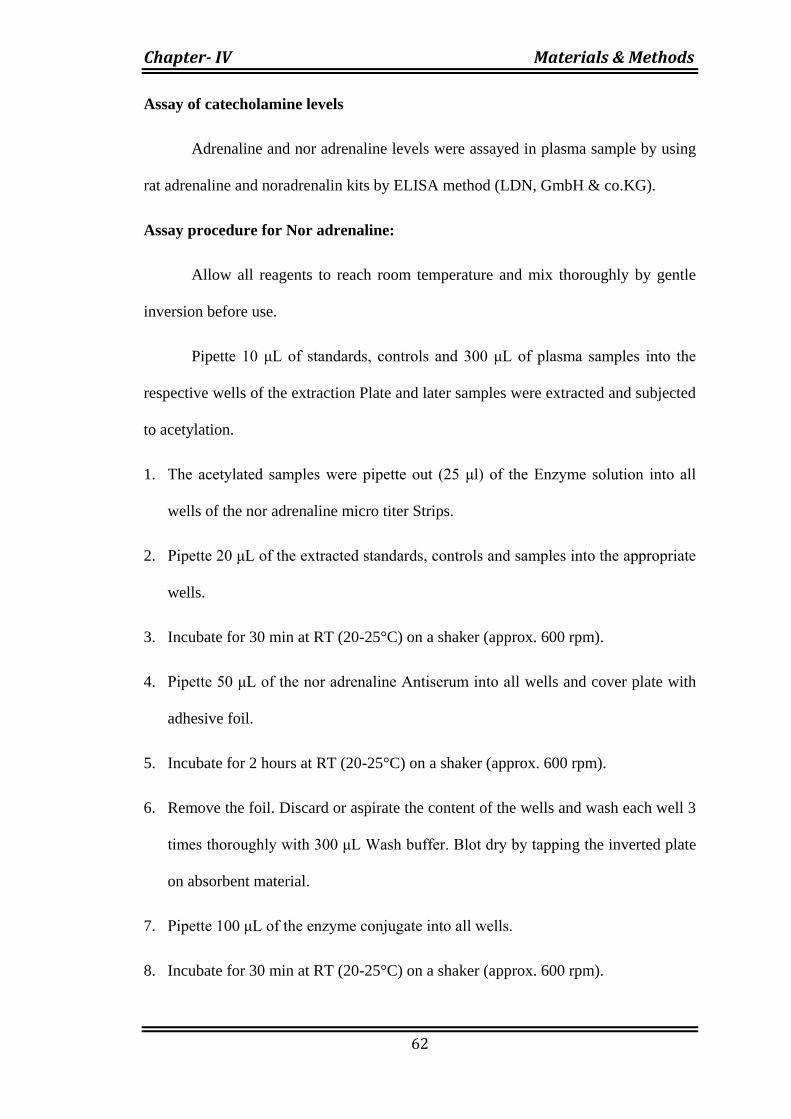
Assay of catecholamine levels
Adrenaline and nor adrenaline levels were assayed in plasma sample by using
rat adrenaline and noradrenalin kits by ELISA method (LDN, GmbH & co.KG).
Assay procedure for Nor adrenaline:
Allow all reagents to reach room temperature and mix thoroughly by gentle
inversion before use.
Pipette 10 μL of standards, controls and 300 μL of plasma samples into the
respective wells of the extraction Plate and later samples were extracted and subjected
to acetylation.
1. The acetylated samples were pipette out (25 μl) of the Enzyme solution into all
wells of the nor adrenaline micro titer Strips.
2. Pipette 20 μL of the extracted standards, controls and samples into the appropriate
wells.
3. Incubate for 30 min at RT (20-25°C) on a shaker (approx. 600 rpm).
4. Pipette 50 μL of the nor adrenaline Antiserum into all wells and cover plate with
adhesive foil.
5. Incubate for 2 hours at RT (20-25°C) on a shaker (approx. 600 rpm).
6. Remove the foil. Discard or aspirate the content of the wells and wash each well 3
times thoroughly with 300 μL Wash buffer. Blot dry by tapping the inverted plate
on absorbent material.
7. Pipette 100 μL of the enzyme conjugate into all wells.
8. Incubate for 30 min at RT (20-25°C) on a shaker (approx. 600 rpm).
Chapter- IV Materials & Methods
63
9. Discard or aspirate the content of the wells and wash each well 3 times thoroughly
with 300 μL Wash buffer. Blot dry by tapping the inverted plate on absorbent
material.
10. Pipette 100 μL of the substrate into all wells and incubate for 25 ±5 min at RT
(20-25°C) on a shaker (approx. 600 rpm). Avoid exposure to direct sun light!
11. Add 100 μL of the stop solution to each well and shake the micro titer plate to
ensure a homogeneous distribution of the solution.
12. Read the absorbance of the solution in the wells within 10 minutes, using a
microplate reader set to 450 nm and a reference wavelength between 620 nm and
650 nm.
Assay procedure for Adrenaline:
Allow all reagents to reach room temperature and mix thoroughly by gentle
inversion before use.
Pipette 10 μL of standards, controls and 300 μL of plasma samples into the
respective wells of the extraction plate and later samples were extracted and
acetylated.
1. Pipette 25 μl of the Enzyme Solution (refer to 6.1) into all wells of the Adrenaline
Micro titer Strips.
2. Pipette 100 μL of the extracted standards, controls and samples into the
appropriate wells.
3. Incubate for 30 min at RT (20-25°C) on a shaker (approx. 600 rpm).
4. Pipette 50 μL of the respective Adrenaline Antiserum into all wells and cover
plate with Adhesive Foil.
Chapter- IV Materials & Methods
64
5. Incubate for 2 hours at RT (20-25°C) on a shaker (approx. 600 rpm).
6. Remove the foil. Discard or aspirate the content of the wells and wash each well 3
times thoroughly with 300 μL Wash Buffer. Blot dry by tapping the inverted plate
on absorbent material.
7. Pipette 100 μL of the Enzyme Conjugate into all wells.
8. Incubate for 30 min at RT (20-25°C) on a shaker (approx. 600 rpm).
9. Discard or aspirate the content of the wells and wash each well 3 times thoroughly
with 300 μL Wash buffer. Blot dry by tapping the inverted plate on absorbent
material.
10. Pipette 100 μL of the Substrate into all wells and incubate for 25 ±5 min at RT
(20-25°C) on a shaker (approx. 600 rpm). Avoid exposure to direct sun light!
11. Add 100 μL of the Stop Solution to each well and shake the micro titer plate to
ensure a homogeneous distribution of the solution.
12. Read the absorbance of the solution in the wells within 10 minutes, using a
microplate reader set to 450 nm and a reference wavelength between 620 nm and
650 nm.
Assay procedure for Growth Hormone
Plate Preparation:
1. Prepare the wash buffer as indicated in the reagent preparation section. Open the
plate packet and select the sufficient strips for your assay and place the unused
strips back in the packet (stored at 4°C). Rinse each well five times with the wash
buffer (300 μl/well).

Chapter- IV Materials & Methods
65
2. Just before distributing reagents and samples, remove the buffer from the wells by
inverting the plate and shaking out the last drops.
3. A plate set-up is suggested on the following page. The contents of each well may
be recorded on the sheet provided with the kit.
Pipetting the Reagents:
B : Blank
NSB : Non-Specific Binding
Bo : Maximum Binding
S1-S8 : Standards 1-8
Samples or Quality controls
1. EIA buffer: Dispense 100 μl to Non-Specific Binding (NSB) wells and 50 μl
to Maximum Binding (Bo) wells.
2. Rat GH standard: Dispense 50 μl of each of the eight standards (S1 to S8) in
duplicate to appropriate wells. Start with the lowest concentration standard
(S8) and equilibrate the tip in the next higher standard before pipetting.
3. Quality control and samples: Dispense 50 μl in duplicate to appropriate wells.
Highly concentrated samples may be diluted in EIA buffer.
4. Rat GH antiserum: Dispense 50 μl to each well except the Non-Specific
Binding (NSB) wells.
Incubating the Plate:
5. Cover the plate with a plastic film and incubate for 20 hours at room
temperature.
Chapter- IV Materials & Methods
66
Distribution of Tracer
6. Rat GH AChE tracer: Dispense 50 μl to each well.
Incubating the plate:
7. Cover the plate with a plastic film and incubate for 20 hours at room
temperature.
Developing and Reading the Plate:
8. Reconstitute the wash buffer and Ellman's Reagent as indicated in reagent
preparation section. Empty the plate by turning over and shaking. Then, wash
each well five times with the wash buffer (300 μl/well).
9. Dispense 200 μl of Ellman's Reagent to the 96 wells. Incubate in the dark
(plate covered with an aluminium sheet) at room temperature. Optimal
development is obtained using an orbital shaker. The plate should be read
between 405 and 414 nm (yellow colour) when the Maximum Binding (Bo)
wells reach an absorbance of 0.2-0.8 unit.
Data Analysis
10. Make sure that your Plate Reader has subtracted the absorbance readings of
the blank well (absorbance of Ellman's reagent) from the absorbance readings
of the rest of the plate.
11. Calculate the average absorbance for each NSB, Bo, standards and samples.
12. Calculate the B/Bo (%) for each standard and sample: (average absorbance of
standards or sample -average absorbance of NSB) divided by (average
absorbance of Bo - average absorbance of NSB) and multiplied by 100.
Chapter- IV Materials & Methods
67
13. Using a semi-log graph paper, plot the B/Bo (%) for each standard point (y
axis) versus the concentration(x axis). Draw a best-fit line through the points.
14. To determine the concentration of samples, find the B/Bo (%) value on the y
axis. Read the corresponding value on the x axis which is the concentration of
your unknown sample. Samples with a concentration greater than 40 ng/ml
should be re-assayed after dilution in EIA buffer.
15. Most plate readers are supplied with curve-fitting software capable of
graphing this type of data (logit/log or 4-parameter). If you have this type of
software, we recommend using it. Refer to it for further information.
Statistical analysis:
The results were expressed as the mean ± SEM (n=6) for each group. Statistical
differences were evaluated using One-way analysis of variance (ANOVA) followed by
Dunnett’s test. Results were considered to be statistically significant at p < 0.01.
Recommended