STATE OF OHIO Workforce Investment Act
Program Year 2011 Annual Report
July 1, 2011 — June 30, 2012
TO STRENGTHEN OHIO FAMILIES WITH SOLUTIONS TO TEMPORARY CHALLENGES

This page has been intentionally left blank.

Page 3 PY 2011 WIA Annual Report
TABLE OF CONTENTS
A Message from Governor Kasich ...........................................................................................................4
A Message from Director Colbert ............................................................................................................5
Workforce Investment Act in Ohio ...........................................................................................................6
Governor’s Executive Workforce Board ..................................................................................................9
Ohio’s One-Stop System .......................................................................................................................10
Ohio’s Economic Outlook ......................................................................................................................11
Statewide Workforce Development Initiatives ....................................................................................... 13
OhioMeansJobs .............................................................................................................................. 13
Offender Network for Employment to STOP Recidivism ................................................................. 14
Connecting the Dots ....................................................................................................................... 14
Job Training Grants ........................................................................................................................ 15
On-the-Job Training ........................................................................................................................ 15
National Emergency Grants ............................................................................................................ 15
NEG Success Stories .............................................................................................................. 16
ShaleNET Training Comes to Ohio ................................................................................................. 17
Statewide Workforce Development Services .........................................................................................18
Registered Apprenticeship .............................................................................................................. 18
Migrant and Seasonal Farm Worker Program ................................................................................ 18
Foreign Labor Certification Program ............................................................................................... 18
Labor Market Information ................................................................................................................ 19
Services to Veterans ....................................................................................................................... 19
Veteran Success Stories ......................................................................................................... 21
Workforce Opportunity Tax Credit .................................................................................................. 22
PY 2011 Ohio Waiver Usage ................................................................................................................. 23
PY 2011 Participation Summary ............................................................................................................ 28
WIA Youth Program............................................................................................................................... 32
WIA Youth Success Stories ............................................................................................................34
WIA Adult Program ................................................................................................................................ 35
WIA Adult Success Stories .............................................................................................................37
WIA Dislocated Worker Program ........................................................................................................... 38
WIA Dislocated Worker Success Stories ........................................................................................40
Rapid Response Services ..................................................................................................................... 41
WIA Statewide Performance ................................................................................................................. 43
WIA Assurance Statement .................................................................................................................... 43
PY 2011 WIA Financial Statement ........................................................................................................ 44
PY 2011 WIA Expenditures ................................................................................................................... 45
PY 2011 Cost-Effectiveness Analysis ................................................................................................... 46
PY 2011 Statewide Evaluations ............................................................................................................ 46
Statewide Performance Tables ............................................................................................................. 47

Page 4 PY 2011 WIA Annual Report
A MESSAGE FROM GOVERNOR KASICH
I am pleased to share Ohio’s Workforce Investment Act (WIA) Annual Report for
program year 2011. It is a testimony to the hard work and commitment of our state’s
workforce development, education and economic development partners.
Our vision for Ohio is to create a business-friendly environment that fosters job
creation. This vision includes making state government smaller, more efficient and
more effective in order to get Ohioans back to work. It also means streamlining our
workforce development system with new strategies and processes that succeed. At
the heart of this vision is a blueprint for Ohio’s workforce development system – one
that transforms our programs and services, meets the needs of business, enhances
our citizens’ lives, and strengthens our economy.
In program year 2011, we moved boldly to lay the foundation for this blueprint by
establishing the Office of Workforce Transformation. The Office of Workforce Transformation and Governor’s
Executive Workforce Board work closely with business, education and job training leaders to make sure that
21st century workers have the skill sets needed for 21st-century jobs. State leaders understand that if Ohio’s
economy is to continue to thrive and grow, education and job training must reflect the demands of a 21st
century economy.
Over the past year, we have worked vigorously to move Ohio forward by fostering job growth through the
creation of JobsOhio. JobsOhio, the state’s private-sector economic development centerpiece, has played a
pivotal role in transforming our economy into long-term economic expansion through the creation and retention
of thousands of jobs throughout the state. Ohio’s economy is rebounding, thanks in part to the work of our
many partners and the success of our diverse industries: manufacturing, aerospace and aviation, automotive,
and energy to name a few.
But we know there is much more to be done. Moving forward, our goal is to continue to grow and sustain the
businesses that create jobs by transforming our workforce development system into a business-friendly
environment that fosters job creation and gets more Ohioans back to work. Working together, I know we can
make Ohio a stronger and better place.
Sincerely,
John R. Kasich
Governor

Page 5 PY 2011 WIA Annual Report
A MESSAGE FROM DIRECTOR COLBERT
Since becoming the director of the Ohio Department of Job and Family
Services, I have made getting more Ohioans back to work one of my top
priorities. In program year 2011, despite declining federal dollars for our
workforce programs, my administration worked hard to grow jobs and create a
highly skilled workforce that attracts and keeps business here in Ohio.
One of our primary tools for doing this has been OhioMeansJobs - the highly
successful resume and job bank we created in partnership with Monster.com,
the first public-private partnerships of its kind in the nation. Another highly
successful tool, On-the-Job Training, provides short-term, cost-effective training
to newly hired workers. It reimburses employers directly for part of the cost of
training new workers, up to $8,000 per employee. Because it is employer-
directed, it trains workers in the specific skills employers actually need.
The future for Ohioans is looking brighter. Each month, Ohio’s labor force statistics show improvement - a
concrete indicator that our unemployed citizens are being helped.
Program year 2011 also ended on a high note, with nearly 1.4 million Ohioans receiving workforce
services from the state’s network of One-Stop Centers throughout the state, and more than 40,000 Ohio
residents benefitting from WIA job counseling and placement programs. Through local workforce
investment areas’ efforts, another 12,800 unemployed adults and dislocated workers were placed in jobs.
State and local WIA programs also placed nearly 2,000 job seekers in high-demand occupations through
On-the-Job Training. These statistics demonstrate the positive effect that our workforce development
initiatives have on Ohio’s economy.
I am very proud of our workforce development team - employers, state and county staff, local workforce
investment areas, and colleges and universities - working together to get even more Ohioans trained with
the skills they need to support their families. We look forward to continuing the progress we’ve made and
helping even more Ohioans get back to work, become self-sufficient and support their families.
The following pages show examples of our team’s hard work and success, and we are pleased to share
them with you.
Sincerely,
Michael B. Colbert
Director

Page 6 PY 2011 WIA Annual Report
Introduction
Last year, close to 1.4 million Ohio residents received
workforce services from the state’s network of 30 full-
service and 60 satellite One-Stop Centers located
throughout the state. Ohioans came to One-Stops
with a range of economic experiences, barriers, and
backgrounds. Low-income adults and displaced
homemakers came looking for job search assistance
to improve their work conditions. Many youth needed
help learning new skills. Dislocated workers and
veterans needed assistance connecting to
unemployment benefits. Employers came to One-
Stops in search of a broad range of employment-
related and training services, including labor market
information, an improved trained employee pool,
assistance for laid-off workers, on-the-job and
customized training opportunities. What they found
were dedicated and engaged One-Stop staff readily
available to help them access services tailored to
their needs.
One of the primary funding sources for Ohio’s One-
Stops and ob development and training services is
the WIA Program, which has funded these activities
since July 1, 2000. In spite of being challenged by
declining federal dollars for workforce programs, the
state has made getting Ohioans back to work a
priority.
Workforce Vision and Goals
Governor John Kasich’s workforce vision is to create
a business-friendly environment that fosters job
creation. This vision includes making state
government smaller, more efficient, and more (Continued on page 7)
WORKFORCE INVESTMENT ACT IN OHIO
The Workforce Investment Act of 1998 establishes the structure and relationship between national, state, and local
workforce investment activities. The goal of WIA Title I-B is to increase occupational skill attainment, employment,
retention and earnings while improving the quality, productivity, and competitiveness of the workforce and reducing
welfare dependency for Ohioans and the nation.
This Program Year (PY) WIA Annual Report represents the 12th year of WIA Title I-B services in Ohio. It provides
a summary of WIA financial, participant, and performance information for the period July 1, 2011, through June 30,
2012.
Page 7 PY 2011 WIA Annual Report
effective in order to get Ohioans back to work.
Governor Kasich recognizes that a skilled workforce is
vital to ensuring a vibrant and growing economy. To
this end, the Governor has three overarching goals for
Ohio’s workforce system, with corresponding policy
priorities.
Goal 1 – Streamline workforce programs and
services
Policy priorities are to:
Reduce duplication of workforce programs and
services;
Increase collaboration and coordination;
Identify strengths and develop best practices; and
Align existing workforce programs to priorities
identified by business.
Goal 2 – Improve system performance and
access
Policy priorities are to:
Centralize workforce data collection and reporting;
Establish meaningful metrics to manage system
performance; and
Create, enforce and maintain a single point of
entry to access training and services.
Goal 3 – Invest resources to meet business and
individual needs
Policy priorities are to:
Work with business to identify both short- and
long-term workforce needs;
Make sound investments to ensure Ohio’s
educated and trained workforce is available to
meet business-identified needs, allowing business
to compete and prosper in a global marketplace
and allowing individuals to earn wages to sustain
themselves and their families; and
Support the advancement of the incumbent
workforce, underemployed and unemployed.
Ohio’s Workforce System
Ohio’s workforce system is comprised of several
partner agencies, offices, and boards that administer
various statutes and programs. These partners include
JobsOhio, the Office of Workforce Transformation
(OWT), the JobsOhio Network, the Governor’s
Executive Workforce Board (GEWB), the Ohio
Department of Job and Family Services (ODJFS), the
Ohio Development Services Agency, the Ohio Board
of Regents (OBOR), and the 20 designated local
workforce investment areas (LWIAs).
In 2011, the Kasich administration realigned Ohio’s
economic development efforts and created JobsOhio,
a private, nonprofit corporation. JobsOhio focuses its
economic development efforts on a diverse portfolio of
targeted industries and business functions that drive
the state’s economy and have the greatest impact on
job creation.
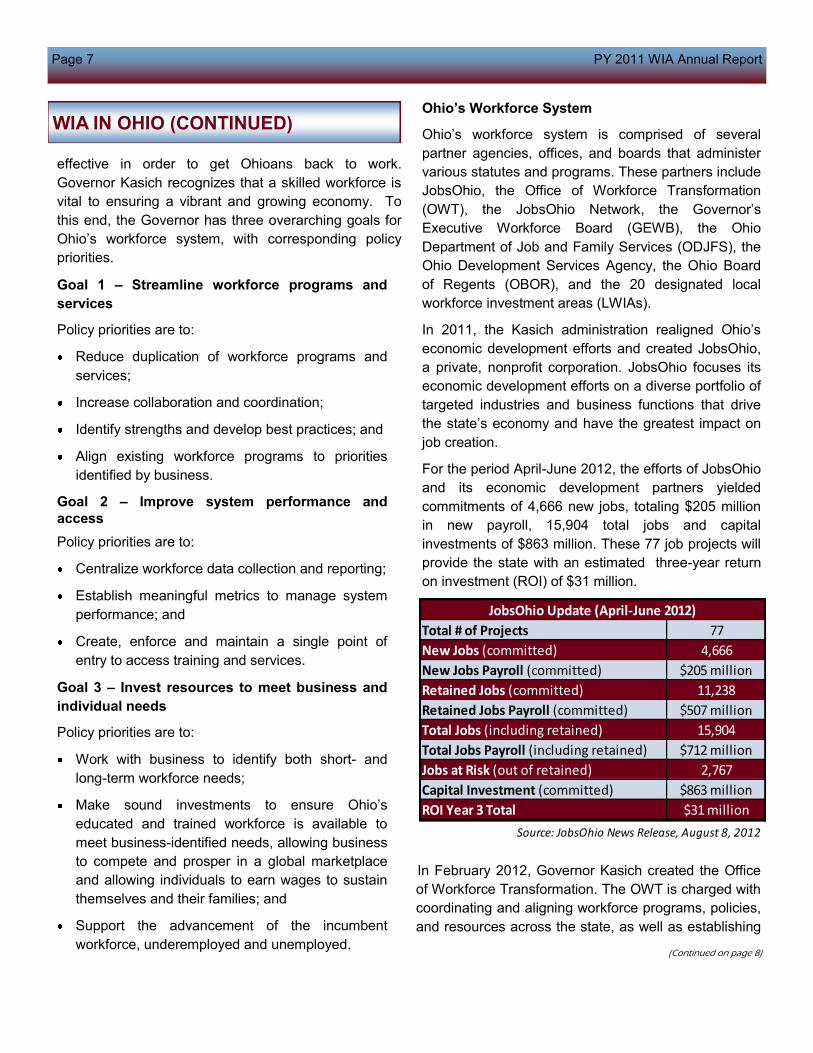
For the period April-June 2012, the efforts of JobsOhio
and its economic development partners yielded
commitments of 4,666 new jobs, totaling $205 million
in new payroll, 15,904 total jobs and capital
investments of $863 million. These 77 job projects will
provide the state with an estimated three-year return
on investment (ROI) of $31 million.
In February 2012, Governor Kasich created the Office
of Workforce Transformation. The OWT is charged with
coordinating and aligning workforce programs, policies,
and resources across the state, as well as establishing
(Continued on page 8)
WIA IN OHIO (CONTINUED)
Total # of Projects 77
New Jobs (committed) 4,666
New Jobs Payroll (committed) $205 million
Retained Jobs (committed) 11,238
Retained Jobs Payroll (committed) $507 million
Total Jobs (including retained) 15,904
Total Jobs Payroll (including retained) $712 million
Jobs at Risk (out of retained) 2,767
Capital Investment (committed) $863 million
ROI Year 3 Total $31 million
JobsOhio Update (April-June 2012)
Source: JobsOhio News Release, August 8, 2012

Page 8 PY 2011 WIA Annual Report
a state and local data collection system and cross-
agency workforce performance measures. The
Governor’s Executive Workforce Board, which
replaced the Governor’s Workforce Policy Advisory
Board, will assist OWT in directing workforce
development resources to maximize return on
investment and ensure optimal growth in Ohio’s
workforce economy. The JobsOhio Network, a
regional economic development partnership, will
support and grow the state’s economy by assisting in
the attraction, expansion, and retention of
businesses with high potential for job and wealth
creation in Ohio.
Under Governor Kasich’s leadership, the Ohio
Department of Job and Family Services, Office of
Workforce Development (OWD) has made getting
Ohioans back to work a top priority. As a prime
partner in Ohio’s workforce system, OWD provides
high-quality employment assistance, labor market
information, and job training through the
administration of the following programs: WIA Adult,
WIA Dislocated Worker, and WIA Youth, Rapid
Response, National Emergency Grants (NEGs),
Labor Market Information, Employment Services,
Foreign Labor Certification, Work Opportunity Tax
Credit, Veterans’ Services, and Apprenticeship.
The Ohio Development Services Agency has
responsibility for Third Frontier programs, small and
minority business and export assistance, tax credits
and workforce development, urban and site
development, housing, energy, community services
and the Governor's
Office of Appalachia.
The Ohio Board of
R egen ts i s t he
coordinating board for
the University System
of Ohio, which is one of
t h e l a r g e s t
c o m p r e h e n s i v e
systems of public
higher education in the
nation. ODJFS, in
partnership with OBOR and the University System of
Ohio, is developing a comprehensive workforce
training and placement strategy in support of high-
priority occupations, including those in the crude oil
and natural gas drilling and production industry.
ODJFS applied for and received a U.S. Department
of Labor (DOL) Discretionary Grant, the H-1B
Technical Skills Training Grant. The training is
administered by the Ohio Board of Regents via the
ODJFS. It is intended to raise the technical skill
levels of Ohio workers so they can obtain or upgrade
employment in high-growth industries and
occupations.
Another key partner, local workforce investment
areas, are governed by workforce investment boards
(WIBs). Ohio has 20 designated LWIAs. These local
areas play a major role in this comprehensive
workforce system alignment, which integrates Ohio’s
economic development, workforce development, and
education and training systems into a cohesive and
effective system. Each of these local areas maintains
commitments and partnerships with many
businesses, academic partners, and state and local
government officials. The WIBs, with support from
local elected officials and state and local partners,
work with the local areas to oversee WIA programs
and services.
WIA (CONTINUED)

Page 9 PY 2011 WIA Annual Report
GOVERNOR’S EXECUTIVE WORKFORCE BOARD
Name Title Organization Representative of…
John BarnesState
Representative
Ohio House of Representatives,
District 12Elected Official
Bill Beagle State Senator Ohio Senate, District 5 Elected Official
Ralf Bronnenmeier CEO Grob Systems Manufacturing
Roy A. Church PresidentLorain County
Community CollegeCommunity Colleges
Michael B. Colbert DirectorOhio Department
of Job and Family Services
State Workforce
Development Agencies
Janet Creighton Commissioner Stark County Local Government
Tim DericksonState
Representative
Ohio House of Representatives,
District 53Elected Official
Dennis Franks Superintendent Pickaway Ross Career
and Technology CenterCareer Technical Schools
Lou Gentile State Senator Ohio Senate, District 30 Elected Official
Vicki Giambrone Mayor Beavercreek Local Government
Michael P.
Grindley
Vice President of
Sales and MarketingPlaskolite Manufacturing
Amanda HoytDirector of
Public AffairsFinance Fund Business
Julie S. JansonPresident of
Utility OperationsDuke Energy Energy
David L. Joyce President/CEO GE Aviation Manufacturing
John R. Kasich Governor State of Ohio Elected Official
John Komor Plant Manager General Mills Food
Dennis A. Nash Director/CEO Kenan Advantage Group Distribution and Logistics
Phillip L. Parker President/CEODayton Area
Chamber of CommerceBusiness
Albert B. RatnerCo-Chairman
Emeritus
Forest City Enterprises, Inc.
BoardReal Estate
Doug Reffitt DirectorIndiana/Kentucky/Ohio Regional
Council of CarpentersLabor
Pat Sink Business ManagerInternational Union of Operating
Engineers, Local 18Labor
Richard A. Stoff President/CEO Ohio Business Roundtable Business
R. Blane Walter* Founder/CEO InChord Communications Business
Gary S. Weinstein COO Providence Equity Partners Finance
David Whitehead Former Executive FirstEnergy Energy
Thomas F. Zenty III CEO University Hospitals Biohealth
*Chairman of the Board

Page 10 PY 2011 WIA Annual Report
OHIO’S ONE-STOP SYSTEM
One-Stop Centers in all 88 Ohio counties provide services to local businesses and both employed and
unemployed job seekers. One-Stops work with county agencies and other partners to deliver a variety of
employment and training services to meet the needs of local customers.

Page 11 PY 2011 WIA Annual Report
Ohio’s economy has been slowly improving over the
last 12 months. Several key conditions point to an
improving economy:
A declining unemployment rate;
A 2 percent increase in total nonfarm employment
since June 2011;
An overall projected 4.3 percent growth in total
nonfarm employment (projected through 2018);
A significant increase in the number of online help
wanted job advertisements;
Employment growth of up to 5.8 percent in each of
Ohio’s eight largest metropolitan statistical areas
(projected through 2018);
Expected high occupational growth in several
high-skill, high-wage occupations; and
A high number of projected total annual job
openings across all occupations.
From June 2011 to June 2012, Ohio added a total of
100,200 nonfarm jobs. Strong industries include:
Manufacturing (+24,700 jobs);
Trade, Transportation and Utilities (+23,600 jobs);
Educational and Health Services (+20,100 jobs);
and
Professional and Business Services (+14,100
jobs).
In PY 2011, Ohio’s unemployment rate has steadily
decreased, from a high of 8.9 percent in July 2011 to
7.2 percent in June 2012. The state’s unemployment
rate, 7.2 percent in June, was a full point below the
national average.
Ohio’s unemployment rate dropped from a yearly
average of 10.5 percent in PY 2009 to 7.9 percent in
PY 2011. During PY 2007 - PY 2009, Ohio’s average
unemployment rate was above the U.S. rate. As can
be seen in the above average unemployment rates in
(Continued on page 12)
OHIO’S ECONOMIC OUTLOOK
Ohio’s Bureau of Labor Market Information (LMI) produces some of the most widely utilized economic
statistics that influence decisions of state and national government officials, business people, and individuals.
These statistics provide a comprehensive, up-to-date picture of Ohio’s economy. The data on these pages are
drawn from LMI reports. Sources are listed at bottom of page 12.
PY 2007 PY 2008 PY 2009 PY 2010 PY 2011
Ohio 5.9% 8.5% 10.5% 9.2% 7.9%
U.S. 5.0% 7.6% 9.7% 9.3% 8.6%
0.0%
2.0%
4.0%
6.0%
8.0%
10.0%
12.0%
Average Unemployment Rates in Ohio and U.S. (PYs 2007-2011)
June June Net Percent
2011 2012 Growth Growth
Total Nonagricultural 5,075,900 5,176,100 100,200 2.0%
Mining and Logging 11,500 11,900 400 3.5%
Construction 171,900 180,400 8,500 4.9%
Manufacturing 635,600 660,300 24,700 3.9%
Trade, Transportation and Utilities 955,400 979,000 23,600 2.5%
Information 75,800 76,600 800 1.1%
Financial Activities 278,400 278,300 -100 0.0%
Professional and Business Services 645,500 659,600 14,100 2.2%
Educational and Health Services 849,400 869,500 20,100 2.4%
Leisure and Hospitality 480,100 479,800 -300 -0.1%
Other Services 209,400 215,300 5,900 2.8%
Government 762,900 765,400 2,500 0.3%
Estimates represent nonfarm wage and salary jobs by place of work. Numbers subject to
annual benchmark revisions.
Industry
Ohio Employment by Major Industry Group, June 2011 - June 2012
0.0%
2.0%
4.0%
6.0%
8.0%
10.0%
Jul-11
Aug-11
Sep-11
Oct-11
Nov-11
Dec-11
Jan-12
Feb-12
Mar-12
Apr-12
May-12
Jun-12
Ohio 8.9% 8.8% 8.6% 8.3% 8.1% 7.9% 7.7% 7.6% 7.5% 7.4% 7.3% 7.2%
U.S. 9.1% 9.1% 9.0% 8.9% 8.7% 8.5% 8.3% 8.3% 8.2% 8.1% 8.2% 8.2%
PY 11 Unemployment Rates in Ohio and the U.S. (Seasonally Adjusted)
Note: Unemployment Rate Numbers are subject to revisions.

Page 12 PY 2011 WIA Annual Report
Ohio and the U.S. rates, both peaked at 10.5 and 9.7
percent, respectively, in 2009.
Statewide, employment has improved. During PY
2011, Ohio’s employment increased from a low of
5,288,000 in July 2011 to a high of 5,386,000 in May
2012. Numbers represent all persons employed,
whether agricultural or nonagricultural industries; part-
time or full-time; and payroll workers, self-employed
persons, unpaid workers in family enterprises, or
domestics.
Overall, total employment in Ohio is expected to grow
4.3 percent through 2018. The largest growth is
expected in the following industries:
Professional and technical services (22.2 percent);
Health care and social assistance (21.2 percent);
Educational services (13.7 percent);
Administrative and waste services (12.5 percent);
Construction (11.4 percent); and
Transportation and warehousing (9.5 percent).
Across all occupations between 2008 and 2018, Ohio
is projected to have an average of 166,269 job
openings a year. Even occupations and occupational
groups expected to shed jobs will still have openings
to replace workers who retire or leave for other
reasons.
The number of help wanted online job ads for Ohio
has trended upward since January 2009, reaching an
all-time high in June 2012.
All metropolitan statistical areas are expected to add
jobs through 2018. Total employment in Columbus is
expected to grow 5.8 percent. Employment is also
expected to grow 5 percent in Cincinnati-Middleton
and 4.3 percent in Akron. Of all projected job
openings in Ohio between 2008 and 2018, more than
half (55.1 percent) are expected to be in occupations
that require less than one year of on-the-job training.
In general, although the state faces many challenges,
including a declining yet still high unemployment rate
and continued slow growth from the recession, the
state is in a much better position to address its
challenges.
Sources: 2018 Ohio Job Outlook, ODJFS, Bureau of Labor Market Information, 2010 Current Employment Statistics Survey, ODJFS, Bureau of Labor Market Information, 2012 Local Area Unemployment Statistics, Civilian Labor Force Estimates, ODJFS, Bureau of Labor Market Information The Conference Board Help Wanted Online
Help Wanted Online Job Ads (Trends in Ohio)
5,250,000
5,300,000
5,350,000
5,400,000
PY 2011 Ohio Employment
ECONOMIC OUTLOOK (CONTINUED)
Jobs Percent Jobs Percent Jobs Percent
Akron 15,300 4.3% -4,800 -8.1% 19,500 7.1%
Canton-Massillon 4,700 2.6% -3,100 -7.7% 7,500 5.7%
Cincinnati-Middleton 54,800 5.0% -6,900 -3.9% 60,000 7.0%
Cleveland-Elyria-Mentor 18,800 1.7% -23,300 -12.8% 40,500 4.7%
Columbus 57,300 5.8% -7,900 -6.7% 63,800 7.9%
Dayton 8,200 2.0% -9,100 -13.7% 16,600 5.1%
Toledo 4,000 1.2% -7,800 -12.7% 11,300 4.5%
Youngstown-Warren-Boardman 2,800 1.2% -5,500 -11.8% 8,000 4.5%
Long-Term Employment Forecast by Metropolitan Statistical Area (MOA)
Total
MSA
Goods-Producing Service-Providing
2008-2018 Projected Change

Page 13 PY 2011 WIA Annual Report
OhioMeansJobs
OhioMeansJobs is the premier online resume and job
bank in the state. Together with Monster.com, Ohio
has created a private-public partnership that provides
job seekers and employers with free 24/7 access to
data. For employers, it lists millions of resumes with
advanced filtering tools that make it easy for them to
narrow down many resumes to the most promising
ones. The free data mining tools also help to entice
prospective companies to move their headquarters to
Ohio by showing them what skill sets are present in
the workforce. From July 2011 through March 2012,
employers used OhioMeansJobs to view more than
385,000 resumes. For job seekers, OhioMeansJobs
lists tens of thousands of job openings. Through the
website, job seekers can upload resumes, search for
jobs, find advice on interviewing, create resumes, and
more. In January 2012, the site had more than 3.9
million hits, its highest number ever.
The OhioMeansJobs.com website is not just a job
matching tool; it is also an important communication
tool. Special events, job fairs, training workshops, and
much more are featured on the home page and
targeted to employers and individuals seeking jobs.
Ohio also uses social networking to communicate with
employers, individuals, and workforce professionals.
The site has over 300 followers on Twitter, over 900
on Facebook, and over 130 on LinkedIn.
During PY 2011, many enhancements were made to
OhioMeansJobs. In January 2012, the state
launched a mobile phone application to allow Ohioans
to search, save, and apply for jobs from their iPhone,
iPad or Android device. In addition, an
OhioMeansVeteranJobs section was added, which
allows employers to search thousands of veterans’
resumes. Veterans can use it to look for jobs, learn
how their skills can be used in private sector careers,
and find out about all the programs they might be
eligible for.
Also new to OhioMeansJobs are the electronic job
board reports. These reports use Wanted Analytics
software to produce monthly snapshots of the number
of job ads organized by top employers, industries, and
occupations for Ohio and JobsOhio regions. Regional
talent reports are created each month that show how
(Continued on page 14)
STATEWIDE WORKFORCE DEVELOPMENT INITIATIVES
The ODJFS Office of Workforce Development oversees a variety of statewide initiatives that are funded through
the WIA Program. The purpose of these initiatives is to place added focus on special programs and populations
that need financial support above and beyond local area funding. Statewide initiatives cover a wide range of issues
and can vary each year. Some of the PY 2011 statewide initiatives included OhioMeansJobs, Offender Network for
Employment to STOP Recidivism, Connecting the Dots, Job-Training Grants, On-the-Job Training, National
Emergency Grants, and ShaleNET.
Page 14 PY 2011 WIA Annual Report
many resumes are posted for a select job title or key
word.
OhioMeansJobs also includes a link to the newly
created OhioMeansInternships.com, the premier
gateway to internship opportunities, co-ops, and other
information and news related to work-based learning
opportunities. Students can search for internships,
and businesses interested in hiring interns can post
their openings and search for talent.
Another enhancement to OhioMeansJobs is the
Business Support Center, featuring an online chat
option and customized assistance to employers. The
system uses “Live Person” software for chatting, an
interface portal, and the “Remedy” case management
system to track and resolve customer requests.
In June 2012, Ohio received a $12 million Workforce
Innovation Fund grant from DOL to expand and
enhance the OhioMeansJobs website and create a
new, online career counseling system. The electronic
OhioMeansJobs system will mirror services currently
available in One-Stop Centers and expand access to
Ohio’s workforce services by providing a variety of
online resources and tools for Ohioans to manage
their career development from any computer with
Internet access. These new, online career counseling
services will complement the already successful
OhioMeansJobs website and mobile application and
the OhioMeansInternships website.
Ohio will continue to promote OhioMeansJobs as the
universal brand for One-Stops. This will create
consistency and uniform identity, enhancing Ohio’s
ability to market programs and services and
increasing access for businesses and individuals.
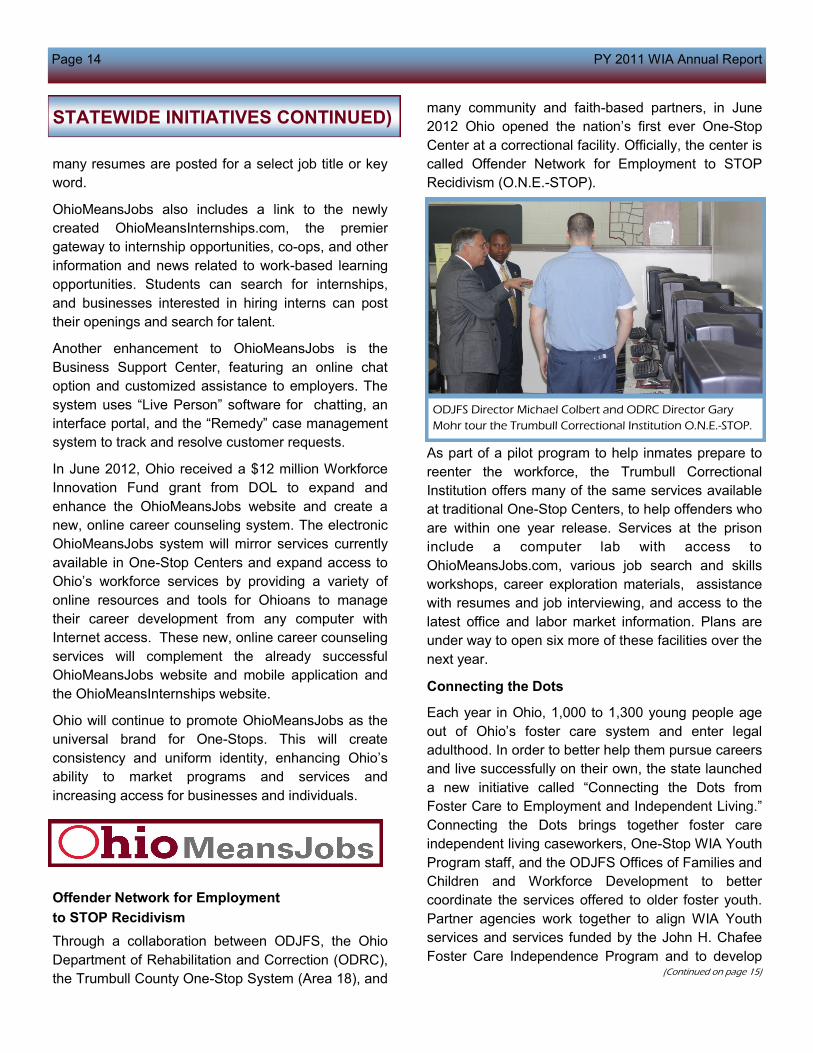
Offender Network for Employment
to STOP Recidivism
Through a collaboration between ODJFS, the Ohio
Department of Rehabilitation and Correction (ODRC),
the Trumbull County One-Stop System (Area 18), and
many community and faith-based partners, in June
2012 Ohio opened the nation’s first ever One-Stop
Center at a correctional facility. Officially, the center is
called Offender Network for Employment to STOP
Recidivism (O.N.E.-STOP).
As part of a pilot program to help inmates prepare to
reenter the workforce, the Trumbull Correctional
Institution offers many of the same services available
at traditional One-Stop Centers, to help offenders who
are within one year release. Services at the prison
include a computer lab with access to
OhioMeansJobs.com, various job search and skills
workshops, career exploration materials, assistance
with resumes and job interviewing, and access to the
latest office and labor market information. Plans are
under way to open six more of these facilities over the
next year.
Connecting the Dots
Each year in Ohio, 1,000 to 1,300 young people age
out of Ohio’s foster care system and enter legal
adulthood. In order to better help them pursue careers
and live successfully on their own, the state launched
a new initiative called “Connecting the Dots from
Foster Care to Employment and Independent Living.”
Connecting the Dots brings together foster care
independent living caseworkers, One-Stop WIA Youth
Program staff, and the ODJFS Offices of Families and
Children and Workforce Development to better
coordinate the services offered to older foster youth.
Partner agencies work together to align WIA Youth
services and services funded by the John H. Chafee
Foster Care Independence Program and to develop (Continued on page 15)
STATEWIDE INITIATIVES CONTINUED)
ODJFS Director Michael Colbert and ODRC Director Gary
Mohr tour the Trumbull Correctional Institution O.N.E.-STOP.

Page 15 PY 2011 WIA Annual Report
housing, food, health, transportation, education, and
employment solutions for foster youth.
The initiative has three main components: cross-
program training for staff; vocational services,
including mentoring, tutoring, and work experiences;
and better independent living support services. Five
areas have been chosen to be part of a two-year pilot
project: Hamilton County, Cuyahoga County, Lake
County, Summit County, and a consortium of Clinton,
Preble, Greene, and Montgomery counties. The best
practices learned in these pilot areas will be shared
with counties throughout the state.
Job-Training Grants
In October 2011, Ohio learned it would receive more
than $12 million in federal grants for job training and
other employment initiatives designed to help get
more Ohioans back to work. One of the grants — a
Disability Employment Initiative Grant for nearly $3
million — is aimed at helping adults and youth with
disabilities. Ohio was one of seven states to receive
this grant and will use it to improve education,
training, and employment opportunities and outcomes
for youth and adults who are unemployed,
underemployed and/or receiving Social Security
benefits.
The other grants, H-1B Technical Skills Training
grants totaling nearly $9 million, are designed to help
unemployed Ohioans learn the skills they need to find
jobs in specialized information technology and health
care fields. Ohio is one of 20 states to receive these
grants. H-1B funds provide On-the-Job Training and
job placement assistance to dislocated,
underemployed and unemployed students and
workers in high-growth fields previously filled by
foreign workers. As of June 2012, 13 Ohioans have
participated in H-1B-funded programs through four
educational institutions.
On-the-Job Training
In order to use limited federal dollars more effectively,
in recent years Ohio has shifted from a traditional,
long-term training model to a more responsive short-
term model, with an emphasis in On-the-Job Training
(OJT). On-the-Job Training allows workers to learn
and earn. It reimburses employers for part of the cost
of training new workers, up to $8,000 per employee.
The training is employer-directed, which means it
trains workers in the skills employers actually need.
OJTs are also cost-effective, as most people who
participate keep their jobs after the training ends.
From July 2011 through June 2012, 1,949 Ohioans
participated in OJTs.
National Emergency Grants
National Emergency Grants (NEGs) are WIA funds
that enable states and local areas to respond to large,
unexpected events that cause significant job losses,
such as mass layoffs or disasters. Ohio operated
several NEGs during PY 2011, as described below.
On-the-Job Training – This $3.8 million NEG
reimbursed employers for the cost of hiring and
training eligible laid-off workers who remained jobless
for 158 days or longer. Over 700 Ohioans have been
served by this funding and placed into employment,
spurring Ohio’s economic recovery.
Masco – Formerly known as Mills Pride, this cabinet
manufacturer was forced to close two worksites in
Pike County and lay off over 1,400 workers due to
foreign competition. This $3.5 million grant enabled
Pike County and surrounding counties (Scioto, Ross,
Jackson and Adams) to provide job search
(Continued on page 16)
STATEWIDE INITIATIVES (CONTINUED)
OJT Success Story
David, 45, worked as a machinist for Spirex
Company in Boardman, Ohio. In August 2011, he
was laid off. David’s job search led him to Butech-
Bliss, a builder of rolling mills, coil processing
equipment, and other machinery. They wanted to
hire him as a computer numerical control machinist.
However, his skills needed to be brought up to
Butech’s standards. With WIA funding and
assistance from the One-Stop Workforce System of
Mahoning and Columbiana counties (Area 17), he
received an employer-directed OJT. In January
2012, David completed his OJT and became a full-
time permanent computer numerical control
machinist with Butech making $18 an hour.

Page 16 PY 2011 WIA Annual Report
assistance, basic skills development, and support
such as transportation and relocation assistance.
Trade funding has been approved to cover the Masco
workers’ training costs.
Severstal/RG Steel – The decreased demand for
steel caused a series of over 1,300 layoffs at six
plants along the Ohio/West Virginia border. In 2012,
the company declared bankruptcy and announced
plans to idle the facilities. Many of the workers were
approved for Trade funding. This $533,000 grant
provided workers with wraparound services such as
case management and support services. Family
members and others not eligible for Trade received
the full array of services.
Storms 2011 – Severe storms in the spring of 2011
caused flooding and major damage in counties across
southern and southeastern Ohio. This $28 million
grant enabled 15 counties to hire up to 1,400
temporary workers to remove flood debris from public
lands and waterways and to help with cleaning,
repairing, or demolishing damaged public structures
and facilities.
Wilmington – The closure of the DHL Express
shipping hub in Wilmington resulted in over 10,000
layoffs across the region. Beginning in 2008, Ohio
received a series of grants totaling $11.2 million to
help DHL Express dislocated workers find new jobs,
retrain for new occupations, and receive the
supportive services necessary to complete training
and reenter the workforce.
NEG results show:
2,935 NEG participants were served.
1,363 NEG participants exited the program.
78.9 percent entered employment.
90.1 percent retained employment.
The program achieved a six-month average
earnings rate of $19,637, which was slightly
higher than the Dislocated Worker Program.
(Continued on page 17)
STATEWIDE INITIATIVES (CONTINUED)
NEG SUCCESS STORY
Music Teacher Pursues Nursing Career
Shawna always knew she wanted to be a nurse,
even though her resume was music-oriented. She
had a degree in music from Youngstown State
University, spent years teaching clarinet, and worked
15 years for a Pittsburgh-based music company. In
spite of this, she jumped at an opportunity to pursue
a nursing career, when in June 2009 and at the age
of 51 she was laid off from Volkwein’s Music.
In the fall of 2009, Shawna quickly found a place in
the nursing program at Kent State University – East
Liverpool Campus. She applied for and received
Dislocated Worker WIA funding through the Trumbull
County One-Stop (Area 18). Upon graduation in
May 2011, Shawna attended a Northeast Ohio
(NEO) HealthForce Career Workshop and met with
Christine Bok, Mahoning County One-Stop (Area 17)
account executive, and Ron Shadd, NEO
HealthForce coordinator. The two worked with her to
improve her resume, and she attended the One-
Stop’s resume workshop. During her job search,
Shawna also participated in an OJT workshop and
was certified as eligible for NEG/OJT funding.
Shawna passed the exam for her state license in
August 2011, and by November she had three job
offers. Shawna started her dream job at St. Elizabeth
Hospital with an NEG/OJT contract and at a wage of
$23.05 an hour. She is grateful to both the Trumbull
and Mahoning counties’ WIA programs and to
Christine and Ron for their encouragement and help.

Page 17 PY 2011 WIA Annual Report
ShaleNET Training Comes to Ohio
Launched in 2010 with a $4.9
million Community-Based Job
Training Grant awarded to
W estmore land Coun ty
Community College (PA)
by the Department of
L a b o r , M a r c e l l u s
ShaleNET (ShaleNET) is
a coordinated network of
industry representatives, the public workforce system,
and training providers. ShaleNET helps connect
unemployed, underemployed, and veteran
populations from Pennsylvania, West Virginia, New
York, and Ohio to training and jobs in the natural gas
drilling and production industry. The three-year grant
is designed to serve 69 counties and 15 workforce
investment areas in these states.
The natural gas industry and other energy sectors in
Ohio are expected to grow quickly. To meet this
demand, local workforce investment areas, the
Belmont County Department of Job and Family
Services (CDJFS - Area 16), the Mahoning and
Columbiana Training Association (MCTA - Area 17),
and Trumbull CDJFS (Area 18) are working with
ShaleNET-approved training providers, including
those in Ohio (Eastern Gateway Community College,
Lorain County Community College, and Stark State)
to train workers for targeted jobs in the shale gas
industry.
In Ohio, ShaleNET is
starting to have an
impact. Eastern Gateway
has completed five three-
week ShaleNET training
programs for entry-level
jobs such as roustabouts
and floor hands, and
more than 120 individuals
have been trained in the
program since March
2012. Dozens of classes
related to the industry are being offered, and more are
on the horizon. The majority of trainees have secured
jobs in the oil and gas industry or related fields.
Additionally, MCTA has written several ShaleNET
OJTs with Dearing Compressor and Pump Company
and anticipates more in the near future.
STATEWIDE INITIATIVES (CONTINUED)
NEG SUCCESS STORY
NEG/OJT Workshop Leads to New Job
After a 17-year career in sales and sales force
management with Proctor and Gamble Corp., Valerie
was unexpectantly laid off. She found employment in a
variety of secretarial and sales jobs but eventually
faced another layoff.
Valerie went to The Employment Source (Area 6 -
Stark County) for assistance. She found the staff to be
helpful and was sent many job leads and referrals.
After attending The Employment Source’s NEG/OJT
workshop, she approached Akron Thermography, Inc.,
a wholesale printing company, and told them about the
program. They offered her an OJT and worked with
The Employment Source to set up the contract. In
March 2012, Valerie began her employment as a
billing clerk with Akron Thermography, Inc., at an
hourly wage of $16.
Lisa Teague, owner of the company, is very pleased
with the NEG/OJT Program and Valerie’s performance
on the job. “She is a high caliber candidate and
employee,” Teague said. “Anytime you hire an
employee outside of your industry, there is a question
as to whether they will work well in an environment
they are not familiar with. Valerie is very smart. She
has caught on quickly and asks the right questions at
the right time.”

Page 18 PY 2011 WIA Annual Report
STATEWIDE WORKFORCE DEVELOPMENT SERVICES
Ohio works in partnership with the U.S. Department of Labor, the Governor's Office and a variety of
stakeholders to provide administrative and operational management and support for several statewide workforce
development programs. These include Registered Apprenticeship, Migrant and Seasonal Farm Worker, Foreign
Labor Certification, Labor Market Information, Veterans’ Services, and Work Opportunity Tax Credits.
Registered Apprenticeship
Ohio’s Registered
A p p r e n t i c e s h i p
Program uses an
industry-driven training
model designed to help
employers a t t rac t
qualified applicants and
increase productivity at
a reasonable cost.
E a c h R e g i s t e r e d
Apprenticeship program is sponsored by an
employer, a group of employers, and/or a labor
organization. Each combines on-the-job training and
related technical instruction to teach the practical and
theoretical aspects of a skilled occupation. This
training model allows businesses to improve the skills
of existing employees and quickly boost the
productivity of new hires.
The Ohio State Apprenticeship Council is authorized
to register apprenticeship programs and to certify
their trainees in Ohio. The council offers technical
assistance in designing programs and finding the right
educational facility for technical instruction.
Ohio’s program serves nearly 12,000 registered
apprentices and represents over 10,000 employers.
Ohio has close to 1,100 active programs registered
by the Ohio State Apprenticeship Council. The council
trains workers for nearly 200 occupations in many
industries, including aerospace, construction, energy,
information technology, manufacturing, the public
sector, health, telecommunications, transportation,
and more.
Migrant and Seasonal Farm Worker Program
Ohio is dedicated to serving the migrant and seasonal
farm worker and agricultural community. The Migrant
and Seasonal Farm Worker Program advocates on
behalf of migrant farm workers and is responsible for
informing the agricultural community of the many
services provided by the network of 30 full-service
and 60 satellite One-Stop Centers. One-Stop staff
help employers find migrant and seasonal farm
workers both in-state and out-of-state and help
connect them to services. In PY 2011, 2,280 migrant
seasonal farm workers received workforce services
from One-Stop Centers throughout the state.
According to the 2011 Migrant Census, the number of
migrant farm workers in Ohio declined 9 percent from
13,737 in 2010 to 12,516 in 2011. This included
9,895 workers 14 years old or older in 2011,
compared to 10,663 in 2010.
The following chart shows the 10 counties in Ohio
with the highest migrant populations in 2011. As
shown, Sandusky (1,615), Lake (1,450), and Huron
(1,250) had the highest migrant populace.
Foreign Labor Certification Program
The Foreign Labor Certification (FLC) H-2A
Temporary Agricultural Program provides certain
protections to ensure that the job opportunities
(permanent or temporary), wages, and working
conditions of U.S. workers will not be adversely
affected by the employment of foreign workers.
(Continued on page 19)
1,6
15
1,4
50
1,2
50
60
0
57
5
55
0
55
0
48
0
47
0
42
5
0
200
400
600
800
1,000
1,200
1,400
1,600
1,800
Ohio Counties with Highest Migrant Population

Page 19 PY 2011 WIA Annual Report
H-2A provides a way for Ohio agricultural employers
(farmers/growers) to hire foreign workers if they are
unable to find U.S. workers to fill job openings. It is
one of several FLC programs, but the only one that
states are involved in extensively. Ohio’s FLC Unit
has helped many employers to find and employ U.S.
workers. Each year, Ohio employers hire over 4,000
foreign workers to perform temporary, full-time work.
A Foreign Labor Certification H-2A
Temporary Agricultural Program
desk guide has been written by
state FLC staff to help One-Stop
staff and employers to understand
the H-2A application and
certification process. The desk
guide provides information about
job orders, referrals, active
recruitment, scheduling interviews,
referral verification forms, common
problems, and contact information.
For a copy of the guide, send an email to FLC staff at
Labor Market Information
Through its Bureau of Labor
Market Information (LMI), the
state collects and analyzes
industry, occupational and
employment information to
p rov ide s ta t i s t i cs on
economic and workforce
indicators for Ohio. This
includes employment levels,
unemployment rates, wages
and earnings, employment
p r o j e c t i o n s , c a r e e r
information, and initial and
continued unemployment claim trends. This
information is used by local workforce investment
areas, ODJFS, the Ohio Department of Education,
OBOR, state and national media, private citizens, and
industry groups.
LMI can help employers recruit qualified workers,
develop job descriptions, obtain affirmative action
data, learn about wages in their area, and make
sound economic decisions. Employers also can
obtain information about specific populations in Ohio
(e.g., veterans). The LMI website drew nearly 1.5
million page views in state fiscal year (SFY) 2012.
In order to help more people take advantage of labor
market research, LMI staff developed and launched a
series of real-time interactive webinars and
prerecorded, self-guided tours of the website. Six
modules have been designed for workforce
development professionals. Another five have been
designed for cash assistance recipients, to help them
in their career planning efforts.
LMI also developed the publication Profile of
Unemployment: A Post-Recession Analysis in SFY
2012. It examines which industries and occupations
have lost the most workers during the recent
recession and where the best opportunities for
reemployment are.
Services to Veterans
The goal of the Veterans
Services Program is to
eliminate unemployment
and underemployment
among Ohio’s veteran
population. To meet this
goal, local veterans’
employment representatives
and Disabled Veterans’
Outreach Program (DVOP)
specialists in One-Stops
across the state provide intensive services for
veterans with employment barriers. They also assist
businesses with their workforce needs and provide or
facilitate employment and placement services to
ensure that eligible veterans receive priority of service
in referrals to job openings and other services.
For PY 2011, Ohio’s One-Stops served 72,908
veterans, of which 47,386 received staff-assisted
services. Ohio’s Veterans Program exceeded all
negotiated measures (Entered Employment Rate,
Employment Retention Rate, and Average Earnings
(Continued on page 20)
WORKFORCE DEVELOPMENT
SERVICES (CONTINUED)

Page 20 PY 2011 WIA Annual Report
Rate) for veterans and disabled veterans as the chart
below shows.
During PY 2011, Veterans Services implemented
many improvements to increase opportunities for
veterans to receive priority services and employment.
For example, Ohio implemented a new initiative,
“Including Veterans in Employment through Short-
term Training” (INVEST OJT), to increase usage of
National Emergency Grant OJT services for veterans.
This initiative, which was launched in December 2011,
has provided 30 OJT contracts to veterans at an
average wage of $12.94.
In PY 2011, Ohio implemented the Gold Card
Initiative, which is designed to provide enhanced
intensive employment services for post-9/11 era
veterans. As of June 30, 2012, 2,283 veterans had
been identified as eligible to receive Gold Card
services, and 948 were receiving intensive services.
In addition, the ODJFS Office of Workforce
Development has created a program to reduce the
recidivism rate among veteran ex-offenders by
addressing employment barriers. This initiative,
called Successful Transition of Incarcerated Veterans
to Employment (STRIVE), was implemented with the
cooperation and involvement of the ODJFS Office of
Local Operations, Ohio Department of Rehabilitation
and Correction (ODRC), Ohio Citizen Circles, the
Ohio Adult Parole Authority, and the National Institute
of Corrections. The ODRC identifies veterans who are
within three to six months of their release, at which
time pre-release skills, including employment
workshops, are taught. STRIVE team members
perform teach job search workshops while the
veterans are still incarcerated. Ex-offenders are
assigned a DVOP as a case manager prior to their
release. After their release, they are referred to their
local One-Stops to gain the full range of employment
and training services.
Through a proclamation from Governor Kasich,
November has been designated as “Hire a Vet
Month.” In November and throughout the year,
employers are invited to consider the unique skills and
abilities of Ohio’s military veterans when seeking new
employees. The Veterans Services Program
promotes “Hire A Vet Month” and raises awareness of
the importance of supporting veterans through training
and employment opportunities.
Another veteran initiative, which also was an
interagency collaboration, is “Ohio Hires its Own:
From the Battle Front to Home Front.” Under the
leadership of the Ohio Board of Regents, ODRC,
ODJFS, the Ohio Department of Veterans Services,
and the Governor’s Office of Workforce
Transformation, agency staff worked closely with the
Ohio National Guard to prepare and learn how best to
serve recent returning veterans in need of training and
employment.
Veterans Services also works in partnership with the
U.S. Department of Labor and Veterans’ Employment
and Training Service (VETS) to meet the needs of
Ohio’s veterans and employers. VETS provides
resources and expertise to help veterans obtain
meaningful careers, maximize their employment
opportunities, and protect their employment rights.
For employers who wish to hire Ohio veterans,
OhioMeansJobs.com highlights those individuals
who have identified themselves as veterans. By
clicking on the “OhioMeansVeteransJobs” link,
employers have access to thousands of veterans’
resumes and veterans have access to a variety of
information to help them transition from active duty to
a new career.
(Continued on page 21)
WORKFORCE DEVELOPMENT
SERVICES (CONTINUED)
One-Stop Performance Results for VeteransNegotiated
Performance
Actual
Performance
Veterans Entered Employment Rate 35.0% 43.0%
Veterans Employment Retention Rate 66.0% 79.0%
Veterans Average Earnings Rate $17,000 $19,696
Disabled Veterans Entered Employment Rate 35.0% 44.0%
Disabled Veterans Employment Retention Rate 68.0% 78.0%
Disabled Veterans Average Earnings Rate $17,000 $18,965

Page 21 PY 2011 WIA Annual Report
Gold Card Veteran’s Future Looks Brighter
Josh, a Gold Card veteran, served four years in the
U.S. Marines before he received an honorable
discharge from the military. He had a wife and
newborn baby. Looking to provide a decent income
for them, he enrolled in college but soon discovered
that it was not for him. He suddenly found himself
jobless, homeless, and divorced.
When Josh came to the SuperJobs Center One-Stop
(Area 13 - Hamilton County), he was behind in his
child support and had no valid driver’s license. He met
with DVOP Freddie Joyner and told him that his goal
was to re-enlist into the military. Josh had already
tried to re-enlist in the Marines but found he had
waited too long and was no longer eligible. Joyner
was able to set up an appointment for Josh to meet
with a U.S. Army recruiter. The recruiter met with Josh
and told him that he was eligible for the Army’s
Special Forces.
However, two barriers stood in Josh’s way of signing
his Army contract. He had a pending misdemeanor
case and still did not have a driver’s license. Joyner
referred him to Legal Aid, and his Army recruiter wrote
a letter to the judge explaining Josh’s intent to return
to the military. Joyner also helped him to secure
housing through Goodwill, find a part-time job as a
security guard, and obtain a bicycle to get to work.
Although Josh has yet to return to the military, the
future is looking brighter for him. He has a valid
driver’s license and is paying his child support. Once
Josh finishes paying the court costs resulting from his
misdemeanor, he will be free to re-enlist.
DVOP Provides Assistance to Disabled Veteran
In 2006, Martin was a sophomore attending the
University of Texas when his cousin was killed in
Afghanistan. The day after the funeral, Martin joined
the U.S. Army.
In 2011, Martin was
medically discharged after
being injured. He moved to
Parma, Ohio, and was
having difficulty paying his
monthly bills. He soon fell
behind on his mortgage, car,
and utility payments.
As a disabled veteran,
Martin was referred to
DVOP Joshua Collins at the
Employment Connection,
Cuyahoga County’s One-Stop (Area 3). Collins
quickly connected Martin to partner veterans’
organizations, and they were able to provide him with
$1,000 in assistance for his delinquent bills.
Collins also worked closely with Martin to tailor his
resume for his job search. Within weeks, Martin had a
job with the Red Cross for an executive assistant
position at a starting pay rate of $18 an hour.
Ex-offender Reenters the Workforce
In November 2011, after serving 14 years for armed
robbery, Army veteran Jay was released from prison.
He met with DVOP Patrick Grames at The Source
One-Stop in Lucas County (Area 9) for case
(Continued on page 22)
VETERAN SUCCESS STORIES

Page 22 PY 2011 WIA Annual Report
management services and employment assistance.
During his assessment, other barriers were identified
such as homelessness and a lack of computer and
job skills. A family member stepped in and provided
him with housing.
Determined to improve his chances of successfully
reentering the workforce, Nobles frequently used the
One-Stop’s job search and employee-related
services. Upon Grames’ suggestion, Nobles attended
a job fair for the newly built Hollywood Casino that
was opening in Toledo. He did not expect to be hired
because he was an ex-offender. However, to his
surprise, he received an email from the casino’s
human resources department requesting additional
information to perform a background check. Nobles
submitted the additional information and was soon
contacted by the company to schedule a drug screen.
Three weeks later, Hollywood Casino called him and
offered him a job as a custodial worker making $10 an
hour with benefits and overtime.
Work Opportunity Tax Credit
The Work Opportunity Tax Credit (WOTC) program
provides Ohio employers with a federal tax credit
when they hire individuals from 10
targeted groups of disadvantaged
job seekers. Additionally, the
Veterans Opportunity to
Work (VOW) to Hire Heroes
Act of 2011 provides an
additional tax credit for
employers who hire veterans
with service-connected
disabilities. The changes
apply to individuals who
begin working between
November 22, 2011, and
January 1, 2013.
Qualified target groups include:
IV-A Temporary Assistance to Needy Family
(TANF) recipients;
Veterans;
Ex-felons;
Designated community residents;
Vocational rehabilitation referral applicants;
Summer youth;
Food Assistance recipients;
Supplemental Security Income recipients;
Long Term TANF Recipients; and
Unemployed veterans.
Employers seeking to hire employees from targeted
groups can electronically access an application,
apply for tax credits, request certification, and enter
data through the WOTC online application at
https://www.odjfs.state.oh.us/WOTC-WTW/.
Benefits to requesting WOTC certification include
reduced postage fees, immediate postmark date,
expedited processing, next-day status, and immediate
issue resolution. There are no limits to the number of
eligible employees an employer can hire, and tax
credits range from $1,200 to $9,000.
WORKFORCE DEVELOPMENT
SERVICES (CONTINUED)

Page 23 PY 2011 WIA Annual Report
1. Waiver of WIA Section 133(b)(4) to increase the
transfer of funds between the Adult and
Dislocated Worker local formula funds from 30
percent to 50 percent
Ohio’s waiver to transfer up to 50 percent of Adult and
Dislocated Worker funds between programs has been
used successfully by WIBs to provide the
unemployed, public assistance recipients, and low-
income adults with greater access to intensive and
training services. Local areas have effectively used
the waiver’s flexibility to meet the demands of their
customers and maximize services by responding
directly to changes within their local labor markets,
including company closings, increased enrollments,
and increased training costs.
Outcomes: During PY 2011, nine of Ohio’s 20 WIBs
transferred nearly $2.5 million in Dislocated Worker
funds to Adult funds to efficiently serve their
customers. In addition, six WIBs transferred close to
$240,000 in Adult funds to Dislocated Worker
programs.
2. Waiver of the required 50 percent employer
match for customized training at WIA Section
101(8)(c) and 20 CFR 663.715
Ohio was granted a waiver of the required 50 percent
employer contribution for customized training, to
permit local areas to use a sliding scale for the
employer contribution based on the size of the
business. Statewide, this waiver’s flexibility enables
local areas to improve their ability to respond to
employer needs and industry changes. Under this
waiver, the following employer match scale is
permitted: 1) no less than 10 percent match for
employers with 50 or fewer employees; 2) no less
than 25 percent match for employers with 51 to 100
employees; and 3) the current 50 percent match for
employers with more than 100 employees.
Outcomes: Customized training provides a
commitment by employers to employ some or all
successful completers of the training or continue to
employ incumbent workers. With limited funds at the
local level in PY 2011, only a small number of
employers offered customized training services under
this waiver. Although demand for customized training
and funding did not provide many WIBs with the
opportunity to use this waiver in PY 2011, several
WIB directors reported that they plan to utilize this
waiver in PY 2012.
3. Waiver of the required 50 percent limit on
reimbursement to employers for On-the-Job
Training, to permit local areas to use a sliding
scale to increase the wage reimbursement based
on the size of the business
This OJT waiver applies to WIA formula funds only.
Its goal is job creation, and its a critical tool in
supporting both employers and job seekers. Through
waiver flexibility, local areas have been able to
reimburse employers that provide OJT opportunities
on a sliding scale fee instead of the previously
allowable 50 percent amount. Under the waiver, the
following scale is used: 1) up to 90 percent for
(Continued on page 24)
PY 2011 OHIO WAIVER USAGE
In PY 2011, Ohio requested and received 13 DOL waivers that support workforce development activities and
provide maximum flexibility for employers and job seekers utilizing WIA programs and services. These waivers
are consistent with key guiding principles that align workforce development with state and regional economic
development, improve outcomes through cross-program alignment, provide dual-customer focus by matching
investments in job seekers with employer needs, and strengthen Ohio’s delivery system by easing
administrative burdens.
To track WIA waiver usage for reporting and evaluation purposes, Ohio periodically requests information on the
implementation of waivers at the local level. Listed below are the approved waivers with supporting
documentation collected from the state’s WIA database, fiscal reports, online surveys, field research, and local
areas.

Page 24 PY 2011 WIA Annual Report
employers with 50 or fewer employees; 2) up to 75
percent for employers with 51-250 employees; and (3)
the current 50 percent match for employers with more
than 250 employees.
Outcomes: By waiving the 50 percent reimbursement
requirement, WIBs have a viable tool to encourage
Ohio employers, particularly small employers, to
provide OJT opportunities to job seekers they might
not otherwise consider during tough economic times.
For employers, the waiver provides greater incentives
for them to hire new workers by minimizing new hire
risks, saving both time and money. OJTs also provide
employers with another viable option to expand and
grow their business. For job seekers, OJTs give
them the opportunity to learn occupational skills and
earn wages immediately.
During PY 2011, the state provided 1,333 formula-
funded OJTs. Of these, four WIBs used this waiver to
provide 94 OJTs to job seekers through 20 different
employers. Ohio used the waiver to provide 20 more
OJTs to customers during PY 2011 than in PY 2010.
In addition, 616 OJTs were provided by the NEG
award for OJTs.
4. Waiver to permit up to 10 percent of local Adult
and 10 percent of local Dislocated Worker funds
to be used by local areas to conduct allowable
statewide activities as identified at WIA Section
134(a)(3) for incumbent worker training (IWT)
As a partnership between the public workforce system
and employers, Ohio’s incumbent worker training
provides specific, short-term training to help
employers become more sustainable, competitive,
and profitable, thereby reducing the risks of layoffs.
Through waiver authority, Ohio was granted approval
to use up to 10 percent of local Adult formula funds
and up to 10 percent of Dislocated Worker formula
funds for incumbent worker training for skill attainment
as part of a layoff aversion strategy. For Adult fund
usage, eligibility was limited to low-income adults.
Outcomes: Employer outcomes included decreased
waste, increased profits, improved quality and
efficiency, and reduced layoffs. Employee outcomes
included improved job performance, increased
productivity, improved safety performance, enhanced
technical skills, and increased wages.
Businesses that utilized IWT also were shown to have
stronger relationships with the local areas, as
evidenced by increased participation in job fairs and
other employer services. In PY 2011, four local
areas used this waiver to provide IWTs to more than
344 employees and provide seven employers with
incumbent worker services.
The IWT program has proven to be an effective
economic development and workforce enhancement
tool. However, because of funding limitations, this
waiver was not widely used in PY 2011.
5. Waiver to permit up to 20 percent of Rapid
Response funds to be used for allowable
statewide activities as defined under WIA Section
134(a)(3) for incumbent worker training as part of
a layoff aversion strategy
The economic downturn, has forced many businesses
to change how they do business, to avoid layoffs or
closings. One strategy that can help avert layoffs is
IWT activities funded by statewide Rapid Response
(Continued on page 25)
PY 2011 OHIO WAIVERS (CONTINUED)
Areas
Number of
IWT
Employers
Number of
IWT
Employees
4 2 170
7 2 170
18 2 4
19 1 Not Reported74
94
0
20
40
60
80
100
PY 2010 PY2011
OJT Waiver Usage(PY 2010 - PY 2011)
Page 25 PY 2011 WIA Annual Report
WIA funds. This waiver enables employers to utilize
IWT to expand opportunities for workers while they
are still employed.
Outcomes: Ohio as a whole, local areas, businesses,
and employees have benefited from this waiver. It has
also allowed the state to better integrate Rapid
Response services and layoff aversion strategies and
gives employers a more educated and skilled
workforce. Other outcomes include greater
partnerships among workforce development,
economic development, and educational entities;
increased leveraging of resources; and increased
efforts to avert layoffs. In short, this waiver provides
Ohio with the needed flexibility to meet the growing
demand for innovative incumbent worker training,
supporting both employers and employees in a
competitive labor market.
6. Waiver to permit the state to replace the
statutory performance measures at WIA Section
136(b) with common measures for reporting
purposes
Ohio has been able to simplify its data collection and
reporting processes as this waiver permits the state
to negotiate and report WIA outcomes against the
common performance measures instead of the 17
performance measures described in WIA Section
136(b).
Outcomes: Waiver approval has eliminated
duplicative data-reporting requirements and simplified
the state’s performance management system. By
changing the focus of the Adult and Youth programs,
Ohio has been able to place greater emphasis on
employment, retention, and wage gains for adults,
and on employment, education, and skill attainment
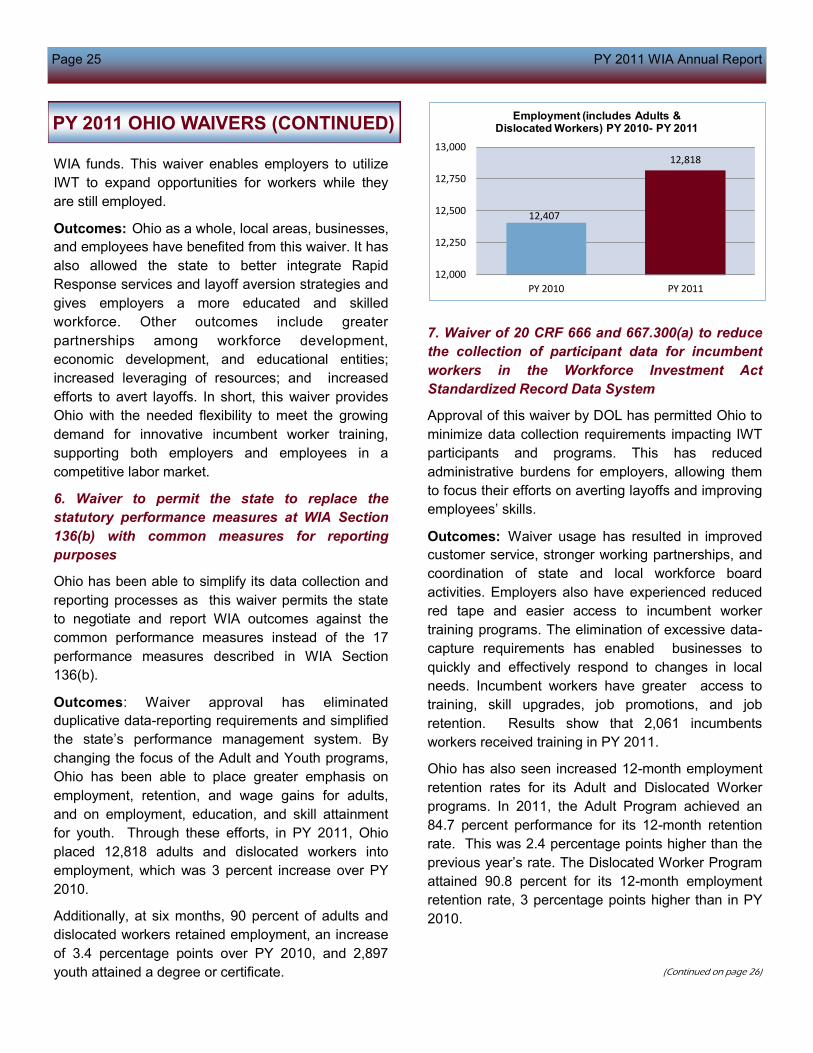
for youth. Through these efforts, in PY 2011, Ohio
placed 12,818 adults and dislocated workers into
employment, which was 3 percent increase over PY
2010.
Additionally, at six months, 90 percent of adults and
dislocated workers retained employment, an increase
of 3.4 percentage points over PY 2010, and 2,897
youth attained a degree or certificate.
7. Waiver of 20 CRF 666 and 667.300(a) to reduce
the collection of participant data for incumbent
workers in the Workforce Investment Act
Standardized Record Data System
Approval of this waiver by DOL has permitted Ohio to
minimize data collection requirements impacting IWT
participants and programs. This has reduced
administrative burdens for employers, allowing them
to focus their efforts on averting layoffs and improving
employees’ skills.
Outcomes: Waiver usage has resulted in improved
customer service, stronger working partnerships, and
coordination of state and local workforce board
activities. Employers also have experienced reduced
red tape and easier access to incumbent worker
training programs. The elimination of excessive data-
capture requirements has enabled businesses to
quickly and effectively respond to changes in local
needs. Incumbent workers have greater access to
training, skill upgrades, job promotions, and job
retention. Results show that 2,061 incumbents
workers received training in PY 2011.
Ohio has also seen increased 12-month employment
retention rates for its Adult and Dislocated Worker
programs. In 2011, the Adult Program achieved an
84.7 percent performance for its 12-month retention
rate. This was 2.4 percentage points higher than the
previous year’s rate. The Dislocated Worker Program
attained 90.8 percent for its 12-month employment
retention rate, 3 percentage points higher than in PY
2010.
(Continued on page 26)
PY 2011 OHIO WAIVERS (CONTINUED)
12,407
12,818
12,000
12,250
12,500
12,750
13,000
PY 2010 PY 2011
Employment (includes Adults & Dislocated Workers) PY 2010- PY 2011

Page 26 PY 2011 WIA Annual Report
8. Waiver of the prohibition at 20 CFR Section
664.510 on the use of individual training accounts
for older and out-of-school youth, ages 16 to 21
In allowing the 16-to-21 youth population to receive
individual training accounts (ITAs), this waiver
supports the principles of streamlining services,
individual opportunity and empowerment, customer
choice, and an improved Youth Program. Co-
enrollment into the Adult or Dislocated Worker
programs is no longer required under this waiver.
The ability to use ITAs for this older and out-of-school
youth population provided local WIBs with an
additional tool to expedite youth entry into the
workplace through occupational skills training,
eliminating the need for duplicative enrollment. Use
of this waiver also gives local WIBs the increased
flexibility to provide a mix of services that best aligns
with the requirements of their youth customers.
Outcomes: This waiver provides youth with greater
empowerment and access to Ohio’s 1,949 eligible
training providers online (ETPO). During PY 2011,
seven of the state’s 20 WIBs used this waiver to
provide 32 older and out-of-school youth with ITAs.
9. Waiver of the requirement at WIA Section 123 to
competitively procure youth service providers for
three program elements (paid and unpaid work
experience, supportive services, and follow-up
services)
Under this procurement waiver, One-Stop operators
have the flexibility to directly provide the following
Youth Program elements: supportive services, follow-
up, and work experience. The result is that
procurement procedures are streamlined, thus
ensuring coordination, continuity, and ease of
administration for youth activities.
Local areas that use this waiver have the opportunity
to reduce administrative costs that result from
competitive procurement, and to direct more funds to
program activities that lead toward performance
improvement. They also have a greater likelihood for
an integrated service delivery system and
comprehensive customer service strategies within
their One-Stops.
Outcomes: This waiver continues to provide local
WIBs with the opportunity to implement innovative
and comprehensive youth programs and services
tailored to meet the particular needs of their local
labor market, community, and youth. In PY 2011,
seven of Ohio’s 20 WIBs utilized this waiver.
10. Waiver of the provision at 20 CFR 663.530 that
prescribes a time limit on the period of initial
eligibility of training providers
This waiver minimizes administrative burdens for the
state and local areas by suspending the requirement
that previously certified training providers must be
determined eligible again. It permits training providers
to update and resubmit their initial applications for
approval, which reduced their administrative burden,
as well. This has allowed Ohio to maintain a
creditable and robust ETPO list.
Outcomes: Ohio has been able to reduce the burden
and costs associated with data collection at the state,
local, and training provider level. Waiver usage has
helped the state broaden its customer choice,
increase the availability of training, and increase the
use of ITAs.
In PY 2011, Ohio had 1,949 ETPO providers and
7,073 active training programs approved for demand
and emerging occupations. The high-number of ETPO
providers increased 4 percent from PY 2010 to PY
2011. The state has also seen a 6 percent increase in
(Continued on page 27)
PY 2011 OHIO WAIVERS (CONTINUED)
82.3%
87.8%
84.7%
90.8%
76.0%
80.0%
84.0%
88.0%
92.0%
Adult Dislocated Worker
12-Month Employment Retention Rates (PYs 2010 - 2011)
PY 2010 PY 2011

Page 27 PY 2011 WIA Annual Report
the number of active training providers. In addition,
12,300 ITAs were provided to WIA customers.
11. Waiver of WIA Section 134(a)(2)(B)(ii) and 20
CFR 665.200(d) to exempt the state from the
requirement to conduct evaluations
12. Waiver of WIA Section 134(a)(2)(B)(ii) and 20
CFR 665.200(e) to exempt the state from the
requirement to provide local workforce
investment area incentive grants
13. Waiver of 20 CFR 665.200(b)(3) to exempt the
state from the requirement to disseminate training
provider performance and cost information
Ohio’s reduction of PY 2011 WIA Governor’s Reserve
funds, from 15 percent to 5 percent, greatly restricted
the state’s ability to effectively fund and administer all
of the required statewide workforce investment
activities. The level of Governor’s Reserve funds was
insufficient to cover the costs of evaluations,
incentives grants to local areas, and the
dissemination of training provider information.
As a result, in PY 2011, Ohio requested and was
granted waivers of the requirements to conduct
evaluation studies, to provide local workforce
investment area incentive grants, and to disseminate
training provider performance and cost information.
These waivers gave the state flexibility to direct the
use of Governor’s Reserve funds to required activities
that best preserve basic functions of the statewide
workforce investment system.
Outcomes: The approved waivers permitted Ohio to
use its reduced Governor’s Reserve funds to:
(a) Operate a fiscal and management accountability
information system, based on guidelines
established by the Secretary of Labor;
(b) Submit required reports;
(c) Disseminate the list of eligible providers of training
services (including those providing nontraditional
training services) for adults and dislocated
workers;
(d) Provide technical assistance to local areas that
failed to meet local performance measures;
(e) Conduct required Rapid Response activities;
(f) Identify providers eligible for OJT and customized
training;
(g) Make available a list of eligible providers of youth
activities;
(h) Assist in the establishment and operation of One-
Stop delivery systems, in accordance with the
strategy described in the state workforce
investment plan; and
(i) Provide additional assistance to local areas that
have high concentrations of eligible youth.
PY 2011 OHIO WAIVERS (CONTINUED)
1,877
6,673
1,949
7,073
0
2,000
4,000
6,000
8,000
Training Providers Training Programs
Eligible Training Providers/Programs Comparison (PYs 2010 - 2011)
PY 2010 PY 2011

Page 28 PY 2011 WIA Annual Report
PY 2011 PARTICIPATION SUMMARY
Ohio’s WIA Program provides employment, job training, and educational services to eligible adults, dislocated
workers, and youth through a network of 30 full-service and 60 satellite One-Stop Centers. The centers match
job seekers with employers and help laid-off workers learn new skills and find jobs. Within the One-Stop
Centers, local WIA programs provide participants with job search and placement assistance, access to labor
market information, comprehensive skills assessments, counseling and career planning, and basic skills and
occupational training. The WIA Program increases the employment, employment retention, and earnings of
adults, dislocated workers, and young people (ages 14-21).
PY 2011 WIA Participants
In PY 2011:
40,062 Ohioans received WIA-funded services,
an enrollment decrease of 23 percent from the
previous year.
Ohio enrolled 16,020 adults, 13,048 dislocated
workers, and 10,994 youth in WIA services.
The Adult Program served the highest percentage
of participants (40 percent).
The number of WIA participants in the Adult
Program, 16,020, decreased by 15 percent or
2,769, from PY 2010. This was the lowest Adult
Program enrollment since PY 2004.
With a 6,741 participant decrease (34 percent)
compared to PY 2010, the Dislocated Worker
Program experienced the largest drop in
enrollments. The program also experienced its
lowest enrollment numbers since PY 2008.
The number of youth served, 10,994, decreased
17 percent from PY 2010. When comparing youth
enrollments for PYs 2007-2011, the lowest
number of youth participants were served in PY
2011.
PY 2011 enrollment numbers for youth were
consistent with PY 2007 and PY 2008 enrollment
numbers (pre-Recovery Act).
The state served 4,325 out-of-school and 6,669
in-school youth.
18,863 18,91824,043
18,789 16,020
9,22814,765
23,014
19,789
13,048
11,89812,220
14,384
13,240
10,994
0
10,000
20,000
30,000
40,000
50,000
60,000
70,000
PY 2007 PY 2008 PY 2009 PY 2010 PY 2011
WIA Participants by Program (PYs 2007-2011)
Adults Dislocated Workers Youth
39,989
45,903
61,441
51,818
40,062
0
10,000
20,000
30,000
40,000
50,000
60,000
70,000
PY 2007 PY 2008 PY 2009 PY 2010 PY 2011
Total WIA Participants (PYs 2007-2011)
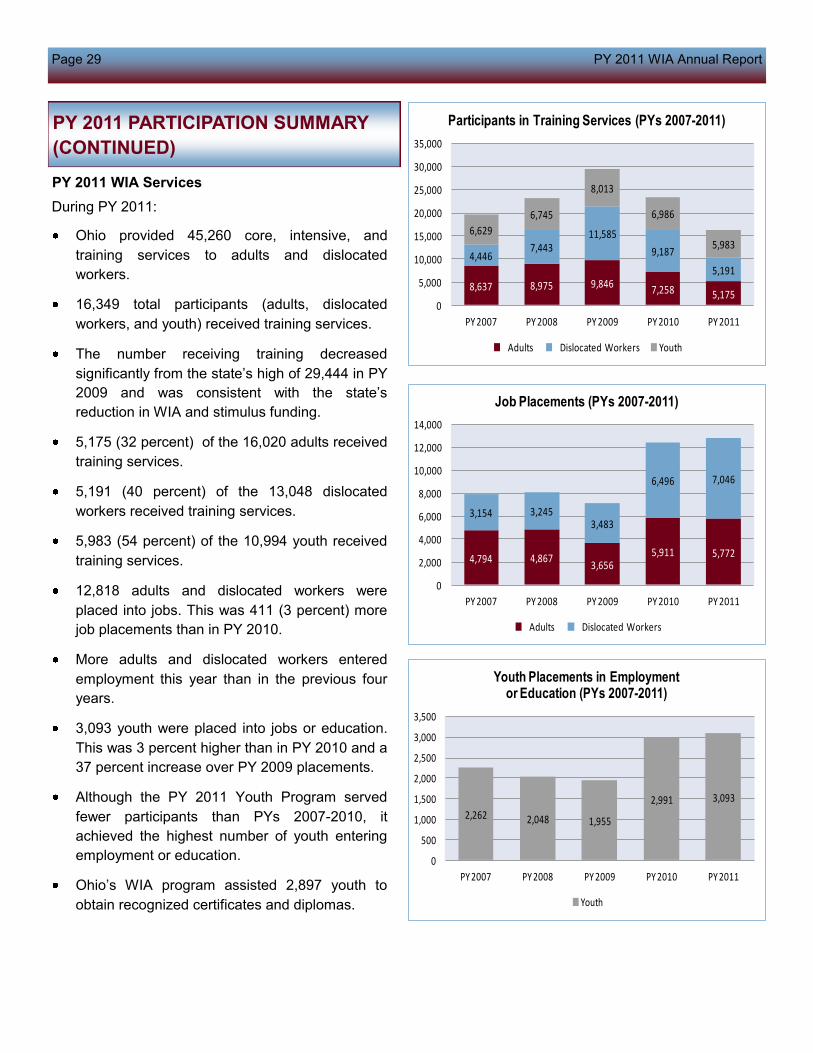
Page 29 PY 2011 WIA Annual Report
PY 2011 WIA Services
During PY 2011:
Ohio provided 45,260 core, intensive, and
training services to adults and dislocated
workers.
16,349 total participants (adults, dislocated
workers, and youth) received training services.
The number receiving training decreased
significantly from the state’s high of 29,444 in PY
2009 and was consistent with the state’s
reduction in WIA and stimulus funding.
5,175 (32 percent) of the 16,020 adults received
training services.
5,191 (40 percent) of the 13,048 dislocated
workers received training services.
5,983 (54 percent) of the 10,994 youth received
training services.
12,818 adults and dislocated workers were
placed into jobs. This was 411 (3 percent) more
job placements than in PY 2010.
More adults and dislocated workers entered
employment this year than in the previous four
years.
3,093 youth were placed into jobs or education.
This was 3 percent higher than in PY 2010 and a
37 percent increase over PY 2009 placements.
Although the PY 2011 Youth Program served
fewer participants than PYs 2007-2010, it
achieved the highest number of youth entering
employment or education.
Ohio’s WIA program assisted 2,897 youth to
obtain recognized certificates and diplomas.
4,794 4,8673,656
5,911 5,772
3,154 3,2453,483
6,496 7,046
0
2,000
4,000
6,000
8,000
10,000
12,000
14,000
PY 2007 PY 2008 PY 2009 PY 2010 PY 2011
Job Placements (PYs 2007-2011)
Adults Dislocated Workers
2,262 2,048 1,955
2,991 3,093
0
500
1,000
1,500
2,000
2,500
3,000
3,500
PY 2007 PY 2008 PY 2009 PY 2010 PY 2011
Youth Placements in Employment or Education (PYs 2007-2011)
Youth
8,637 8,975 9,8467,258 5,175
4,4467,443
11,585
9,187
5,191
6,629
6,745
8,013
6,986
5,983
0
5,000
10,000
15,000
20,000
25,000
30,000
35,000
PY 2007 PY 2008 PY 2009 PY 2010 PY 2011
Participants in Training Services (PYs 2007-2011)
Adults Dislocated Workers Youth
PY 2011 PARTICIPATION SUMMARY
(CONTINUED)

Page 30 PY 2011 WIA Annual Report
Race and Ethnicity
61 percent of all participants (adults, dislocated
workers, and youth) in PY 2011 were white. 77
percent of the dislocated worker participants were
white.
47 percent of the youth participants were African
American. This was 12 percentage points higher
than the percentage of African-American
customers in total WIA participants (35 percent).
3 percent of the total participants were Hispanic.
The Youth Program served the highest percent of
Hispanic customers: 5 percent.
Asians, Native Americans, and Pacific Islanders
comprised less than 1 percent each of the total
participants.
Compared with PY 2010, the percentage of
participants who were African American
increased.
PY 2011 WIA Participant Demographics
Ohio’s WIA programs offered employment and training services to a diverse population of individuals. WIA
participant information for PY 2011 is summarized in the following chart and tables. Participant means an
individual who was enrolled and receiving services (excludes self-service and follow-up) funded by a WIA Title I-
B program.
35%
61%
3% 1%
PY 2011 Participants by Race(Shown as a Percentage)
African American White Hispanic Other
40%
33%
27%
PY 2011 Participants by Program(Shown as a Percentage)
Adults Dislocated Workers Youth
Race/Ethnic Group Adults Dislocated
Workers
Youth Total Percent of Total
Asian 142 84 21 247 <1%
Black or African American 6,175 2,503 5,162 13,840 35%
Hispanic 464 305 502 1,271 3%
Native American 83 65 56 204 <1%
Pacific Islander 76 46 9 131 <1%
White 9,041 9,988 5,196 24,225 61%
Total 15,981 12,991 10,946 39,918 100%
Number of WIA Participants by Race/Ethnic Group*
*Includes multirace participants but does not include those individuals who chose not to identify their race/ethnicity. “Other” in the pie chart above represents Asian, Native American, or Pacific Islander.

Page 31 PY 2011 WIA Annual Report
Gender and Age
52 percent (20,724 individuals) of the WIA
participants were female.
15,143 (38 percent) of total participants were
age 25 or younger.
55 percent of youth participants were between
16 and 18 years old.
9 percent of youth were ages 14 to 15.
The highest percentage of Adult Program
participants (28 percent) were between 26 and
35 years old.
The majority of dislocated workers (33
percent) were between 46 and 55 years old.
Less than 1 percent of total WIA participants
were age 66 or older.
Other Significant Characteristics
At program enrollment, 10,567 (26
percent) of total WIA participants had less
than a high school diploma or General
Educational Development (GED).
1,567 (40 percent) of the 3,947 WIA youth
between 19 and 21 years old had at least
their high school diplomas/GEDs at
program enrollment.
13,314 (33 percent) of WIA participants
were unemployment insurance (UI)
claimants. 10,159 (78 percent) of
dislocated workers were UI claimants.
15,163 (38 percent) of WIA participants
were low-income.
2,188 (5 percent) of WIA participants were
veterans.
2,785 (7 percent) of total WIA participants
were disabled. 2,420 (22 percent) of youth
enrolled were disabled.
Age GroupNumber of
Participants
Percent of
Total
14-15 1,018 9%
16-18 6,029 55%
19-21 3,947 36%
Total 10,994 100%
18-25 3,581 22%
26-35 4,520 28%
36-45 3,509 22%
46-55 3,044 19%
56-65 1,253 8%
66+ 113 1%
Total 16,020 100%
18-25 568 4%
26-35 2,323 18%
36-45 3,652 28%
46-55 4,368 33%
56-65 2,053 16%
66+ 84 1%
Total 13,048 100.0%
Youth
Adults
Dislocated
Workers
Number of Participants by Age
18,690 47%20,724
52%
648 1%
PY 2011 Participants by Gender
Male Female Did Not Self-Identify
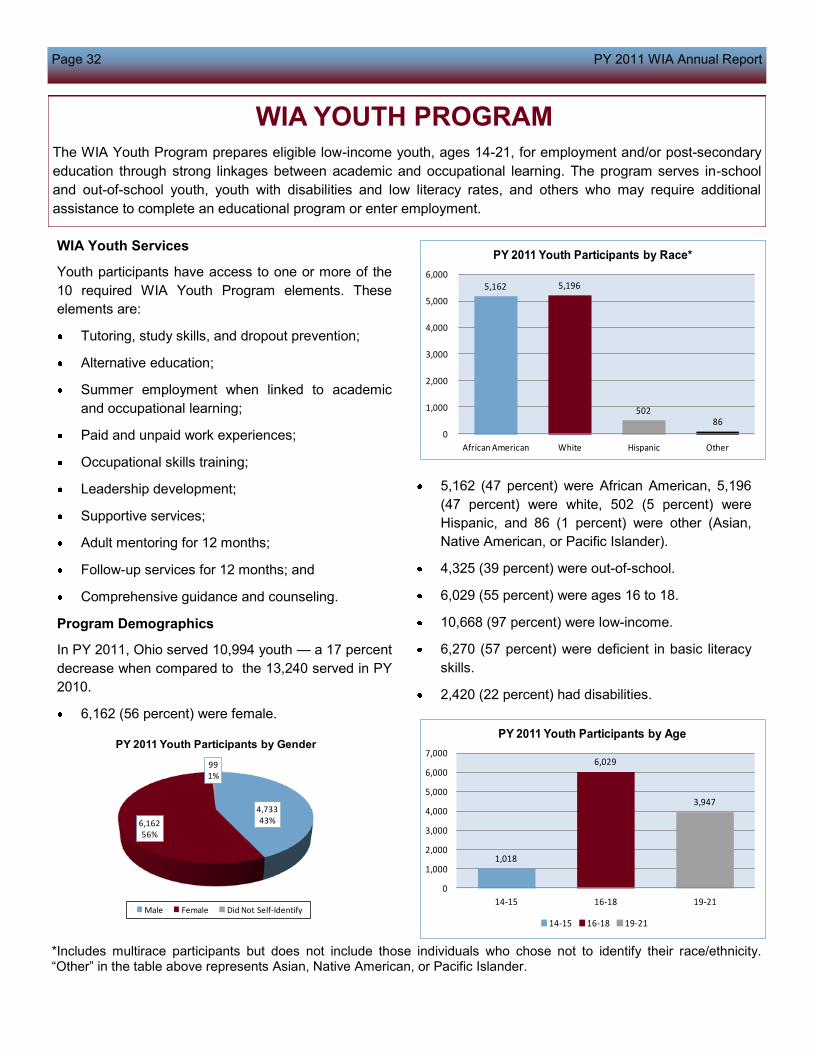
Page 32 PY 2011 WIA Annual Report
WIA YOUTH PROGRAM
The WIA Youth Program prepares eligible low-income youth, ages 14-21, for employment and/or post-secondary
education through strong linkages between academic and occupational learning. The program serves in-school
and out-of-school youth, youth with disabilities and low literacy rates, and others who may require additional
assistance to complete an educational program or enter employment.
WIA Youth Services
Youth participants have access to one or more of the
10 required WIA Youth Program elements. These
elements are:
Tutoring, study skills, and dropout prevention;
Alternative education;
Summer employment when linked to academic
and occupational learning;
Paid and unpaid work experiences;
Occupational skills training;
Leadership development;
Supportive services;
Adult mentoring for 12 months;
Follow-up services for 12 months; and
Comprehensive guidance and counseling.
Program Demographics
In PY 2011, Ohio served 10,994 youth — a 17 percent
decrease when compared to the 13,240 served in PY
2010.
6,162 (56 percent) were female.
5,162 (47 percent) were African American, 5,196
(47 percent) were white, 502 (5 percent) were
Hispanic, and 86 (1 percent) were other (Asian,
Native American, or Pacific Islander).
4,325 (39 percent) were out-of-school.
6,029 (55 percent) were ages 16 to 18.
10,668 (97 percent) were low-income.
6,270 (57 percent) were deficient in basic literacy
skills.
2,420 (22 percent) had disabilities.
*Includes multirace participants but does not include those individuals who chose not to identify their race/ethnicity. “Other” in the table above represents Asian, Native American, or Pacific Islander.
4,733 43%6,162
56%
99 1%
PY 2011 Youth Participants by Gender
Male Female Did Not Self-Identify
1,018
6,029
3,947
0
1,000
2,000
3,000
4,000
5,000
6,000
7,000
14-15 16-18 19-21
PY 2011 Youth Participants by Age
14-15 16-18 19-21
5,162 5,196
502 86
0
1,000
2,000
3,000
4,000
5,000
6,000
African American White Hispanic Other
PY 2011 Youth Participants by Race*

Page 33 PY 2011 WIA Annual Report
424 (4 percent) were homeless.
8,959 (81 percent) youth at program enrollment
had less than a high school.
192 (2 percent) of the youth participants had
obtained other education levels (e.g., some
college, associate degree, vocational degree).
Since PY 2002, Ohio’s Youth Program has met or
exceeded all performance standards reported to DOL.
In PY 2011, Ohio exceeded all three of its youth
negotiated measures: Placement in Employment or
Education, Attainment of Degree or Certificate, and
Literacy and Numeracy Gains. Youth results show
that:
64.2 percent were placed in employment or
education.
59.6 percent attained a degree or certificate.
52.5 percent had literacy or numeracy gains.
In PY 2010, the Youth Program posted its highest
Placement in Employment or Education rate (65.1
percent).
Since PY 2007, Ohio has exceeded both the
Certificate or Diploma and Literacy and Numeracy
Gains measures.
81%
17%
2%
0%
20%
40%
60%
80%
100%
< HS Diploma HS Diploma/GED All Other Education Levels
Pe
rce
nt
of
Tota
l Y
ou
th S
erv
ed
PY 2011 Youth Participants Highest Education Level at Enrollment
WIA YOUTH PROGRAM (CONTINUED)
60.0%
42.0%37.0%
64.2%59.6%
52.5%
0.0%
10.0%
20.0%
30.0%
40.0%
50.0%
60.0%
70.0%
Placement in Employment or
Education
Certificate or Diploma Literacy and Numeracy
PY 2011 Youth Program Performance
Negotiated Performance Actual Performance
41
.0%
42
.0%
42
.0%
42
.0%
42
.0%
53
.9%
57
.9%
57
.2%
64
.1%
59
.6%
0.0%
10.0%
20.0%
30.0%
40.0%
50.0%
60.0%
70.0%
PY 2007 PY 2008 PY 2009 PY 2010 PY 2011
Certificate or Diploma (PYs 2007-2011)
Negotiated Actual
61
.0%
63
.0%
63
.0%
60
.0%
60
.0%
62
.6%
64
.3%
53
.2% 6
5.1
%
64
.2%
0.0%
10.0%
20.0%
30.0%
40.0%
50.0%
60.0%
70.0%
PY 2007 PY 2008 PY 2009 PY 2010 PY 2011
Placement in Employment or Education (PYs 2007-2011)
Negotiated Actual
35
.0%
37
.0%
37
.0%
37
.0%
37
.0%
37
.1%
42
.7%
39
.1%
44
.1% 5
2.5
%
0.0%
10.0%
20.0%
30.0%
40.0%
50.0%
60.0%
PY 2007 PY 2008 PY 2009 PY 2010 PY 2011
Literacy and Numeracy (PYs 2007-2011)
Negotiated Actual

Page 34 PY 2011 WIA Annual Report
WIA YOUTH SUCCESS STORIES
Receive, Believe, Achieve
Whitney and Jaliesha are the kind of young women who
would make any parent or teacher proud. Both are high
achievers, and both used the opportunities afforded
through Jobs for Cincinnati Graduates’ (JCG) high
school program, much of it funded with WIA dollars for
low-income youth, to prepare for college and careers.
Whitney, 17, is valedictorian and student body president
at Western Hills University High School. She has been
awarded several scholarships, including the YWCA’s
prestigious Mamie Earl Sells Scholarship, which is
presented annually to an outstanding female black high
school senior. Whitney plans to attend the University of
Cincinnati, where she will study computer science at the
College of Engineering and Applied Science.
“As a little girl, I was always interested in computer
technology,” she says. JCG’s emphasis on work
readiness skills, career exploration, and leadership
training was a good fit for her.
Jaliesha, 17, is a senior at Winton Woods High School,
and also is student body president. As a foster care
youth living independently, she faces the kind of
challenges most teens don’t have to worry about. She
received a full-ride scholarship to Wright State
University that provides year-round housing – a huge
benefit for a young woman who is emancipating from
foster care.
“I am planning to major in criminal science and minor
in Spanish,” says Jaliesha. “I’ve wanted to be a police
officer for a long time – helping to put the bad guys
away – but now I would really like to get into the FBI.”
At JCG’s annual award ceremony, the theme of
“Receive, Believe, Achieve” resonated. Says Kathleen
Williams, Youth Coordinator of the Southwest Ohio
Region WIB: “Both Whitney and Jaliesha embody that
theme – they’ve capitalized on the help they’ve
received; they believe in themselves and their goals;
and they are determined to achieve success in their
lives.”
The Southwest Ohio Region WIB implements WIA in
Cincinnati and Hamilton County (Area 13).
Summer Job Leads to White House
For Kasey, her first trip to Washington, D.C., proved to
be an eye-opener in terms of career opportunities and
dreaming big.
A senior at Oak Harbor High School, Kasey traveled to
the White House in January 2012 with her mother,
Sherry, and took part in the kickoff of President Barack
Obama's 2012 Summer Jobs Plus Program. She was
invited to the summer jobs summit after participating in
the WIA 2011 Summer Youth Program through WSOS
Community Action Agency (Area 7 - Sandusky
County), where her duties included eight weeks of
work as an administrative assistant at the Oak Harbor
mayor's office. The summit was designed to connect
youth to jobs and help them find paths to summer
employment in 2012.
The trip included a tour of the White House and the
chance to meet several cabinet secretaries. Kasey
stood out in her job at the mayor's office and earned
the invitation to the White House on behalf of Ohio
youth, while WSOS represented community action
agencies at the event.
Kasey maintains a B average in school and plans to
attend college at Bowling Green State University or
Hocking College. She says she built a lot of
relationships and learned important office skills during
her summer employment at the mayor's office.
"Each time I go, I learn something new from
everybody," she said.
Whitney Hollingsworth and Jaliesha Brown

Page 35 PY 2011 WIA Annual Report
WIA ADULT PROGRAM
The WIA Adult Program helps prepare adults for good jobs through employment and training services provided
through the state’s network of 90 One-Stop Centers. Ohio’s program also is designed to help employer customers
meet their needs for skilled workers.
WIA Adult Services
The WIA Adult Program offers participants three levels
of service: core, intensive, and training.
Core services - Includes outreach, job search and
placement assistance, and labor market information;
available to all job seekers.
Intensive services - Includes more comprehensive
assessments, development of individual employment
plans, and counseling and career planning.
Training services - Links participants to job
opportunities in their communities and offers
occupational training and training in basic skills.
Participants use an "individual training account" to
select an appropriate training program from a qualified
training provider or participate in training supported by
an employer.
Program Demographics
The number of adults served in PY 2011 was 16,020,
15 percent less than the 18,789 served the previous
year. The reduced number served can be attributed to
decreased funding. Of those 16,020 participants:
8,918 (56 percent) were female.
6,175 (38.5 percent) identified themselves as
African American, 9,041 (56.5 percent) as white,
464 (3 percent) as Hispanic, and 301 (2 percent) as
Asian, Native American, or Pacific Islander.
4,520 adult participants (28 percent) were between
26 and 35 years old. 3,581 (22 percent) were
between 18 and 25 years old. Only 1 percent of
adults (113) was 66 or older.
4,289 (27 percent) were low-income.
1,010 (6 percent) received TANF.
5,548 (35 percent) received other public assistance.
*Includes multirace participants but does not include those individuals who chose not to identify their race/ethnicity. “Other” in the table above represents Asian, Native American, or Pacific Islander.
6,875 43%
8,918 56%
227 1%
PY 2011 Adult Participants by Gender
Male Female Did Not Self-Identify
6,175
9,041
464 301
0
2,000
4,000
6,000
8,000
10,000
African American White Hispanic Other
PY 2011 Adult Participants by Race*
3,581
4,520
3,509
3,044
1,253
113
0
1,000
2,000
3,000
4,000
5,000
18-25 26-35 36-45 46-55 56-65 66+
PY 2011 Adult Participants by Age

Page 36 PY 2011 WIA Annual Report
967 (6 percent) were veterans.
276 (2 percent) had disabilities.
3,095 (19 percent) were unemployment insurance
claimants.
1,544 (10 percent) were ex-offenders.
261 (2 percent) were homeless.
At program enrollment, only 8 percent (1,211) of adult
participants had less than a high school diploma or
GED. Of the remaining adults who entered the program,
8,601 (54 percent) had a high school diploma or GED,
and 6,208 (38 percent) had pursued post-secondary
education.
For PY 2011, Ohio exceeded all three of the adult
negotiated measures: Entered Employment Rate,
Employment Retention Rate, and Average Earnings
Rate.
78.1 percent entered employment;
88 percent retained employment; and
The six-months average earnings was $16,337.
The Adult Program placed 5,772 individuals into
employment. As can be seen from the chart above, its
performance improved from the previous two years
(PYs 2009 -2010).
In PY 2011, Ohio exceeded its Employment Retention
Rate for the first time since PY 2007.
Even with a still recovering economy, the state
achieved its highest Average Earnings Rate for adults
since PY 2007.
WIA ADULT PROGRAM (CONTINUED)
8%
54%
19%
6% 8%5%
0%
10%
20%
30%
40%
50%
60%
< HS Diploma/GED
HS Diploma/GED
Some College Associate Degree
Bachelor’s Degree
All Other Education
Levels
PY 2011 Adult Participants Highest Education Level at Enrollment
70.0%
87.0%78.1%
88.0%
0.0%
20.0%
40.0%
60.0%
80.0%
100.0%
Entered Employment Rate Employment Retention Rate
PY 2011 Adult Program Performance
Negotiated Performance Actual Performance
77
.0%
78
.0%
78
.0%
70
.0%
70
.0%
78
.5%
75
.3%
64
.1%
67
.5%
78
.1%
0.0%
20.0%
40.0%
60.0%
80.0%
100.0%
PY 2007 PY 2008 PY 2009 PY 2010 PY 2011
Entered Employment Rate(PYs 2007-2011)
Negotiated Actual
86
.0%
87
.0%
87
.0%
87
.0%
87
.0%
86
.2%
84
.4%
81
.0%
84
.6%
88
.0%
0.0%
20.0%
40.0%
60.0%
80.0%
100.0%
PY 2007 PY 2008 PY 2009 PY 2010 PY 2011
Employment Retention Rate(PYs 2007-2011)
Negotiated Actual
$1
4,0
00
$1
4,5
00
$1
4,5
00
$1
4,5
00
$1
4,5
00
$1
5,0
40
$1
5,3
24
$1
4,6
14
$1
4,6
55
$1
6,3
37
$0
$6,000
$12,000
$18,000
PY 2007 PY 2008 PY 2009 PY 2010 PY 2011
Average Earnings Rate (PYs 2007-2011)
Negotiated Actual

Page 37 PY 2011 WIA Annual Report
Ex-offender Gains Confidence to Build His Career
Aaron was released from prison in 2008. He moved to
Columbus and immediately heard about the Central
Ohio Workforce Investment Corporation (COWIC),
Franklin County’s One-Stop. “I made that place my
office because I didn’t want to sit wallowing in my
position as an ex-offender,” he said. At COWIC (Area
11), Aaron learned to research jobs and submit
applications online. He took the work readiness
workshops to improve his computer skills and develop a
resume. However, because of his prison record, he
could only find temporary work.
After being laid off from a temporary landscaping job,
Aaron came back to COWIC to continue his job search.
This time, he learned of the Sherwin-Williams
Homework Painting Program, which includes classroom
and work readiness training, hands-on instruction, and
Environmental Protection Agency certification in lead
paint removal. Aaron met with COWIC’s employment
relations team and was accepted to the program, which
he completed. Aarons says since then he has shifted
from just looking for a job to building a career.
Through the program, Aaron gained the knowledge and
confidence to begin his career. Now he has a full-time
position with benefits at a local construction/home
building company. He has also moved his family out of
a hotel and into permanent housing.
“Now, when I approach an employer, I have the skills,
something to offer,” Aaron said. “I learned that finding a
job is not just about chasing a paycheck, but building
relationships.”
Tonya Finds the Strength to Endure
Tonya was ready to complete her final year in the
nursing program at Kent State University when her
husband was unexpectantly injured and became unable
to return to work. Tonya was worried because she did
not know how she would pay for her last year of school.
She turned to The Employment Source (Area 6 - Stark
County), and they provided her with a WIA scholarship.
Tonya was progressing nicely and had just entered her
last semester of school when another tragedy struck.
Her son sustained a head injury and suddenly died.
Somehow she found the strength to persevere,
complete her coursework, and receive her bachelor’s
degree.
Tonya’s misfortunes and suffering would be enough for
most people, but Tonya had one more test that she had
to endure. After the death of her son, she had difficulty
passing the National Council Licensure Examination for
her nursing license. She took it three times and failed
each time. WIA staff recommended and paid for
individual tutoring. The tutoring worked. She passed her
exam and was hired as a registered nurse at Mercy
Medical Center making $25.25 per hour.
The WIA training has opened up many job opportunities
for Tonya. She soon will begin a new position as a
supervisor floor nurse at Shady Lawn in Dalton, Ohio.
Single Mother Credits Program with Her Success
Twenty-five year old Chanelle had her first child at age
17. By the time she came to COWIC (Area 11 - Franklin
County), she had three children ages 8, 5, and 3.
Chanelle had been accepted into a nursing educational
program and had federal loans, but the loans did not
cover all her schooling expenses. Just days before her
program was to start, she made the decision to ask
COWIC for assistance.
COWIC provided Chanelle with an ITA to complete the
Columbus Practical School of Nursing’s one-year
program.
As a single mother, it was not always easy for Chanelle
to attend school full-time, five days a week, while
working part-time to make ends meet. She credits her
job counselor and the services at COWIC for helping
her to reach her goal.
“I feel better about myself,” she says. “I finally finished
something. I tried to do nursing school before, but I
didn’t have the focus or funds to keep it going. Without
COWIC’s help, I would have had to wait to start school.”
With COWIC’s assistance, Chanelle completed her
program, took her exams, and was hired at A1 Nursing.
She makes $22 - $27 per hour, is off public assistance,
and is working toward her registered nursing degree at
Hondros College.
ADULT SUCCESS STORIES
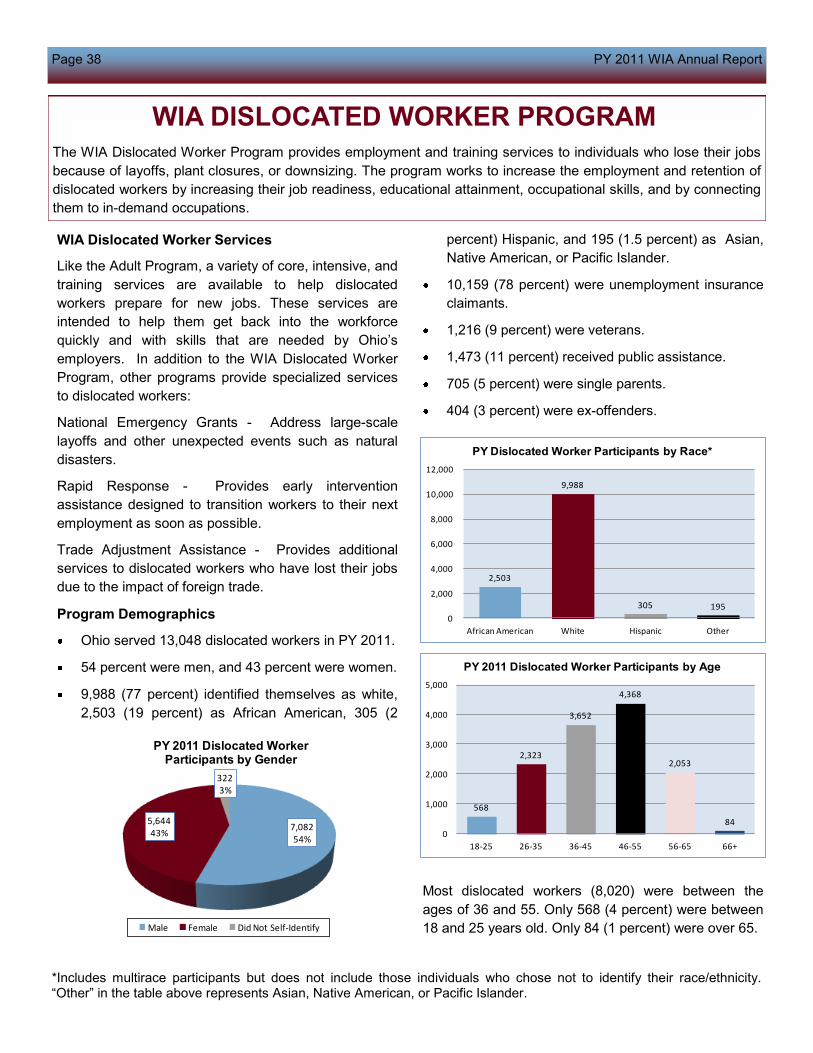
Page 38 PY 2011 WIA Annual Report
WIA Dislocated Worker Services
Like the Adult Program, a variety of core, intensive, and
training services are available to help dislocated
workers prepare for new jobs. These services are
intended to help them get back into the workforce
quickly and with skills that are needed by Ohio’s
employers. In addition to the WIA Dislocated Worker
Program, other programs provide specialized services
to dislocated workers:
National Emergency Grants - Address large-scale
layoffs and other unexpected events such as natural
disasters.
Rapid Response - Provides early intervention
assistance designed to transition workers to their next
employment as soon as possible.
Trade Adjustment Assistance - Provides additional
services to dislocated workers who have lost their jobs
due to the impact of foreign trade.
Program Demographics
Ohio served 13,048 dislocated workers in PY 2011.
54 percent were men, and 43 percent were women.
9,988 (77 percent) identified themselves as white,
2,503 (19 percent) as African American, 305 (2
percent) Hispanic, and 195 (1.5 percent) as Asian,
Native American, or Pacific Islander.
10,159 (78 percent) were unemployment insurance
claimants.
1,216 (9 percent) were veterans.
1,473 (11 percent) received public assistance.
705 (5 percent) were single parents.
404 (3 percent) were ex-offenders.
Most dislocated workers (8,020) were between the
ages of 36 and 55. Only 568 (4 percent) were between
18 and 25 years old. Only 84 (1 percent) were over 65.
WIA DISLOCATED WORKER PROGRAM The WIA Dislocated Worker Program provides employment and training services to individuals who lose their jobs
because of layoffs, plant closures, or downsizing. The program works to increase the employment and retention of
dislocated workers by increasing their job readiness, educational attainment, occupational skills, and by connecting
them to in-demand occupations.
*Includes multirace participants but does not include those individuals who chose not to identify their race/ethnicity. “Other” in the table above represents Asian, Native American, or Pacific Islander.
2,503
9,988
305 195
0
2,000
4,000
6,000
8,000
10,000
12,000
African American White Hispanic Other
PY Dislocated Worker Participants by Race*
7,082 54%
5,644 43%
322 3%
PY 2011 Dislocated Worker Participants by Gender
Male Female Did Not Self-Identify
568
2,323
3,652
4,368
2,053
84
0
1,000
2,000
3,000
4,000
5,000
18-25 26-35 36-45 46-55 56-65 66+
PY 2011 Dislocated Worker Participants by Age

Page 39 PY 2011 WIA Annual Report
Upon entering the program, 6,608 (51 percent) of
dislocated workers had achieved a high school diploma
or equivalent. Another 2,550 (20 percent) had
completed some college, 1,268 (10 percent) had
received their associate degree, and 1,485 (11 percent
had obtained their bachelor’s degree. Only 397 (3
percent) had less than a high school diploma or GED at
enrollment.
For PY 2011, Ohio exceeded two of the dislocated
worker negotiated measures: Entered Employment
Rate and the Average Earnings Rate. The state met the
Employment Retention Rate measure. Dislocated
worker outcomes show that:
80.2 percent entered employment;
91.4 percent retained employment; and
Dislocated workers had a six-months average
earnings of $16,337.
Ohio posted its highest entered employment rate since
PY 2008, an indication that the state’s economy is
improving for dislocated workers.
In PY 2011, similar to PY 2007 and PY 2008, 90
percent of individuals retained employment six months
after exiting the WIA program. Employee retention
often leads to a decrease in the costs associated with
high turnover (e.g., recruitment, hiring, and training)
for employers.
Like the Adult Program, the Dislocated Worker
Program produced its highest Average Earnings Rate
($19,494) since in PY 2007.
WIA DISLOCATED WORKER
PROGRAM (CONTINUED)
3%
51%
20%
10% 11%
6%
0%
10%
20%
30%
40%
50%
60%
< HS Diploma/GED
HS Diploma/GED
Some College Associate Degree
Bachelor’s Degree
All Other Education
Levels
PY 2011 Dislocated Worker Participants Highest Education Level at Enrollment
78.0%
92.0%
80.2%
91.4%
70.0%
75.0%
80.0%
85.0%
90.0%
95.0%
Entered Employment Rate Employment Retention Rate
PY 2011 Dislocated Worker Program Performance
Negotiated Performance Actual Performance
86
.0%
87
.0%
87
.0%
78
.0%
78
.0%
87
.2%
84
.9%
68
.0%
73
.3%
80
.2%
0.0%
20.0%
40.0%
60.0%
80.0%
100.0%
PY 2007 PY 2008 PY 2009 PY 2010 PY 2011
Entered Employment Rate(PYs 2007-2011)
Negotiated Actual
91
.0%
92
.0%
92
.0%
92
.0%
92
.0%
92
.4%
90
.2%
86
.0%
89
.4%
91
.4%
0.0%
20.0%
40.0%
60.0%
80.0%
100.0%
PY 2007 PY 2008 PY 2009 PY 2010 PY 2011
Employment Retention Rate(PYs 2007-2011)
Negotiated Actual
$1
6,6
70
$1
7,0
00
$1
7,0
00
$1
7,0
00
$1
7,0
00
$1
7,4
51
$1
7,6
97
$1
7,0
79
$1
9,1
01
$1
9,4
94
$0
$5,000
$10,000
$15,000
$20,000
PY 2007 PY 2008 PY 2009 PY 2010 PY 2011
Average Earnings Rate (PYs 2007-2011)
Negotiated Actual

Page 40 PY 2011 WIA Annual Report
WIA DISLOCATED WORKER SUCCESS STORIES
From Displaced Worker to Pharmacy Technician
After working seven years at the University of Cincinnati
as a research associate, Rolanda found herself without
a job. Funding had been cut off for the study that
employed her. Like thousands of other dislocated
workers from Cincinnati and Hamilton County, Rolanda
turned to the SuperJobs Center (Area 13) to see if she
was eligible for funding to learn a new skill. She knew
from the outset that she was interested in the pharmacy
tech program being taught at Cincinnati State. “I wanted
some stability in a new career,” says Rolanda. “I didn’t
want to be laid off again.”
Career Coach Beverly Schurig of the SuperJobs Center
worked with Rolanda to help her get enrolled in the
class, and she was on her way to a new career. “I
absolutely enjoyed the class,” says Rolanda. “Our
instructor kept the class going, and made the
complicated material fun and simple.”
Rolanda passed her certification board exam, and she
worked as a temporary pharmacy tech while she
searched for full-time positions. In May 2011, she began
to volunteer at the Cincinnati Veterans Affairs Medical
Center, where she worked at both the out-patient and
in-patient pharmacies. That paid off when Rolanda was
hired in March 2012 to staff the out-patient pharmacy.
“Being a pharmacy technician is a very satisfying and
rewarding career, helping patients get well,” she says.
Thanks to help from SuperJobs and Cincinnati State,
Rolanda is well on her way to those rewards.
OJT Provides New Skills for Laid-Off Analyst
In February 2011, Kevin was laid off from his job with
Vertex, Inc., as a computer systems analyst. Staff at
Empyra, an information technology company in
Youngstown, learned about Kevin and wanted to hire
him but knew it would take some time for him to get up
to speed with some of its proprietary software.
Empyra, which had previously used WIA’s OJT for
other employees, contacted the One-Stop Workforce
System of Mahoning and Columbiana Counties (Area
17) about a possible OJT for Kevin. Area 17 provided
Kevin and Empyra with a six-month OJT contract. He
completed his training and continues to work for
Empyra as a software developer at $12.50 an hour.
Job Fair Leads to Employment in Oil/Gas Industry
Paul, a veteran and dislocated worker, returned to
Ohio after being laid off in November 2009. He
attended the Select Energy Job Fair in Carrollton in
January 2012, hoping to secure employment in the
“new” oil and gas industry in Carroll County. In the
weeks that followed, Carroll County Connections (Area
16) staff contacted numerous fair attendees to advise
them of upcoming local trainings and workshops.
Paul attended the oil and gas informational workshop,
and then met with WIA case manager Sydney
Cramblett to discuss his options. He expressed interest
in obtaining his Class A Commercial Driver’s License
to become qualified for one of the many truck driving
jobs associated with the oil and gas industry. Through
Carroll County Connections’ Dislocated Worker
Program, Paul enrolled at the Big Rig Truck Driving
School in Canton and was offered and accepted a job
at Henrickson See Pro before finishing his classes.
His new job requires him to operate a 4,500 gallon tank
truck and to hydroseed areas where excavation for new
gas wells has occurred. He is so excited to be working
that on a recent visit to Connections, he hugged his
case manager twice and thanked her for helping him
get this job.
Rolanda enjoys her pharmacy technician job at the
Cincinnati Veterans Affairs Medical Center.
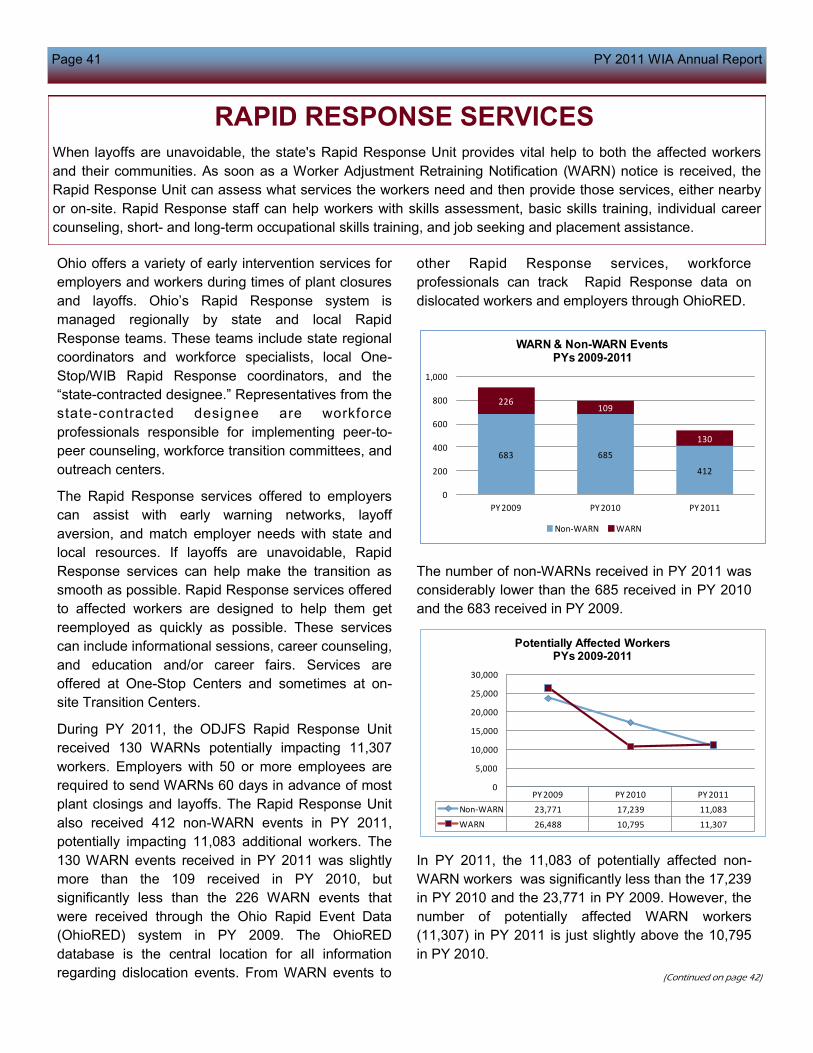
Page 41 PY 2011 WIA Annual Report
RAPID RESPONSE SERVICES
When layoffs are unavoidable, the state's Rapid Response Unit provides vital help to both the affected workers
and their communities. As soon as a Worker Adjustment Retraining Notification (WARN) notice is received, the
Rapid Response Unit can assess what services the workers need and then provide those services, either nearby
or on-site. Rapid Response staff can help workers with skills assessment, basic skills training, individual career
counseling, short- and long-term occupational skills training, and job seeking and placement assistance.
Ohio offers a variety of early intervention services for
employers and workers during times of plant closures
and layoffs. Ohio’s Rapid Response system is
managed regionally by state and local Rapid
Response teams. These teams include state regional
coordinators and workforce specialists, local One-
Stop/WIB Rapid Response coordinators, and the
“state-contracted designee.” Representatives from the
state-contracted designee are workforce
professionals responsible for implementing peer-to-
peer counseling, workforce transition committees, and
outreach centers.
The Rapid Response services offered to employers
can assist with early warning networks, layoff
aversion, and match employer needs with state and
local resources. If layoffs are unavoidable, Rapid
Response services can help make the transition as
smooth as possible. Rapid Response services offered
to affected workers are designed to help them get
reemployed as quickly as possible. These services
can include informational sessions, career counseling,
and education and/or career fairs. Services are
offered at One-Stop Centers and sometimes at on-
site Transition Centers.
During PY 2011, the ODJFS Rapid Response Unit
received 130 WARNs potentially impacting 11,307
workers. Employers with 50 or more employees are
required to send WARNs 60 days in advance of most
plant closings and layoffs. The Rapid Response Unit
also received 412 non-WARN events in PY 2011,
potentially impacting 11,083 additional workers. The
130 WARN events received in PY 2011 was slightly
more than the 109 received in PY 2010, but
significantly less than the 226 WARN events that
were received through the Ohio Rapid Event Data
(OhioRED) system in PY 2009. The OhioRED
database is the central location for all information
regarding dislocation events. From WARN events to
other Rapid Response services, workforce
professionals can track Rapid Response data on
dislocated workers and employers through OhioRED.
The number of non-WARNs received in PY 2011 was
considerably lower than the 685 received in PY 2010
and the 683 received in PY 2009.
In PY 2011, the 11,083 of potentially affected non-
WARN workers was significantly less than the 17,239
in PY 2010 and the 23,771 in PY 2009. However, the
number of potentially affected WARN workers
(11,307) in PY 2011 is just slightly above the 10,795
in PY 2010.
(Continued on page 42)
PY 2009 PY 2010 PY 2011
Non-WARN 23,771 17,239 11,083
WARN 26,488 10,795 11,307
0
5,000
10,000
15,000
20,000
25,000
30,000
Potentially Affected WorkersPYs 2009-2011
683 685
412
226109
130
0
200
400
600
800
1,000
PY 2009 PY 2010 PY 2011
WARN & Non-WARN EventsPYs 2009-2011
Non-WARN WARN

Page 42 PY 2011 WIA Annual Report
Since PY 2010, Ohio has administered the Ohio Rapid
Response Workforce Survey to quickly help connect
individuals affected by mass layoffs and business
closures with the services and training they need to
attain employment. Survey results are very useful in
providing information about both the company (type of
company, county of dislocation, layoff size, layoff date)
and employees (age, highest level of education,
gender, assistance needed, earnings, and other
demographic characteristics).
In PY 2011, 2,988 dislocated workers responded to
the survey. Significant survey findings include:
1,700 (57 percent) were male, and 1,288 (43
percent) were female.
2,032 (68 percent) were over the age of 40.
2,232 (75 percent) were interested in immediately
finding new employment.
795 (27 percent) had most recently been
employed in production. 696 (23 percent) wanted
to remain in production work.
1,219 (41 percent) had achieved a high school
diploma or equivalent. Another 696 (23 percent)
had completed some college, and 388 (13 percent
had obtained their bachelor’s degree. An
additional 377 (13 percent) had obtained either an
associate degree, certificate, or technical degree.
1,336 (45 percent) earned between $13.01 and
$22.00 per hour. 914 (31 percent) of survey
respondents earned over $22.01 per hour.
The highest number of respondents were from
Cuyahoga County (496 or 17 percent) and Butler
County (329 or 11 percent).
Using survey results
and Wanted Analytics
software, state and
local Rapid Response
staff can generate
reports showing the
number and type of
job ads available in
any given region.
occupat ions and
more.
RAPID RESPONSE (CONTINUED)
1,70057%
1,288 43%
PY 2011 Rapid Response Workforce Survey Results (Gender)
Male Female
6.8%
13.0%
12.6%
23.3%
40.8%
3.5%
0.0% 10.0% 20.0% 30.0% 40.0% 50.0%
Graduate Degree
Bachelor’s Degree
Associate or Technical Degree/Certificate
Some College
HS Diploma/GED
< HS Diploma/GED
PY 2011 Rapid Response Workforce Survey Results (Highest Grade Completed)
3.3%
5.1%
22.2%
44.7%
21.0%
3.7%
0.0% 10.0% 20.0% 30.0% 40.0% 50.0%
$42.01+
$32.01-$42.00
$22.01-$32.00
$13.01-$22.00
$9.01-$13.00
< $9.00
PY 2011 Rapid Response Workforce Survey Results (Base Pay Range)

Page 43 PY 2011 WIA Annual Report
WIA STATEWIDE PERFORMANCE
States are required to report results for the 17 statutory performance measures under WIA Section 136(b),
unless they are granted waiver authority from DOL permitting them to report only the nine common measures.
Since PY 2007, Ohio has received a waiver granting the authority to replace the statutory performance measures
with the nine common measures. This waiver authority is outlined in TEGL 17-05, Common Measures Policy for
the Employment and Training Administration’s Performance Accountability System.
For PY 2011, Ohio met or exceeded all nine negotiated performance levels for common measures. States are
required to maintain performance levels of at least 80 percent of their negotiated goals. If a state reaches 80
percent or better of a goal, it is considered to have met that goal.
The following table presents a summary of Ohio’s PY 2011 WIA performance for the Adult, Dislocated Worker,
and Youth Programs. The table also depicts Ohio’s actual performance for its NEG Program.
WIA Common Measures Negotiated
Goal
80% of
Negotiated Goal
Actual
Performance
Performance
Status
Entered Employment Rate 70.0% 56.0% 78.1% Exceeded
Employment Retention Rate 87.0% 69.6% 88.0% Exceeded
Average Earnings $14,500 $11,600 $16,337 Exceeded
Entered Employment Rate 78.0% 62.4% 80.2% Exceeded
Employment Retention Rate 92.0% 73.6% 91.4% Met
Average Earnings $17,000 $13,600 $19,494 Exceeded
Placement in Employment or Education 60.0% 48.0% 64.2% Exceeded
Attainment of Degree or Certification 42.0% 33.6% 59.6% Exceeded
Literacy and Numeracy Gains 37.0% 29.6% 52.5% Exceeded
Entered Employment Rate 78.9%
Employment Retention Rate 90.1%
Average Earnings $19,637
Summary of Ohio's WIA Performance
Adult
Dislocated Worker
Youth (ages 14-21)
NEGs
WIA ASSURANCE STATEMENT
The state of Ohio assures the U.S. Department of Labor that all required elements of the PY 2011 WIA Annual
Report have been reported accurately and uniformly to permit state-by-state comparisons across WIA
programs. Additionally, the state assures DOL that the WIA Annual Report complies with the act and federal
regulations.
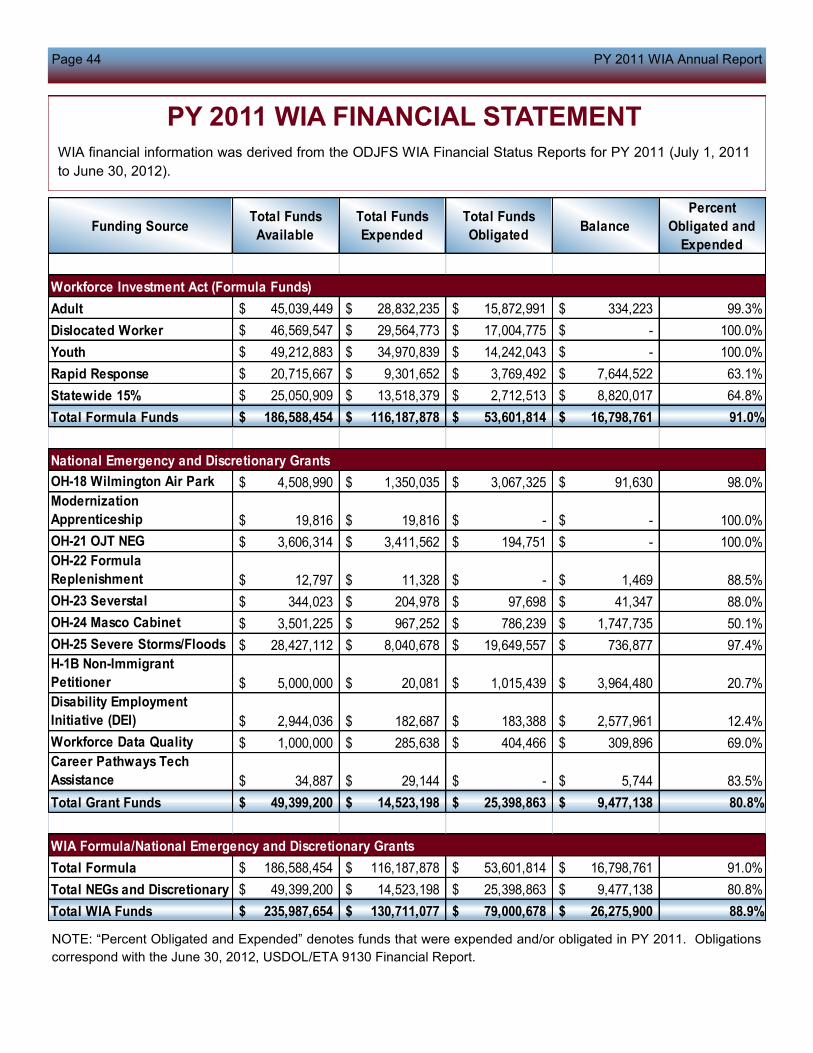
Page 44 PY 2011 WIA Annual Report
PY 2011 WIA FINANCIAL STATEMENT
WIA financial information was derived from the ODJFS WIA Financial Status Reports for PY 2011 (July 1, 2011
to June 30, 2012).
NOTE: “Percent Obligated and Expended” denotes funds that were expended and/or obligated in PY 2011. Obligations
correspond with the June 30, 2012, USDOL/ETA 9130 Financial Report.
Funding SourceTotal Funds
Available
Total Funds
Expended
Total Funds
ObligatedBalance
Percent
Obligated and
Expended
Adult 45,039,449$ 28,832,235$ 15,872,991$ 334,223$ 99.3%
Dislocated Worker 46,569,547$ 29,564,773$ 17,004,775$ -$ 100.0%
Youth 49,212,883$ 34,970,839$ 14,242,043$ -$ 100.0%
Rapid Response 20,715,667$ 9,301,652$ 3,769,492$ 7,644,522$ 63.1%
Statewide 15% 25,050,909$ 13,518,379$ 2,712,513$ 8,820,017$ 64.8%
Total Formula Funds 186,588,454$ 116,187,878$ 53,601,814$ 16,798,761$ 91.0%
OH-18 Wilmington Air Park 4,508,990$ 1,350,035$ 3,067,325$ 91,630$ 98.0%
Modernization
Apprenticeship 19,816$ 19,816$ -$ -$ 100.0%
OH-21 OJT NEG 3,606,314$ 3,411,562$ 194,751$ -$ 100.0%
OH-22 Formula
Replenishment 12,797$ 11,328$ -$ 1,469$ 88.5%
OH-23 Severstal 344,023$ 204,978$ 97,698$ 41,347$ 88.0%
OH-24 Masco Cabinet 3,501,225$ 967,252$ 786,239$ 1,747,735$ 50.1%
OH-25 Severe Storms/Floods 28,427,112$ 8,040,678$ 19,649,557$ 736,877$ 97.4%
H-1B Non-Immigrant
Petitioner 5,000,000$ 20,081$ 1,015,439$ 3,964,480$ 20.7%
Disability Employment
Initiative (DEI) 2,944,036$ 182,687$ 183,388$ 2,577,961$ 12.4%
Workforce Data Quality 1,000,000$ 285,638$ 404,466$ 309,896$ 69.0%
Career Pathways Tech
Assistance 34,887$ 29,144$ -$ 5,744$ 83.5%
Total Grant Funds 49,399,200$ 14,523,198$ 25,398,863$ 9,477,138$ 80.8%
Total Formula 186,588,454$ 116,187,878$ 53,601,814$ 16,798,761$ 91.0%
Total NEGs and Discretionary 49,399,200$ 14,523,198$ 25,398,863$ 9,477,138$ 80.8%
Total WIA Funds 235,987,654$ 130,711,077$ 79,000,678$ 26,275,900$ 88.9%
Workforce Investment Act (Formula Funds)
National Emergency and Discretionary Grants
WIA Formula/National Emergency and Discretionary Grants

Page 45 PY 2011 WIA Annual Report
PY 2011 WIA EXPENDITURES
$28,832,23531%
$29,564,77332%
$34,970,83937%
PY 2011 Program Expenditures
Adults Dislocated Workers Youth
For PY 2011, Ohio’s total funds available for
WIA Adult, Dislocated Worker, and Youth
Programs were approximately $186.6 million.*
Of this amount, more than $140.8 million was
made available for local areas and nearly
$45.8 million for statewide activities. As shown
in the chart below, this was the smallest
amount of federal funds available for these
programs in the previous five years.
Nationally, the total amount of WIA funds
available to all states for participant
enrollments and services has also decreased.
Ohio spent nearly $93.4 million* in WIA
formula funds on Adult, Dislocated Worker,
and Youth Program activities. This was similar
to PY 2010.
Ohio’s Youth Program incurred the largest
portion of expenditures (37 percent).
The Youth Program expended approximately
$35 million, the Dislocated Worker Program
nearly $29.6 million, and the Adult Program
more than $28.8 million.
* Includes carry-in funds.
NOTE: Total WIA funds available and expended include carry-in funds. PY 2008 - PY 2010 total WIA funds available and
expended include formula and stimulus funds. PY 2007 WIA funds available are post-rescissions.
$46 $68 $63 $48 $45
$50
$94$80
$48 $47
$53
$101$98
$50 $49
$0
$50
$100
$150
$200
$250
$300
PY 2007 PY 2008 PY 2009 PY 2010 PY 2011
Mil
lio
ns
Total Funds Available to Local Areas by Program (PYs 2007 - 2011)
Adults Dislocated Workers Youth
$36 $40 $46 $30 $29
$39 $46$61
$32 $30
$40$39
$81
$31 $35
$0
$50
$100
$150
$200
PY 2007 PY 2008 PY 2009 PY 2010 PY 2011
Mil
lio
ns
Total Local Area Expenditures by Program (PYs 2007 - 2011)
Adults Dislocated Workers Youth

Page 46 PY 2011 WIA Annual Report
PY 2011 COST-EFFECTIVENESS ANALYSIS
Ohio’s PY 2011 cost-effectiveness analysis is a simple, quantitative method for comparing the total cost of
workforce investment activities in terms of the number of people served. Total expenditures are divided by
the number of participants served during the year by the particular program or service to come up with a
cost-effectiveness ratio. While costs are stated in dollars, program’s effectiveness are not evaluated in
dollars but in the number of people receiving WIA services.
During PY 2011, Ohio served 40,062 WIA adults,
dislocated workers, and youth at an average cost
per participant of $2,331. For the year, Ohio
expended an average cost of $1,800 per adult,
$2,266 per dislocated worker, and $3,181 per youth
participant.
In order to increase the effectiveness and success
of youth service programs, youth service providers
often employ innovative strategies to serve the
“neediest youth.” In PY 2011, these strategies
involved serving youth in foster care (particularly
those aging out of foster care), youth offenders,
children of incarcerated parents, and migrant youth.
For Ohio’s youth needing an array of services,
including education, employment, and training, costs
are likely to be higher. For this reason, as in PY
2010, Ohio’s Youth Program saw the highest
participant costs.
In PY 2011, Ohio placed a great emphasis on
serving the unemployed and underemployed, as well
as assisting workers to avoid layoffs. Statewide,
16,349 adults, dislocated workers, and youth
received training services.
On average, the state expended $5,711 per
participant who received training services. This
measure was calculated by dividing the total
program expenditures by the total number of
participants that received training services. The
Youth Program served the highest number of
participants receiving training services, 5,983,
followed by the Dislocated Worker Program with
5,191, and the Adult Program with 5,175.
PY 2011 STATEWIDE EVALUATIONS
During PY 2011, Ohio requested and received a waiver of WIA Section 134(a)(2)(B)(ii) and 20 CFR
665.200(d), exempting the state from the requirement to conduct statewide evaluations of Adult, Dislocated
Worker, and Youth Programs. This waiver authority released the state from carrying out evaluation activities
designed to establish and promote continuous improvement of the statewide workforce investment system.
Program Year 2011 AdultsDislocated
WorkersYouth Total
Total Participants 16,020 13,048 10,994 40,062
Total Expenditures $28,832,235 $29,564,773 $34,970,839 $93,367,847
Cost Per Participant $1,800 $2,266 $3,181 $2,331
Total Participants that Received Training Services 5,175 5,191 5,983 16,349
Cost Per Participant for Training Services $5,571 $5,695 $5,845 $5,711

Page 47 PY 2011 WIA Annual Report
1,361
1,962
1,725
2,052
$12,000,691
867
1,500
Individuals Who Received
Training Services
Individuals Who Only Received
Core and Intensive Services
78.6%
89.5%
$16,237
3,118
3,968
4,862
5,434
$51,894,345
3,196
77.4%
85.4%
$16,551$24,825,804
550
$5,637,098
311
49074.9%
656
$6,448,269
368
86.7%
$17,523
Reported Information
Entered Employment Rate
Employment Retention Rate
2,654
3,427
2,677
3,133
52.9%
91.2%
$15,843
46
87
62
68
$554,487
35
654
569
77.3%
87.1%
$18,126
389
503
479
87.0%
Table B - Adult Program Results
Veterans Individuals with
Disabilities
Older Individuals
Performance
Status
Exceeded
Exceeded
Exceeded
78.1%5,772
7,395
88.0%
$16,337
7,539
8,567
$76,720,149
4,696
Statewide Performance Tables
Average Earnings Rate
Reported Information
Entered Employment Rate
Employment Retention Rate
Average Earnings Rate
Public Assistance
Recipients Receiving
Intensive or Training
Services
Entered
Employment Rate69.4%
Reported
Information
Employment
Retention Rate
Average
Earnings Rate
84.1%
$13,842
Table D - Other Outcome Information for the Adult Program
Table C - Outcomes for Adult Special Populations
Negotiated
Performance Level
Actual
Performance Level
70.0%
$14,500

Page 48 PY 2011 WIA Annual Report
686
866
741
826
$11,352,126
546
Employment Retention Rate 92.3%5,405
89.6%2,318
5,859 2,587
Average Earnings Rate $19,127$77,847,117
$20,355$35,275,083
4,070 1,733
Table F - Outcomes for Dislocated Worker Special Populations
Reported Information Individuals Who Received
Training Services
Individuals Who Only Received
Core and Intensive Services
Entered Employment Rate 82.5%4,815
75.5%2,231
5,835 2,956
Table G - Other Outcome Information for the Dislocated Worker Program
Average
Earnings Rate$20,791 $20,507
$348,611$19,813
$13,750,530$14,099
$521,678
17 694 37
Employment
Retention Rate89.7% 82.9%
3487.4%
99485.1%
63
41 1,137 74
Reported
Information
Veterans Individuals with
Disabilities
Older Individuals Displaced
Homemakers
Entered
Employment Rate79.2% 70.0%
2872.9%
98970.0%
49
40 1,356 70
Reported Information Negotiated
Performance Level
Actual
Performance Level
Performance
Status
Exceeded
Met
Exceeded
Entered Employment Rate
Employment Retention Rate
Average Earnings Rate
Table E - Dislocated Worker Program Results
78.0%
92.0%
$17,000
80.2%
91.4%
$19,494
7,046
8,791
7,723
8,446
$113,122,200
5,803

Page 49 PY 2011 WIA Annual Report
7,846
9,263
7,695
8,474
Reported Information
Placement in Employment
or Education
Attainment of Degree or Certificate
3,093
12 Month
Employment
Retention Rate
12 Month Earnings
Increase
(Adults and Older
Youth)
or
12 Month Earnings
Replacement
(Dislocated Workers)
Placement in
Nontraditional
Employment
Wages at Entry
into Employment
for Those
Individuals Who
Entered
Unsubsidized
Employment
Entry into
Unsubsidized
Employment Related
to the
Training Received
of Those Who
Completed Training
Services
Table L - Other Reported Information
59.6%
52.5%Literacy and Numeracy Gains
60.0%
42.0%
37.0%
64.2%
Table H.1 - Youth (14-21) Program Results
Performance
Status
Negotiated
Performance Level
Actual
Performance Level
Out-of-School Youth
5,626
2,416
Dislocated
Workers
Adults $5,665$20,381,693
3,598
Reported
Information
0.1%4
7,04690.8% 106.5%
$100,002,756
$93,878,912
0.0%2
5,77284.7% $6,989
$8,620
$27,297,498
3,906
$49,125,659
5,699
19.3%
19.1%
601
3,118
15,082
1
4,819
2,897
4,860
775
1,476
Exceeded
Exceeded
Exceeded
921
4,815
3,210
Table M - Participants Level
In-School Youth
139,937
112,190
16,020
13,048
10,994
4,325
6,669
WIA Dislocated Workers
Total Youth (14-21)
8,337
7,470
WIA Adults
Participant Populations Total Particpants Served Total Exiters
Total Adult Customers
Total Adults (Self-Service Only)

Page 50 PY 2011 WIA Annual Report
Table N - Cost of Program Activities (PY 2011)
Program Activity Total Federal Spending
Local Adult
Statewide Required Activities (up to 15%) WIA Section 134(a)(2)(B) $13,518,379
Program Activity Description
Local Dislocated Workers
$28,832,235
$29,564,773
Local Youth
Rapid Response (up to 25%) WIA Section 134(a)(2)(A)
$34,970,839
$9,301,652
Total of All Federal Spending Listed Above $116,187,878
Statewide Allowable
Activities WIA Section 134(a)(3)

Page 51 PY 2011 WIA Annual Report
Overall Status of Local PerformanceNot Met Met Exceeded
0 4 5
Literacy or Numeracy Gains Youth (14-21) 37.0% 75.2%
Description of Other State Indicators of Performance N/A N/A
Attainment of Degree or Certificate Youth (14-21) 42.0% 59.9%
Average Earnings RateAdults $14,500 $13,988
Dislocated Workers $17,000 $20,738
Employment Retention RateAdults 87.0% 77.6%
Dislocated Workers 92.0% 89.3%
Placement in Employment or
EducationYouth (14-21) 60.0% 74.8%
Reported InformationNegotiated
Performance Level
Actual
Performance Level
Entered Employment RateAdults 70.0% 68.6%
Dislocated Workers 78.0% 87.1%
ETA Assigned #
39255Total Exiters
Adults 581
Dislocated Workers 409
Youth 369
Table O - Local Performance Area 2 (Medina & Summit)
LWIA 2 _ Medina & Summit Total Participants Served
Adults 1,019
Dislocated Workers 631
Youth 703
Overall Status of Local PerformanceNot Met Met Exceeded
0 1 8
Literacy or Numeracy Gains Youth (14-21) 37.0% 87.2%
Description of Other State Indicators of Performance N/A N/A
Attainment of Degree or Certificate Youth (14-21) 42.0% 80.0%
Average Earnings RateAdults $14,500 $15,395
Dislocated Workers $17,000 $18,001
Employment Retention RateAdults 87.0% 89.7%
Dislocated Workers 92.0% 92.0%
Placement in Employment or
EducationYouth (14-21) 60.0% 71.0%
Reported InformationNegotiated
Performance Level
Actual
Performance Level
Entered Employment RateAdults 70.0% 81.2%
Dislocated Workers 78.0% 88.4%
ETA Assigned #
39175Total Exiters
Adults 161
Dislocated Workers 134
Youth 103
Table O - Local Performance Area 1 (Adams, Brown, Pike, & Scioto)
LWIA 1 _ Adams, Brown, Pike, &
SciotoTotal Participants Served
Adults 387
Dislocated Workers 284
Youth 260
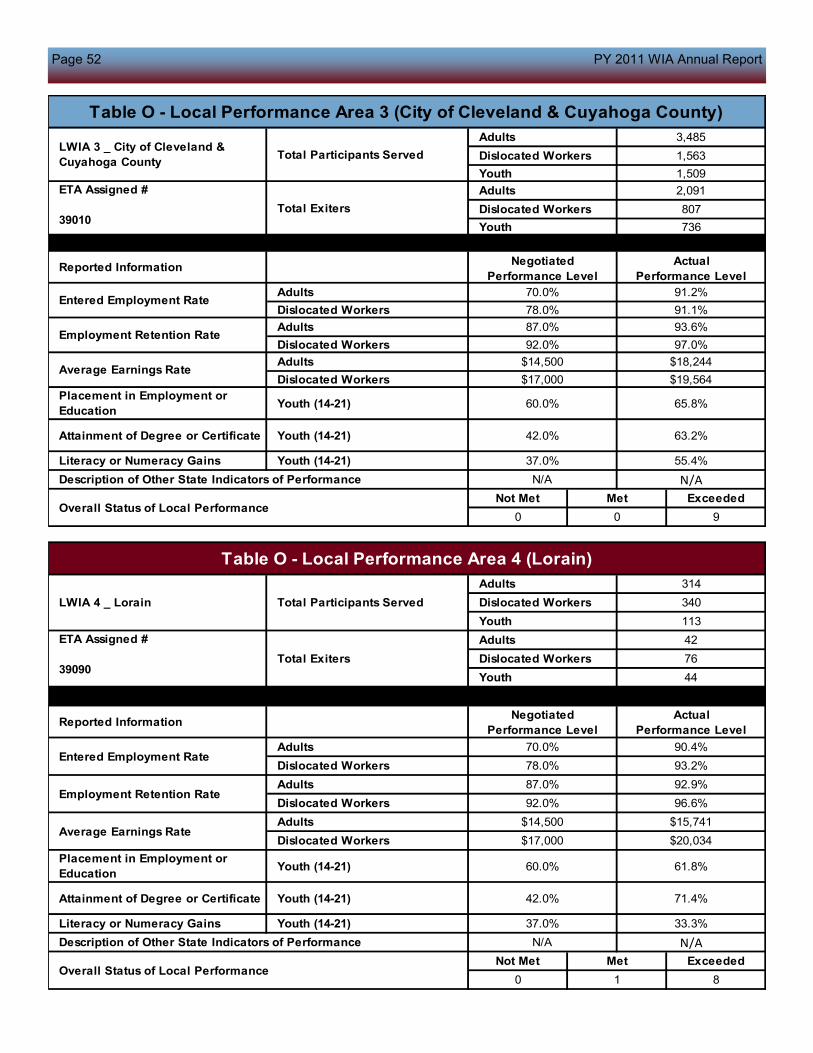
Page 52 PY 2011 WIA Annual Report
55.4%37.0%Youth (14-21)Literacy or Numeracy Gains
Overall Status of Local PerformanceNot Met Met Exceeded
0 1 8
Literacy or Numeracy Gains Youth (14-21) 37.0% 33.3%
Description of Other State Indicators of Performance N/A N/A
Attainment of Degree or Certificate Youth (14-21) 42.0% 71.4%
Average Earnings RateAdults $14,500 $15,741
Dislocated Workers $17,000 $20,034
Employment Retention RateAdults 87.0% 92.9%
Dislocated Workers 92.0% 96.6%
Placement in Employment or
EducationYouth (14-21) 60.0% 61.8%
Reported InformationNegotiated
Performance Level
Actual
Performance Level
Entered Employment RateAdults 70.0% 90.4%
Dislocated Workers 78.0% 93.2%
ETA Assigned #
39090Total Exiters
Adults 42
Dislocated Workers 76
Youth 44
Table O - Local Performance Area 4 (Lorain)
LWIA 4 _ Lorain Total Participants Served
Adults 314
Dislocated Workers 340
Youth 113
Overall Status of Local PerformanceNot Met Met Exceeded
0 0 9
Description of Other State Indicators of Performance N/A N/A
Attainment of Degree or Certificate Youth (14-21) 42.0% 63.2%
Average Earnings RateAdults $14,500 $18,244
Dislocated Workers $17,000 $19,564
Employment Retention RateAdults 87.0% 93.6%
Dislocated Workers 92.0% 97.0%
Placement in Employment or
EducationYouth (14-21) 60.0% 65.8%
Reported InformationNegotiated
Performance Level
Actual
Performance Level
Entered Employment RateAdults 70.0% 91.2%
Dislocated Workers 78.0% 91.1%
ETA Assigned #
39010Total Exiters
Adults 2,091
Dislocated Workers 807
Youth 736
Table O - Local Performance Area 3 (City of Cleveland & Cuyahoga County)
LWIA 3 _ City of Cleveland &
Cuyahoga CountyTotal Participants Served
Adults 3,485
Dislocated Workers 1,563
Youth 1,509

Page 53 PY 2011 WIA Annual Report
Attainment of Degree or Certificate Youth (14-21)
Placement in Employment or
EducationYouth (14-21) 60.0% 65.5%
Reported InformationNegotiated
Performance Level
Actual
Performance Level
Entered Employment Rate
$14,500 $18,038
Dislocated Workers $17,000 $20,519
42.0% 61.5%
Average Earnings Rate
Overall Status of Local PerformanceNot Met Met Exceeded
0 1 8
Literacy or Numeracy Gains Youth (14-21) 37.0% 33.3%
Description of Other State Indicators of Performance N/A N/A
Adults
Employment Retention RateAdults 87.0%
ETA Assigned #
39085Total Exiters
Adults 79
Dislocated Workers 116
Youth 37
Adults 70.0% 90.6%
Dislocated Workers 78.0% 97.7%
100.0%
Dislocated Workers 92.0% 98.3%
Table O - Local Performance Area 5 (Lake)
LWIA 5 _ Lake Total Participants Served
Adults 302
Dislocated Workers 488
Youth 109
Table O - Local Performance Area 6 (Stark & Tuscarawas)
LWIA 6 _ Stark & Tuscarawas Total Participants Served
Adults 261
Dislocated Workers 370
Youth 268
ETA Assigned #
39165Total Exiters
Adults 198
Dislocated Workers 247
Youth 190
Reported InformationNegotiated
Performance Level
Actual
Performance Level
Entered Employment RateAdults 70.0% 84.3%
Dislocated Workers 78.0% 92.5%
Employment Retention RateAdults 87.0% 88.8%
Dislocated Workers 92.0% 93.1%
Average Earnings RateAdults $14,500 $17,909
Dislocated Workers $17,000 $21,621
Placement in Employment or
EducationYouth (14-21) 60.0% 61.7%
Attainment of Degree or Certificate Youth (14-21) 42.0% 61.8%
Literacy or Numeracy Gains Youth (14-21) 37.0% 73.1%
Description of Other State Indicators of Performance N/A N/A
Overall Status of Local PerformanceNot Met Met Exceeded
0 0 9

Page 54 PY 2011 WIA Annual Report
Description of Other State Indicators of Performance N/A N/A
Overall Status of Local PerformanceNot Met Met Exceeded
0 3 6
Placement in Employment or
EducationYouth (14-21) 60.0% 72.6%
Attainment of Degree or Certificate Youth (14-21) 42.0% 59.7%
Literacy or Numeracy Gains Youth (14-21) 37.0% 36.8%
Employment Retention RateAdults 87.0% 92.2%
Dislocated Workers 92.0% 91.4%
Average Earnings RateAdults $14,500 $16,726
Dislocated Workers $17,000 $16,465
Reported InformationNegotiated
Performance Level
Actual
Performance Level
Entered Employment RateAdults 70.0% 91.4%
Dislocated Workers 78.0% 100.0%
ETA Assigned #
39190Total Exiters
Adults 58
Dislocated Workers 32
Youth 65
Table O - Local Performance Area 8 (Auglaize, Hardin, Mercer, & Van Wert)
LWIA 8 _ Auglaize, Hardin, Mercer
& Van WertTotal Participants Served
Adults 115
Dislocated Workers 75
Youth 117
Table O - Local Performance Area 7
LWIA 7 _ WIA Area 7 Total Participants Served
Adults 3,760
Dislocated Workers 3,881
Youth 4,260
Reported InformationNegotiated
Performance Level
Actual
Performance Level
ETA Assigned #
39195Total Exiters
Adults 2,106
Dislocated Workers 2,550
Youth 2,039
Employment Retention RateAdults 87.0% 87.8%
Dislocated Workers 92.0% 92.4%
Entered Employment RateAdults 70.0% 74.8%
Dislocated Workers 78.0% 75.5%
Placement in Employment or
EducationYouth (14-21) 60.0% 63.4%
Attainment of Degree or Certificate Youth (14-21) 42.0% 60.2%
Average Earnings RateAdults $14,500 $15,068
Dislocated Workers $17,000 $18,658
Overall Status of Local PerformanceNot Met Met Exceeded
0 1 8
Literacy or Numeracy Gains Youth (14-21) 37.0% 49.1%
Description of Other State Indicators of Performance N/A N/A
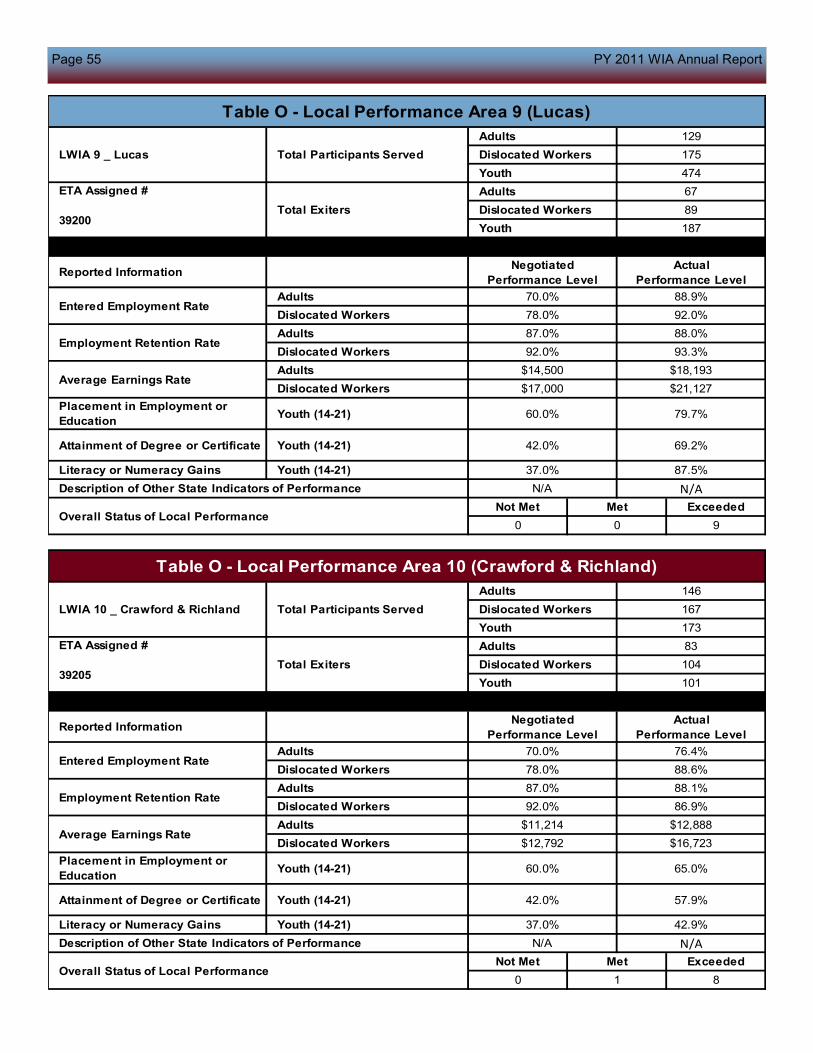
Page 55 PY 2011 WIA Annual Report
Description of Other State Indicators of Performance N/A N/A
Overall Status of Local PerformanceNot Met Met Exceeded
0 1 8
Placement in Employment or
EducationYouth (14-21) 60.0% 65.0%
Attainment of Degree or Certificate Youth (14-21) 42.0% 57.9%
Literacy or Numeracy Gains Youth (14-21) 37.0% 42.9%
Employment Retention RateAdults 87.0% 88.1%
Dislocated Workers 92.0% 86.9%
Average Earnings RateAdults $11,214 $12,888
Dislocated Workers $12,792 $16,723
Reported InformationNegotiated
Performance Level
Actual
Performance Level
Entered Employment RateAdults 70.0% 76.4%
Dislocated Workers 78.0% 88.6%
ETA Assigned #
39205Total Exiters
Adults 83
Dislocated Workers 104
Youth 101
Table O - Local Performance Area 10 (Crawford & Richland)
LWIA 10 _ Crawford & Richland Total Participants Served
Adults 146
Dislocated Workers 167
Youth 173
Description of Other State Indicators of Performance N/A N/A
Overall Status of Local PerformanceNot Met Met Exceeded
0 0 9
Placement in Employment or
EducationYouth (14-21) 60.0% 79.7%
Attainment of Degree or Certificate Youth (14-21) 42.0% 69.2%
Literacy or Numeracy Gains Youth (14-21) 37.0% 87.5%
Employment Retention RateAdults 87.0% 88.0%
Dislocated Workers 92.0% 93.3%
Average Earnings RateAdults $14,500 $18,193
Dislocated Workers $17,000 $21,127
Reported InformationNegotiated
Performance Level
Actual
Performance Level
Entered Employment RateAdults 70.0% 88.9%
Dislocated Workers 78.0% 92.0%
ETA Assigned #
39200Total Exiters
Adults 67
Dislocated Workers 89
Youth 187
Table O - Local Performance Area 9 (Lucas)
LWIA 9 _ Lucas Total Participants Served
Adults 129
Dislocated Workers 175
Youth 474

Page 56 PY 2011 WIA Annual Report
Description of Other State Indicators of Performance N/A N/A
Overall Status of Local PerformanceNot Met Met Exceeded
0 4 5
Placement in Employment or
EducationYouth (14-21) 60.0% 58.8%
Attainment of Degree or Certificate Youth (14-21) 42.0% 44.4%
Literacy or Numeracy Gains Youth (14-21) 37.0% 35.0%
Employment Retention RateAdults 87.0% 85.9%
Dislocated Workers 92.0% 89.4%
Average Earnings RateAdults $14,500 $17,298
Dislocated Workers $17,000 $21,492
Reported InformationNegotiated
Performance Level
Actual
Performance Level
Entered Employment RateAdults 70.0% 74.4%
Dislocated Workers 78.0% 82.9%
ETA Assigned #
39215Total Exiters
Adults 242
Dislocated Workers 388
Youth 65
Table O - Local Performance Area 12 (Butler, Clermont, & Warren)
LWIA 12 _ Butler, Clermont, &
WarrenTotal Participants Served
Adults 323
Dislocated Workers 449
Youth 276
Description of Other State Indicators of Performance N/A N/A
Overall Status of Local PerformanceNot Met Met Exceeded
1 5 3
Placement in Employment or
EducationYouth (14-21) 60.0% 41.7%
Attainment of Degree or Certificate Youth (14-21) 42.0% 35.4%
Literacy or Numeracy Gains Youth (14-21) 37.0% 38.8%
Employment Retention RateAdults 87.0% 82.5%
Dislocated Workers 92.0% 82.6%
Average Earnings RateAdults $14,500 $14,574
Dislocated Workers $17,000 $21,359
Reported InformationNegotiated
Performance Level
Actual
Performance Level
Entered Employment RateAdults 70.0% 64.4%
Dislocated Workers 78.0% 74.9%
ETA Assigned #
39210Total Exiters
Adults 839
Dislocated Workers 372
Youth 544
Table O - Local Performance Area 11 (Franklin)
LWIA 11 _ Franklin Total Participants Served
Adults 2,588
Dislocated Workers 1,169
Youth 601

Page 57 PY 2011 WIA Annual Report
ETA Assigned #
39220Total Exiters
Adults 718
Dislocated Workers 757
Youth 429
Table O - Local Performance Area 13 (Hamilton)
LWIA 13 _ Hamilton Total Participants Served
Adults 970
Dislocated Workers 715
Youth 771
Reported InformationNegotiated
Performance Level
Actual
Performance Level
Entered Employment RateAdults 58.0% 62.1%
Dislocated Workers 55.0% 65.2%
Employment Retention RateAdults 84.0% 82.9%
Dislocated Workers 82.0% 86.2%
Placement in Employment or
EducationYouth (14-21) 60.0% 79.7%
Attainment of Degree or Certificate Youth (14-21) 42.0% 68.3%
Average Earnings RateAdults $14,500 $15,405
Dislocated Workers $17,000 $19,963
Overall Status of Local PerformanceNot Met Met Exceeded
0 1 8
Literacy or Numeracy Gains Youth (14-21) 37.0% 53.0%
Description of Other State Indicators of Performance N/A N/A
ETA Assigned #
39290Total Exiters
Adults 70
Dislocated Workers 44
Youth 208
Table O - Local Performance Area 14 (Athens, Meigs, & Perry)
LWIA 14 _ Athens, Meigs, & Perry Total Participants Served
Adults 130
Dislocated Workers 64
Youth 210
Reported InformationNegotiated
Performance Level
Actual
Performance Level
Entered Employment RateAdults 60.0% 62.7%
Dislocated Workers 78.0% 80.3%
Employment Retention RateAdults 87.0% 90.0%
Dislocated Workers 92.0% 94.6%
Placement in Employment or
EducationYouth (14-21) 55.0% 47.1%
Attainment of Degree or Certificate Youth (14-21) 42.0% 39.9%
Average Earnings RateAdults $12,000 $16,862
Dislocated Workers $15,000 $19,132
Overall Status of Local PerformanceNot Met Met Exceeded
0 2 7
Literacy or Numeracy Gains Youth (14-21) 37.0% 50.0%
Description of Other State Indicators of Performance N/A N/A

Page 58 PY 2011 WIA Annual Report
ETA Assigned #
39230Total Exiters
Adults 116
Dislocated Workers 98
Youth 33
Table O - Local Performance Area 15 (Monroe, Morgan, Noble, & Washington)
LWIA 15 _ Monroe, Morgan, Noble
& WashingtonTotal Participants Served
Adults 224
Dislocated Workers 245
Youth 119
Reported InformationNegotiated
Performance Level
Actual
Performance Level
Entered Employment RateAdults 70.0% 93.8%
Dislocated Workers 78.0% 95.0%
Employment Retention RateAdults 87.0% 92.3%
Dislocated Workers 92.0% 93.4%
Placement in Employment or
EducationYouth (14-21) 60.0% 66.7%
Attainment of Degree or Certificate Youth (14-21) 42.0% 73.1%
Average Earnings RateAdults $14,500 $17,440
Dislocated Workers $17,000 $18,802
Overall Status of Local PerformanceNot Met Met Exceeded
0 0 9
Literacy or Numeracy Gains Youth (14-21) 37.0% 60.0%
Description of Other State Indicators of Performance N/A N/A
Table O - Local Performance Area 16 (Belmont, Carroll, Harrison, & Jefferson)
LWIA 16 _ Belmont, Carroll,
Harrison, & JeffersonTotal Participants Served
Adults 260
Dislocated Workers 269
Youth 147
ETA Assigned #
39235Total Exiters
Adults 91
Dislocated Workers 105
Youth 84
Reported InformationNegotiated
Performance Level
Actual
Performance Level
Entered Employment RateAdults 70.0% 70.1%
Dislocated Workers 78.0% 78.4%
Employment Retention RateAdults 87.0% 86.2%
Dislocated Workers 92.0% 92.0%
Average Earnings RateAdults $14,500 $17,233
Dislocated Workers $17,000 $19,983
Placement in Employment or
EducationYouth (14-21) 60.0% 71.2%
Attainment of Degree or Certificate Youth (14-21) 42.0% 56.0%
Literacy or Numeracy Gains Youth (14-21) 37.0% 10.0%
Description of Other State Indicators of Performance N/A N/A
Overall Status of Local PerformanceNot Met Met Exceeded
1 2 6

Page 59 PY 2011 WIA Annual Report
Table O - Local Performance Area 17 (Columbiana & Mahoning)
LWIA 17 _ Columbiana & Mahoning Total Participants Served
Adults 642
Dislocated Workers 787
Youth 249
ETA Assigned #
39240Total Exiters
Adults 148
Dislocated Workers 322
Youth 97
Reported InformationNegotiated
Performance Level
Actual
Performance Level
Entered Employment RateAdults 70.0% 68.1%
Dislocated Workers 78.0% 82.3%
Employment Retention RateAdults 87.0% 95.4%
Dislocated Workers 92.0% 96.0%
Average Earnings RateAdults $14,500 $15,413
Dislocated Workers $17,000 $18,623
Placement in Employment or
EducationYouth (14-21) 60.0% 79.3%
Attainment of Degree or Certificate Youth (14-21) 42.0% 86.9%
Literacy or Numeracy Gains Youth (14-21) 37.0% 70.0%
Description of Other State Indicators of Performance N/A N/A
Overall Status of Local PerformanceNot Met Met Exceeded
0 1 8
Table O - Local Performance Area 18 (Trumbull)
LWIA 18 _ Trumbull Total Participants Served
Adults 292
Dislocated Workers 276
Youth 86
ETA Assigned #
39245Total Exiters
Adults 150
Dislocated Workers 180
Youth 62
Reported InformationNegotiated
Performance Level
Actual
Performance Level
Entered Employment RateAdults 70.0% 85.7%
Dislocated Workers 78.0% 88.3%
Employment Retention RateAdults 87.0% 95.7%
Dislocated Workers 92.0% 92.3%
Average Earnings RateAdults $14,500 $16,518
Dislocated Workers $17,000 $20,351
Placement in Employment or
EducationYouth (14-21) 60.0% 59.0%
Attainment of Degree or Certificate Youth (14-21) 42.0% 38.4%
Literacy or Numeracy Gains Youth (14-21) 37.0% 40.0%
Description of Other State Indicators of Performance N/A N/A
Overall Status of Local PerformanceNot Met Met Exceeded
0 2 7

Page 60 PY 2011 WIA Annual Report
ETA Assigned #
39250Total Exiters
Adults 286
Dislocated Workers 220
Youth 123
Table O - Local Performance Area 19 (Ashtabula, Geauga, & Portage)
LWIA 19 _ Ashtabula, Geauga, &
PortageTotal Participants Served
Adults 307
Dislocated Workers 231
Youth 252
Reported InformationNegotiated
Performance Level
Actual
Performance Level
Entered Employment RateAdults 70.0% 84.7%
Dislocated Workers 78.0% 88.3%
Employment Retention RateAdults 87.0% 91.1%
Dislocated Workers 92.0% 93.5%
Placement in Employment or
EducationYouth (14-21) 54.0% 69.8%
Attainment of Degree or Certificate Youth (14-21) 42.0% 69.0%
Average Earnings RateAdults $14,500 $18,885
Dislocated Workers $17,000 $20,635
Overall Status of Local PerformanceNot Met Met Exceeded
0 0 9
Literacy or Numeracy Gains Youth (14-21) 37.0% 62.5%
Description of Other State Indicators of Performance N/A N/A
ETA Assigned #
39285Total Exiters
Adults 115
Dislocated Workers 143
Youth 110
Table O - Local Performance Area 20 (Fairfield, Hocking, Pickaway, Ross, & Vinton)
LWIA 20 _ Fairfield, Hocking,
Pickaway, Ross, & VintonTotal Participants Served
Adults 201
Dislocated Workers 251
Youth 297
Reported InformationNegotiated
Performance Level
Actual
Performance Level
Entered Employment RateAdults 70.0% 83.7%
Dislocated Workers 78.0% 85.3%
Employment Retention RateAdults 87.0% 84.8%
Dislocated Workers 92.0% 91.0%
Placement in Employment or
EducationYouth (14-21) 60.0% 51.8%
Attainment of Degree or Certificate Youth (14-21) 42.0% 61.8%
Average Earnings RateAdults $14,500 $15,365
Dislocated Workers $17,000 $18,371
Overall Status of Local PerformanceNot Met Met Exceeded
0 3 6
Literacy or Numeracy Gains Youth (14-21) 37.0% 37.5%
Description of Other State Indicators of Performance N/A N/A

John R. Kasich, Governor
State of Ohio
http://ohio.gov
Michael B. Colbert, Director
Ohio Department of Job and Family Services
http://jfs.ohio.gov
John B. Weber, Deputy Director
Office of Workforce Development
http://jfs.ohio.gov/owd
Recommended