Nutrizione e metabolismo: due facce dello stesso problemaNutrition and metabolism: two sides of the same problemStefano Fumagalli – SOD Cardiologia e Medicina Geriatrica, AOU Careggi e Università di Firenze
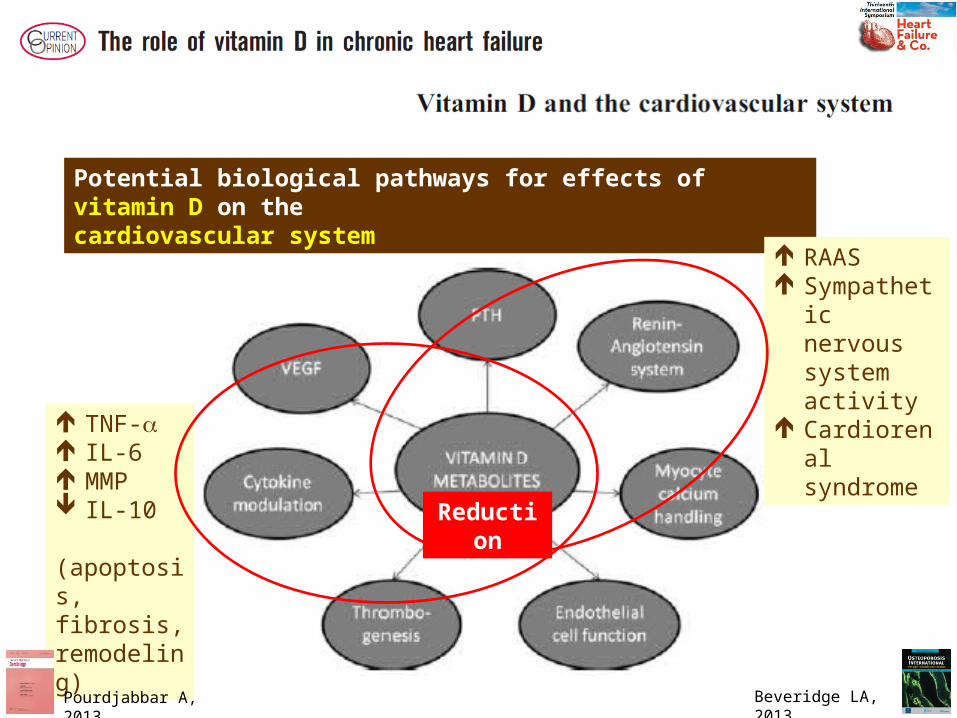
Potential biological pathways for effects of vitamin D on thecardiovascular system
RAAS Sympathetic
nervous system activity
Cardiorenal syndrome TNF-a
IL-6 MMP IL-10 (apoptosis, fibrosis, remodeling)
Reduction
Beveridge LA, 2013Pourdjabbar A, 2013
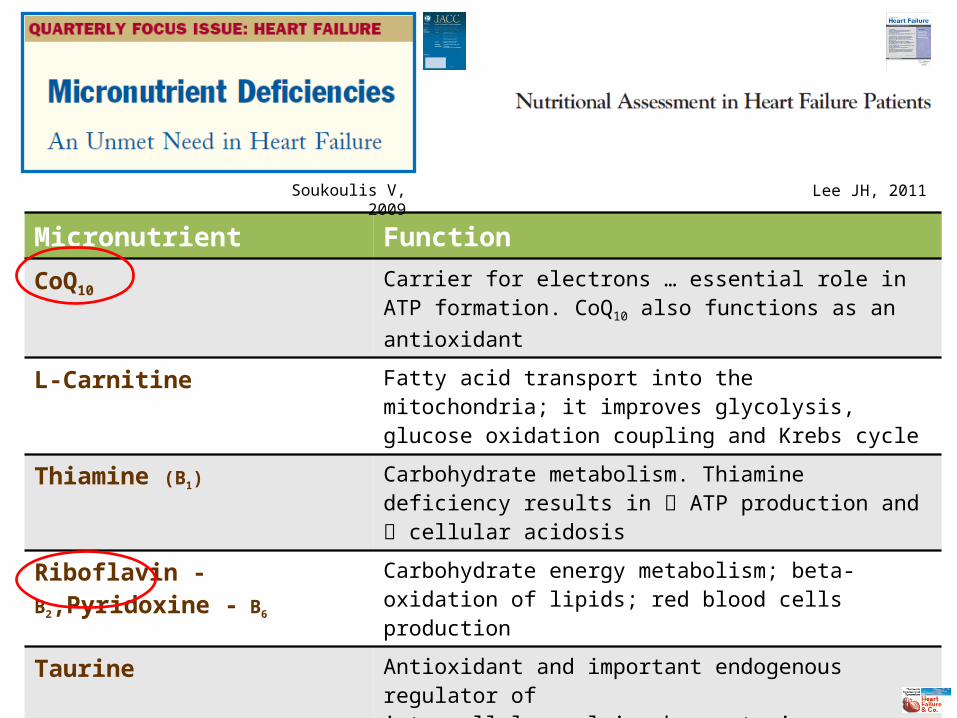
Micronutrient Function
CoQ10Carrier for electrons … essential role in ATP formation. CoQ10 also functions as an antioxidant
L-Carnitine Fatty acid transport into the mitochondria; it improves glycolysis, glucose oxidation coupling and Krebs cycle
Thiamine (B1) Carbohydrate metabolism. Thiamine deficiency results in ATP production and cellular acidosis
Riboflavin - B2,Pyridoxine - B6Carbohydrate energy metabolism; beta-oxidation of lipids; red blood cells production
Taurine Antioxidant and important endogenous regulator ofintracellular calcium homeostasis
Creatine Energy metabolism regulator in all muscles. Mitochondrial energy of ATP is transferred to phosphocreatine
Magnesium & Potassium Deficiencies primarily related to arrhythmias
Zinc, Selenium Antioxidants
Soukoulis V, 2009 Lee JH, 2011

Baseline 8 weeks P Value
SIP total score
Q-ter® + creatine 8.4 ± 7.4 7.7 ± 8.1 0.44
Placebo 9.1 ± 5.6 8.2 ± 6.3 0.09
SIP physical score
Q-ter® + creatine 6.5 ± 5.1 5.1 ± 6.5 <0.01
Placebo 6.8 ± 6.4 5.9 ± 5.6 0.21
SIP psychosocial score
Q-ter® + creatine 7.8 ± 7.0 7.5 ± 7.3 0.78
Placebo 10.0 ± 8.6 9.0 ± 9.9 0.18
Q-ter®: Coenzyme Q10 terclatrate; SIP: Sickness Impact Profile
The effects of Q-ter® & Creatine (320 / 340 mg) on Health Related Quality of Life
Fumagalli S,Clin Cardiol 2011
Q-ter® + Creatine - N=35 Age: 72 y; EF: 30%; NYHA II: 89%
Placebo - N=32; Age: 71 y; EF: 31%; NYHA II: 94%
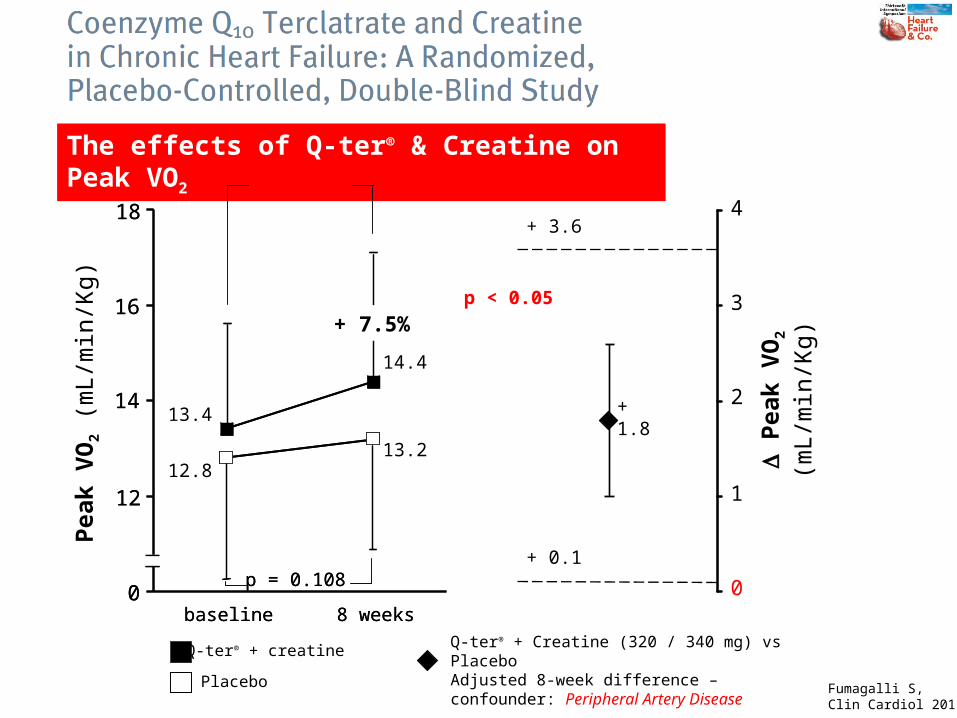
The effects of Q-ter® & Creatine on Peak VO2
Q-ter® + creatine
+ 10.4%
Placebo
8 weeksbaseline
+ 7.5%
0
12
14
16
18
p = 0.108
8 weeksbaseline
+ 7.5%
0
12
14
16
18
p = 0.108
1
2
3
4
0
+ 3.6
+ 0.1
Pea
k V
O2
(mL/
min
/Kg)
D P
eak
VO
2 (m
L/m
in/K
g)
p < 0.05
+ 1.8
12.8
13.4
13.2
14.4
p = 0.003
Q-ter® + Creatine (320 / 340 mg) vs PlaceboAdjusted 8-week difference – confounder: Peripheral Artery Disease
Fumagalli S,Clin Cardiol 2011
Cu
mu
lati
ve P
rop
ort
ion
Su
rviv
ing
Time (days)
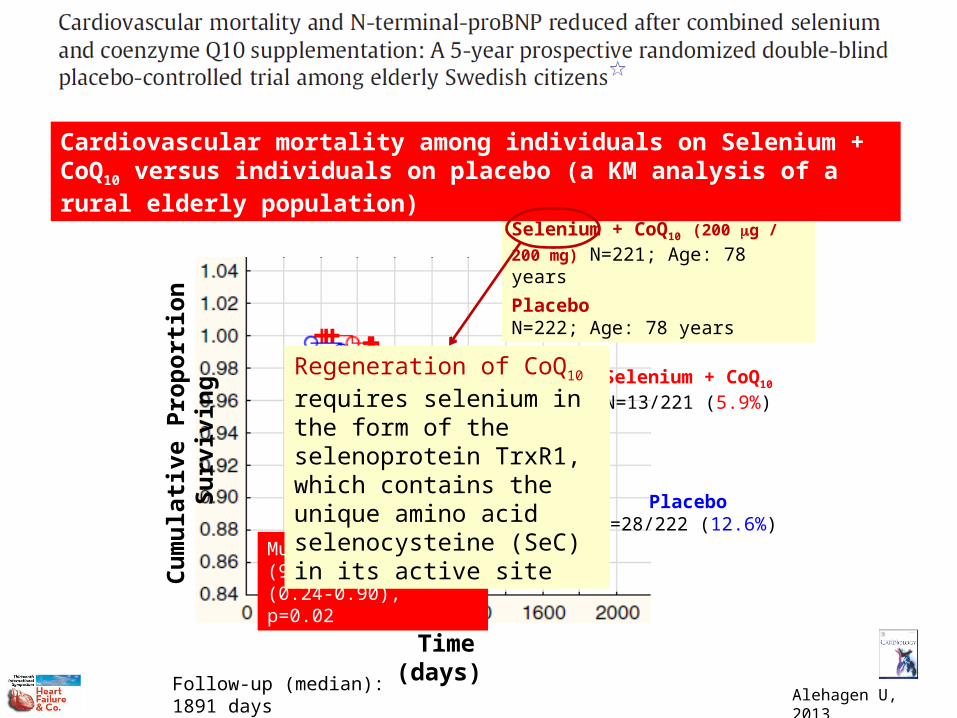
Selenium + CoQ10
N=13/221 (5.9%)
PlaceboN=28/222 (12.6%)
Multivariate HR (95%CI): 0.46 (0.24-0.90), p=0.02
Selenium + CoQ10 (200 mg / 200
mg) N=221; Age: 78 years
PlaceboN=222; Age: 78 years
Follow-up (median): 1891 days
Cardiovascular mortality among individuals on Selenium + CoQ10 versus individuals on placebo (a KM analysis of a rural elderly population)
Alehagen U, 2013
Regeneration of CoQ10 requires selenium in the form of the selenoprotein TrxR1, which contains the unique amino acid selenocysteine (SeC) in its active site
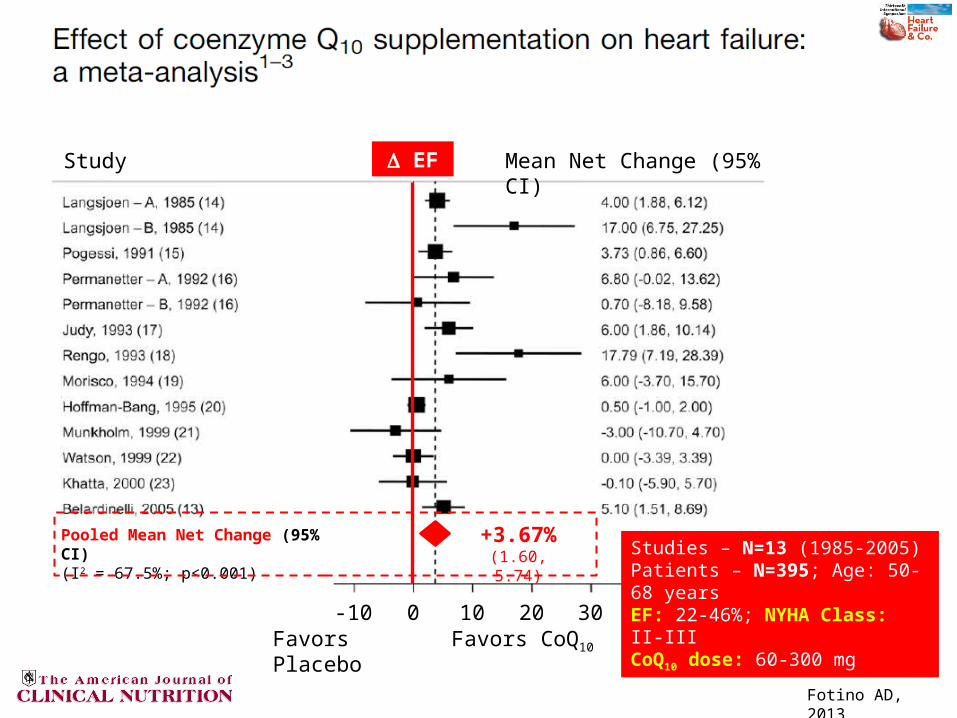
Study Mean Net Change (95% CI)
-10 300 10 20Favors Placebo Favors CoQ10
Pooled Mean Net Change (95% CI)(I2 = 67.5%; p<0.001)
+3.67%(1.60, 5.74)
D EF
Studies – N=13 (1985-2005)Patients – N=395; Age: 50-68 yearsEF: 22-46%; NYHA Class: II-IIICoQ10 dose: 60-300 mg
Fotino AD, 2013
baseline 8 weeks0
1500
2000
2500
3000
3500
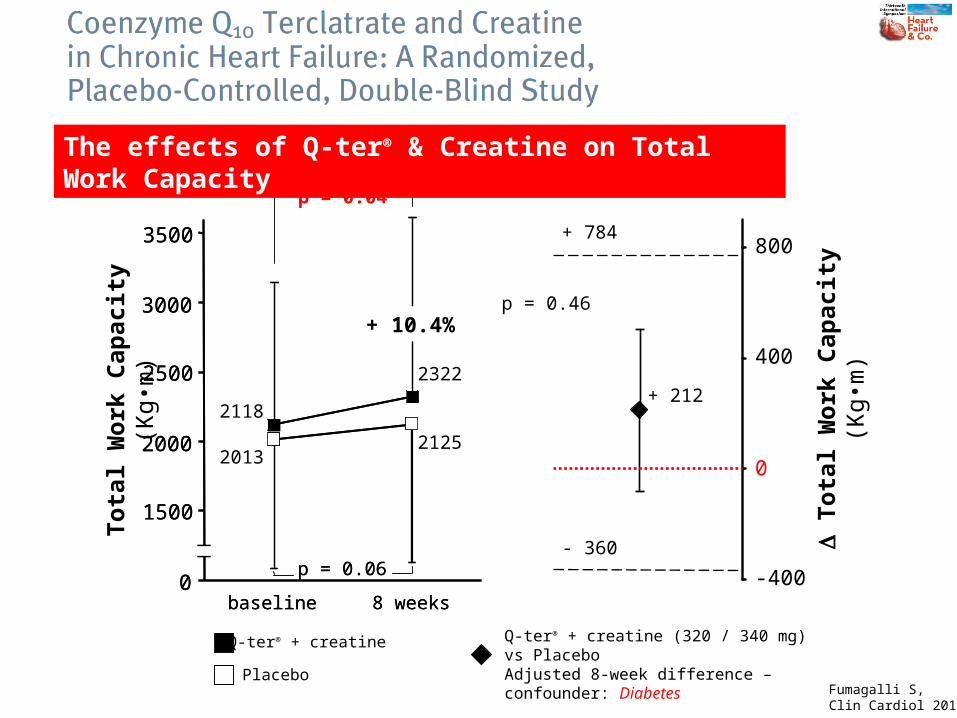
p = 0.06
baseline 8 weeks0
1500
2000
2500
3000
3500
p = 0.04
p = 0.06
Tota
l W
ork
Cap
acit
y (K
g•m
)
Q-ter® + creatine
Placebo
Q-ter® + creatine (320 / 340 mg) vs PlaceboAdjusted 8-week difference – confounder: Diabetes
0
400
800
-400
+ 784
- 360 D T
ota
l W
ork
Cap
acit
y (K
g•m
)
p = 0.46
+ 212
2013
2118
2125
2322
+ 10.4%
The effects of Q-ter® & Creatine on Total Work Capacity
Fumagalli S,Clin Cardiol 2011
L 40
L 40
L 80
P 40
P 20
P 40
P 40
S 80
S 20
S 20
S 40
S 20
S 20
S 20
S 20
S 05
S 20
S 20
S 20
A 10
A 20
A 80
A 40
A 10
-60
-50
-40
-30
-20
-10
0
-18.8-21.3
-28.8
-33.1
-51.2
-19.7
-45.8
-39.6
-50
-27.7-25.2
-31.2
-27.3-25.5
-19.4
-30.7
-22
-32
-12.4
-7.7
-48.5-50.8
-33.1
-42.9
D C
oenz
yme
Q10
con
cent
ratio
n (%
)
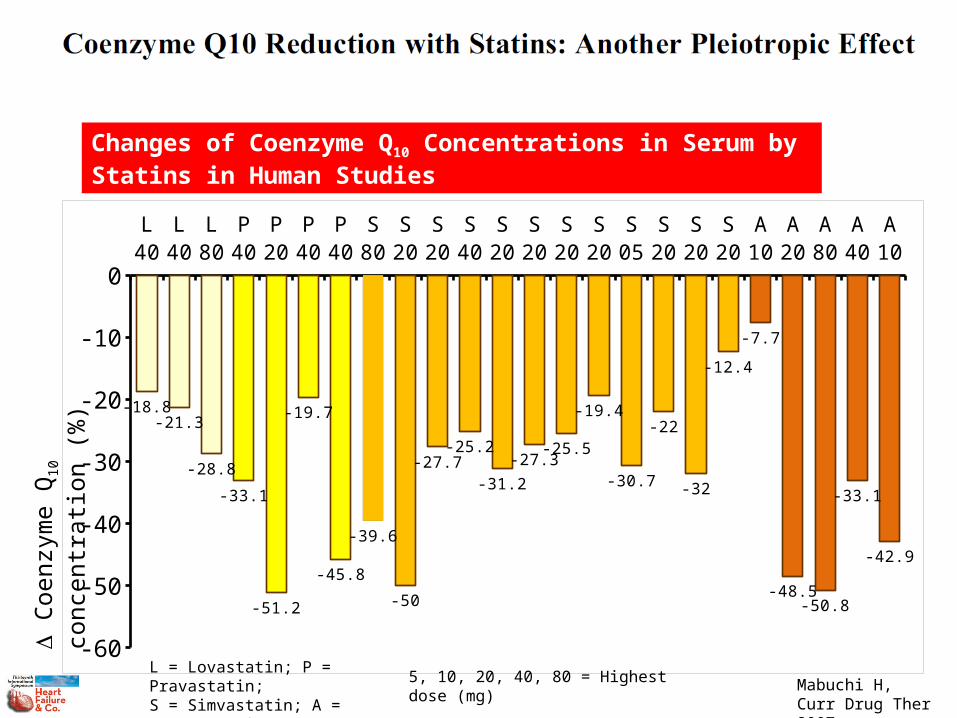
Changes of Coenzyme Q10 Concentrations in Serum by Statins in Human Studies
L = Lovastatin; P = Pravastatin;S = Simvastatin; A = Atorvastatin
5, 10, 20, 40, 80 = Highest dose (mg)
Mabuchi H,Curr Drug Ther 2007

B 3 m B 3 m B 3 m0
0.4
0.8
1.2
0.48
0.58
0.73 0.7
1.11
0.93
0.49
0.35
0.75
0.46
1.1
0.53
[Pla
sma
Coe
nzym
e Q
10 (m
g/m
L)]
NMC = -0.25 mg/mLP<0.0001
NMC = -0.27 mg/mLP<0.0001
NMC = -0.35 mg/mLP<0.0001
NMC = Net Median Change
Tertile 1 – CoQ10: 0.49 mg/mL(N = 400)
Tertile 2 – CoQ10: 0.74 mg/mL(N = 387)
Tertile 3 – CoQ10: 1.10 mg/mL(N = 404)
3 m = 3-Month Follow-up
Placebo
Rosuvastatin
Baseline and 3-Month Follow-up Values for Coenzyme Q10
McMurray JJV, JACC 2010
Ischemic HF (N=1191)Age: 73 years; EF: 29%

Prognostic Model for Testing Baseline Coenzyme Q10 as Risk Factor for Total Mortality
McMurray JJV, JACC 2010
HR P Value HR P Value
EF*100 0.96 <0.001 0.96 0.002
NYHA Class 1.99 <0.001 1.37 NS
Age / 10 years 1.57 0.003 1.75 <0.001
BMI, Kg/m2 0.97 NS 0.95 NS
Diabetes 1.34 NS 1.57 0.040
Female sex 0.76 NS 0.49 0.011
Intermittent Claudication 1.21 NS 1.10 NS
HR / 10 b / min 1.05 NS 1.09 NS
CoQ10, mg/mL 0.86 NS 0.55 0.039
Placebo RosuvastatinStep 1
-8
-6
-4
-2
0
2
4
6
8
Ch
an
ge
in %
FM
DC
han
ge
in F
MD
(%
)
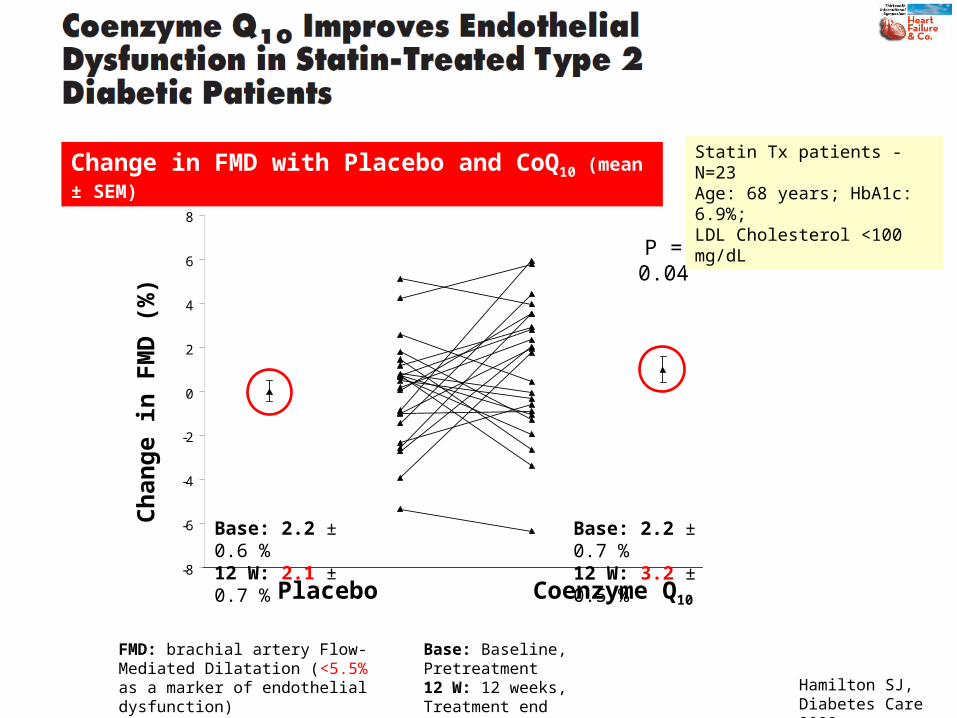
Placebo Coenzyme Q10
Base: 2.2 ± 0.6 %12 W: 2.1 ± 0.7 %
Base: 2.2 ± 0.7 %12 W: 3.2 ± 0.5 %
P = 0.04
FMD: brachial artery Flow-Mediated Dilatation (<5.5% as a marker of endothelial dysfunction)
Base: Baseline, Pretreatment12 W: 12 weeks, Treatment end
Change in FMD with Placebo and CoQ10 (mean ± SEM)Statin Tx patients - N=23Age: 68 years; HbA1c: 6.9%;LDL Cholesterol <100 mg/dL
Hamilton SJ,Diabetes Care 2009
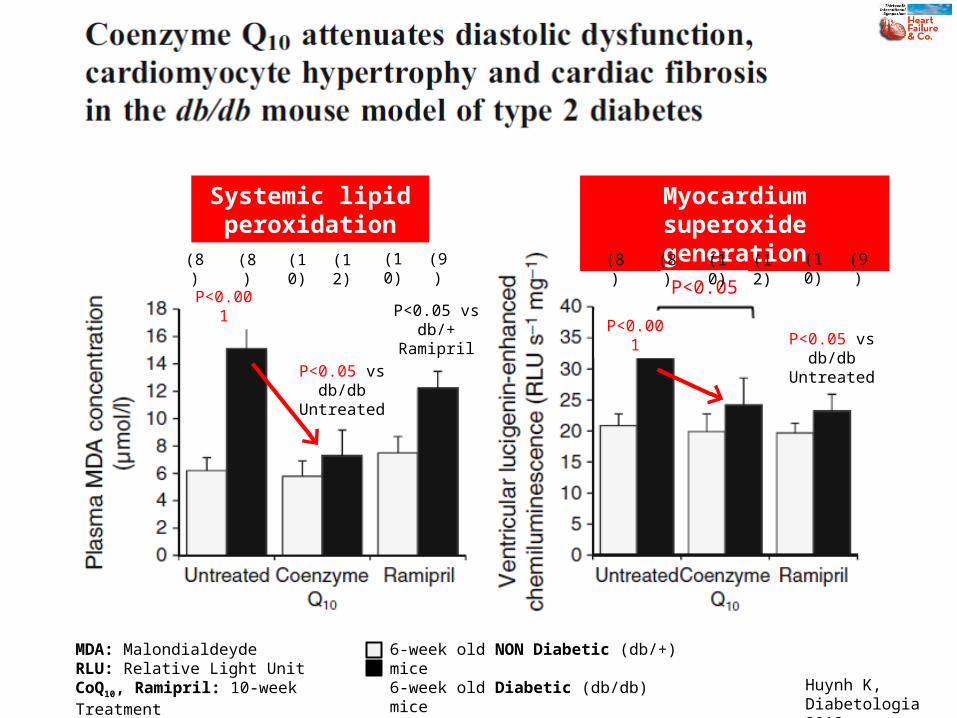
Systemic lipid peroxidation
Myocardium superoxide generation
P<0.05P<0.001
P<0.001P<0.05 vs
db/db UntreatedP<0.05 vs
db/db Untreated
P<0.05 vs db/+
Ramipril
MDA: MalondialdeydeRLU: Relative Light UnitCoQ10, Ramipril: 10-week Treatment
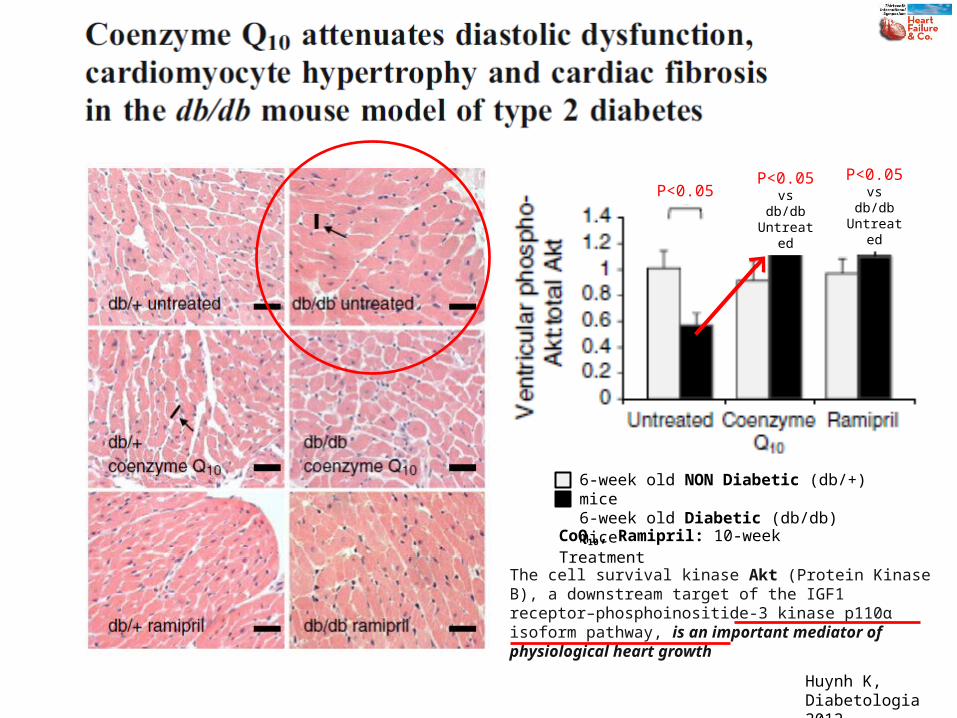
6-week old NON Diabetic (db/+) mice6-week old Diabetic (db/db) mice
Huynh K,Diabetologia 2012
(8) (8) (10) (12) (10) (9) (8) (8) (10) (12) (10) (9)
CoQ10, Ramipril: 10-week Treatment
6-week old NON Diabetic (db/+) mice6-week old Diabetic (db/db) mice
P<0.001
P<0.05 vs db/db
UntreatedP<0.05 vs db/db
Untreated
Huynh K,Diabetologia 2012

Cytosol
Mytochondrial outermembrane
Intermembrane space
Mytochondrial innermembrane
Matrix
COMPLEX: I II III IV V
Substrates: Malate, glutamate, pyruvate
Succinate Asc + TMPD
Coenzyme Q10
Asc: AscorbateTMPD: Tetramethyl-p-phenylenediamine
The Electron Transport Chain & the Electron Carrier Function of Q10
Larsen S, 2013
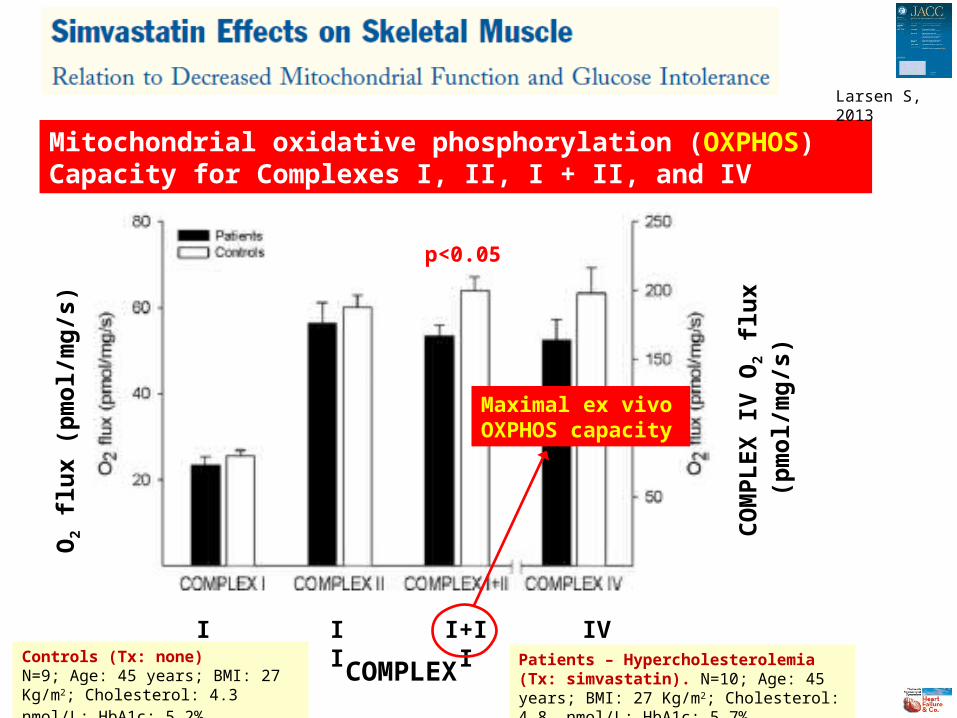
p<0.05
Maximal ex vivo OXPHOS capacity
Mitochondrial oxidative phosphorylation (OXPHOS) Capacity for Complexes I, II, I + II, and IV
Larsen S, 2013
O2
flu
x (p
mo
l/m
g/s
)
COMPLEX
I II I+II IV
CO
MP
LE
X I
V O
2 fl
ux
(pm
ol/
mg
/s)
Controls (Tx: none)N=9; Age: 45 years; BMI: 27 Kg/m2; Cholesterol: 4.3 nmol/L; HbA1c: 5.2%
Patients – Hypercholesterolemia (Tx: simvastatin). N=10; Age: 45 years; BMI: 27 Kg/m2; Cholesterol: 4.8 nmol/L; HbA1c: 5.7%
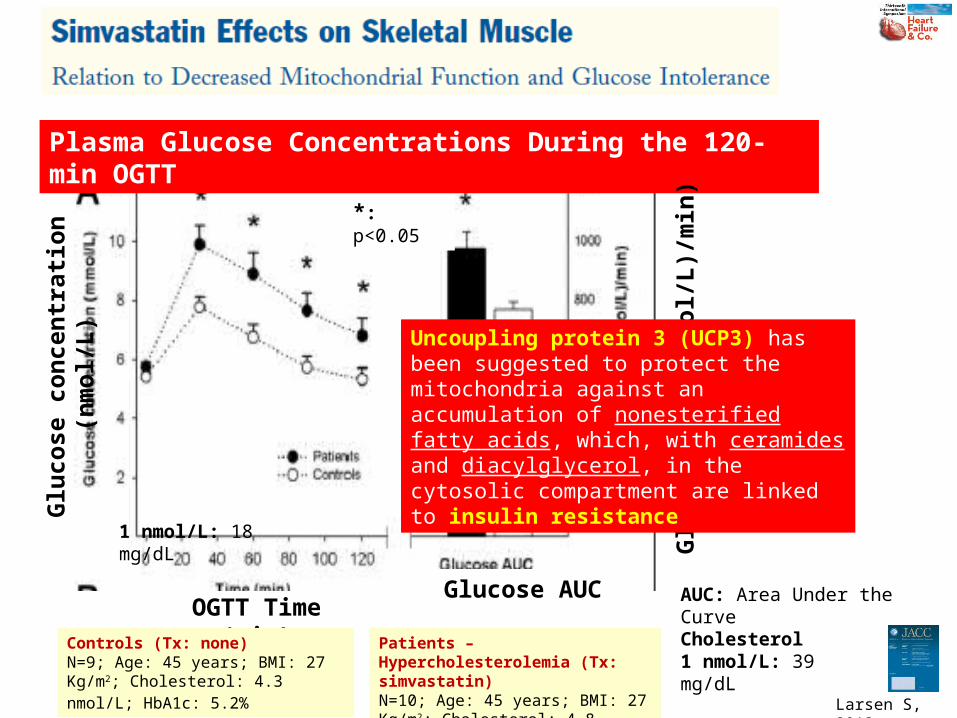
*: p<0.05
1 nmol/L: 18 mg/dL
AUC: Area Under the Curve
Plasma Glucose Concentrations During the 120-min OGTT
Larsen S, 2013
Glu
cose
co
nce
ntr
atio
n (
nm
ol/
L)
OGTT Time (min)Glucose AUC
Glu
cose
AU
C (
(nm
ol/
L)/
min
)
Controls (Tx: none)N=9; Age: 45 years; BMI: 27 Kg/m2; Cholesterol: 4.3 nmol/L; HbA1c: 5.2%
Cholesterol1 nmol/L: 39 mg/dL
Patients – Hypercholesterolemia (Tx: simvastatin)N=10; Age: 45 years; BMI: 27 Kg/m2; Cholesterol: 4.8 nmol/L; HbA1c: 5.7%
Uncoupling protein 3 (UCP3) has been suggested to protect the mitochondria against an accumulation of nonesterified fatty acids, which, with ceramides and diacylglycerol, in the cytosolic compartment are linked to insulin resistance

• All putative biomarkers should be examined as to whether they are simply associated with greater disease severity (“markers”) or, alternatively, play an important mechanistic role in the disease of interest (“mediators”)
• Coenzyme Q10 appears to be a marker, and generally only mediators make intuitive sense as targets for intervention
2010

HF has a multifactorial pathogenesis: peripheral circulatory insufficiency, autonomic imbalance, activation of RAAS, inflammation, oxidative stress, immune system activation, and insulin resistance are intertwined in a complex manner
The resulting metabolic abnormalities can be linked to long-term myocardial dysfunction
These metabolic processes have been shown to affect other organs (i.e. skeletal muscle, leading to fatigue and physical dysfunction)
Metabolic diseases such as anemia, diabetes mellitus, renal dysfunction, and cardiac cachexia greatly influence the prognosis of HF
Therefore, nutrition has recently been considered to be a new therapeutic target for HF Malnutrition, a lack of micronutrients, sodium restriction and fluid
management are considered to be critical factors in patients with HF, particularly the elderly or patients with severe HF
2013

Study Mean Net Change (95% CI)
-1.06 1.060
Favors CoQ10 Favors Placebo
Pooled Mean Net Change (95% CI)(I2 = 80.5%; p=NS)
-0.30(-0.66, 0.06)
D NYHA Class
Fotino AD, 2013
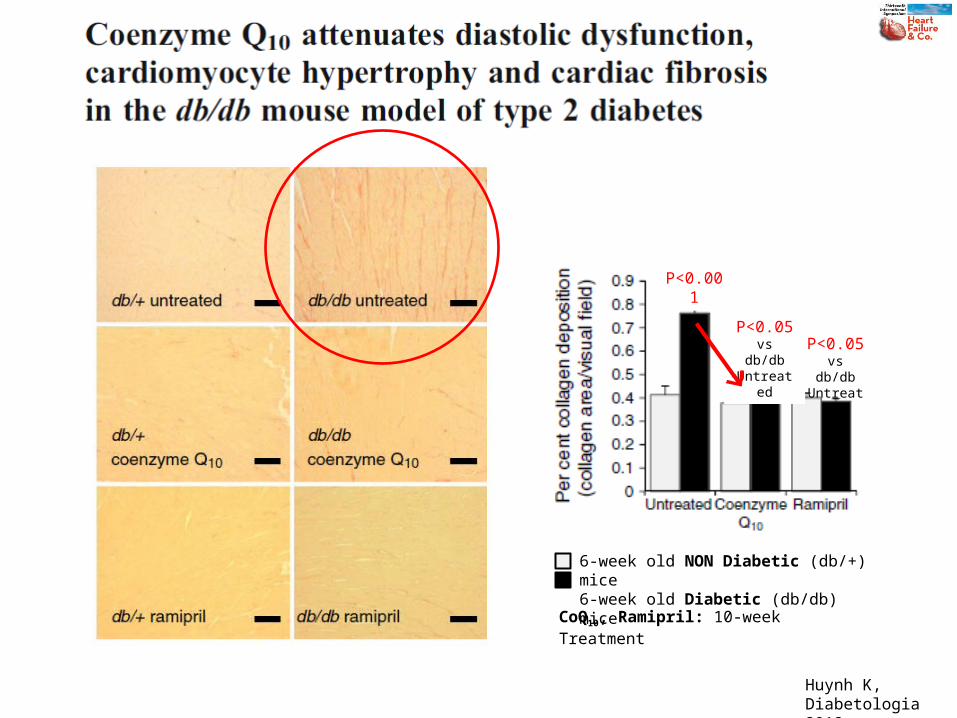
CoQ10, Ramipril: 10-week Treatment
6-week old NON Diabetic (db/+) mice6-week old Diabetic (db/db) mice
P<0.05P<0.05 vs db/db
Untreated
P<0.05 vs db/db
Untreated
Huynh K,Diabetologia 2012
The cell survival kinase Akt (Protein Kinase B), a downstream target of the IGF1 receptor–phosphoinositide-3 kinase p110α isoform pathway, is an important mediator of physiological heart growth
Recommended