NSRP Refinery and Petrochemical Complex Project Coarse QRA ‘Bidder 1’
Prepared for Foster Wheeler Energy Ltd
by ABS Consulting Ltd.
Report No. 2514054 R01 Issue 4
February 2011
Report No. 2514054 R01 Issue 4
Page 2 of 96
DOCUMENT APPROVAL SHEET
Project No: 2514054
Report No: 2514054 R01
Report Title: NSRP Refinery and Petrochemical Complex Project Coarse QRA ‘Bidder 1’
Client: Foster Wheeler Energy Ltd
Contact: Ken Smith
© ABS Consulting Limited
This document and any information or descriptive matter set out herein is subject to copyright and/or design right ownership.
All rights reserved. No part of this document, nor any information or descriptive matter within it, may be disclosed, loaned, reproduced, copied, photocopied, translated or reduced to any electronic medium or machine readable form or used for any purpose whatsoever without the written permission of the Company, except in accordance with established contract conditions pertaining to the production of this document
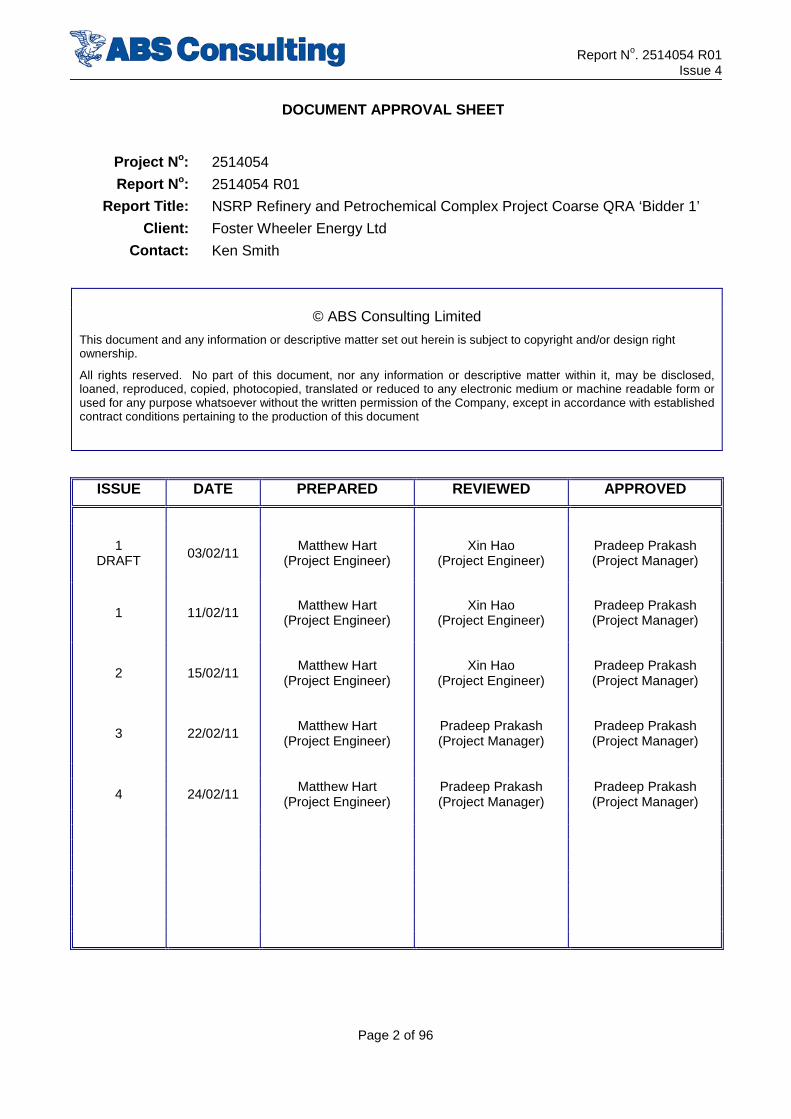
ISSUE DATE PREPARED REVIEWED APPROVED
1 DRAFT 03/02/11
Matthew Hart (Project Engineer)
Xin Hao (Project Engineer)
Pradeep Prakash (Project Manager)
1 11/02/11 Matthew Hart (Project Engineer)
Xin Hao (Project Engineer)
Pradeep Prakash (Project Manager)
2 15/02/11 Matthew Hart
(Project Engineer) Xin Hao
(Project Engineer) Pradeep Prakash (Project Manager)
3 22/02/11 Matthew Hart
(Project Engineer) Pradeep Prakash (Project Manager)
Pradeep Prakash (Project Manager)
4 24/02/11 Matthew Hart
(Project Engineer) Pradeep Prakash (Project Manager)
Pradeep Prakash (Project Manager)
Report No. 2514054 R01 Issue 4
Page 3 of 96
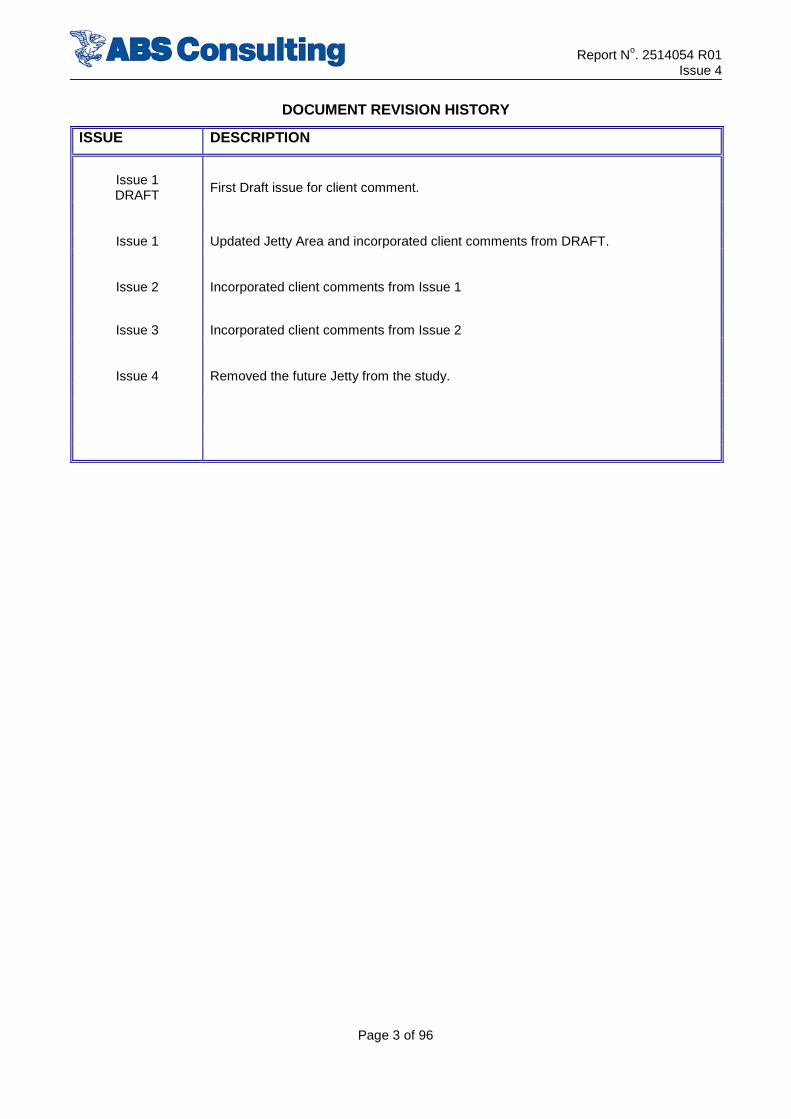
DOCUMENT REVISION HISTORY
ISSUE DESCRIPTION
Issue 1 DRAFT
First Draft issue for client comment.
Issue 1 Updated Jetty Area and incorporated client comments from DRAFT.
Issue 2
Incorporated client comments from Issue 1
Issue 3
Incorporated client comments from Issue 2
Issue 4
Removed the future Jetty from the study.
Report No. 2514054 R01 Issue 4
Page 4 of 96
EXECUTIVE SUMMARY
ABS Consulting Ltd (ABSC) preformed a quantitative risk assessment QRA for the proposed NSRP refinery in Nghi Son, Vietnam for the FEED stage of the project for Foster Wheeler Energy Ltd (FWEL). The results of the study [14], in addition to the site buildings risks, were used to check the risks to the nearby villages and the adjacent road users. Based on those risks appropriate actions were recommended.
Following on from previous work, the Client has now solicited definitive design proposals from various bidders. This study has assessed the risks to the site buildings for the new proposed layout from ‘Bidder 1’ by updating the previous study [14]. All the previous assumptions remain the same.
The three stage process for BRA is aimed at providing a structured risk assessment such that the complexity of assessment is commensurate with the magnitude of the problem. Stage 1 is the occupancy filtering step. At this stage, buildings which are not occupied or are not significant for the safety of the operation are eliminated from the assessment. For stage II, worst credible consequences are simulated and the buildings which are unaffected by the modelled hazards or for which simple mitigations can be designed are eliminated. All the buildings which are occupied or functionally significant AND are affected by the postulated hazards are then taken to Stage III risk assessment process where not only the magnitude of the hazard but the frequency is taken into account to calculate the risks to building occupants. Where risks are higher than the accepted criteria, mitigations are considered to lower the risks to acceptable levels.
Of the on site buildings, 48 were assessed in the Stage 1 preliminary building screening as being “At Risk”, due to their occupancy and functionality requirements.
The building risk assessment concluded that all occupied buildings at this site are shown to have negligible Individual Risk (IR) due to explosion and fire.
Detailed recommendations for the mitigations for each building considered within the assessment in Section 7.2 and are based on industry general practice. This risk assessment does not account to any mitigation that may already be in place such as local deluge or passive fire protection on vessels. In addition to the risk mitigations outlined, due attention should be paid to ensuring that a robust escape and evacuation plan is in place within the overall emergency preparedness for the site.
The public risk was analysed on a societal risk perspective by the use of an F-N curve. Societal risk is a measure of the collective risk to which a certain population is subjected as a whole. It is usually depicted in form of a so-called FN curve, which shows the frequency (F), that a given number, N people or more (hence N+) will be exposed to lethal consequences.
Based on the results of the study, it can be seen that there is the potential for thermal heat radiation to impact the adjacent road. Fire risk (BLEVE) is predicted to affect the neighboring villages. By inspecting the F-N curves presented previously, it can be seen that the risks to the villagers at the east side are unacceptable.
Detailed recommendations for the mitigations for each building considered within the assessment in Section 8 and are based on industry general practice. This risk assessment does not account to any mitigation that may already be in place such as local deluge or passive fire protection on vessels. In addition to the risk mitigations outlined, due attention should be paid to ensuring that a robust escape and evacuation plan is in place within the overall emergency preparedness for the site.
Report No. 2514054 R01 Issue 4
Page 5 of 96
It is recommended that relocation of the villages should be considered as one of the mitigation options. The risks to the adjacent road, south of the plant, should be mitigated by the use of a 500m barrier, and if possible traffic control measures.
It should be noted that this QRA presents the hydrocarbon releases risk results only; occupational risk, non-hydrocarbon events (e.g. dropped objects etc), external events (e.g. structural failure due to extreme weather, fatigue etc), structural events (e.g. structural failures, etc), and Transportation accidents are excluded from the scope of this study. It is assumed that the plant and buildings at the site will be designed to withstand the appropriate seismic loading such that the hydrocarbon release frequencies are unaffected. In cases where the plant design takes seismic risk into account, it is usual practice to ignore the seismic considerations from the QRA.
Report No. 2514054 R01 Issue 4
Page 6 of 96
LIST OF ACRONYMS
ABSC ABS Consulting Ltd
ACPH Air Changes per Hour
ALARP As Low As Reasonably Practicable
ARU Amine Regeneration Unit
BLEVE Boiling Liquid Expanding Vapour Explosion
BRA Building Risk Assessment
CAM Congested area Assessment Methodology
CDU Crude Distillation Unit
CMU Concrete Masonry Units
DOM Design, Operation, Maintenance
ERPG Emergency Response Planning Guidelines
ESD Emergency Shutdown
FEED Front End Engineering and Design
FWEL Foster Wheeler Energy Limited
GOHDS Gas Oil Hydrodesulphuriser Unit
HAZID Hazard Identification
HCDS Hydrogen Compression and Distribution System
HMU Hydrogen Manufacturing Unit
HVAC Heating, Ventilation and Air Conditioning
IR Individual Risk (or Incident Radiation)
IRPA Individual Risk Per Annum
InAlk Indirect Alkylation Units
KEC Kuwait Export Crude
KHDS Kerosene Hydrodesulphuriser Unit
LC Lethal Concentration
LFL Lower Flammable Limit
LPG Liquefied Petroleum Gas
LSIR Location Specific Individual Risk
NAC Naphtha and Aromatics Complex
NSRP Nghi Son Refinery and Petrochemical
PHA Preliminary Hazard Analysis
P&ID Piping and Instrumentation Diagram
PFD Process Flow Diagram
Report No. 2514054 R01 Issue 4
Page 7 of 96
PPU Polypropylene Unit
PRU Propylene Recovery Unit
QRA Quantitative Risk Assessment
RHDS Residue Hydrodesulphuriser Unit
RFCC Residue Fluid Catalytic Cracker Unit
R2P2 Reducing risks, protecting people
SHU Selective Hydrogenation
SRU Sulphur Recovery Unit
SWS Sour Water Stripper Units
TGT Tail Gas Treating
UPS Uninterrupted Power Supply
SCEs Safety Critical Elements
ppm parts per million
VCE Vapour Cloud Explosion
Report No. 2514054 R01 Issue 4
Page 8 of 96
CONTENTS
Page
Document Approval .............................................................................................................. 2 Revision Record ................................................................................................................... 3 Summary .............................................................................................................................. 4 List of Acronyms ................................................................................................................... 6 Contents ............................................................................................................................... 7 List of Tables ........................................................................................................................ 9 List of Figures ..................................................................................................................... 10 List of Appendices ............................................................................................................... 11
1 INTRODUCTION .........................................................................................................12
2 GENERAL METHODOLOGY .....................................................................................13
3 DESCRIPTION OF FACILITY .....................................................................................14
3.1 Plant Description ..................................................................................................................................................... 14 3.1.1 Process Units ................................................................................................................................................... 15 3.1.2 Buildings .......................................................................................................................................................... 16
4 STAGE 1 ASSESSMENT ...........................................................................................19
4.1 Screening Criterion ................................................................................................................................................. 19 4.1.1 Occupancy Screening ...................................................................................................................................... 19 4.1.2 Functionality Screening ................................................................................................................................... 19
4.2 Stage One Results .................................................................................................................................................... 19
5 STAGE 2 ASSESSMENT (CONSEQUENCE ANALYSES) .......................................26
5.1 Explosion Analyses .................................................................................................................................................. 26 5.1.1 Credible Explosion Hazards ............................................................................................................................ 26
5.1.2 CAM Assessment ............................................................................................................................................ 26 5.1.3 Review of Hazard Consequences..................................................................................................................... 26
5.2 Fire Analysis ............................................................................................................................................................ 32 5.2.1 Credible Fire Hazards ...................................................................................................................................... 32 5.2.2 Boiling Liquid Expanding Vapour Explosion (BLEVE) Hazards ................................................................... 35
5.3 Toxic Analysis .......................................................................................................................................................... 39 5.3.1 Credible Toxic Hazards ................................................................................................................................... 39 5.3.2 Review of Hazard Consequences..................................................................................................................... 40
5.4 Stage II Screening ................................................................................................................................................... 43
6 STAGE 3 ASSESSMENT (RISK ANALYSIS) ............................................................43
6.1 Model Development................................................................................................................................................. 43
Report No. 2514054 R01 Issue 4
Page 9 of 96
6.2 SHEPHERD Parameters ........................................................................................................................................ 46 6.2.1 Equipment Count and Leak Frequencies ......................................................................................................... 46
6.2.2 Design, Operation & Maintenance Factors ...................................................................................................... 47
6.2.3 Probability of Emergency Shutdown ............................................................................................................... 47
6.2.4 Building Performance ...................................................................................................................................... 47
6.3 Fire & Toxic Hazard Modelling ............................................................................................................................. 50 6.3.1 Fatality Probabilities ........................................................................................................................................ 50 6.3.2 Ignition Probabilities ....................................................................................................................................... 50 6.3.3 Building Protection Features ........................................................................................................................... 51
6.3.4 Fire Resistance of Buildings ............................................................................................................................ 52
6.3.5 Boiling Liquid Expanding Vapour Explosion (BLEVE) Scenario .................................................................. 53
6.4 Risk Acceptance Criteria ........................................................................................................................................ 53 6.4.1 Individual Risks ............................................................................................................................................... 53
6.5 Evaluation of Building Risks .................................................................................................................................. 55 6.5.1 Explosion Risks ............................................................................................................................................... 55 6.5.2 Fire Risk .......................................................................................................................................................... 70
7 RISK ASSESSMENT ..................................................................................................79
7.1 On Site Risk ............................................................................................................................................................. 79
7.2 Off-site Risk ............................................................................................................................................................. 85 7.2.1 Villages to the East of the site ......................................................................................................................... 85 7.2.2 Road to the South of the site ............................................................................................................................ 86
8 CONCLUSIONS & RECOMMENDATIONS ................................................................89
8.1 Buildings at the site ................................................................................................................................................. 89
8.2 Off-site Population .................................................................................................................................................. 93 8.2.1 Villages to the East of the site ......................................................................................................................... 93 8.2.2 Road to the South of the plant ......................................................................................................................... 94
9 UNCERTAINTY IN QRA .............................................................................................95
10 REFERENCES ............................................................................................................96
List of Tables
Table 1 – Stage 1 Assessment ........................................................................................................................................... 20
Table 2 - Maximum Credible Explosion Hazard ........................................................................................................... 27
Table 3 - Maximum Credible Fire Hazard ..................................................................................................................... 37
Table 4 – Toxic Gas (H2S) Dispersion modelling results for the 150mm hole size ..................................................... 40
Table 5 - Leak Frequencies used within the Process Blocks ......................................................................................... 46
Table 6 - Definition of Shell building types used in SHEPHERD ................................................................................. 47
Report No. 2514054 R01 Issue 4
Page 10 of 96
Table 7 -Vulnerability dependence on damage thresholds ............................................................................................ 49
Table 8 - Definition of damage categories ....................................................................................................................... 49
Table 9- Fatality Probabilities from Exposure to Fires and Toxins ............................................................................. 50
Table 10 – Immediate Ignition Probabilities .................................................................................................................. 51
Table 11 – Delayed Ignition Probabilities ....................................................................................................................... 51
Table 12 - Levels of Building Protection against Fire & Toxic Hazards ...................................................................... 52
Table 13 - Thermal Radiation Limits for Structures and Plant ................................................................................... 53
Table 14- Summary Explosion Damage for the 10-4/yr Hazard .................................................................................... 55
Table 15 – Frequency of 15kW/m2 at buildings ............................................................................................................. 76
Table 16 - Summary Occupancy Risk Values ................................................................................................................ 79
Table 17 – Overall Risk to Functionally Significant Buildings ..................................................................................... 81
Table 18 –Recommendations ........................................................................................................................................... 89
Table 19 – Recommendations Functional Significant Buildings .................................................................................. 91
Table 20 – Recommendations vulnerability ................................................................................................................... 94
List of Figures
Figure 1 - Proposed Location [Image taken from Google Earth] ................................................................................. 14
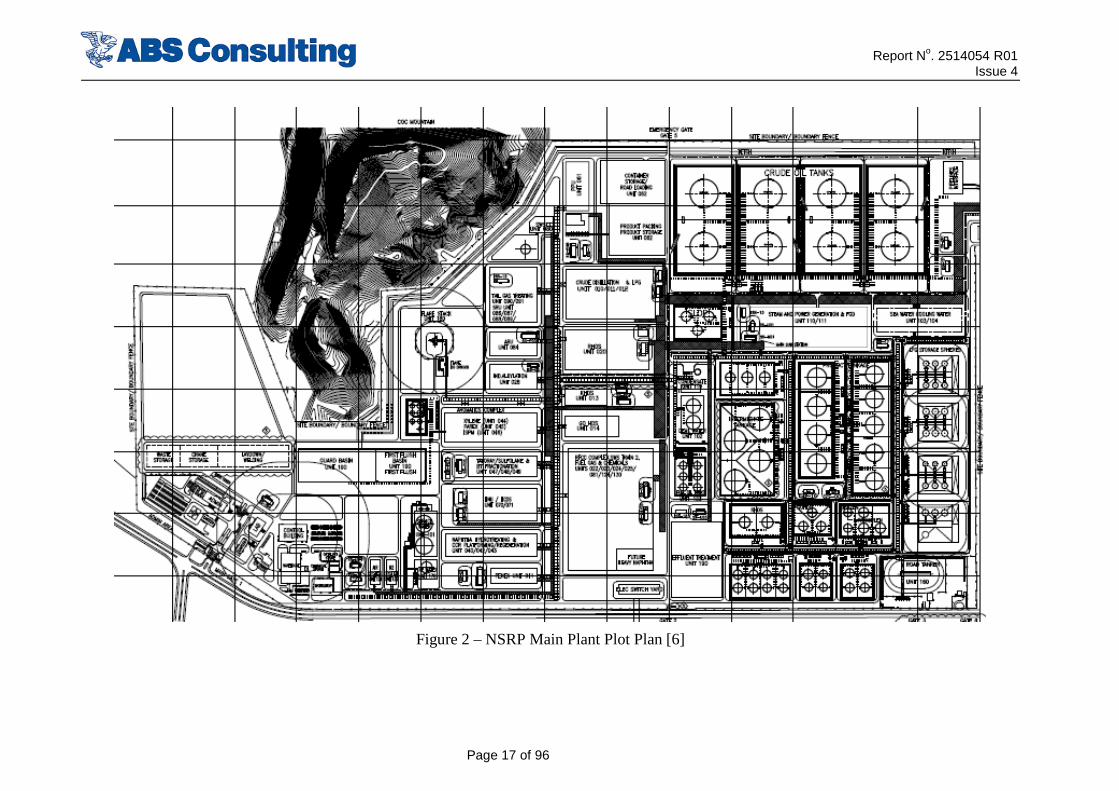
Figure 2 – NSRP Main Plant Plot Plan [6] ..................................................................................................................... 17
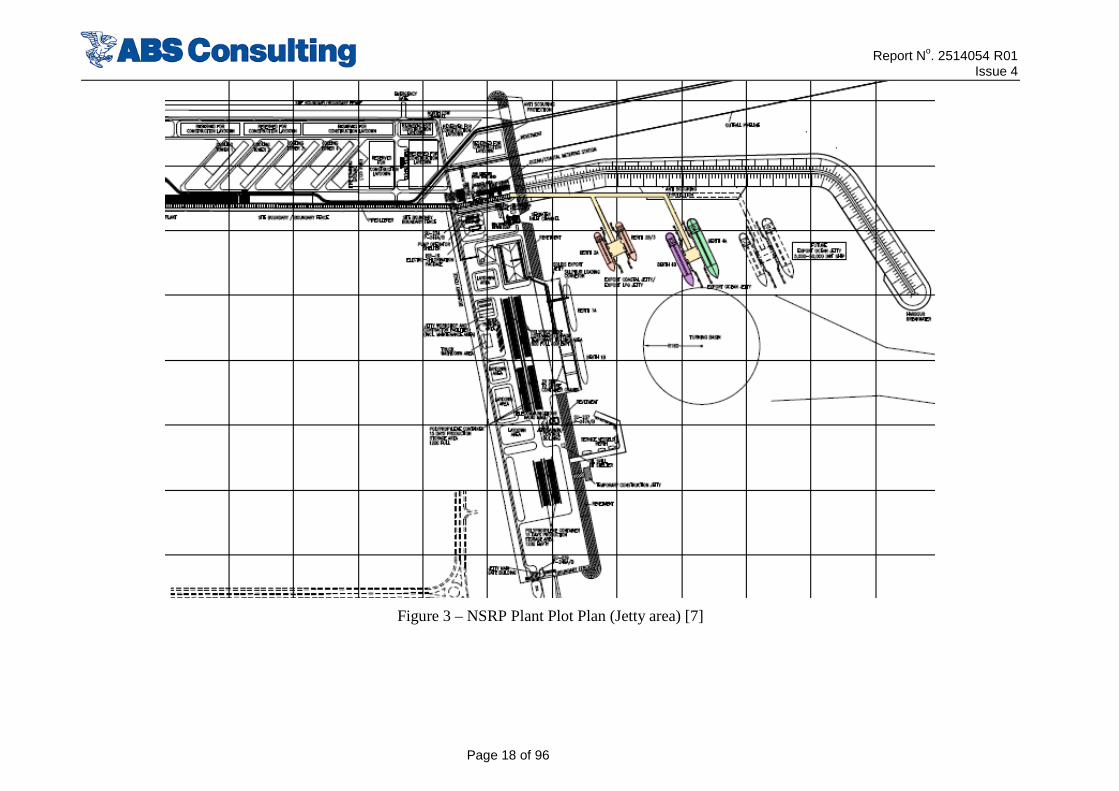
Figure 3 – NSRP Plant Plot Plan (Jetty area) [7] ........................................................................................................... 18
Figure 4 – 2nd Stage Buildings .......................................................................................................................................... 25
Figure 5 – Maximum Credible Overpressures Main Plant ........................................................................................... 30
Figure 6 – Maximum Credible Overpressures Jetty Area ............................................................................................ 31
Figure 7 – Maximum Potential Incident Radiation Flux Contours Main Plant.......................................................... 33
Figure 8 – Maximum Potential Incident Radiation Flux Contours Jetty Area ........................................................... 34
Figure 9 – BLEVE Fireballs Diameters .......................................................................................................................... 36
Figure 10 – ERPG Levels ................................................................................................................................................. 41
Figure 11 – ERPG Contours for the SRU ....................................................................................................................... 42
Figure 12 – SHEPHERD Model Main Plant .................................................................................................................. 44
Figure 13 – SHEPHERD model Jetty Area .................................................................................................................... 45
Figure 14 – Building vulnerability by type ..................................................................................................................... 48
Report No. 2514054 R01 Issue 4
Page 11 of 96
Figure 15 - Levels of Risk and ALARP ........................................................................................................................... 54
Figure 16 – Flammable Gas Frequency across the Main Plant .................................................................................... 58
Figure 17 – Flammable Gas Frequency across the Jetty Area ..................................................................................... 59
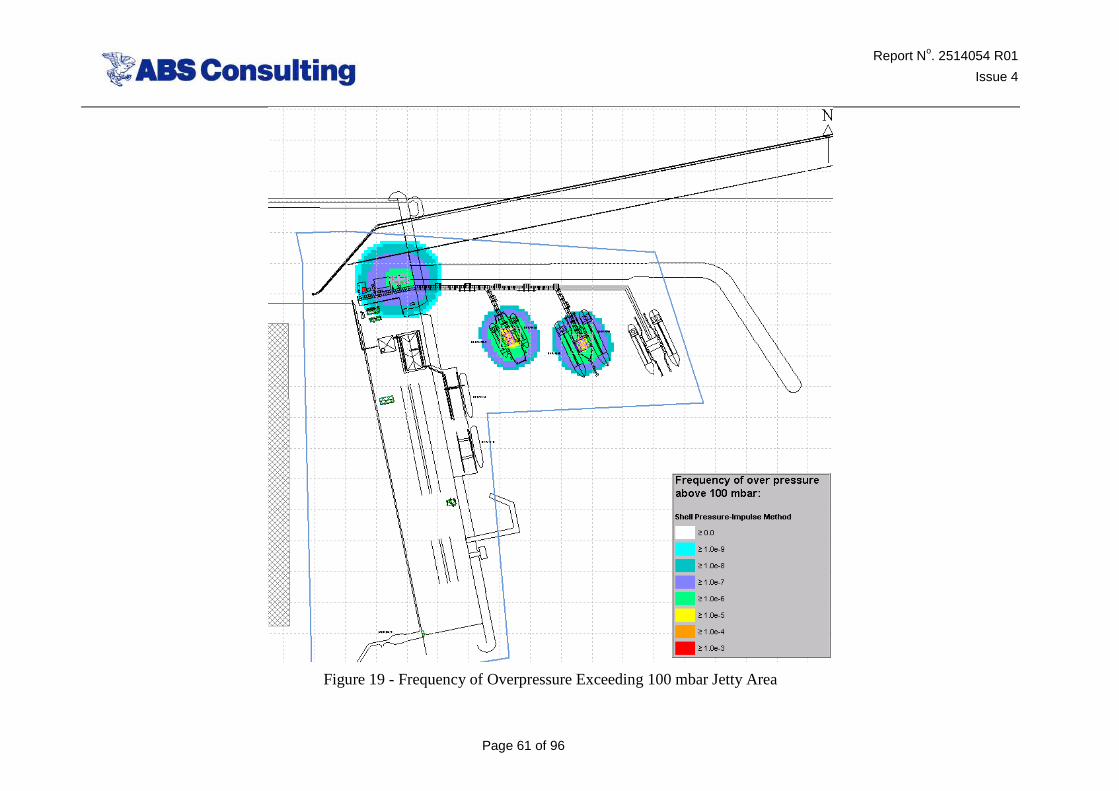
Figure 18 - Frequency of Overpressure Exceeding 100 mbar Main Plant .................................................................. 60
Figure 19 - Frequency of Overpressure Exceeding 100 mbar Jetty Area .................................................................... 61
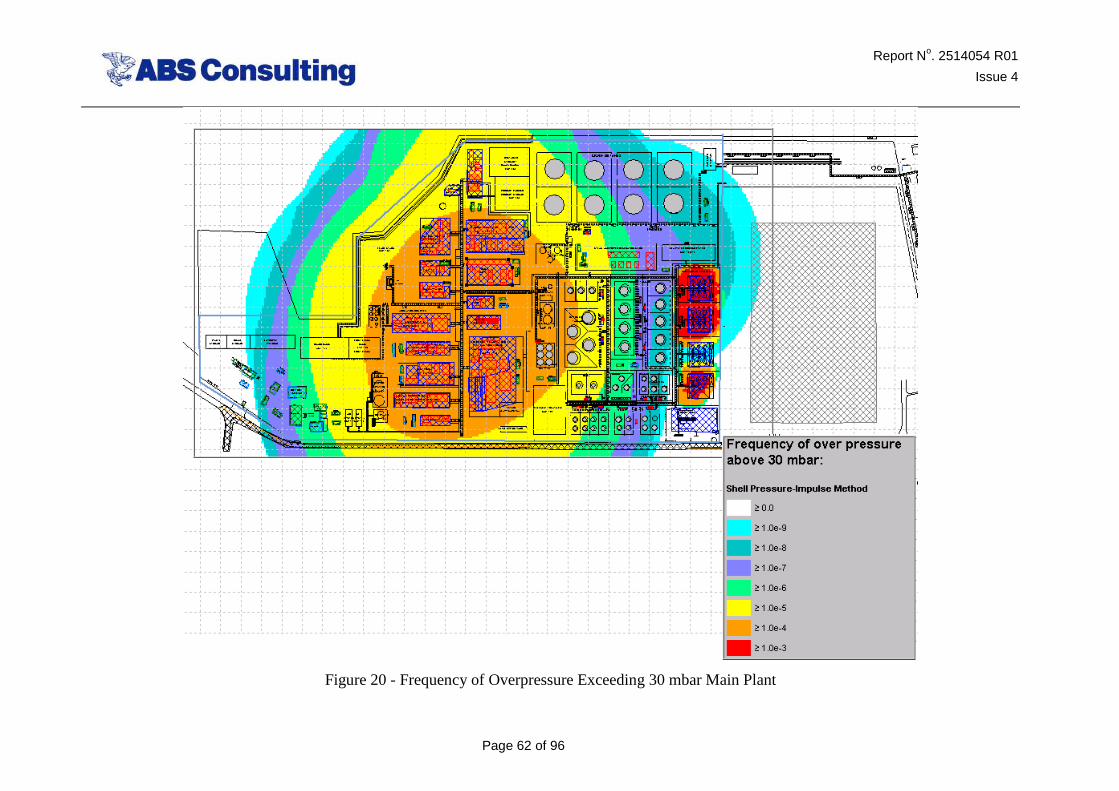
Figure 20 - Frequency of Overpressure Exceeding 30 mbar Main Plant .................................................................... 62
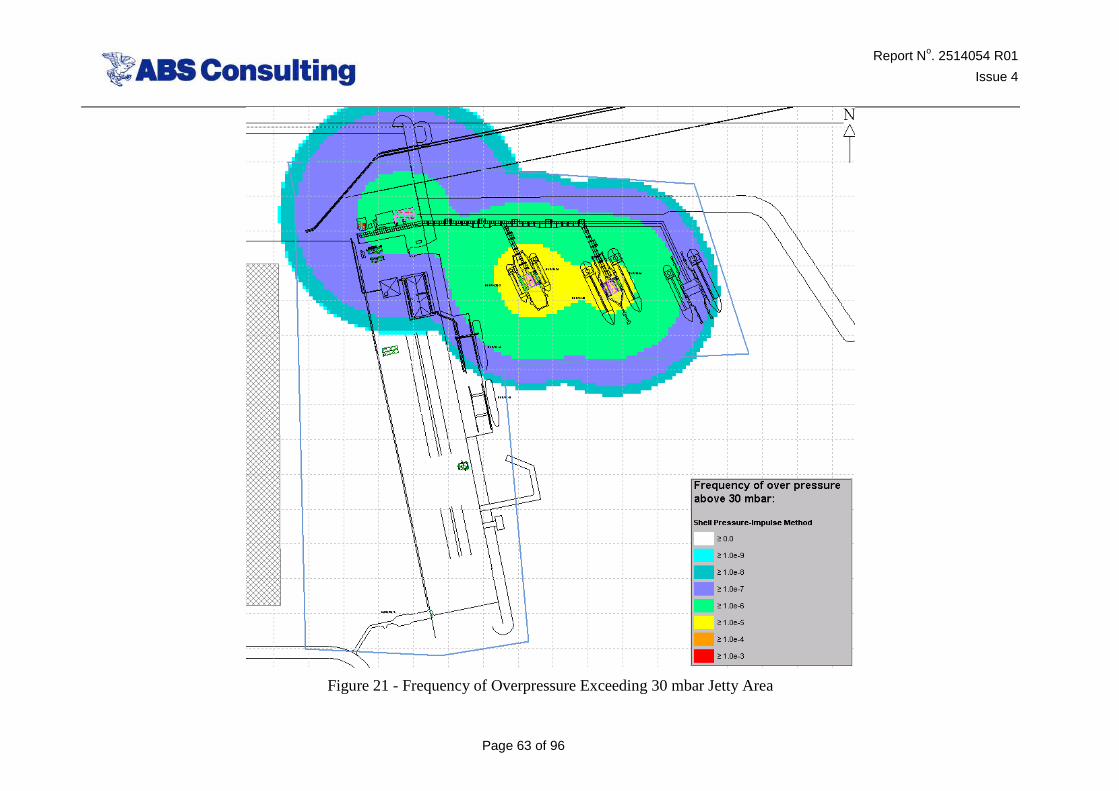
Figure 21 - Frequency of Overpressure Exceeding 30 mbar Jetty Area ...................................................................... 63
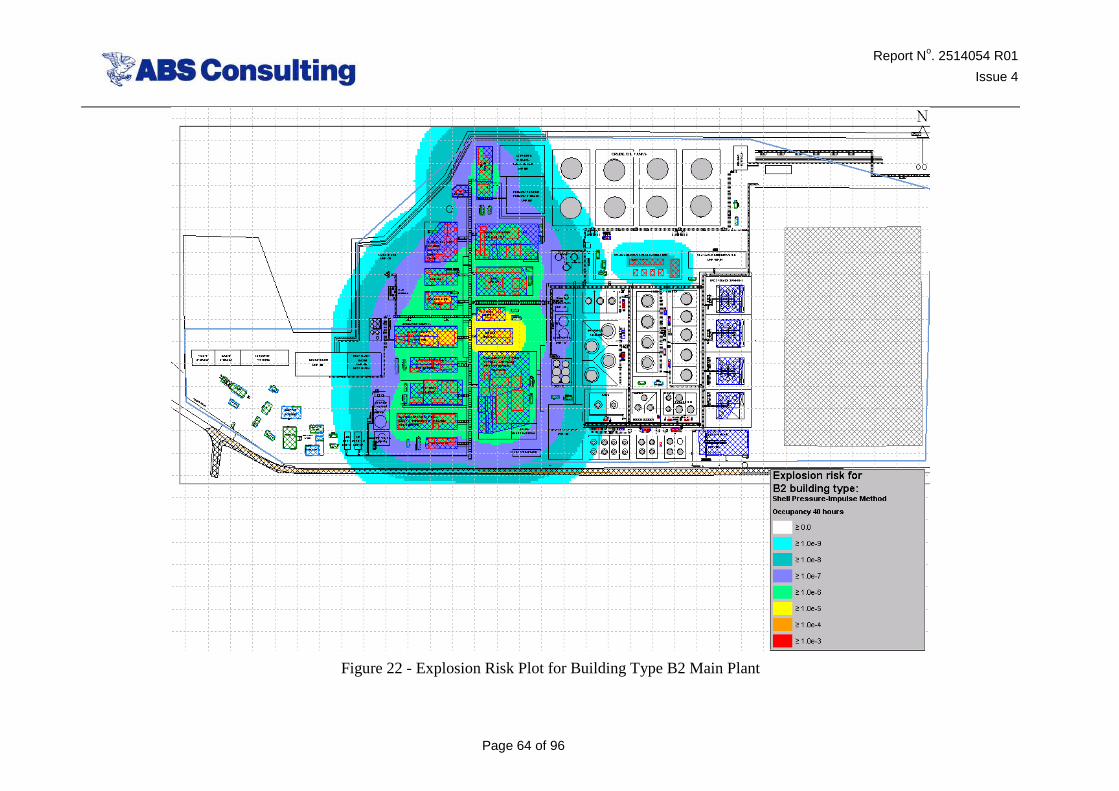
Figure 22 - Explosion Risk Plot for Building Type B2 Main Plant .............................................................................. 64
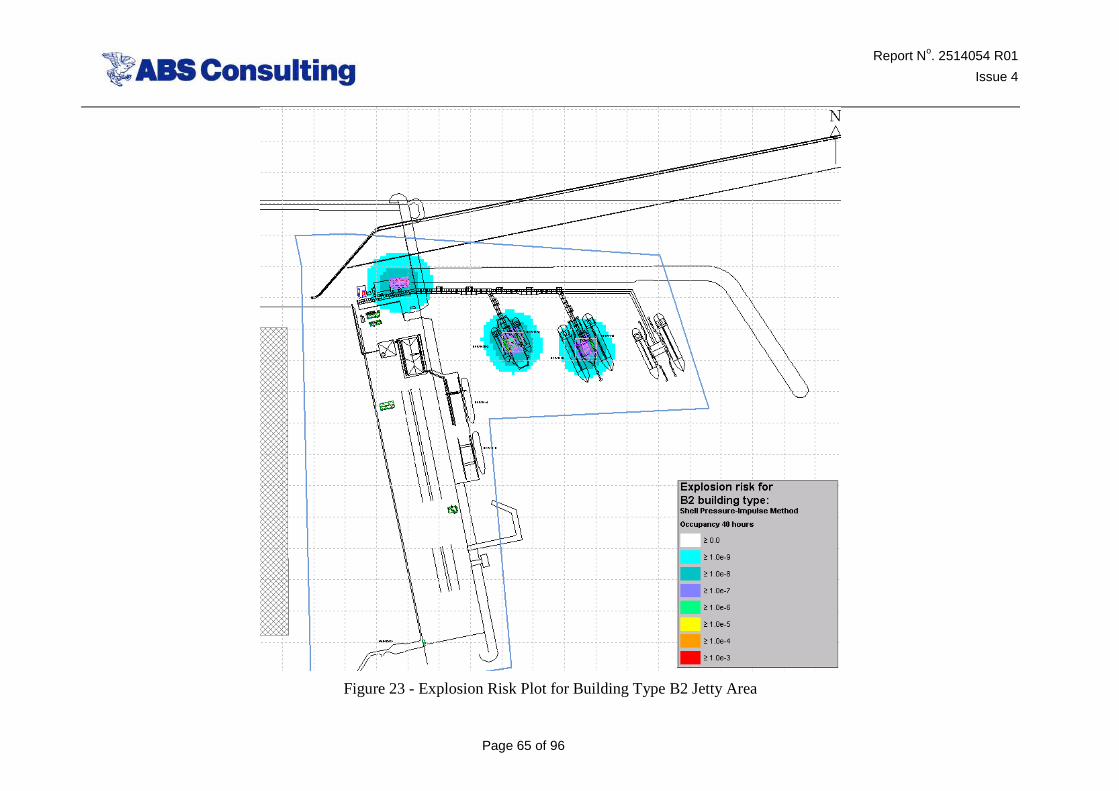
Figure 23 - Explosion Risk Plot for Building Type B2 Jetty Area ................................................................................ 65
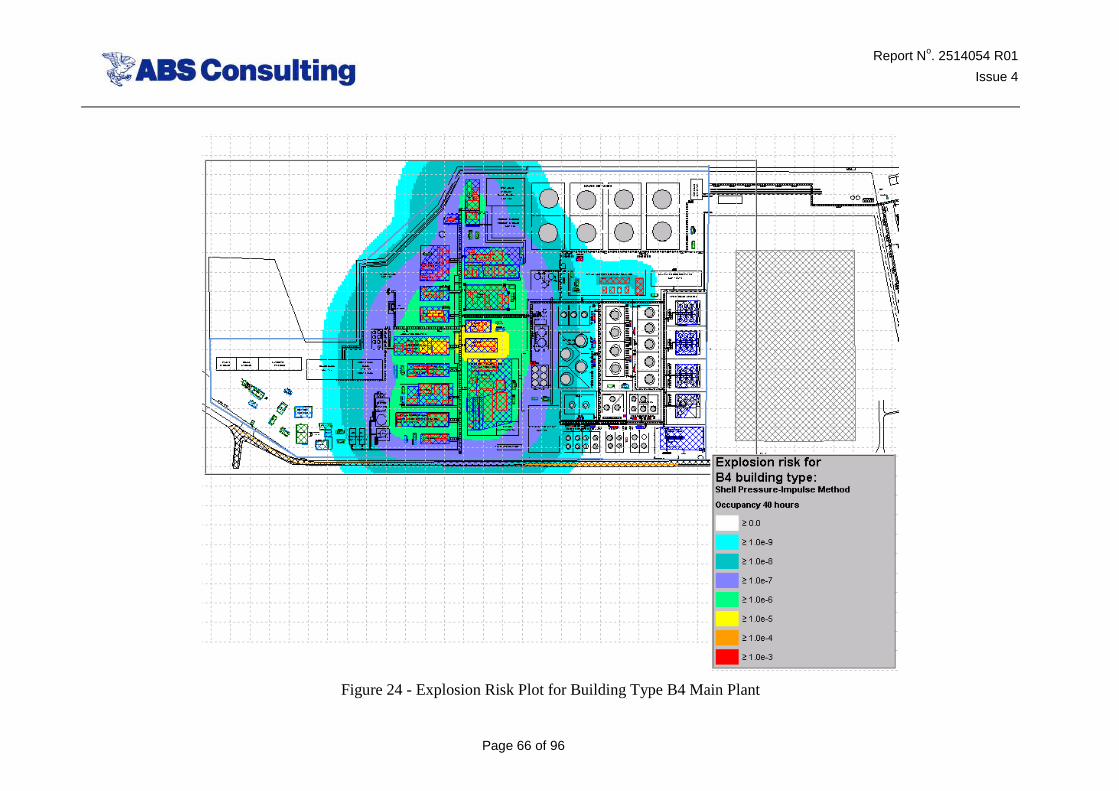
Figure 24 - Explosion Risk Plot for Building Type B4 Main Plant .............................................................................. 66
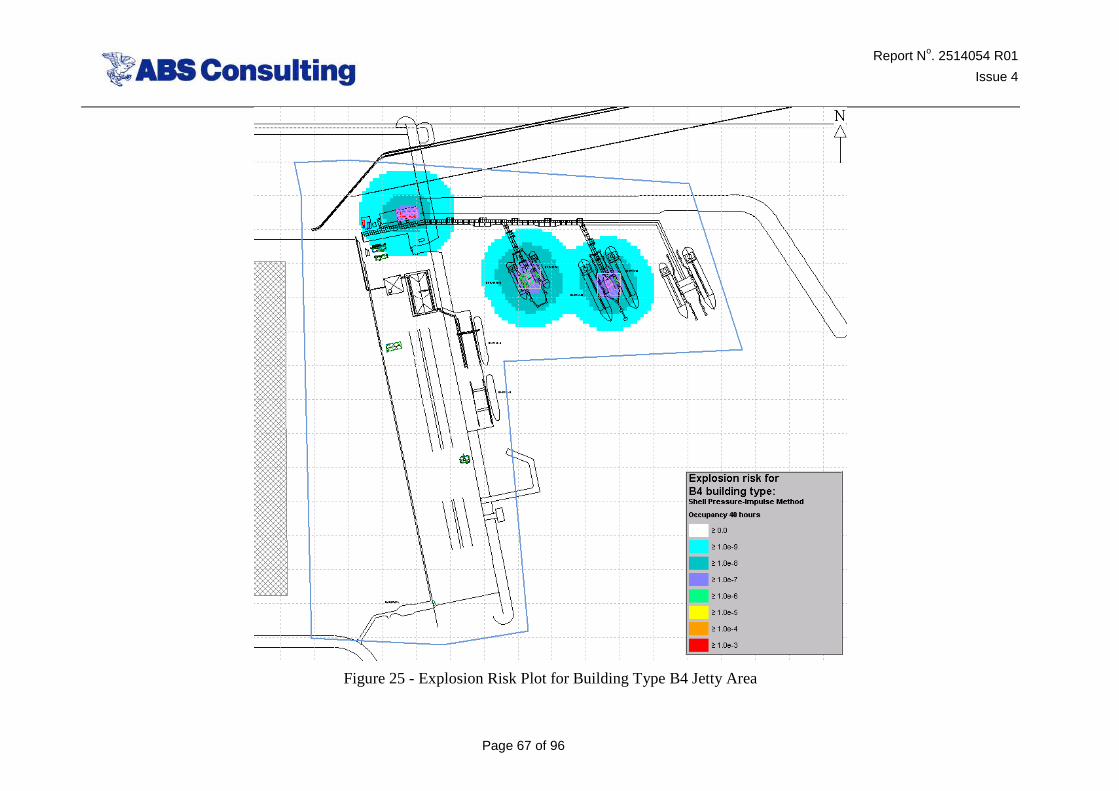
Figure 25 - Explosion Risk Plot for Building Type B4 Jetty Area ................................................................................ 67
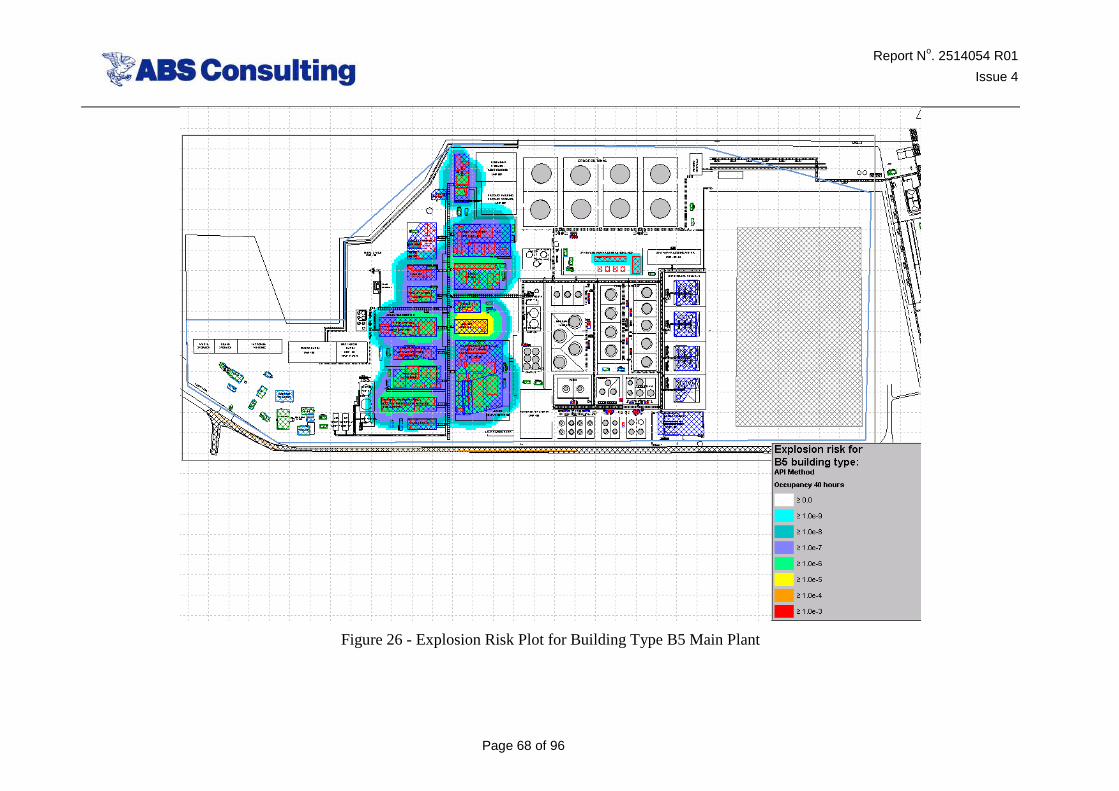
Figure 26 - Explosion Risk Plot for Building Type B5 Main Plant .............................................................................. 68
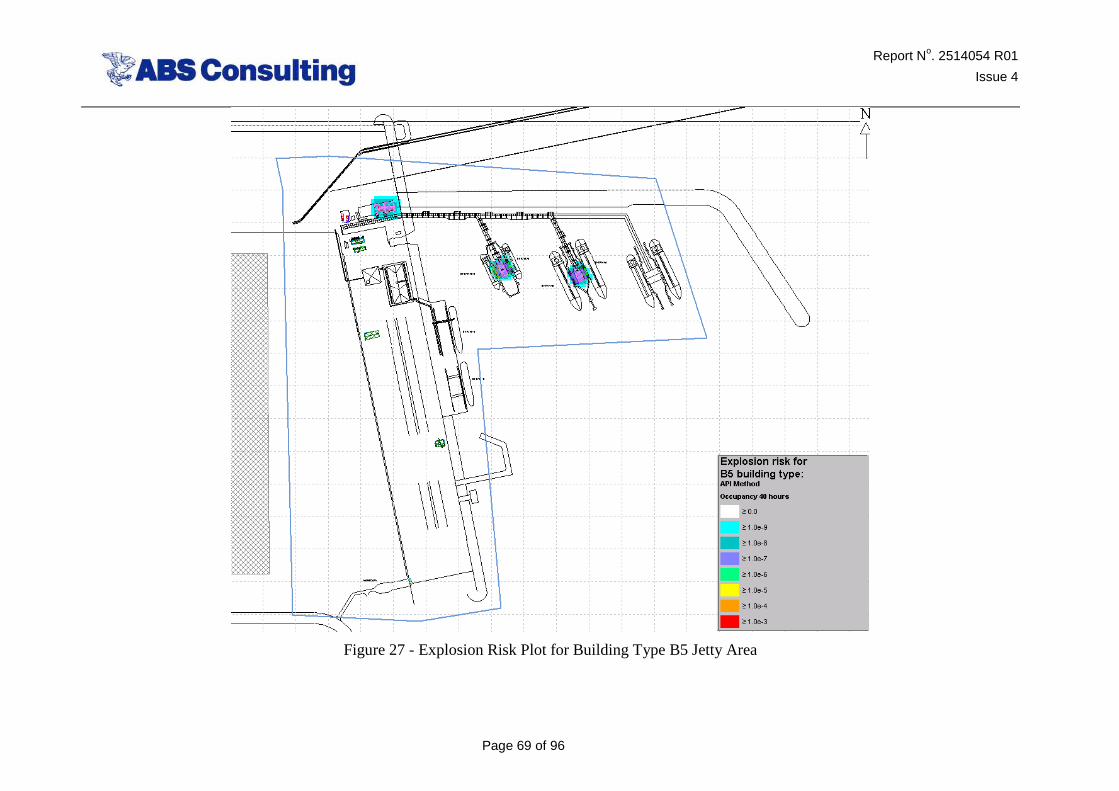
Figure 27 - Explosion Risk Plot for Building Type B5 Jetty Area ................................................................................ 69
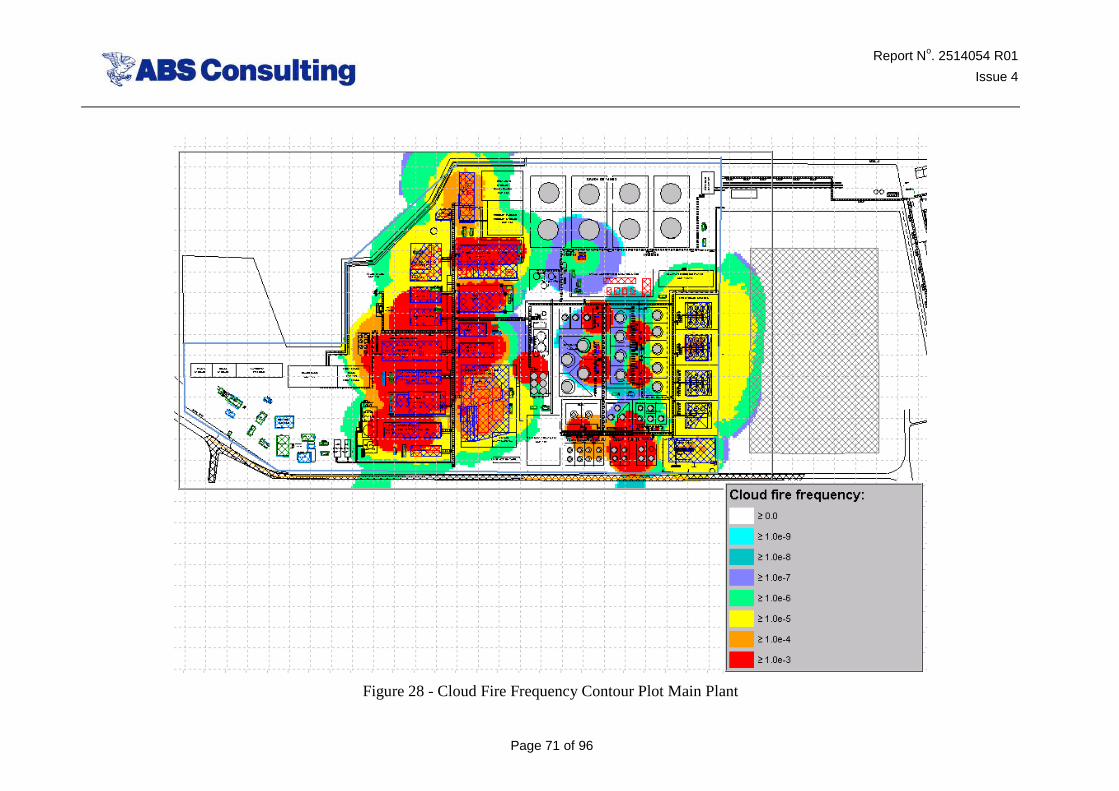
Figure 28 - Cloud Fire Frequency Contour Plot Main Plant ........................................................................................ 71
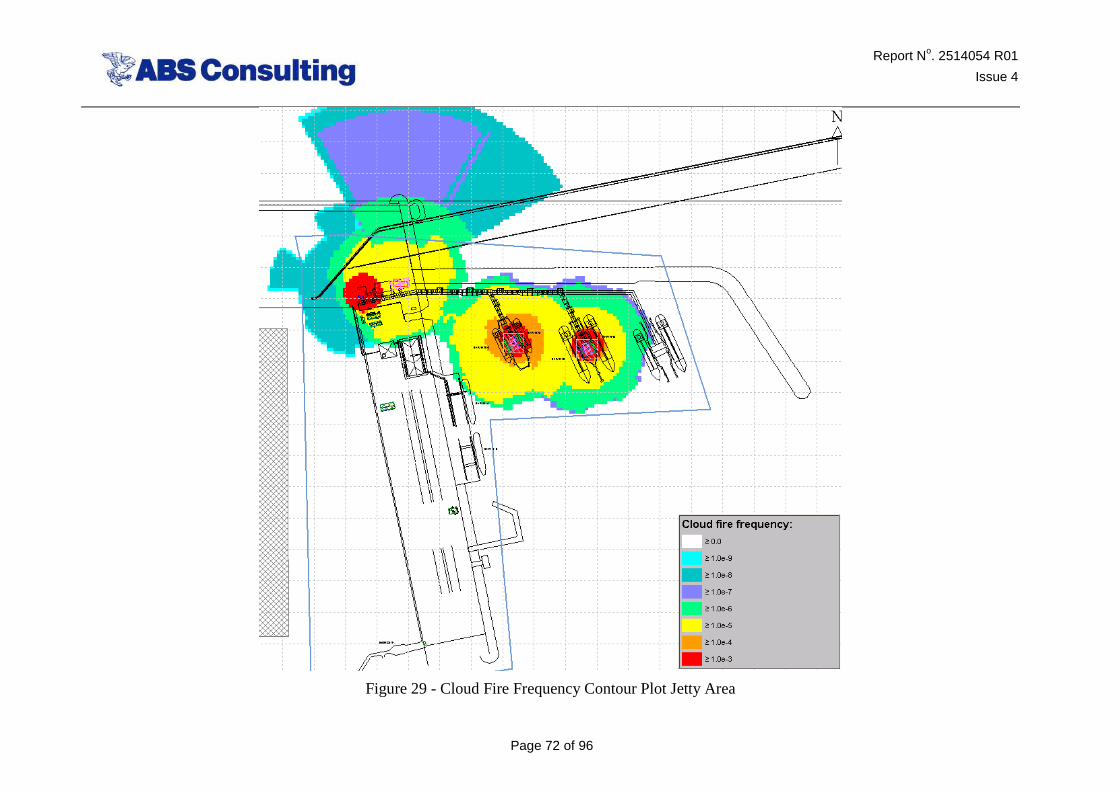
Figure 29 - Cloud Fire Frequency Contour Plot Jetty Area ......................................................................................... 72
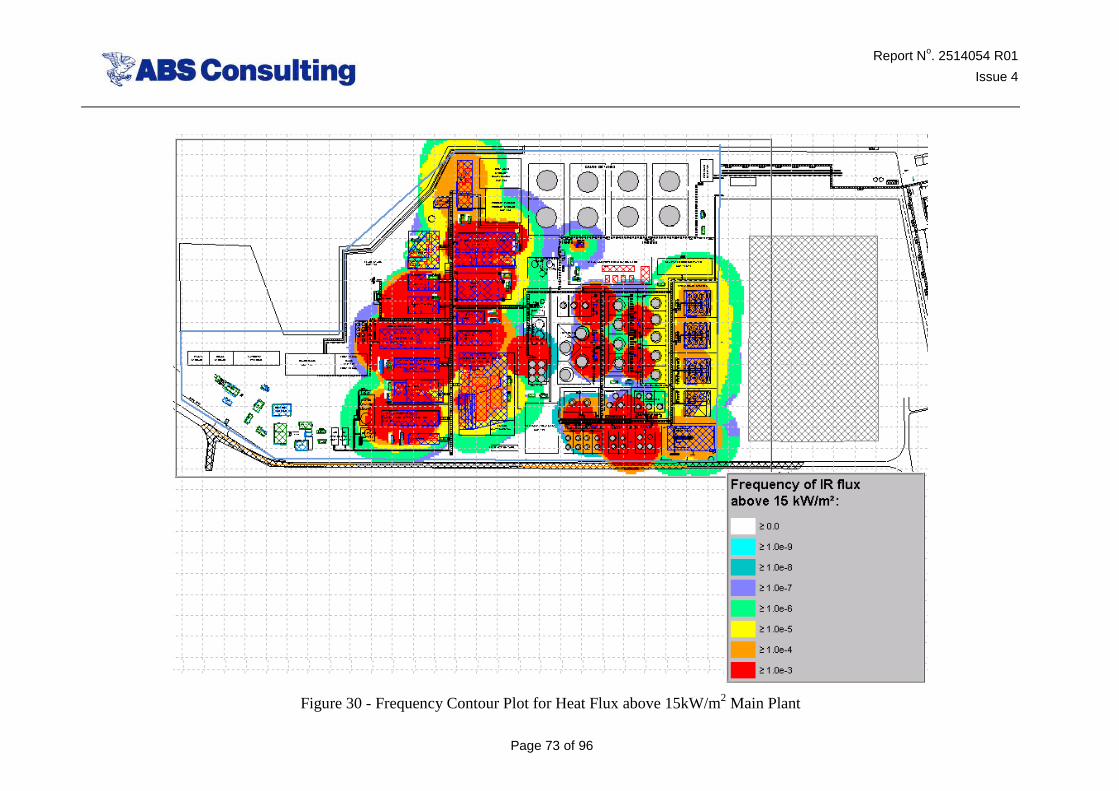
Figure 30 - Frequency Contour Plot for Heat Flux above 15kW/m2 Main Plant ........................................................ 73
Figure 31 - Frequency Contour Plot for Heat Flux above 15kW/m2 Jetty Area ......................................................... 74
Figure 32 – BLEVE Risk Plot .......................................................................................................................................... 75
Figure 33 – F-N Curve (Villagers only) ........................................................................................................................... 85
Figure 34 – Total Fire and Explosion Risk Contour Level Main Plant ....................................................................... 87
Figure 35 – Total Fire and Explosion Risk Contour Level Jetty Area ......................................................................... 88
Figure 36 – Proposed concrete wall and traffic warning/control ................................................................................. 94
Report No. 2514054 R01 Issue 4
Page 12 of 96
1 INTRODUCTION
ABS Consulting Ltd (ABSC) preformed a coarse quantitative risk assessment (QRA) for the proposed NSRP refinery in Vietnam for the FEED stage of the project for Foster Wheeler Energy Ltd (FWEL). The results of the study [14], in addition to the site buildings risks, were used to check the risks to the nearby villages and the adjacent road users. Based on those risks appropriate actions were recommended.
Following on from the earlier work, the Client has now solicited definitive design proposals from various bidders. This study assesses the risks to the site buildings, for the new proposed layout from ‘Bidder 1’ by updating the previous study [14], by incorporating the new information in the risk model.
For this assessment all the previous assumptions about the process conditions, release frequencies, ignition probabilities, etc remains the same.
The results of the revised risk assessment study are detailed within this report. Although unchanged from the previous study [14], for the sake of completeness the general methodology adopted for this study is described in Section 2. Section 3 provides a general description of the facility. Section 4 presents the results of the Stage 1 assessment. Section 5 deals with the Stage 2 consequence modelling with Stage 3 risk analysis being covered in Section 6. Section 7 presents the Risk Assessment, where the risks are compared to the risk acceptance criteria. Section 8 presents the conclusions and suggests suitable risk mitigation measures for accomplishing them or showing that the risks are As Low as Reasonably Practicable (ALARP). Finally, discussion on the QRA uncertainties is presented in Section 9.
Report No. 2514054 R01 Issue 4
Page 13 of 96
2 GENERAL METHODOLOGY
The methodology adopted for the BRA follows the recommendations of in the American Institute of Petroleum’s Recommended Practice API RP 752 [1]. The assessment follows a three step process. The philosophy of the stepped approach is to perform as simple an analysis as is consistent with the hazards. For example if the building is not occupied or is not significant from the plant operation aspect then no further assessment is needed. If the building is occupied or is functionally significant then the next consideration is to check if the building is subject to a credible hazard and if simple mitigation is feasible to mitigate the effects. No further assessment is needed if the occupied or functionally significant building is not subject to a credible major hazard or the effects of the hazard can be mitigated in a cost effective manner. Where the building is occupied or functionally significant and is subject to a credible hazard which cannot be easily designed out or mitigated, a risk assessment is undertaken to check if the risks to the building occupants are acceptable or the frequency of significant damage to unoccupied but functionally significant building is reasonably low. Based on the risk assessment, cost effective and proportional mitigation options can be devised. The QRA has been performed based initially on the three steps of the BRA methodology that are summarized below:
1. Stage 1: A screening assessment based on building occupancy and its functional significance. Only buildings considered to be occupied or functionally significant are taken to the Stage II assessment. This is generally undertaken by the plant and confirmed by the consultant.
2. Stage 2: This phase involves analysis of worst credible consequences of the potential hazards to assess building vulnerability for explosions, fires, flammable and toxic gases. Only buildings considered to be vulnerable to the assessed hazards need to be taken to the 3rd stage of assessment.
3. Stage 3: The 3rd stage of assessment involves calculation of risk to the building occupants and where risks are high considers risk reduction measures.
4. In addition to the standard building risk assessment, the risks to the offsite population were also assessed using the societal risk criteria for which the F-N curves were generated.
The tool used for the stage 2 consequence modelling was Shell FRED V 5.1 which is a suite of Fire, Release, Explosion and Dispersion models used to predict the consequences of the accidental or design release of product from process, storage, transport or distribution operations [3].
For the stage III risk assessment Shell SHEPHERD V2.1 was used. The Shell SHEPHERD Risk Tool forms a family of graphical risk integrators. The tool has been developed to carry out fit-for-purpose Quantified Risk Assessment (QRA) for a broad range of onshore industrial sites such as Refineries, Gas plants, Chemicals plants, LPG distribution sites, pipeline systems etc. SHEPHERD is used to systematically build up risk contributions starting from a release and working through ignition sources to the calculation of the effects of cloud fires, jet fires, toxic gas and explosions. Escalation to other parts of the plant via vessel failure through explosion over-pressure and/or flame engulfment is handled automatically. The input required includes the mass flow rate and dispersion distances to lower flammable limit in process blocks or point sources [4].
Report No. 2514054 R01 Issue 4
Page 14 of 96
3 DESCRIPTION OF FACILITY
3.1 Plant Description
The NSRP Refinery and Petrochemical Project will process 200,000 BPSD of imported Kuwait Export Crude (KEC) oil. The fuels section of the refinery includes Residue Hydrodesulphurisation and Residue Catalytic Cracking as the main upgrading units. The refinery is integrated with petrochemical production. The Aromatics plant produces Paraxylene and Benzene. A key product from the Residue Cracker is Propylene which is used to produce Polypropylene product [5].
The products produced include the following:
• LPG
• Gasoline – 92/ 95 RON
• Kerosene / Jet A-1
• Diesel – Premium and Regular
• Paraxylene / Benzene
• Polypropylene
• Sulphur
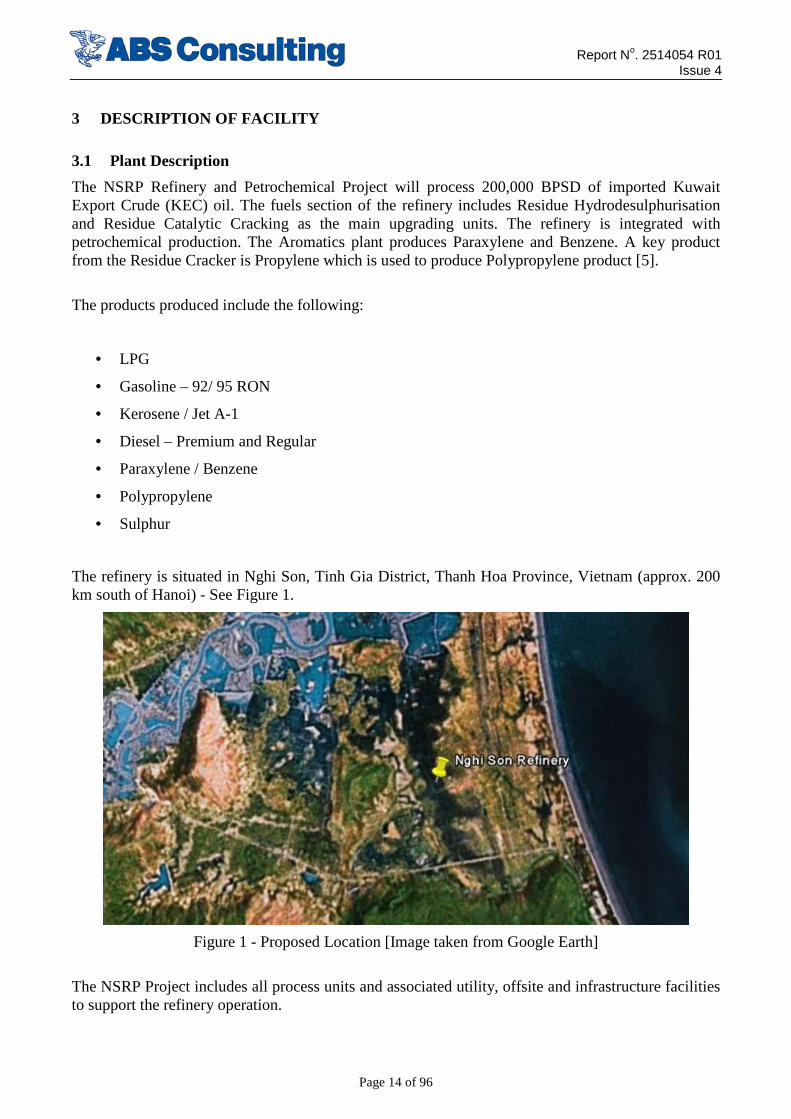
The refinery is situated in Nghi Son, Tinh Gia District, Thanh Hoa Province, Vietnam (approx. 200 km south of Hanoi) - See Figure 1.
Figure 1 - Proposed Location [Image taken from Google Earth]
The NSRP Project includes all process units and associated utility, offsite and infrastructure facilities to support the refinery operation.
Report No. 2514054 R01 Issue 4
Page 15 of 96
• Complete utility facilities designed to meet the refinery’s demands for cooling water, fuels, power, steam, water, instrument and plant air, inert gas, etc.
• Offsite facilities including tankage for feedstocks plus intermediate and final products as well as systems for import and export of feed and products.
• Other offsite facilities including flare, effluent treatment, firewater, interconnecting piping and pipelines, etc.
• Marine facilities include an SPM/ Crude import line and product loading jetties
3.1.1 Process Units
The complex will comprise the following licensed processing blocks:
The following unit description were based on the Refinery Design basis overall [5] supplied by FWEL.
Refinery Process Units
• Crude Distillation Unit (CDU)
• LPG Recovery Unit
• Saturated LPG Treater Unit
• Kerosene Hydrodesulphuriser Unit (KHDS)
• Gas Oil Hydrodesulphuriser Unit (GOHDS)
• Residue Hydrodesulphuriser Unit (RHDS)
• Residue Fluid Catalytic Cracker Unit (RFCC)
• Propylene Recovery Unit (PRU)
• RFCC LPG Treater Unit
• RFCC Light Gasoline Treater Unit
• Selective Hydrogenation (SHU) and Indirect Alkylation Units (InAlk)
• Hydrogen Manufacturing Unit (HMU) and Hydrogen Compression and Distribution System (HCDS)
• Sour Water Stripper Units (SWS)
• Amine Regeneration Unit (ARU)
• Sulphur Recovery Unit (SRU) and Tail Gas Treating (TGT)
Petrochemical Process Units
• Naphtha and Aromatics Complex (NAC)
• Polypropylene Unit (PPU)
Report No. 2514054 R01 Issue 4
Page 16 of 96
• Offsite Systems
• Crude Oil Import, Storage and Pumping System
• Inter Unit Storage and Pumping System
• Product Component Storage and Pumping System
• Product Storage and Pumping System
• Slop Storage and Pumping System
• Product Truck Loading System
• Sulphur Forming and Storage Unit
Utility Systems
• Demineralised water system,
• Raw water/potable systems
• Cooling water system,
• Steam Power generation system,
• Flue gas Desulphurisation,
• Plant air/Instrument Air System,
• Nitrogen System
• Fuel Oil System
• Fuel Gas System
• Flushing oil system
• Chemical Supply
Electricity and steam is generated at the Cogeneration plant.
3.1.2 Buildings
In all 59 buildings have been identified on the plant layout (See Figure 2 and Figure 3). On the previous study [14] ABSC numbered these buildings consecutively from number 1 to number 66. To allow direct comparison this system has been retained. These buildings are tabulated in Table 1.
Report No. 2514054 R01 Issue 4
Page 17 of 96
Figure 2 – NSRP Main Plant Plot Plan [6]
Report No. 2514054 R01 Issue 4
Page 18 of 96
Figure 3 – NSRP Plant Plot Plan (Jetty area) [7]
Report No. 2514054 R01 Issue 4
Page 19 of 96
4 STAGE 1 ASSESSMENT
The scope of the Stage one assessment is to carry out a building screening exercise in order to eliminate buildings of no safety concern (unoccupied and not functionally significant) from the risk assessment process. The stage I screening has been completed by FWEL using the API 752 [1] criteria described below;
4.1 Screening Criterion
4.1.1 Occupancy Screening
For the purposes of occupancy screening a building is considered occupied if the building occupancy load is 300 or more man-hours per week or if during peak occupancy, 5 people or more are routinely expected in the building for at least one hour. If this criteria is exceeded the building is selected for second stage (Stage 2) analysis.
4.1.2 Functionality Screening
A stage-two building evaluation is required if a building is functionally significant. A building is defined as functionally significant if either:
• People are expected to remain or take refuge in the building during an emergency. Possible reasons for people to remain in a building include a lack of suitable evacuation options or the need for occupants to perform emergency shutdown procedures.
• The building is required for emergency response, such as fire stations or clinics.
• The building is necessary for continued operation of plant units that may be able to continue to operate or may be unaffected by an incident in another area. This includes control buildings, process interface buildings (PIBs), or substations that control or provide power to multiple process units.
• The economic impact on operations of loss of buildings is significant.
4.2 Stage One Results
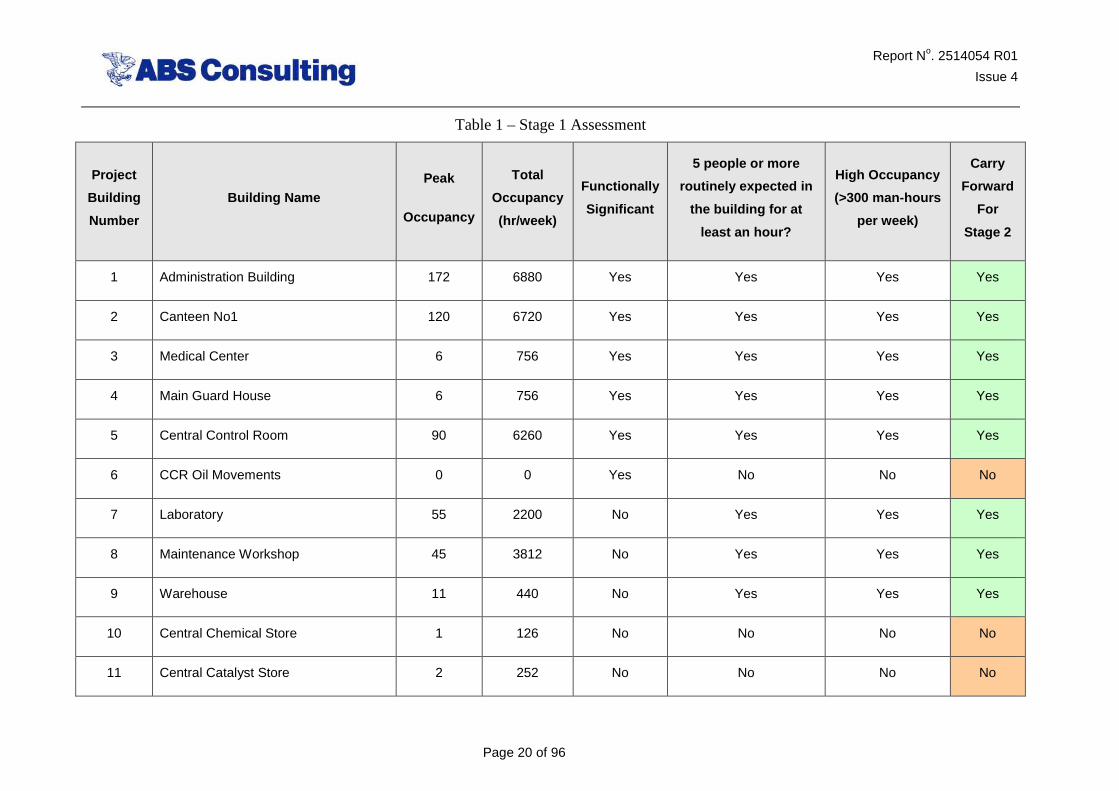
A summary of the occupancy details is provided in Table 1 along with whether the building is functionally critical or required to provide shelter during an emergency. Previously the buildings were numbered 1 to 66. The building numbering system has been retained within this study to facilitate a direct comparison. However, please note that numbers 17, 29, 35, 47, 61, 63 and 64 have not been used as they were either missing on the plot plan [6] or have been revised.
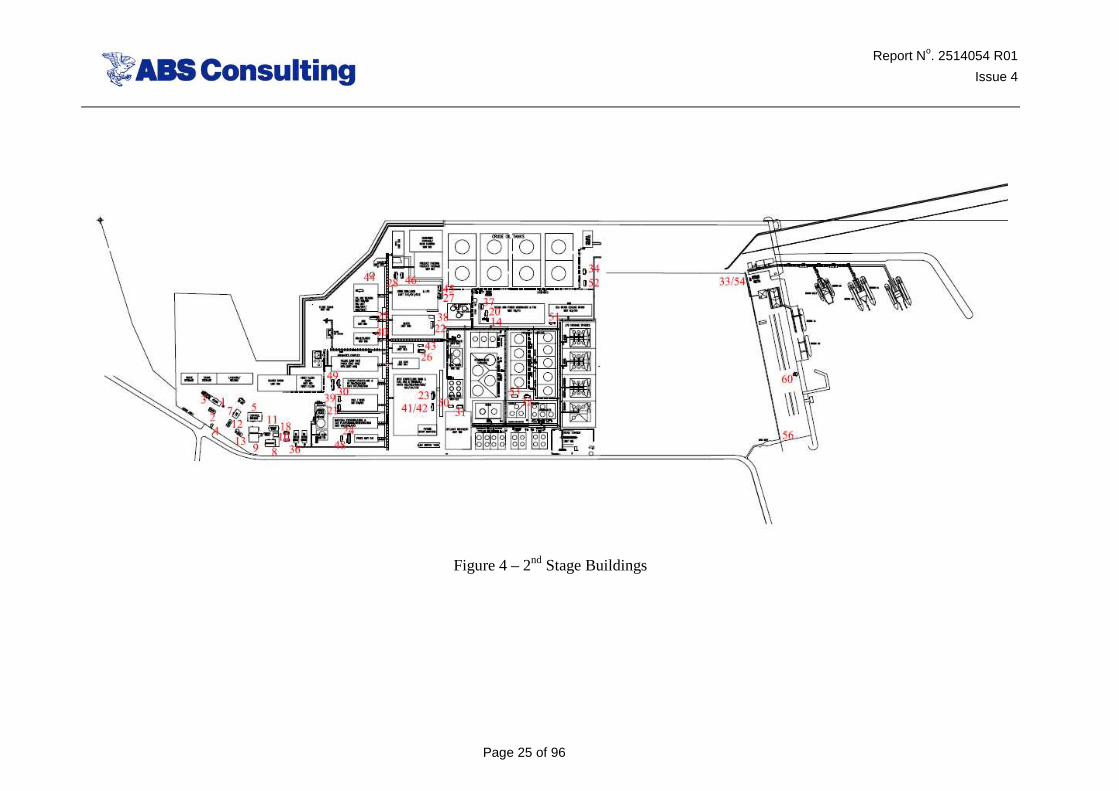
Twelve building are assessed as being occupied and thirty eight as functionally significant. Six buildings are both occupied and functionally significant. Eleven building have been screened out as being neither occupied nor functionally significant.
The buildings taken to the second stage of this assessment are shown in Figure 4.
Report No. 2514054 R01
Issue 4
Page 20 of 96
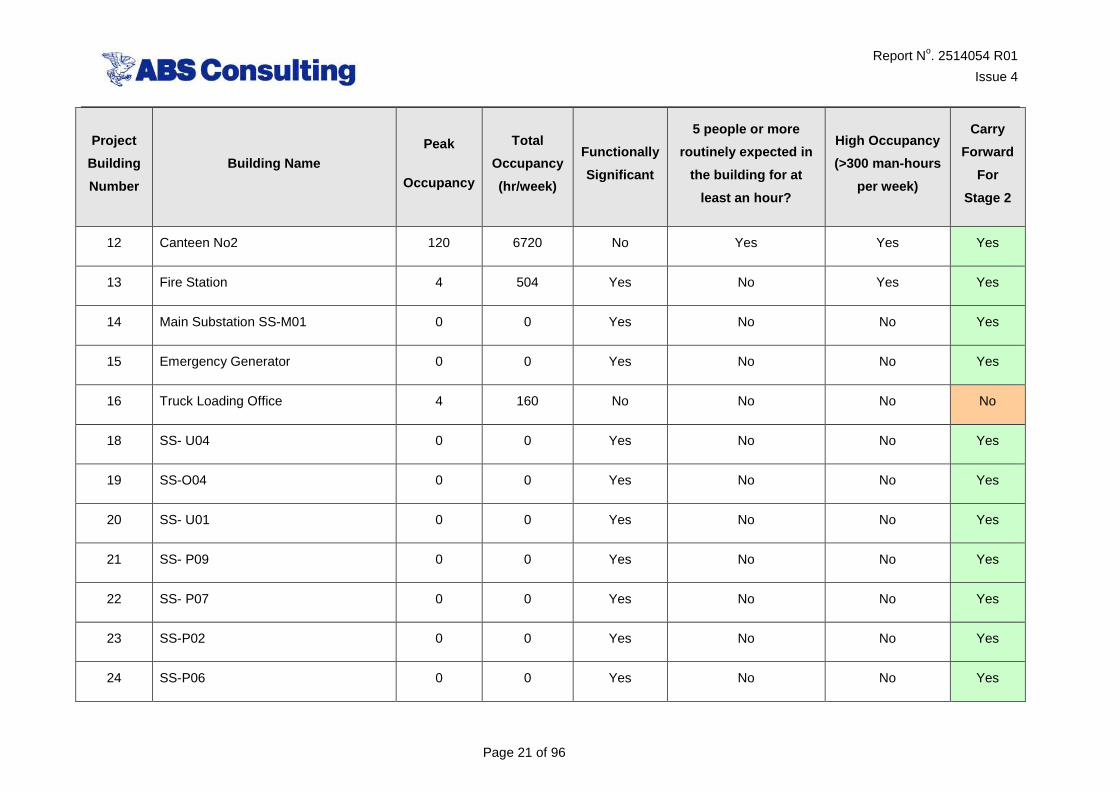
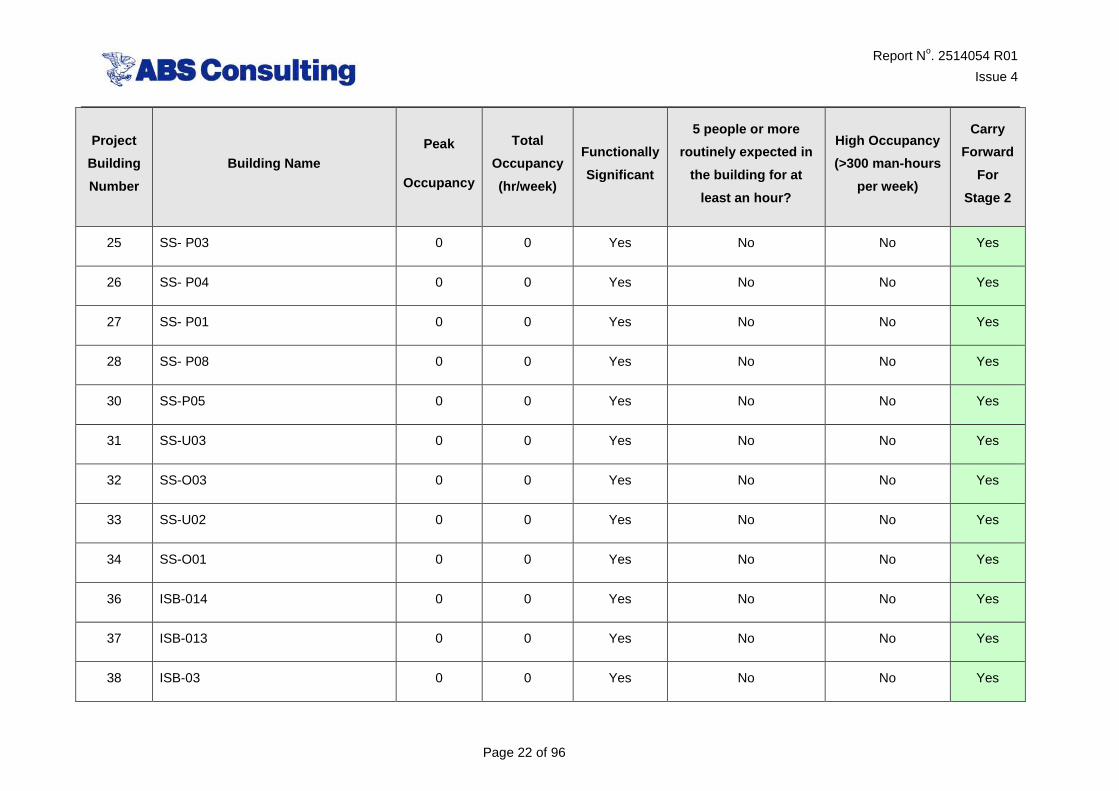
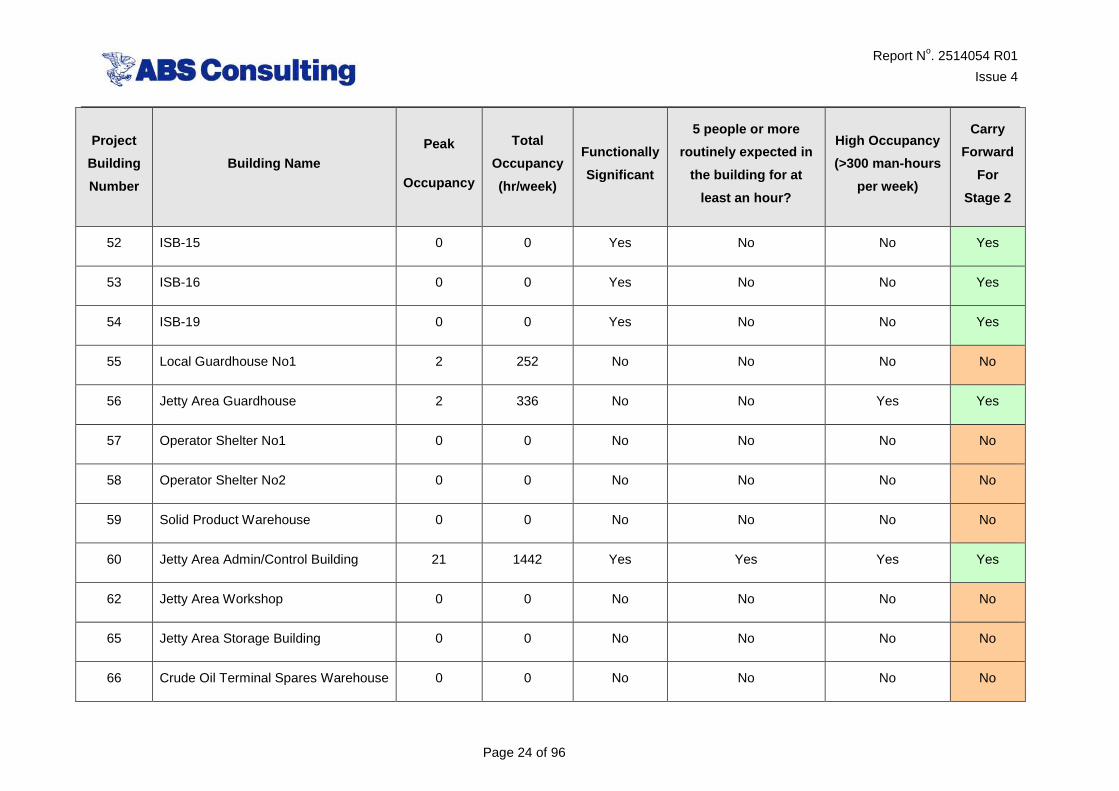
Table 1 – Stage 1 Assessment
Project
Building
Number
Building Name Peak
Occupancy
Total
Occupancy
(hr/week)
Functionally
Significant
5 people or more
routinely expected in
the building for at
least an hour?
High Occupancy
(>300 man-hours
per week)
Carry
Forward
For
Stage 2
1 Administration Building 172 6880 Yes Yes Yes Yes
2 Canteen No1 120 6720 Yes Yes Yes Yes
3 Medical Center 6 756 Yes Yes Yes Yes
4 Main Guard House 6 756 Yes Yes Yes Yes
5 Central Control Room 90 6260 Yes Yes Yes Yes
6 CCR Oil Movements 0 0 Yes No No No
7 Laboratory 55 2200 No Yes Yes Yes
8 Maintenance Workshop 45 3812 No Yes Yes Yes
9 Warehouse 11 440 No Yes Yes Yes
10 Central Chemical Store 1 126 No No No No
11 Central Catalyst Store 2 252 No No No No
Report No. 2514054 R01
Issue 4
Page 21 of 96
Project
Building
Number
Building Name Peak
Occupancy
Total
Occupancy
(hr/week)
Functionally
Significant
5 people or more
routinely expected in
the building for at
least an hour?
High Occupancy
(>300 man-hours
per week)
Carry
Forward
For
Stage 2
12 Canteen No2 120 6720 No Yes Yes Yes
13 Fire Station 4 504 Yes No Yes Yes
14 Main Substation SS-M01 0 0 Yes No No Yes
15 Emergency Generator 0 0 Yes No No Yes
16 Truck Loading Office 4 160 No No No No
18 SS- U04 0 0 Yes No No Yes
19 SS-O04 0 0 Yes No No Yes
20 SS- U01 0 0 Yes No No Yes
21 SS- P09 0 0 Yes No No Yes
22 SS- P07 0 0 Yes No No Yes
23 SS-P02 0 0 Yes No No Yes
24 SS-P06 0 0 Yes No No Yes
Report No. 2514054 R01
Issue 4
Page 22 of 96
Project
Building
Number
Building Name Peak
Occupancy
Total
Occupancy
(hr/week)
Functionally
Significant
5 people or more
routinely expected in
the building for at
least an hour?
High Occupancy
(>300 man-hours
per week)
Carry
Forward
For
Stage 2
25 SS- P03 0 0 Yes No No Yes
26 SS- P04 0 0 Yes No No Yes
27 SS- P01 0 0 Yes No No Yes
28 SS- P08 0 0 Yes No No Yes
30 SS-P05 0 0 Yes No No Yes
31 SS-U03 0 0 Yes No No Yes
32 SS-O03 0 0 Yes No No Yes
33 SS-U02 0 0 Yes No No Yes
34 SS-O01 0 0 Yes No No Yes
36 ISB-014 0 0 Yes No No Yes
37 ISB-013 0 0 Yes No No Yes
38 ISB-03 0 0 Yes No No Yes

Report No. 2514054 R01
Issue 4
Page 23 of 96
Project
Building
Number
Building Name Peak
Occupancy
Total
Occupancy
(hr/week)
Functionally
Significant
5 people or more
routinely expected in
the building for at
least an hour?
High Occupancy
(>300 man-hours
per week)
Carry
Forward
For
Stage 2
39 ISB-011 0 0 Yes No No Yes
40 ISB-06 0 0 Yes No No Yes
41 ISB-05 0 0 Yes No No Yes
42 ISB-04 0 0 Yes No No Yes
43 ISB-02 0 0 Yes No No Yes
44 ISB-12 0 0 Yes No No Yes
45 ISB-01 0 0 Yes No No Yes
46 ISB-10 0 0 Yes No No Yes
48 ISB-08 0 0 Yes No No Yes
49 ISB-07 0 0 Yes No No Yes
50 ISB-18 0 0 Yes No No Yes
51 ISB-17 0 0 Yes No No Yes
Report No. 2514054 R01
Issue 4
Page 24 of 96
Project
Building
Number
Building Name Peak
Occupancy
Total
Occupancy
(hr/week)
Functionally
Significant
5 people or more
routinely expected in
the building for at
least an hour?
High Occupancy
(>300 man-hours
per week)
Carry
Forward
For
Stage 2
52 ISB-15 0 0 Yes No No Yes
53 ISB-16 0 0 Yes No No Yes
54 ISB-19 0 0 Yes No No Yes
55 Local Guardhouse No1 2 252 No No No No
56 Jetty Area Guardhouse 2 336 No No Yes Yes
57 Operator Shelter No1 0 0 No No No No
58 Operator Shelter No2 0 0 No No No No
59 Solid Product Warehouse 0 0 No No No No
60 Jetty Area Admin/Control Building 21 1442 Yes Yes Yes Yes
62 Jetty Area Workshop 0 0 No No No No
65 Jetty Area Storage Building 0 0 No No No No
66 Crude Oil Terminal Spares Warehouse 0 0 No No No No
Report No. 2514054 R01
Issue 4
Page 25 of 96
Figure 4 – 2nd Stage Buildings
Report No. 2514054 R01 Issue 4
Page 26 of 96
5 STAGE 2 ASSESSMENT (CONSEQUENCE ANALYSES)
5.1 Explosion Analyses
5.1.1 Credible Explosion Hazards
The flammable gas accumulating in a congested region and subsequent delayed ignition results in an explosion. So for an explosion to occur there should be a source of flammable release near a congested area. Considering both the PFD and the plot plan, the following potential sources of explosion were identified for explosion consequence modeling.
• CDU
• LPG Recovery and Treater Unit
• KHDS
• GOHDS
• RHDS
• RFCC
• PPU
• SHU and Ind Alk
• HMU
• HCDS
• NAC
• Berth Area
• Tanks pumping system
• Fuel gas system
5.1.2 CAM Assessment
For the congested areas in the Aromatics Complex, RFCC Unit and Hydrogen Manufacturing plant, the parameters were derived using Shell’s guidelines and based upon the plot plans provided. For the remaining units an engineering judgment was use to set this parameters as more detailed plot plants weren’t available at the time of this assessment.
5.1.3 Review of Hazard Consequences
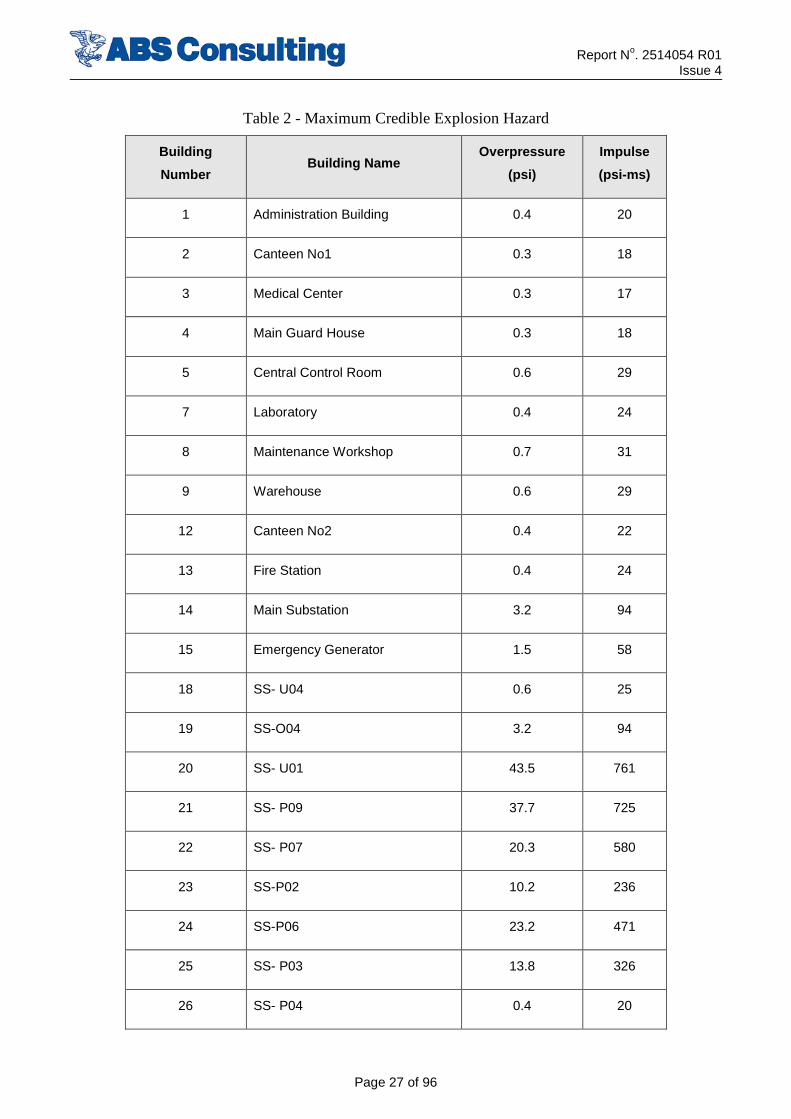
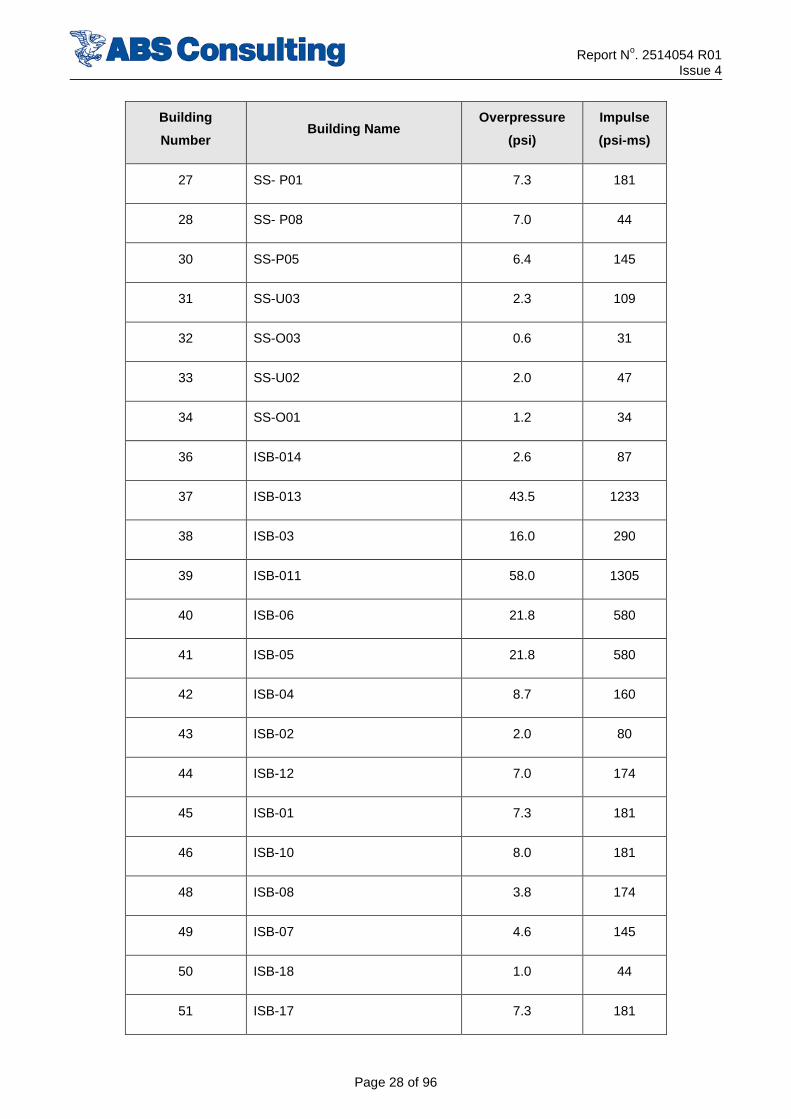
The maximum credible overpressure and impulse for each building is provided in Table 2.
Report No. 2514054 R01 Issue 4
Page 27 of 96
Table 2 - Maximum Credible Explosion Hazard
Building
Number Building Name
Overpressure
(psi)
Impulse
(psi-ms)
1 Administration Building 0.4 20
2 Canteen No1 0.3 18
3 Medical Center 0.3 17
4 Main Guard House 0.3 18
5 Central Control Room 0.6 29
7 Laboratory 0.4 24
8 Maintenance Workshop 0.7 31
9 Warehouse 0.6 29
12 Canteen No2 0.4 22
13 Fire Station 0.4 24
14 Main Substation 3.2 94
15 Emergency Generator 1.5 58
18 SS- U04 0.6 25
19 SS-O04 3.2 94
20 SS- U01 43.5 761
21 SS- P09 37.7 725
22 SS- P07 20.3 580
23 SS-P02 10.2 236
24 SS-P06 23.2 471
25 SS- P03 13.8 326
26 SS- P04 0.4 20
Report No. 2514054 R01 Issue 4
Page 28 of 96
Building
Number Building Name
Overpressure
(psi)
Impulse
(psi-ms)
27 SS- P01 7.3 181
28 SS- P08 7.0 44
30 SS-P05 6.4 145
31 SS-U03 2.3 109
32 SS-O03 0.6 31
33 SS-U02 2.0 47
34 SS-O01 1.2 34
36 ISB-014 2.6 87
37 ISB-013 43.5 1233
38 ISB-03 16.0 290
39 ISB-011 58.0 1305
40 ISB-06 21.8 580
41 ISB-05 21.8 580
42 ISB-04 8.7 160
43 ISB-02 2.0 80
44 ISB-12 7.0 174
45 ISB-01 7.3 181
46 ISB-10 8.0 181
48 ISB-08 3.8 174
49 ISB-07 4.6 145
50 ISB-18 1.0 44
51 ISB-17 7.3 181
Report No. 2514054 R01 Issue 4
Page 29 of 96
Building
Number Building Name
Overpressure
(psi)
Impulse
(psi-ms)
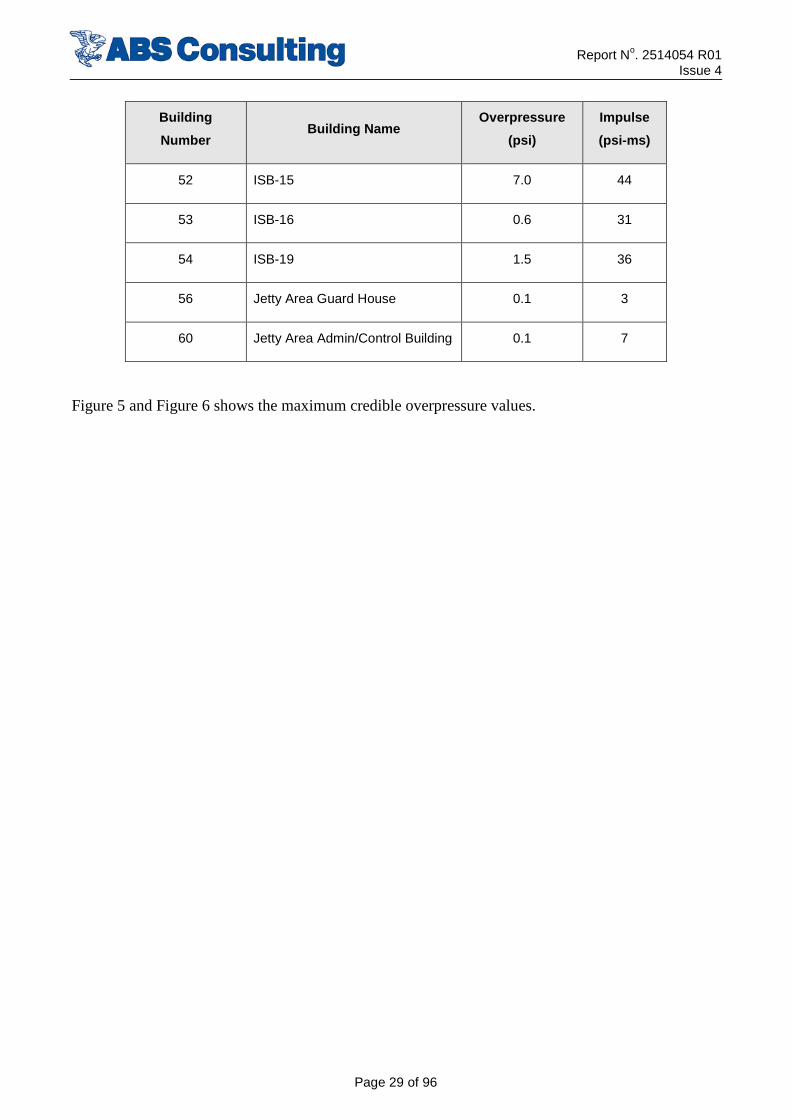
52 ISB-15 7.0 44
53 ISB-16 0.6 31
54 ISB-19 1.5 36
56 Jetty Area Guard House 0.1 3
60 Jetty Area Admin/Control Building 0.1 7
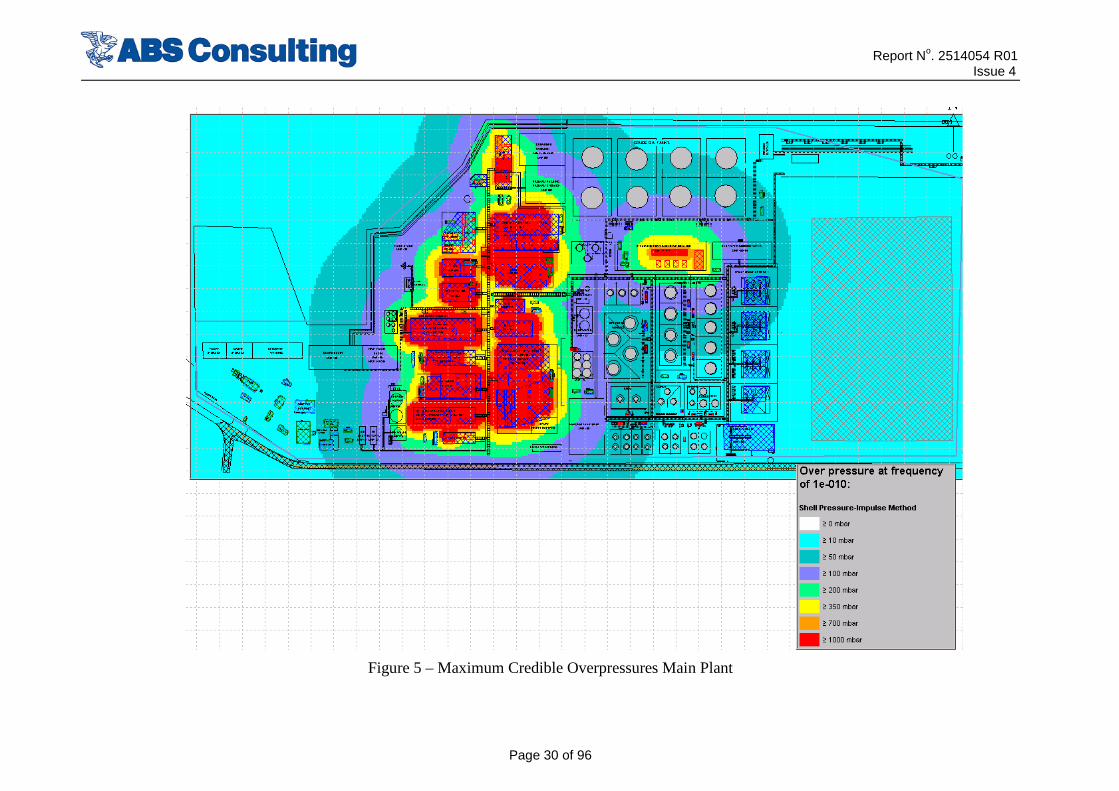
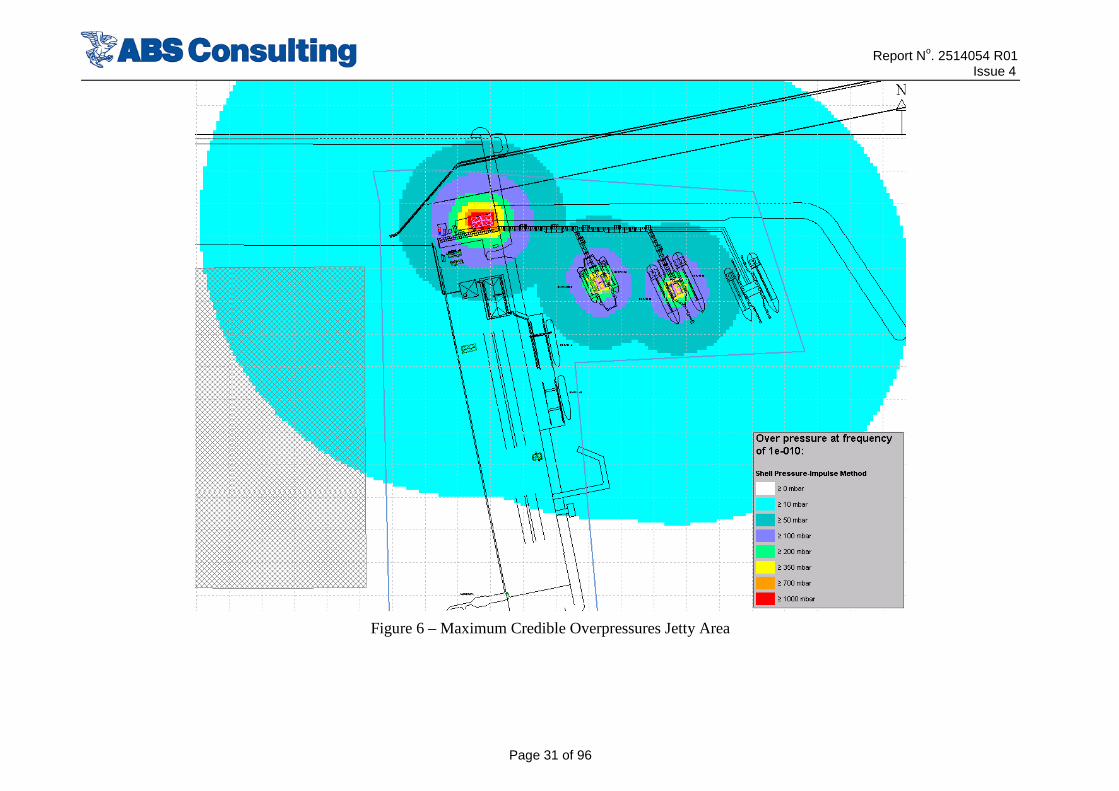
Figure 5 and Figure 6 shows the maximum credible overpressure values.
Report No. 2514054 R01 Issue 4
Page 30 of 96
Figure 5 – Maximum Credible Overpressures Main Plant
Report No. 2514054 R01 Issue 4
Page 31 of 96
Figure 6 – Maximum Credible Overpressures Jetty Area
Report No. 2514054 R01 Issue 4
Page 32 of 96
5.2 Fire Analysis
5.2.1 Credible Fire Hazards
The following list summarises the main potential fire sources for fire consequence modeling:
• CDU
• LPG Recovery and Treater Unit
• KHDS
• GOHDS
• RHDS
• RFCC
• PPU
• SHU and Ind Alk
• HMU
• HCDS
• NAC
• Berth Area
• Storage Tanks and pumping system
• Spheres
• Propane loading
• Fuel Gas system
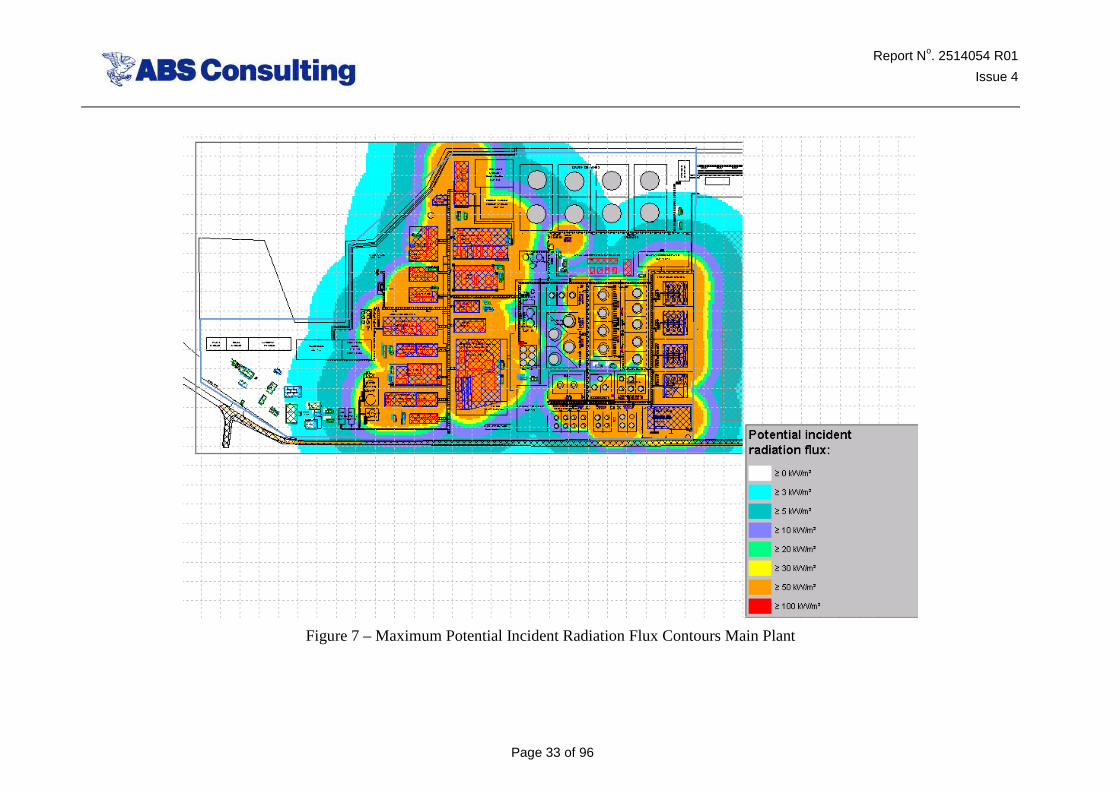
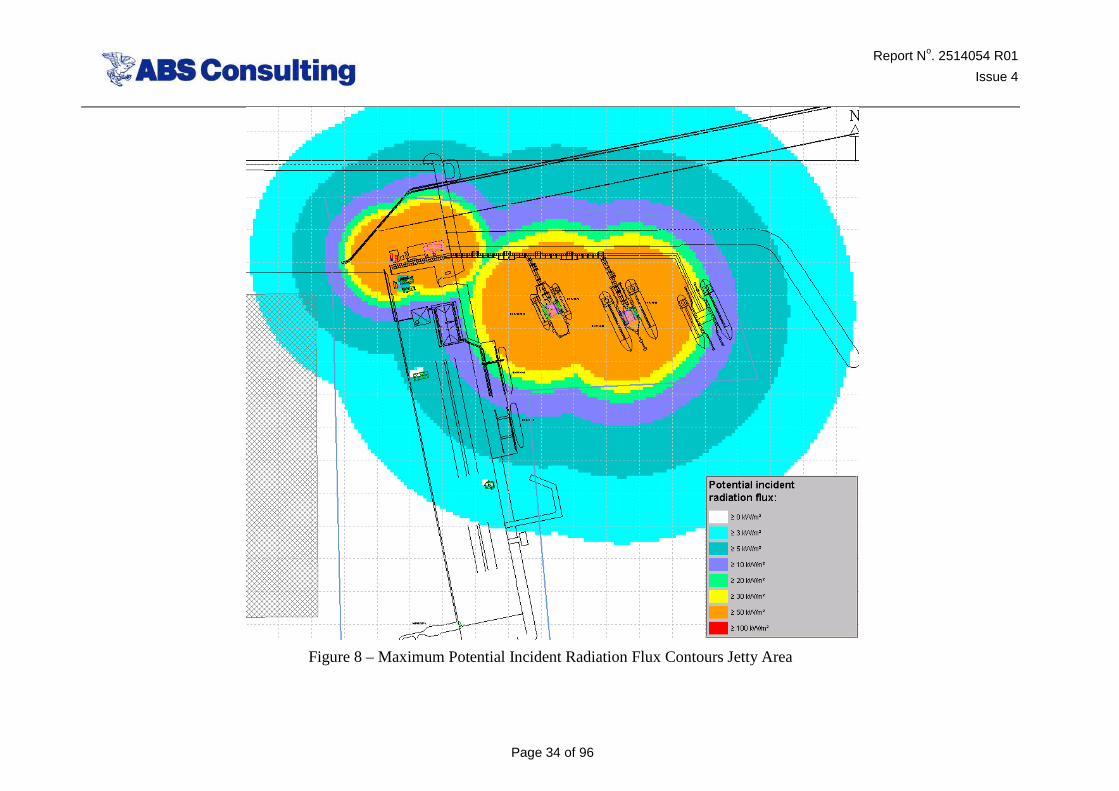
Figure 7 and Figure 8 show the maximum potential incident radiation flux contours.
Report No. 2514054 R01
Issue 4
Page 33 of 96
Figure 7 – Maximum Potential Incident Radiation Flux Contours Main Plant
Report No. 2514054 R01
Issue 4
Page 34 of 96
Figure 8 – Maximum Potential Incident Radiation Flux Contours Jetty Area
Report No. 2514054 R01 Issue 4
Page 35 of 96
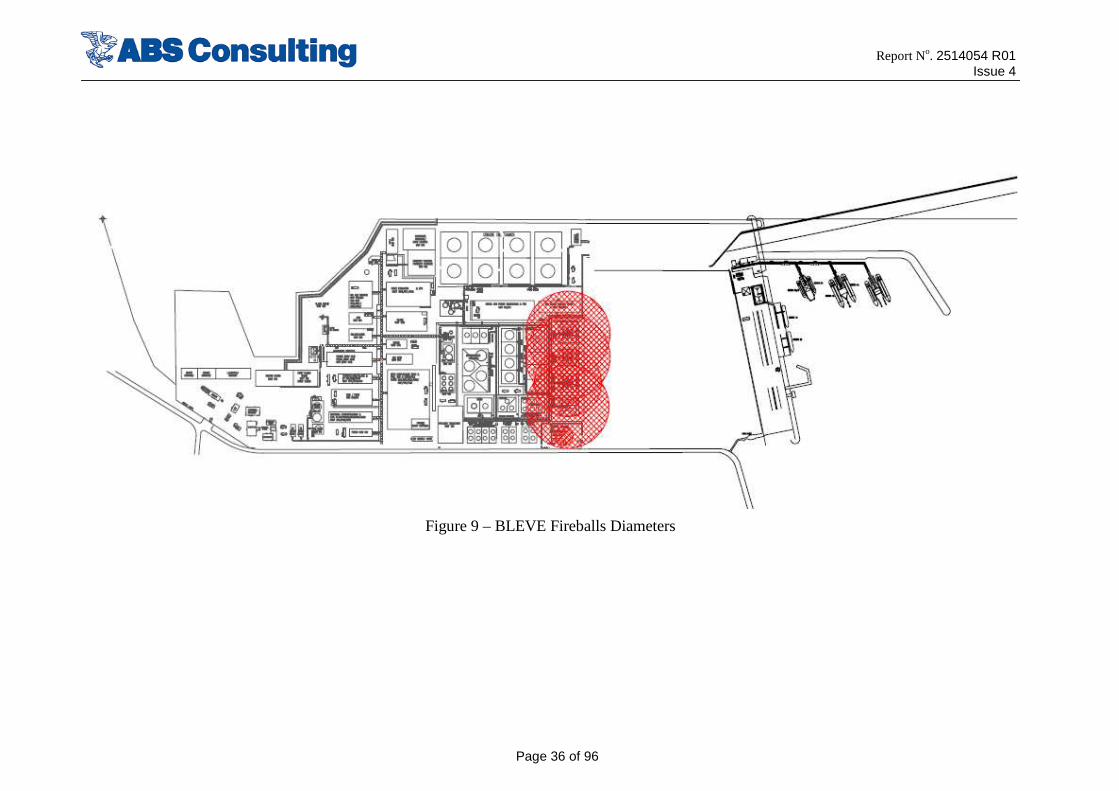
5.2.2 Boiling Liquid Expanding Vapour Explosion (BLEVE) Hazards
The potential BLEVE hazards identified are listed below. A consequence modeling has been undertaken for these BLEVE scenarios.
• Product storage (Spheres)
• LPG Loading
True BLEVEs are associated with liquid gases such as propane which are stored as liquid by keeping them under pressure at temperatures far in excess of the boiling points of the material. For example the boiling point of propane is -42oC. Being kept at an ambient temperature of 30oC represents a very large temperature difference for this liquid. Therefore, an increase in the temperature for the liquid from a relatively small fire would tend to rapidly increase the pressure as the material tries to return to a gaseous state. The material could go into a superheated state, and, given the sudden loss of containment when the shell of the containing vessel fails due to the applied heat load and loss of strength, the superheated liquid would instantly vaporize causing a rapid expansion in volume (of the order of 100s of times the liquid volume) giving rise to the fireball that is inherent in the BLEVE event.
The maximum fireball diameter contours are show in Figure 9.
Report No. 2514054 R01 Issue 4
Page 36 of 96
Figure 9 – BLEVE Fireballs Diameters
Report No. 2514054 R01 Issue 4
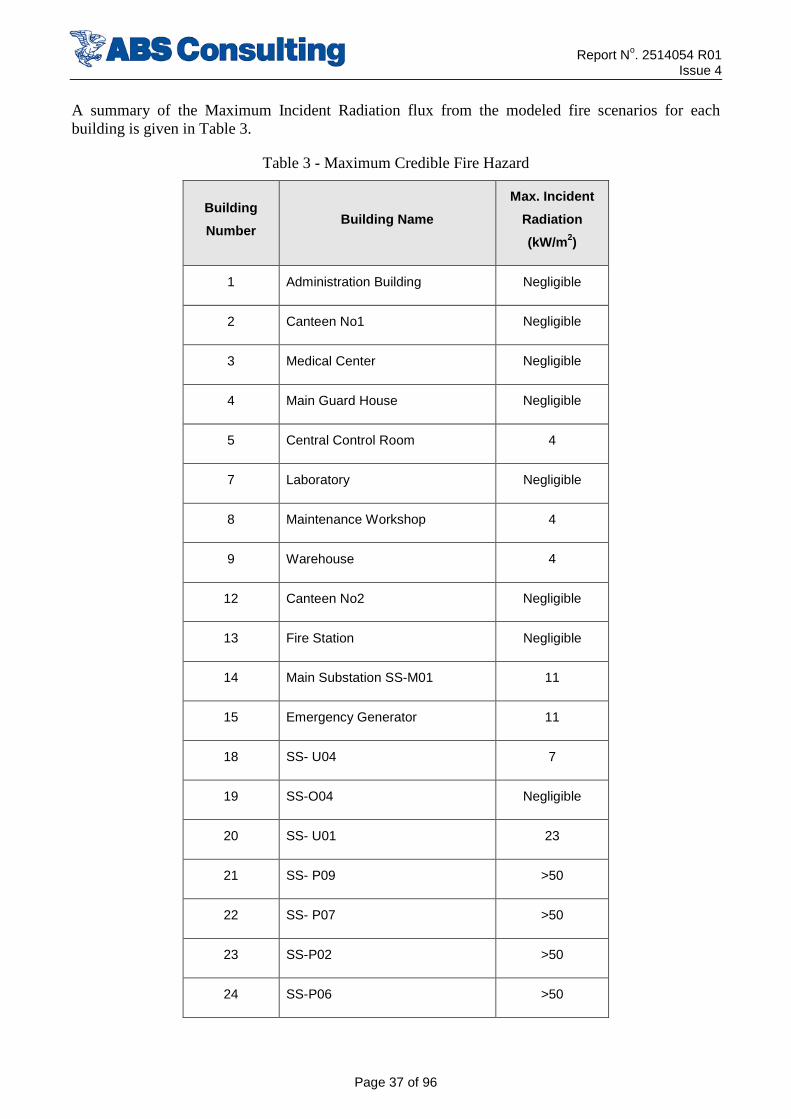
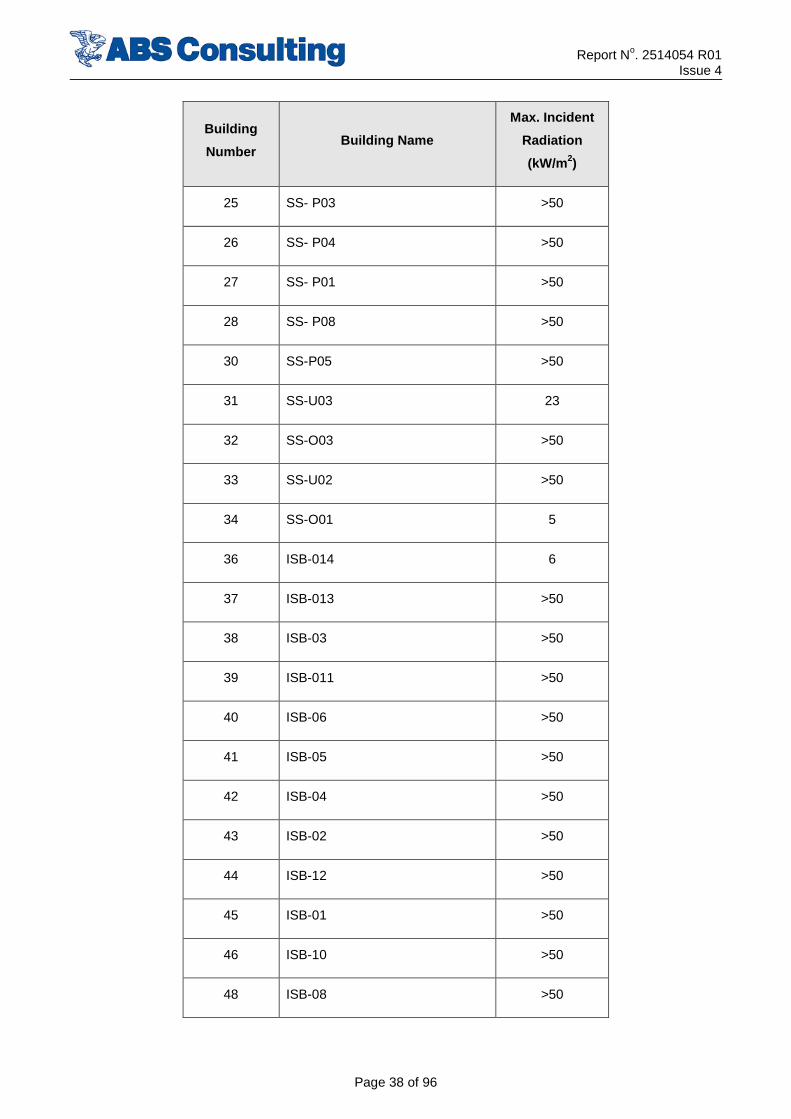
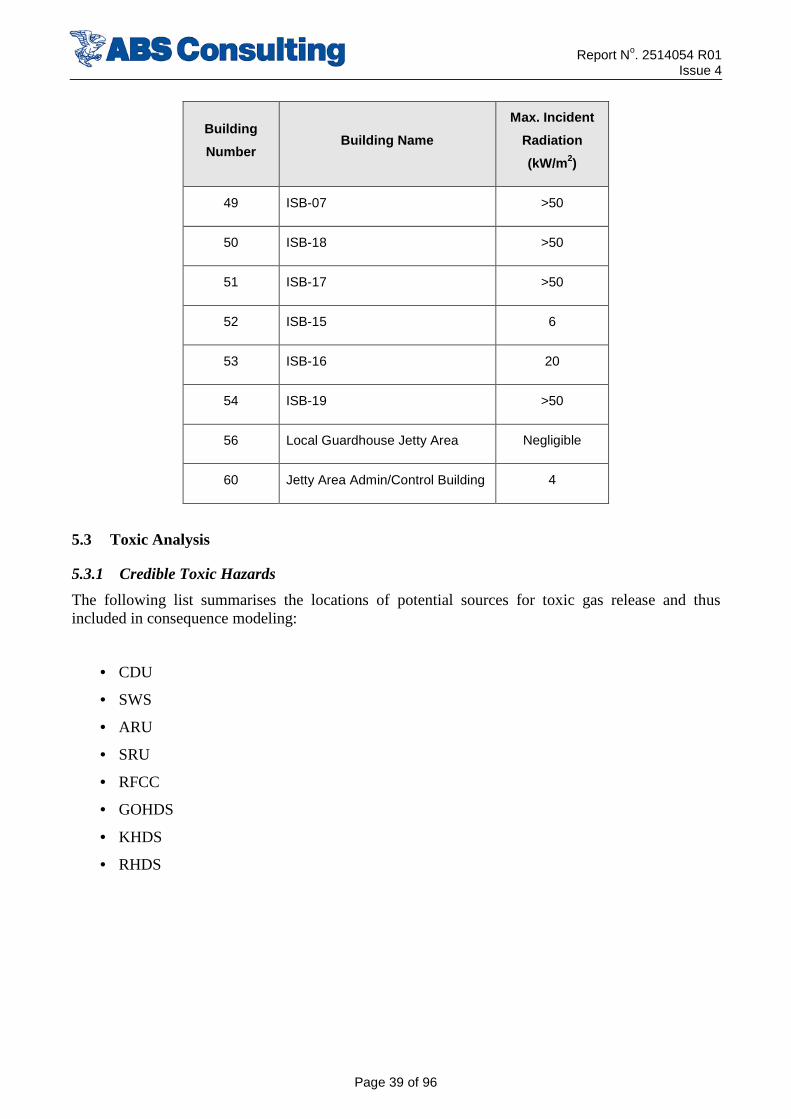
Page 37 of 96
A summary of the Maximum Incident Radiation flux from the modeled fire scenarios for each building is given in Table 3.
Table 3 - Maximum Credible Fire Hazard
Building
Number Building Name
Max. Incident
Radiation
(kW/m2)
1 Administration Building Negligible
2 Canteen No1 Negligible
3 Medical Center Negligible
4 Main Guard House Negligible
5 Central Control Room 4
7 Laboratory Negligible
8 Maintenance Workshop 4
9 Warehouse 4
12 Canteen No2 Negligible
13 Fire Station Negligible
14 Main Substation SS-M01 11
15 Emergency Generator 11
18 SS- U04 7
19 SS-O04 Negligible
20 SS- U01 23
21 SS- P09 >50
22 SS- P07 >50
23 SS-P02 >50
24 SS-P06 >50
Report No. 2514054 R01 Issue 4
Page 38 of 96
Building
Number Building Name
Max. Incident
Radiation
(kW/m2)
25 SS- P03 >50
26 SS- P04 >50
27 SS- P01 >50
28 SS- P08 >50
30 SS-P05 >50
31 SS-U03 23
32 SS-O03 >50
33 SS-U02 >50
34 SS-O01 5
36 ISB-014 6
37 ISB-013 >50
38 ISB-03 >50
39 ISB-011 >50
40 ISB-06 >50
41 ISB-05 >50
42 ISB-04 >50
43 ISB-02 >50
44 ISB-12 >50
45 ISB-01 >50
46 ISB-10 >50
48 ISB-08 >50
Report No. 2514054 R01 Issue 4
Page 39 of 96
Building
Number Building Name
Max. Incident
Radiation
(kW/m2)
49 ISB-07 >50
50 ISB-18 >50
51 ISB-17 >50
52 ISB-15 6
53 ISB-16 20
54 ISB-19 >50
56 Local Guardhouse Jetty Area Negligible
60 Jetty Area Admin/Control Building 4
5.3 Toxic Analysis
5.3.1 Credible Toxic Hazards
The following list summarises the locations of potential sources for toxic gas release and thus included in consequence modeling:
• CDU
• SWS
• ARU
• SRU
• RFCC
• GOHDS
• KHDS
• RHDS
Report No. 2514054 R01 Issue 4
Page 40 of 96
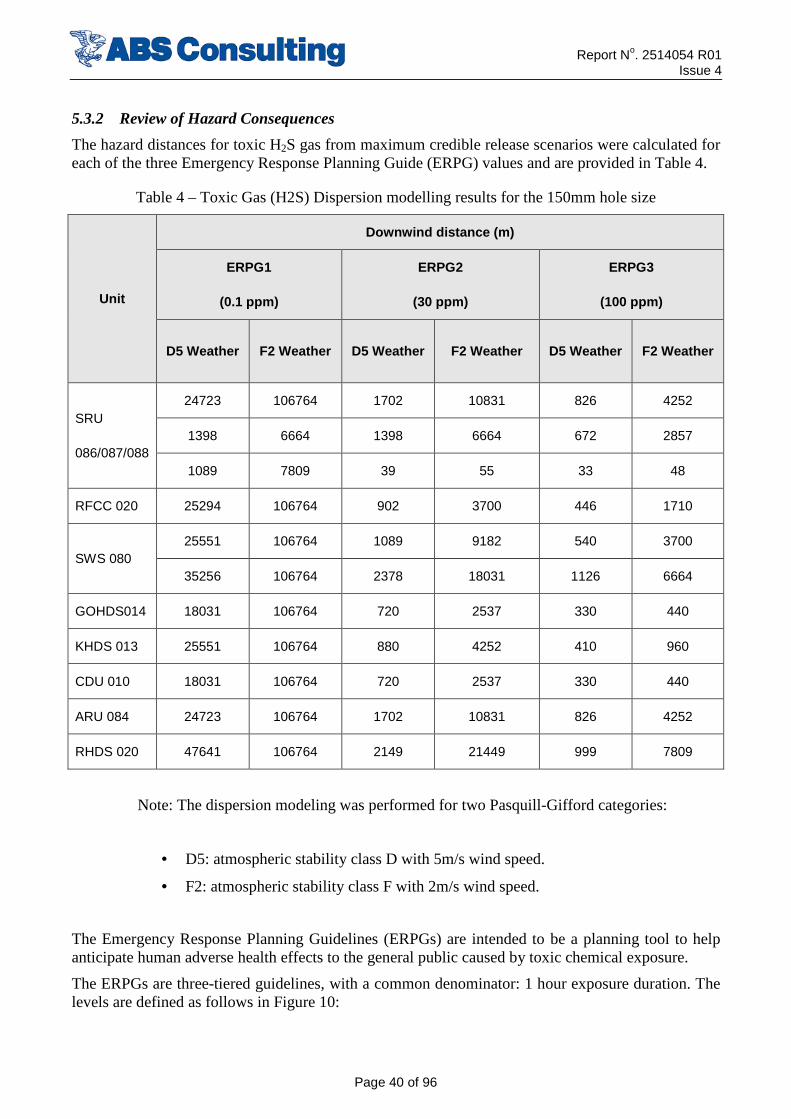
5.3.2 Review of Hazard Consequences
The hazard distances for toxic H2S gas from maximum credible release scenarios were calculated for each of the three Emergency Response Planning Guide (ERPG) values and are provided in Table 4.
Table 4 – Toxic Gas (H2S) Dispersion modelling results for the 150mm hole size
Unit
Downwind distance (m)
ERPG1
(0.1 ppm)
ERPG2
(30 ppm)
ERPG3
(100 ppm)
D5 Weather F2 Weather D5 Weather F2 Weather D5 Weather F2 Weather
SRU
086/087/088
24723 106764 1702 10831 826 4252
1398 6664 1398 6664 672 2857
1089 7809 39 55 33 48
RFCC 020 25294 106764 902 3700 446 1710
SWS 080 25551 106764 1089 9182 540 3700
35256 106764 2378 18031 1126 6664
GOHDS014 18031 106764 720 2537 330 440
KHDS 013 25551 106764 880 4252 410 960
CDU 010 18031 106764 720 2537 330 440
ARU 084 24723 106764 1702 10831 826 4252
RHDS 020 47641 106764 2149 21449 999 7809
Note: The dispersion modeling was performed for two Pasquill-Gifford categories:
• D5: atmospheric stability class D with 5m/s wind speed.
• F2: atmospheric stability class F with 2m/s wind speed.
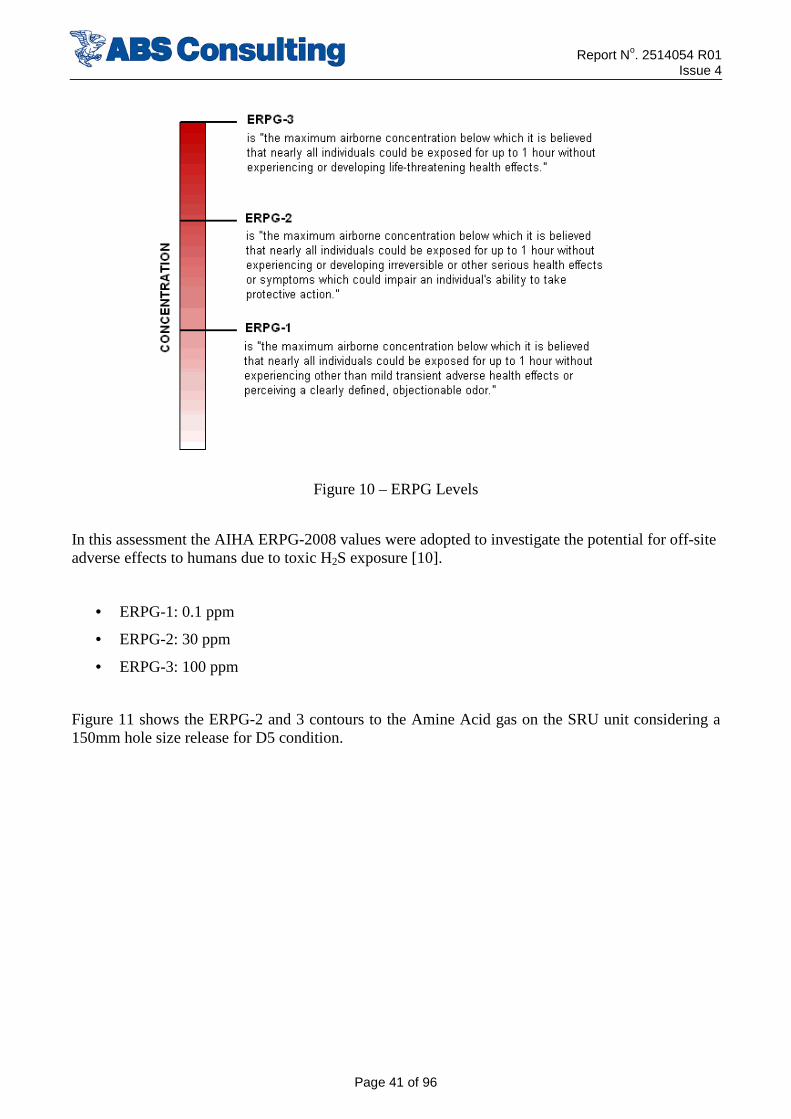
The Emergency Response Planning Guidelines (ERPGs) are intended to be a planning tool to help anticipate human adverse health effects to the general public caused by toxic chemical exposure.
The ERPGs are three-tiered guidelines, with a common denominator: 1 hour exposure duration. The levels are defined as follows in Figure 10:
Report No. 2514054 R01 Issue 4
Page 41 of 96
Figure 10 – ERPG Levels
In this assessment the AIHA ERPG-2008 values were adopted to investigate the potential for off-site adverse effects to humans due to toxic H2S exposure [10].
• ERPG-1: 0.1 ppm
• ERPG-2: 30 ppm
• ERPG-3: 100 ppm
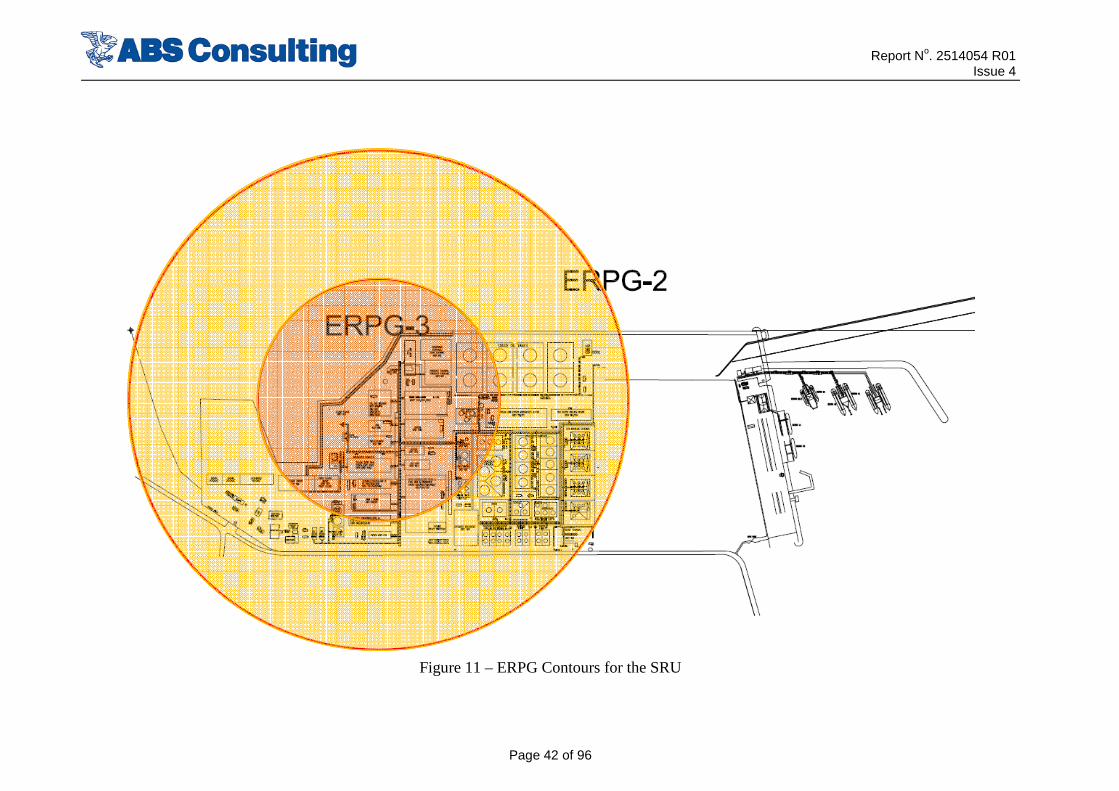
Figure 11 shows the ERPG-2 and 3 contours to the Amine Acid gas on the SRU unit considering a 150mm hole size release for D5 condition.
Report No. 2514054 R01 Issue 4
Page 42 of 96
Figure 11 – ERPG Contours for the SRU
Report No. 2514054 R01 Issue 4
Page 43 of 96
5.4 Stage II Screening
From the review of the credible hazards modeled, it is apparent that most of the buildings taken to stage II screening are subject to significant fire and /or explosion hazard. Conservatively therefore all the buildings considered in the stage II assessment have been retained for the Stage III risk assessment.
6 STAGE 3 ASSESSMENT (RISK ANALYSIS)
6.1 Model Development
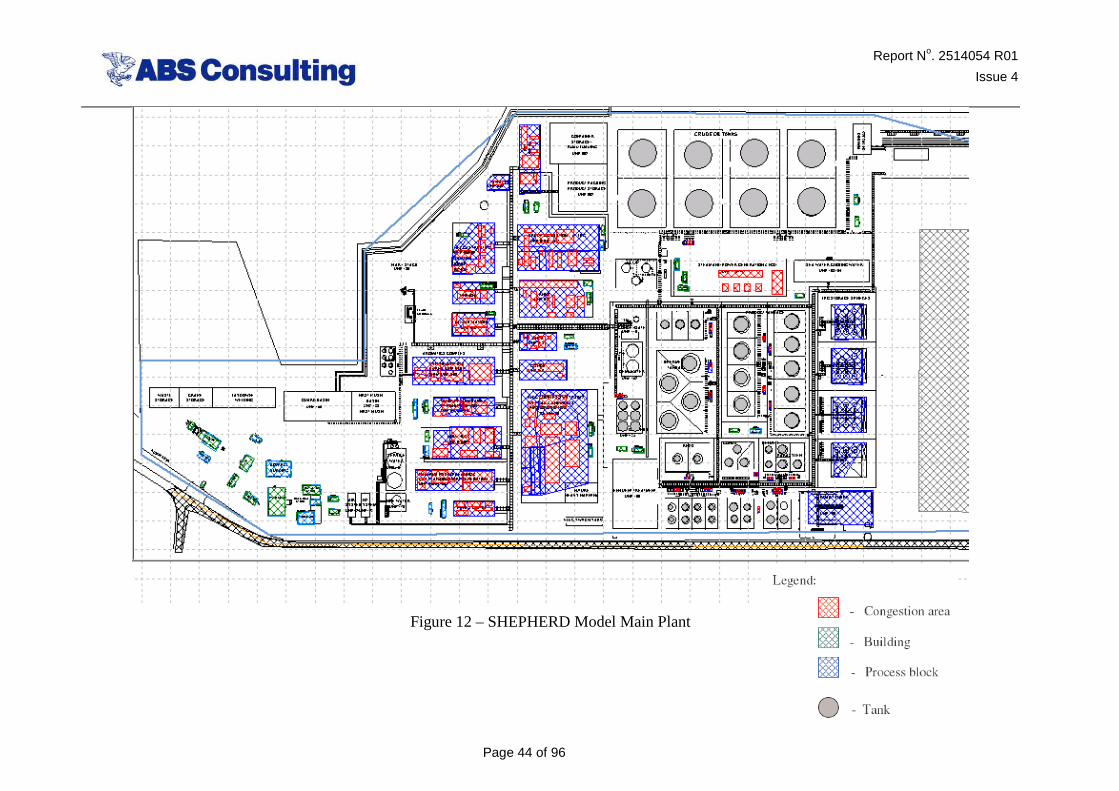
The SHEPHERD model was updated using the plot plans [6].
The mass and energy balance was used to define the process condition within each of the main plant items so that process specific fluid could be used in the consequence assessment.
The plot plans and other documents were used to define the process areas for the QRA and also used to define the congested areas.
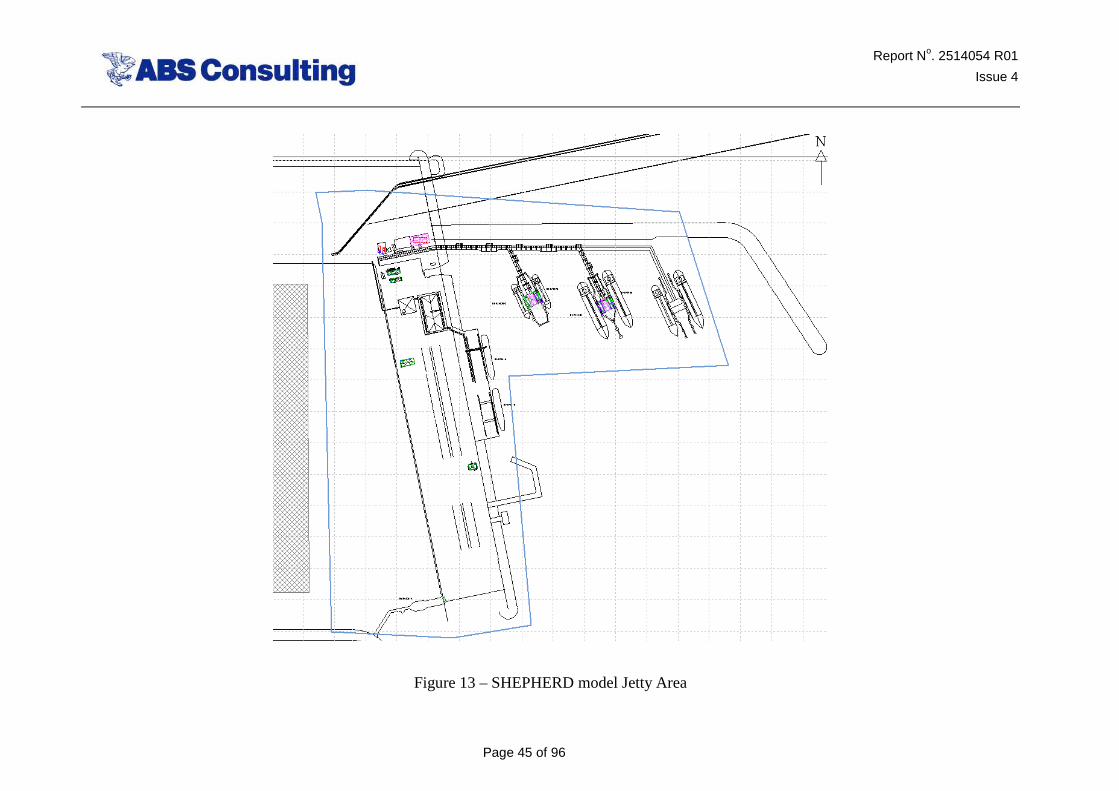
A plot of the SHEPHERD model is given in Figure 12 and Figure 13. The offsite area to the west, South and East are termed areas A, B and C respectively.
Report No. 2514054 R01
Issue 4
Page 44 of 96
Figure 12 – SHEPHERD Model Main Plant
Report No. 2514054 R01
Issue 4
Page 45 of 96
Figure 13 – SHEPHERD model Jetty Area
Report No. 2514054 R01 Issue 4
Page 46 of 96
6.2 SHEPHERD Parameters
6.2.1 Equipment Count and Leak Frequencies
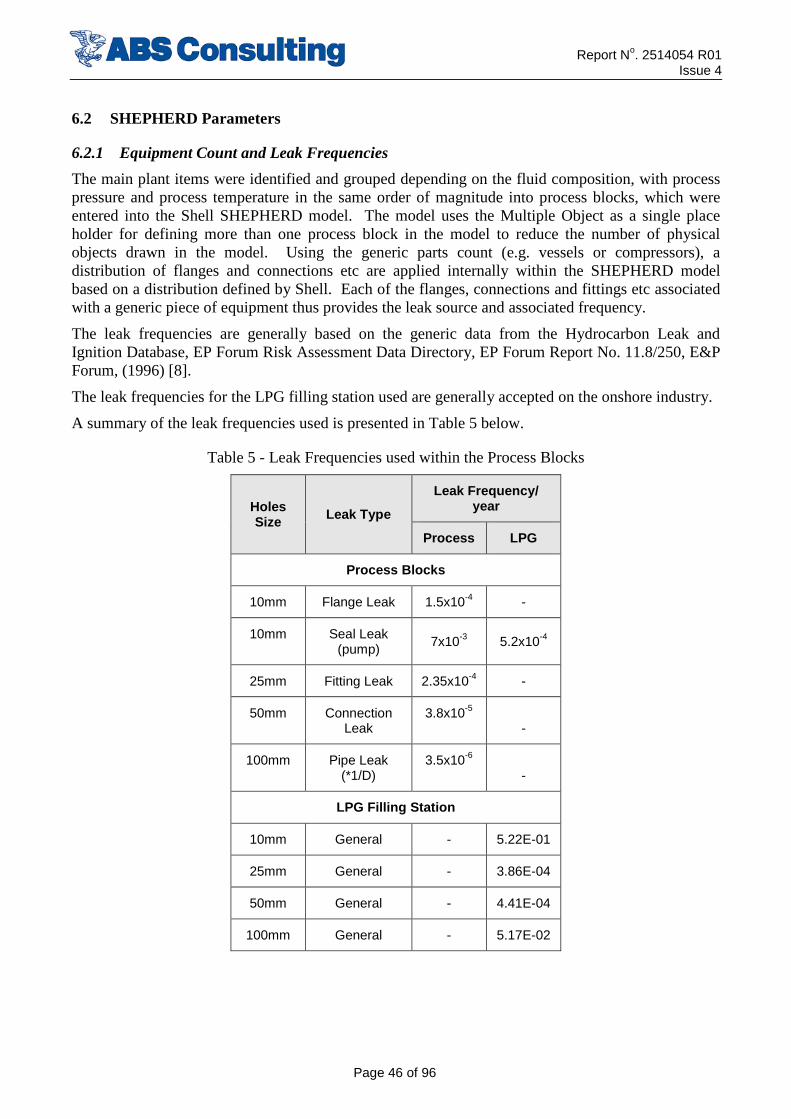
The main plant items were identified and grouped depending on the fluid composition, with process pressure and process temperature in the same order of magnitude into process blocks, which were entered into the Shell SHEPHERD model. The model uses the Multiple Object as a single place holder for defining more than one process block in the model to reduce the number of physical objects drawn in the model. Using the generic parts count (e.g. vessels or compressors), a distribution of flanges and connections etc are applied internally within the SHEPHERD model based on a distribution defined by Shell. Each of the flanges, connections and fittings etc associated with a generic piece of equipment thus provides the leak source and associated frequency.
The leak frequencies are generally based on the generic data from the Hydrocarbon Leak and Ignition Database, EP Forum Risk Assessment Data Directory, EP Forum Report No. 11.8/250, E&P Forum, (1996) [8].
The leak frequencies for the LPG filling station used are generally accepted on the onshore industry.
A summary of the leak frequencies used is presented in Table 5 below.
Table 5 - Leak Frequencies used within the Process Blocks
Holes Size Leak Type
Leak Frequency/ year
Process LPG
Process Blocks
10mm Flange Leak 1.5x10⁻⁴ -
10mm Seal Leak (pump)
7x10⁻³ 5.2x10⁻⁴
25mm Fitting Leak 2.35x10⁻⁴ -
50mm Connection Leak
3.8x10⁻⁵ -
100mm Pipe Leak (*1/D)
3.5x10⁻⁶ -
LPG Filling Station
10mm General - 5.22E-01
25mm General - 3.86E-04
50mm General - 4.41E-04
100mm General - 5.17E-02
Report No. 2514054 R01 Issue 4
Page 47 of 96
6.2.2 Design, Operation & Maintenance Factors
The failure rate data applied in the study represents industry average values, although in order to take plant condition into account within the risk calculation, SHEPHERD allows for the effectiveness of prevention and shutdown measures to be taken into account. Factors including design, operation and maintenance (DOM) are considered. A DOM factor is used by SHEPHERD and is applied to account for the effectiveness of the prevention measures, categorised as high, average or low. In order to obtain a site-specific failure frequency, the “average” value is modified using the input DOM factor. In selecting a “low” effectiveness, the failure frequency is multiplied by the DOM factor and divided by the DOM factor for “high” effectiveness. Hence selecting the “average” does not change the failure frequency value.
For the base case quantitative risk assessment, the effectiveness of the design, operation and maintenance was assumed to be average. Therefore, the industry average failure rate data was used.
6.2.3 Probability of Emergency Shutdown
Inventory isolation time (response time) is assumed to be 20 minutes after start of a release except for the RFCC for which inventory isolation within 5 minutes with a 50% probability and isolation following fire detection with a probability of 80% is assumed. This assumption affects the only the escalation potential, all the releases are modelled.
6.2.4 Building Performance
A number of studies have sought to generate guidance on building damage and collapse, and consequent fatality rates, for different categories of buildings. Some studies have considered both the overpressure and impulse resulting from the explosion, while others have only correlated the effects against the overpressure. Analytical tools have also been developed to assist with this analysis. The work reported here is based on the results of the 1995 Petroleum and Chemical Processing Industry Technology Co-operative report on Conventional Building Blast Performance Capabilities.
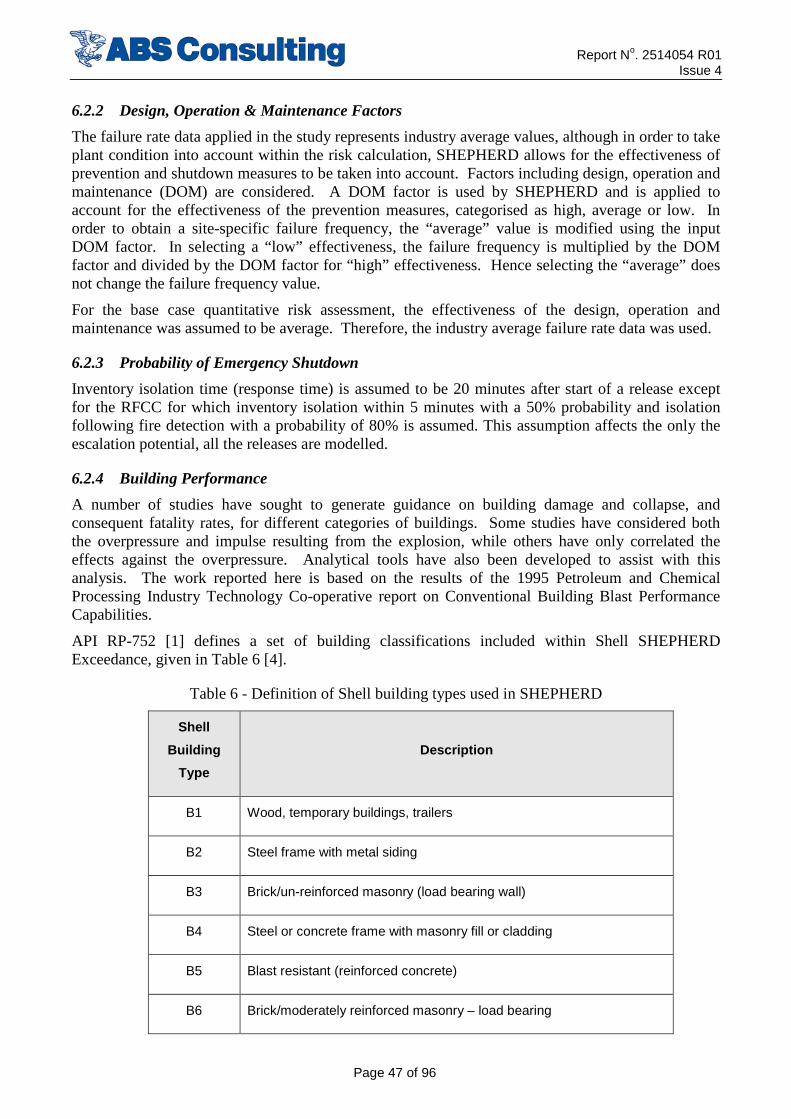
API RP-752 [1] defines a set of building classifications included within Shell SHEPHERD Exceedance, given in Table 6 [4].
Table 6 - Definition of Shell building types used in SHEPHERD
Shell
Building
Type
Description
B1 Wood, temporary buildings, trailers
B2 Steel frame with metal siding
B3 Brick/un-reinforced masonry (load bearing wall)
B4 Steel or concrete frame with masonry fill or cladding
B5 Blast resistant (reinforced concrete)
B6 Brick/moderately reinforced masonry – load bearing
Report No. 2514054 R01 Issue 4
Page 48 of 96
Shell
Building
Type
Description
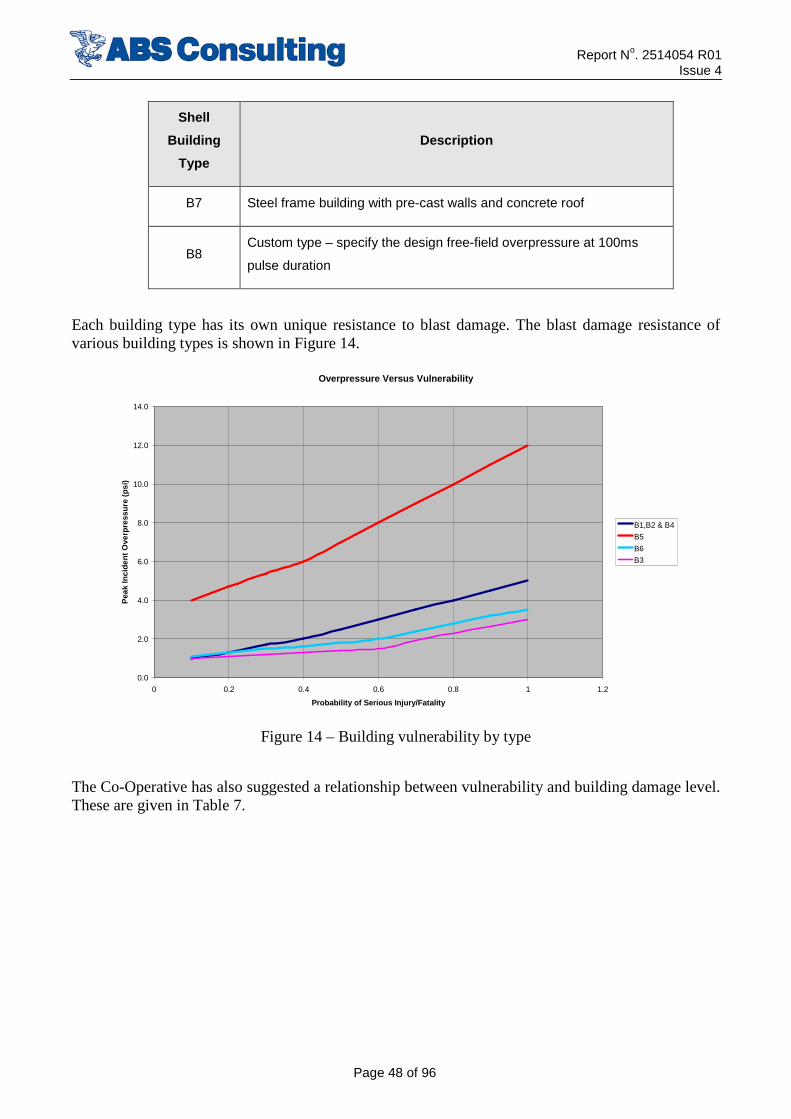
B7 Steel frame building with pre-cast walls and concrete roof
B8 Custom type – specify the design free-field overpressure at 100ms
pulse duration
Each building type has its own unique resistance to blast damage. The blast damage resistance of various building types is shown in Figure 14.
Overpressure Versus Vulnerability
0.0
2.0
4.0
6.0
8.0
10.0
12.0
14.0
0 0.2 0.4 0.6 0.8 1 1.2
Probability of Serious Injury/Fatality
Pea
k In
cid
ent
Ove
rpre
ssu
re (
psi
)
B1,B2 & B4
B5
B6
B3
Figure 14 – Building vulnerability by type
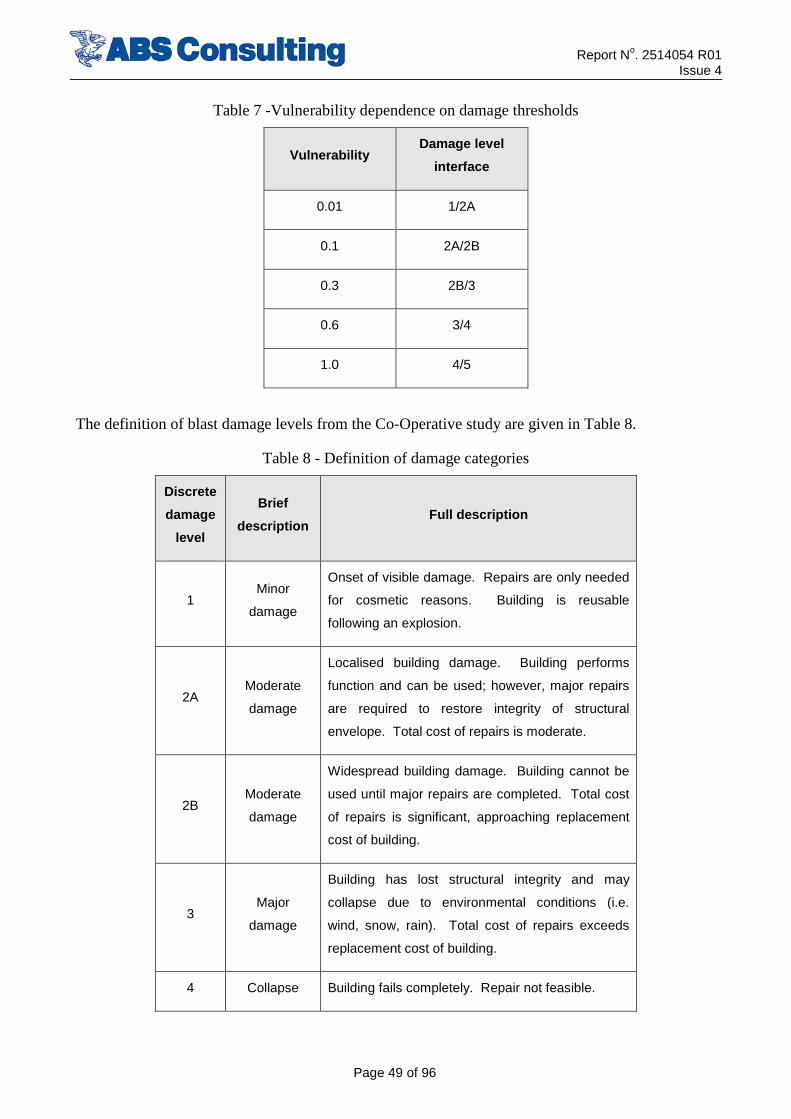
The Co-Operative has also suggested a relationship between vulnerability and building damage level. These are given in Table 7.
Report No. 2514054 R01 Issue 4
Page 49 of 96
Table 7 -Vulnerability dependence on damage thresholds
Vulnerability Damage level
interface
0.01 1/2A
0.1 2A/2B
0.3 2B/3
0.6 3/4
1.0 4/5
The definition of blast damage levels from the Co-Operative study are given in Table 8.
Table 8 - Definition of damage categories
Discrete
damage
level
Brief
description Full description
1 Minor
damage
Onset of visible damage. Repairs are only needed
for cosmetic reasons. Building is reusable
following an explosion.
2A Moderate
damage
Localised building damage. Building performs
function and can be used; however, major repairs
are required to restore integrity of structural
envelope. Total cost of repairs is moderate.
2B Moderate
damage
Widespread building damage. Building cannot be
used until major repairs are completed. Total cost
of repairs is significant, approaching replacement
cost of building.
3 Major
damage
Building has lost structural integrity and may
collapse due to environmental conditions (i.e.
wind, snow, rain). Total cost of repairs exceeds
replacement cost of building.
4 Collapse Building fails completely. Repair not feasible.
Report No. 2514054 R01 Issue 4
Page 50 of 96
Discrete
damage
level
Brief
description Full description
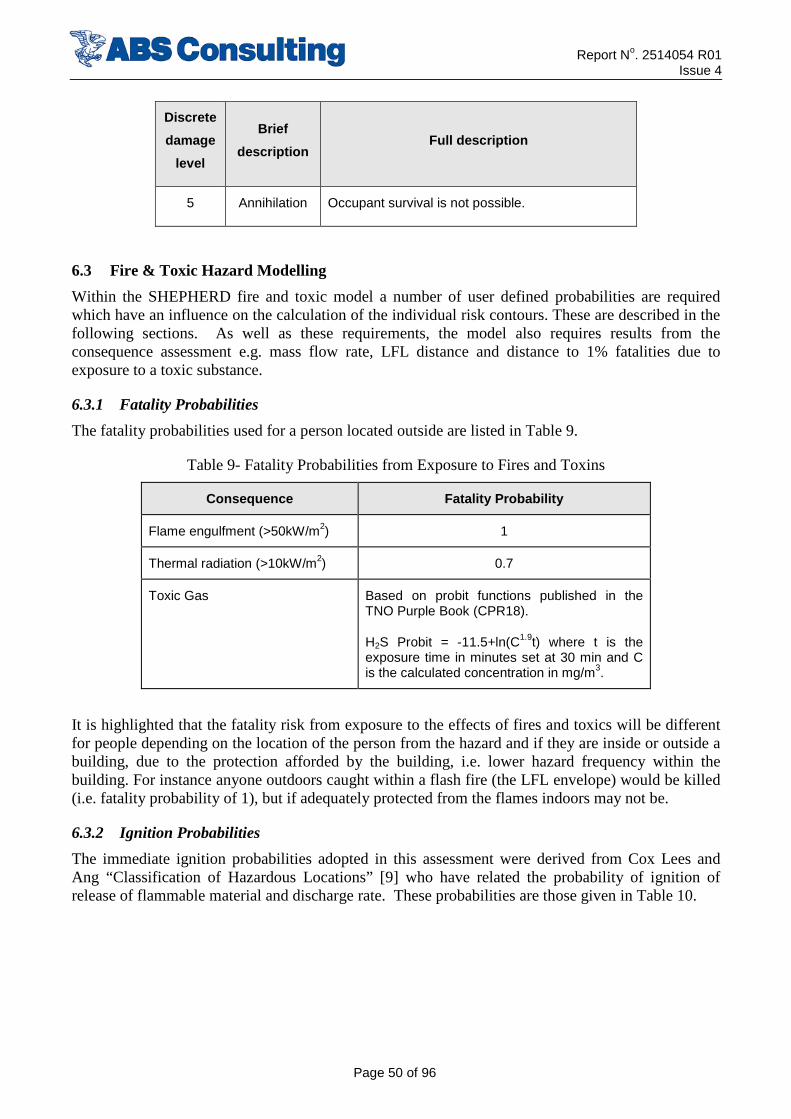
5 Annihilation Occupant survival is not possible.
6.3 Fire & Toxic Hazard Modelling
Within the SHEPHERD fire and toxic model a number of user defined probabilities are required which have an influence on the calculation of the individual risk contours. These are described in the following sections. As well as these requirements, the model also requires results from the consequence assessment e.g. mass flow rate, LFL distance and distance to 1% fatalities due to exposure to a toxic substance.
6.3.1 Fatality Probabilities
The fatality probabilities used for a person located outside are listed in Table 9.
Table 9- Fatality Probabilities from Exposure to Fires and Toxins
Consequence Fatality Probability
Flame engulfment (>50kW/m2) 1
Thermal radiation (>10kW/m2) 0.7
Toxic Gas Based on probit functions published in the TNO Purple Book (CPR18).
H2S Probit = -11.5+ln(C1.9t) where t is the exposure time in minutes set at 30 min and C is the calculated concentration in mg/m3.
It is highlighted that the fatality risk from exposure to the effects of fires and toxics will be different for people depending on the location of the person from the hazard and if they are inside or outside a building, due to the protection afforded by the building, i.e. lower hazard frequency within the building. For instance anyone outdoors caught within a flash fire (the LFL envelope) would be killed (i.e. fatality probability of 1), but if adequately protected from the flames indoors may not be.
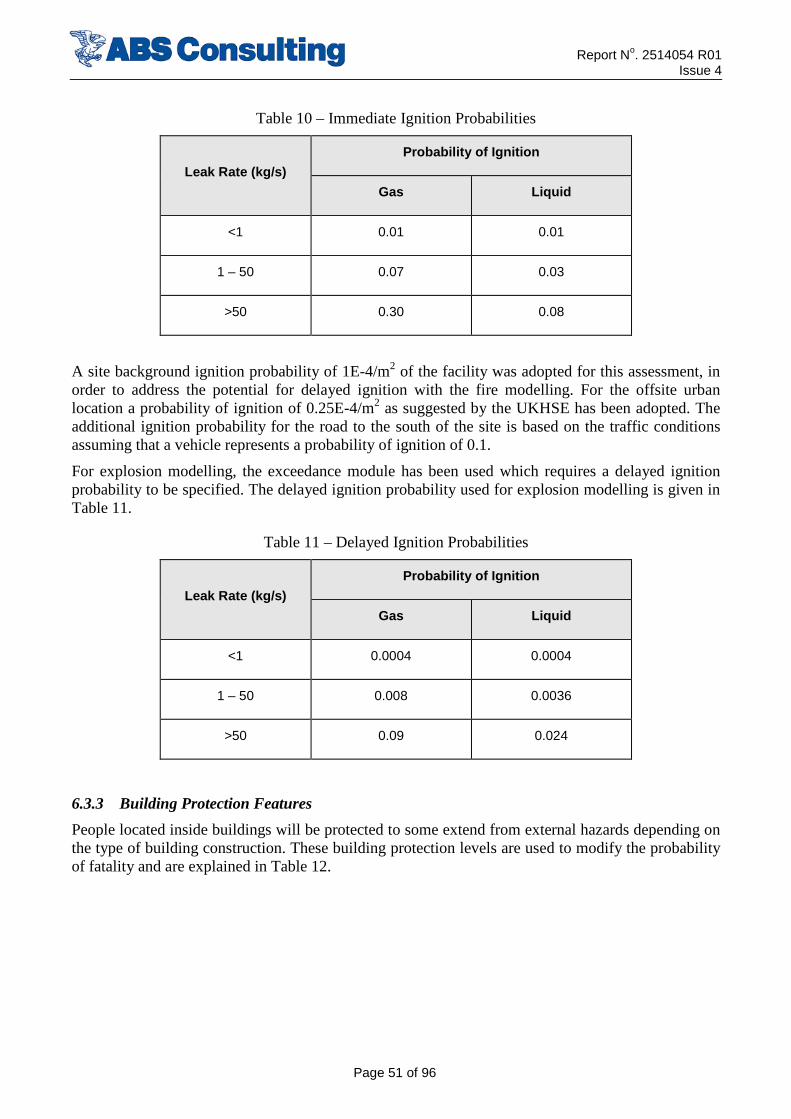
6.3.2 Ignition Probabilities
The immediate ignition probabilities adopted in this assessment were derived from Cox Lees and Ang “Classification of Hazardous Locations” [9] who have related the probability of ignition of release of flammable material and discharge rate. These probabilities are those given in Table 10.
Report No. 2514054 R01 Issue 4
Page 51 of 96
Table 10 – Immediate Ignition Probabilities
Leak Rate (kg/s)
Probability of Ignition
Gas Liquid
<1 0.01 0.01
1 – 50 0.07 0.03
>50 0.30 0.08
A site background ignition probability of 1E-4/m2 of the facility was adopted for this assessment, in order to address the potential for delayed ignition with the fire modelling. For the offsite urban location a probability of ignition of 0.25E-4/m2 as suggested by the UKHSE has been adopted. The additional ignition probability for the road to the south of the site is based on the traffic conditions assuming that a vehicle represents a probability of ignition of 0.1.
For explosion modelling, the exceedance module has been used which requires a delayed ignition probability to be specified. The delayed ignition probability used for explosion modelling is given in Table 11.
Table 11 – Delayed Ignition Probabilities
Leak Rate (kg/s)
Probability of Ignition
Gas Liquid
<1 0.0004 0.0004
1 – 50 0.008 0.0036
>50 0.09 0.024
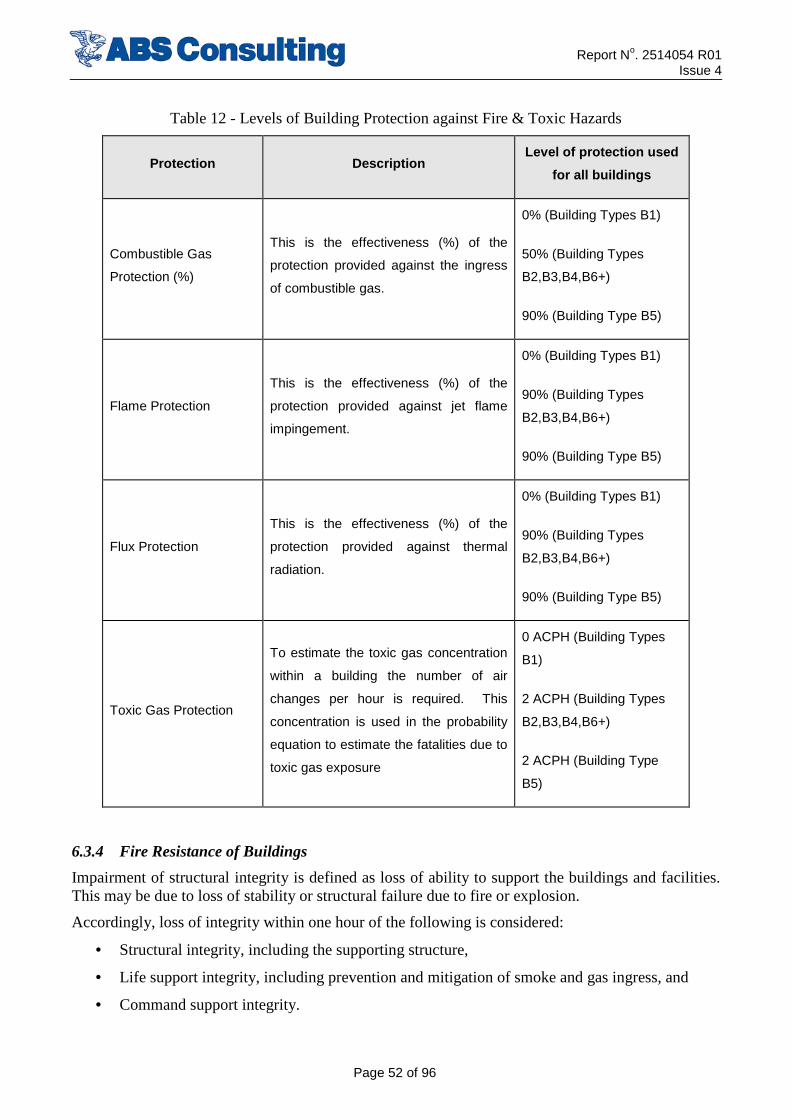
6.3.3 Building Protection Features
People located inside buildings will be protected to some extend from external hazards depending on the type of building construction. These building protection levels are used to modify the probability of fatality and are explained in Table 12.
Report No. 2514054 R01 Issue 4
Page 52 of 96
Table 12 - Levels of Building Protection against Fire & Toxic Hazards
Protection Description Level of protection used
for all buildings
Combustible Gas
Protection (%)
This is the effectiveness (%) of the
protection provided against the ingress
of combustible gas.
0% (Building Types B1)
50% (Building Types
B2,B3,B4,B6+)
90% (Building Type B5)
Flame Protection
This is the effectiveness (%) of the
protection provided against jet flame
impingement.
0% (Building Types B1)
90% (Building Types
B2,B3,B4,B6+)
90% (Building Type B5)
Flux Protection
This is the effectiveness (%) of the
protection provided against thermal
radiation.
0% (Building Types B1)
90% (Building Types
B2,B3,B4,B6+)
90% (Building Type B5)
Toxic Gas Protection
To estimate the toxic gas concentration
within a building the number of air
changes per hour is required. This
concentration is used in the probability
equation to estimate the fatalities due to
toxic gas exposure
0 ACPH (Building Types
B1)
2 ACPH (Building Types
B2,B3,B4,B6+)
2 ACPH (Building Type
B5)
6.3.4 Fire Resistance of Buildings
Impairment of structural integrity is defined as loss of ability to support the buildings and facilities. This may be due to loss of stability or structural failure due to fire or explosion.
Accordingly, loss of integrity within one hour of the following is considered:
• Structural integrity, including the supporting structure,
• Life support integrity, including prevention and mitigation of smoke and gas ingress, and
• Command support integrity.
Report No. 2514054 R01 Issue 4
Page 53 of 96
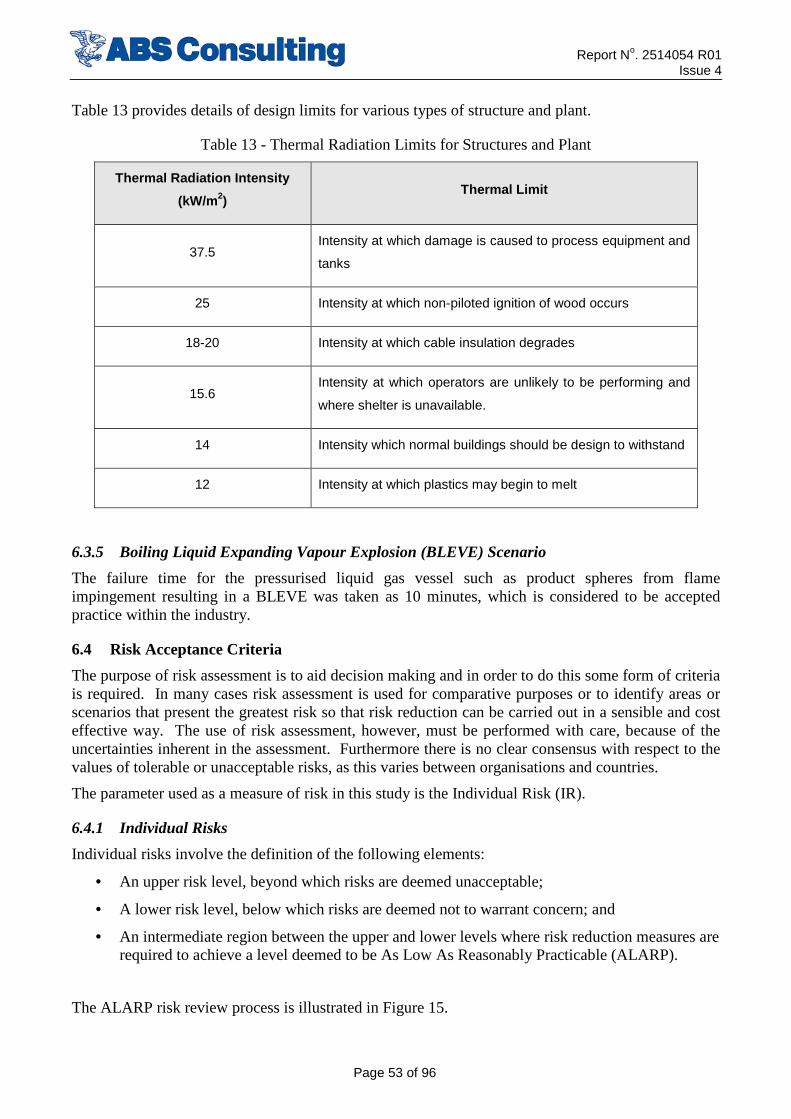
Table 13 provides details of design limits for various types of structure and plant.
Table 13 - Thermal Radiation Limits for Structures and Plant
Thermal Radiation Intensity
(kW/m2) Thermal Limit
37.5 Intensity at which damage is caused to process equipment and
tanks
25 Intensity at which non-piloted ignition of wood occurs
18-20 Intensity at which cable insulation degrades
15.6 Intensity at which operators are unlikely to be performing and
where shelter is unavailable.
14 Intensity which normal buildings should be design to withstand
12 Intensity at which plastics may begin to melt
6.3.5 Boiling Liquid Expanding Vapour Explosion (BLEVE) Scenario
The failure time for the pressurised liquid gas vessel such as product spheres from flame impingement resulting in a BLEVE was taken as 10 minutes, which is considered to be accepted practice within the industry.
6.4 Risk Acceptance Criteria
The purpose of risk assessment is to aid decision making and in order to do this some form of criteria is required. In many cases risk assessment is used for comparative purposes or to identify areas or scenarios that present the greatest risk so that risk reduction can be carried out in a sensible and cost effective way. The use of risk assessment, however, must be performed with care, because of the uncertainties inherent in the assessment. Furthermore there is no clear consensus with respect to the values of tolerable or unacceptable risks, as this varies between organisations and countries.
The parameter used as a measure of risk in this study is the Individual Risk (IR).
6.4.1 Individual Risks
Individual risks involve the definition of the following elements:
• An upper risk level, beyond which risks are deemed unacceptable;
• A lower risk level, below which risks are deemed not to warrant concern; and
• An intermediate region between the upper and lower levels where risk reduction measures are required to achieve a level deemed to be As Low As Reasonably Practicable (ALARP).
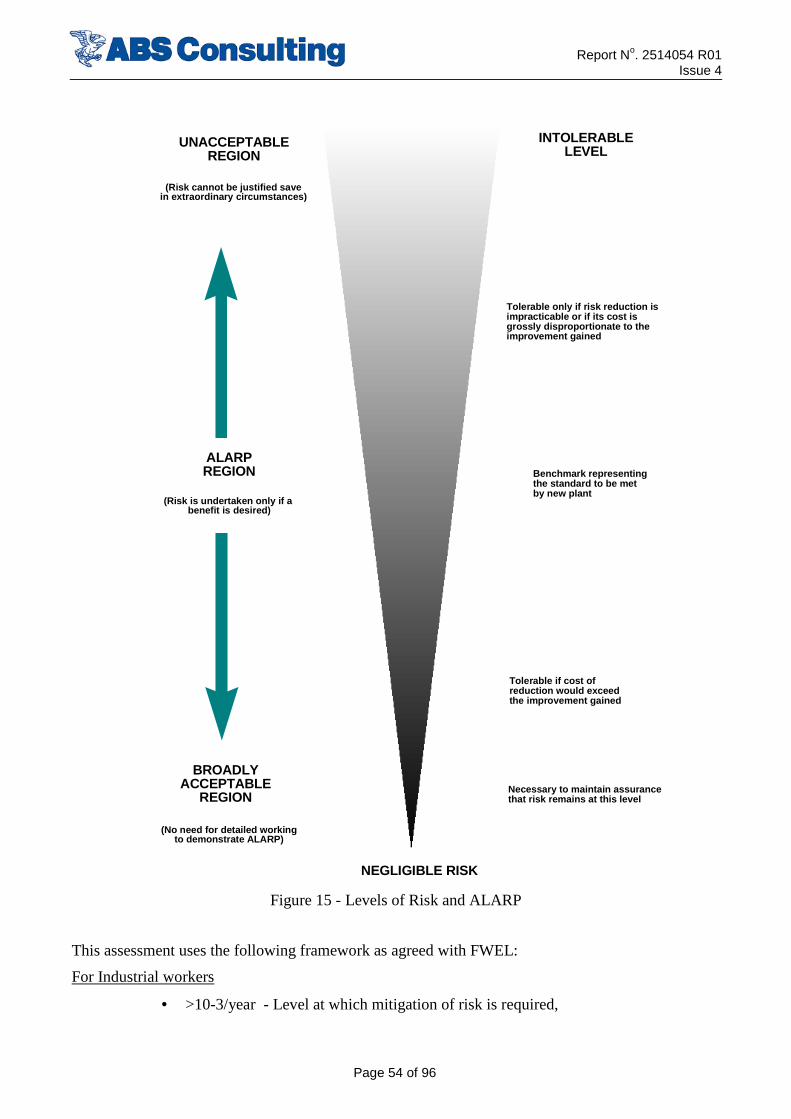
The ALARP risk review process is illustrated in Figure 15.
Report No. 2514054 R01 Issue 4
Page 54 of 96
Tolerable only if risk reduction is impracticable or if its cost is grossly disproportionate to the improvement gained
Benchmark representingthe standard to be metby new plant
(Risk is undertaken only if a benefit is desired)
(Risk cannot be justified savein extraordinary circumstances)
(No need for detailed workingto demonstrate ALARP)
Tolerable if cost ofreduction would exceedthe improvement gained
Necessary to maintain assurance that risk remains at this level
BROADLYACCEPTABLE
REGION
NEGLIGIBLE RISK
ALARPREGION
UNACCEPTABLEREGION
INTOLERABLELEVEL
Figure 15 - Levels of Risk and ALARP
This assessment uses the following framework as agreed with FWEL:
For Industrial workers
• >10-3/year - Level at which mitigation of risk is required,
Report No. 2514054 R01 Issue 4
Page 55 of 96
• >10-3/year but <10-5/year - Level at which risk reduction should be considered (i.e. ALARP region),
• <10-5/year - Level at which further risk reduction need not be considered.
For general population
• >10-4/year - Level at which mitigation of risk is required,
• >10-4/year but <10-6/year - Level at which risk reduction should be considered (i.e. ALARP region),
<10-6/year - Level at which further risk reduction need not be considered
6.5 Evaluation of Building Risks
6.5.1 Explosion Risks
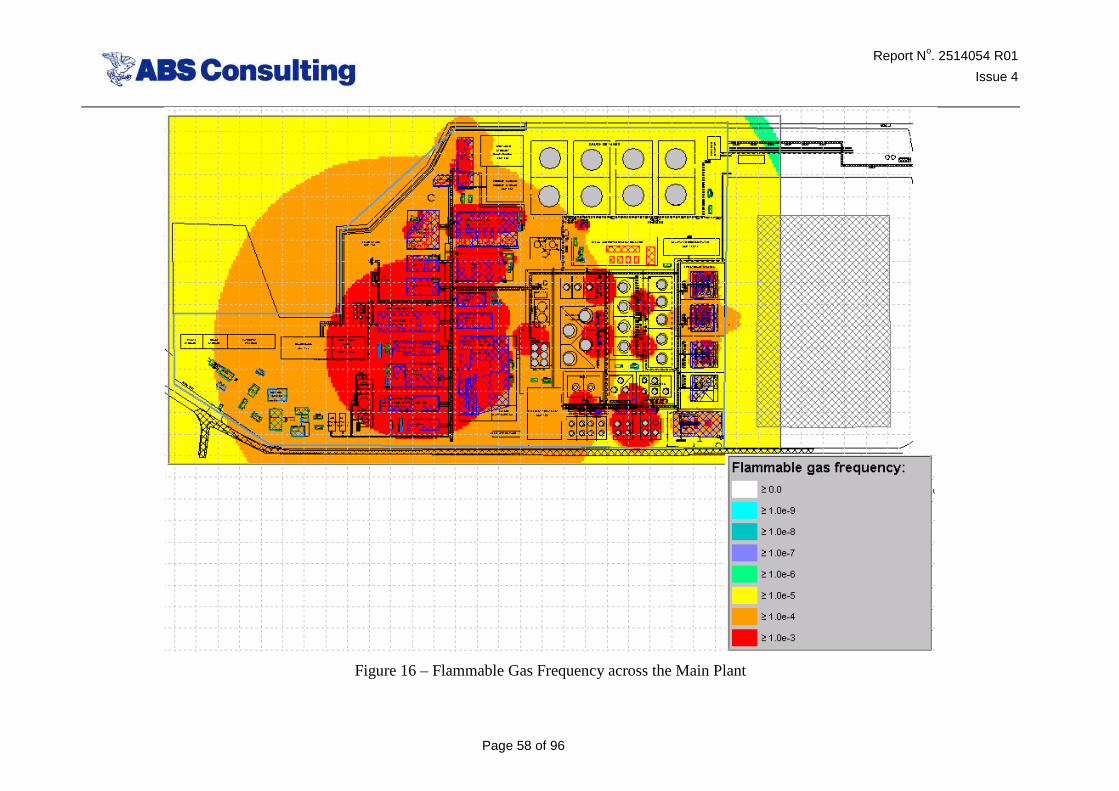
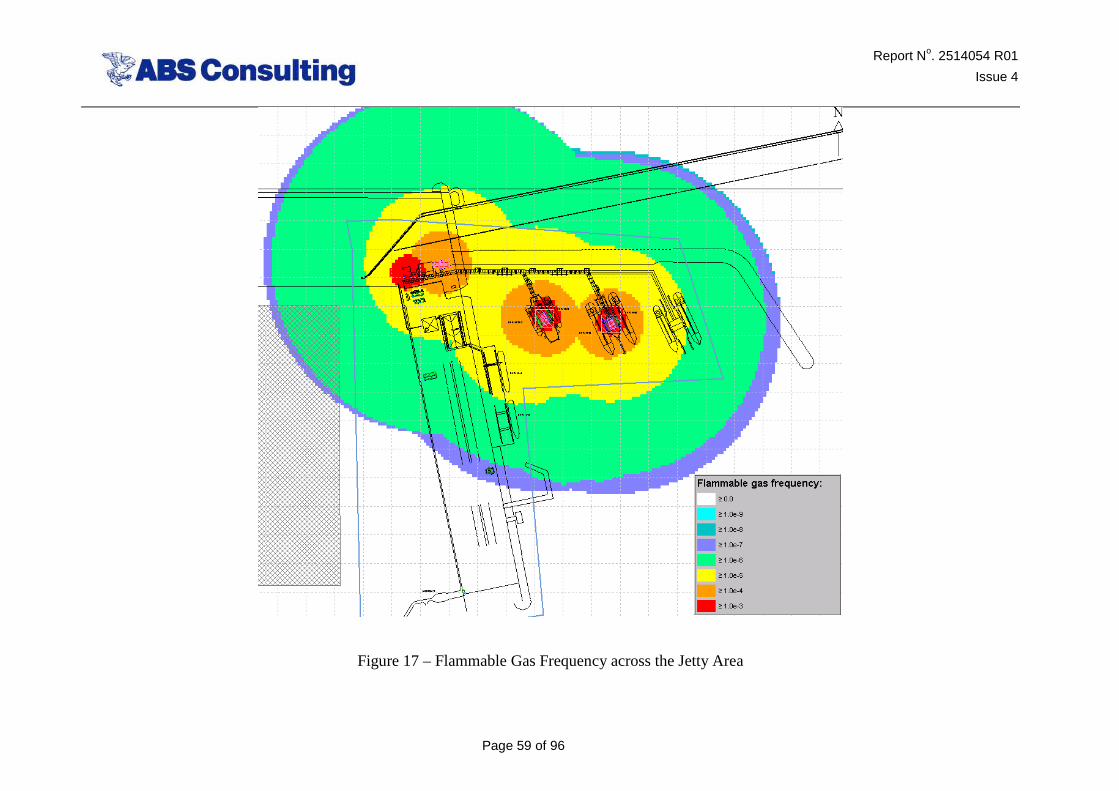
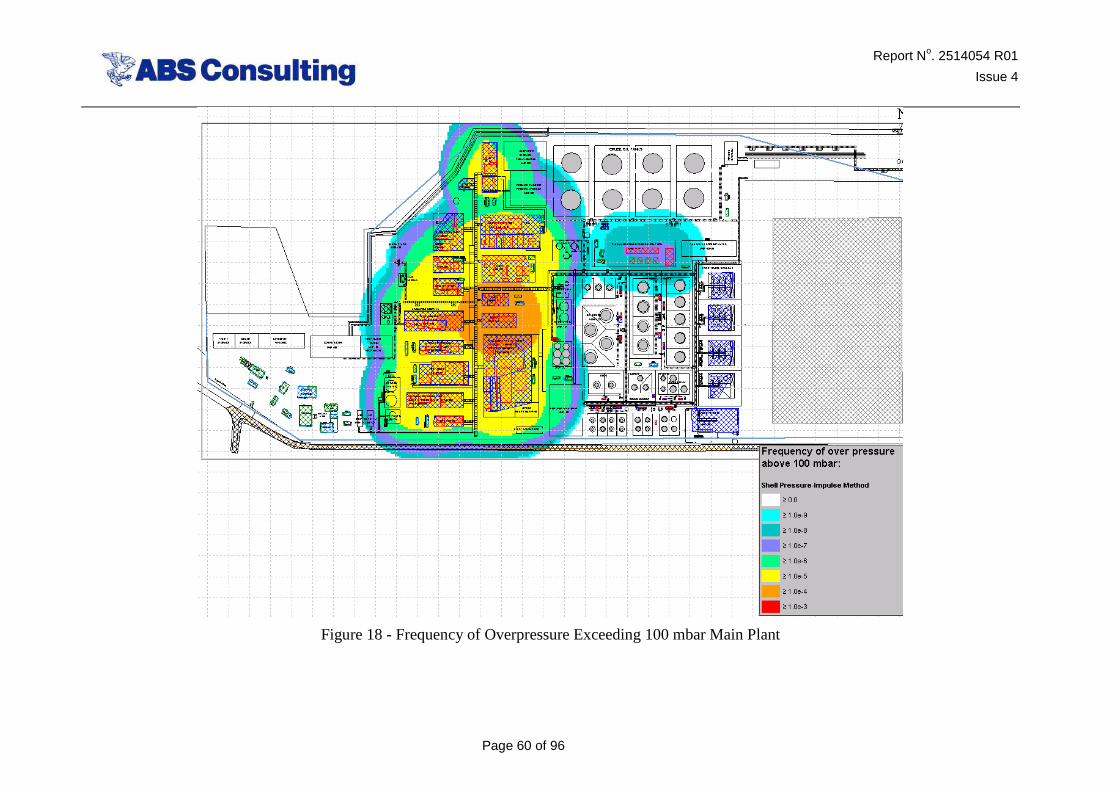
The flammable gas frequency for the site is shown in Figure 16 and Figure 17. Figure 18 to Figure 21 show the frequency of exceeding an overpressure of 100 mbar and 30 mbar respectively.
The explosion risk to the workers is dependent on the protection afforded by various building as is thus dependent on building types. Figure 22 and Figure 23, Figure 24 and Figure 25, Figure 26 and Figure 27 show the explosion risks to building types B2, B4 and B5 respectively.
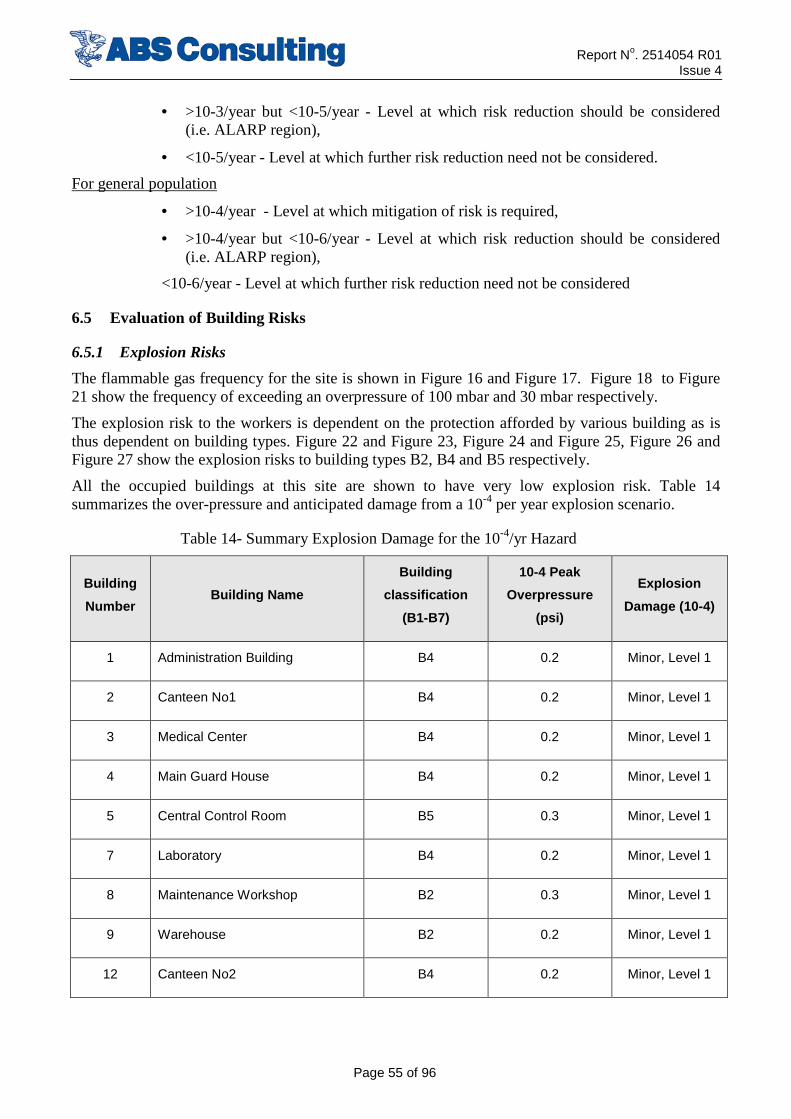
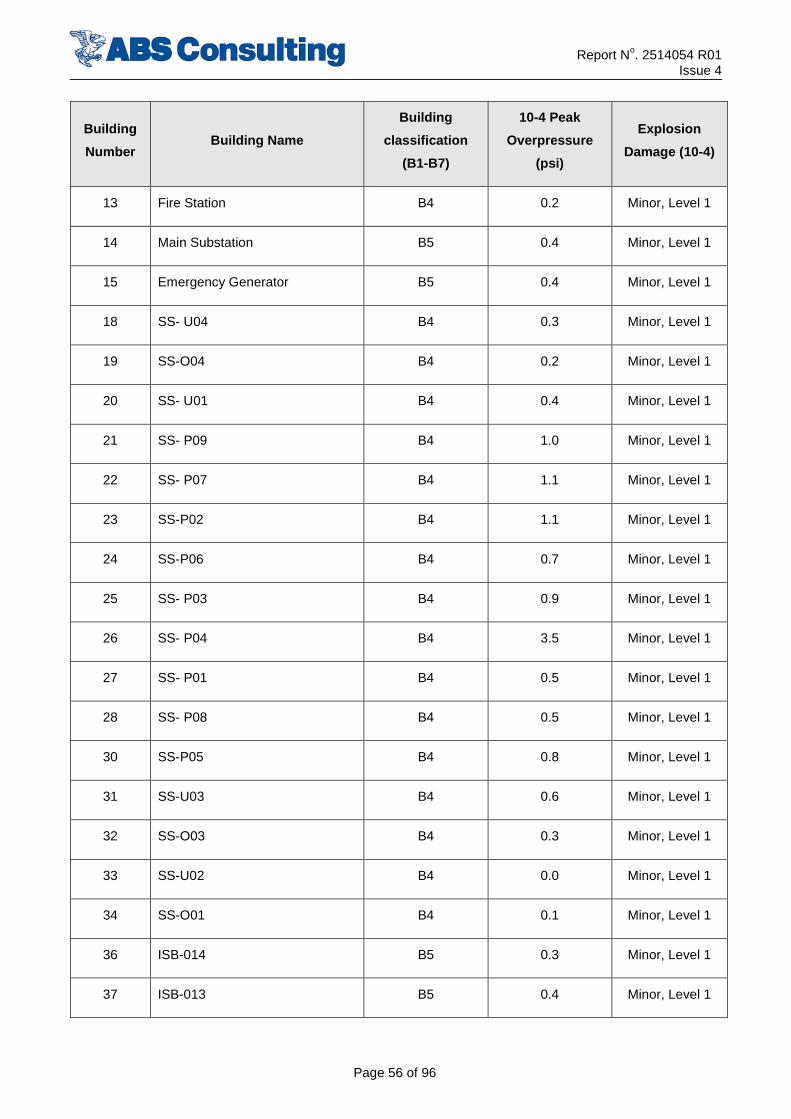
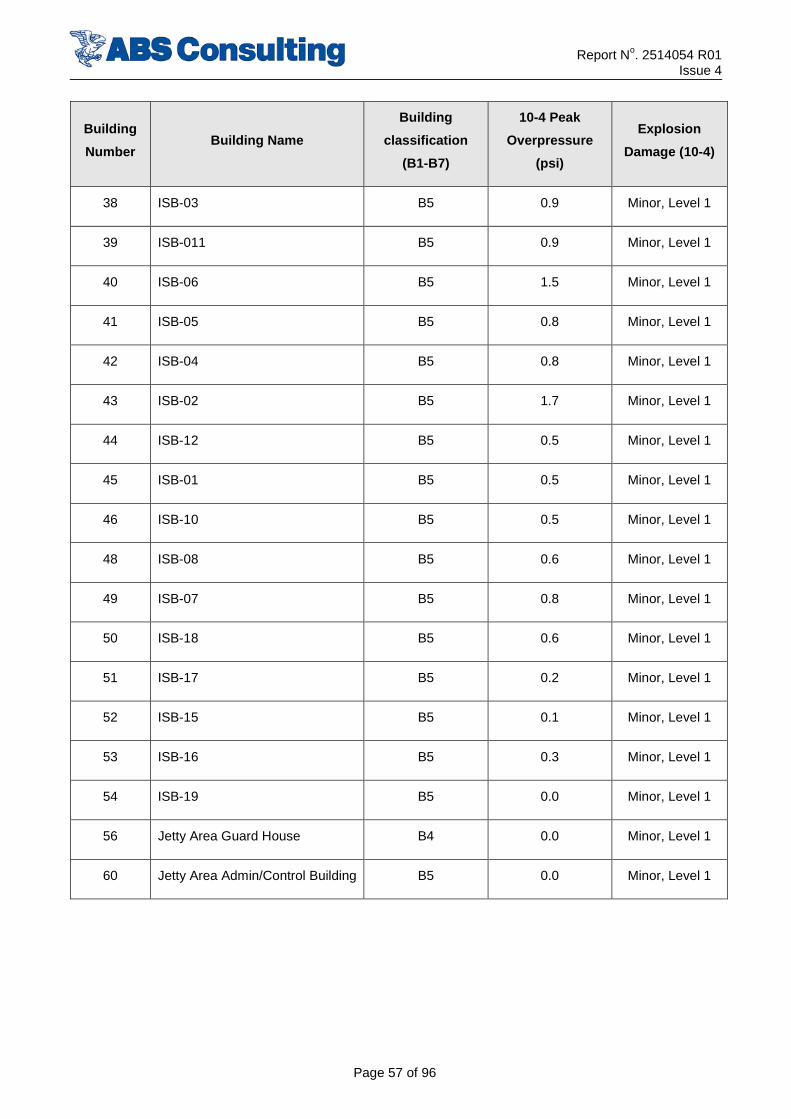
All the occupied buildings at this site are shown to have very low explosion risk. Table 14 summarizes the over-pressure and anticipated damage from a 10-4 per year explosion scenario.
Table 14- Summary Explosion Damage for the 10-4/yr Hazard
Building
Number Building Name
Building
classification
(B1-B7)
10-4 Peak
Overpressure
(psi)
Explosion
Damage (10-4)
1 Administration Building B4 0.2 Minor, Level 1
2 Canteen No1 B4 0.2 Minor, Level 1
3 Medical Center B4 0.2 Minor, Level 1
4 Main Guard House B4 0.2 Minor, Level 1
5 Central Control Room B5 0.3 Minor, Level 1
7 Laboratory B4 0.2 Minor, Level 1
8 Maintenance Workshop B2 0.3 Minor, Level 1
9 Warehouse B2 0.2 Minor, Level 1
12 Canteen No2 B4 0.2 Minor, Level 1
Report No. 2514054 R01 Issue 4
Page 56 of 96
Building
Number Building Name
Building
classification
(B1-B7)
10-4 Peak
Overpressure
(psi)
Explosion
Damage (10-4)
13 Fire Station B4 0.2 Minor, Level 1
14 Main Substation B5 0.4 Minor, Level 1
15 Emergency Generator B5 0.4 Minor, Level 1
18 SS- U04 B4 0.3 Minor, Level 1
19 SS-O04 B4 0.2 Minor, Level 1
20 SS- U01 B4 0.4 Minor, Level 1
21 SS- P09 B4 1.0 Minor, Level 1
22 SS- P07 B4 1.1 Minor, Level 1
23 SS-P02 B4 1.1 Minor, Level 1
24 SS-P06 B4 0.7 Minor, Level 1
25 SS- P03 B4 0.9 Minor, Level 1
26 SS- P04 B4 3.5 Minor, Level 1
27 SS- P01 B4 0.5 Minor, Level 1
28 SS- P08 B4 0.5 Minor, Level 1
30 SS-P05 B4 0.8 Minor, Level 1
31 SS-U03 B4 0.6 Minor, Level 1
32 SS-O03 B4 0.3 Minor, Level 1
33 SS-U02 B4 0.0 Minor, Level 1
34 SS-O01 B4 0.1 Minor, Level 1
36 ISB-014 B5 0.3 Minor, Level 1
37 ISB-013 B5 0.4 Minor, Level 1
Report No. 2514054 R01 Issue 4
Page 57 of 96
Building
Number Building Name
Building
classification
(B1-B7)
10-4 Peak
Overpressure
(psi)
Explosion
Damage (10-4)
38 ISB-03 B5 0.9 Minor, Level 1
39 ISB-011 B5 0.9 Minor, Level 1
40 ISB-06 B5 1.5 Minor, Level 1
41 ISB-05 B5 0.8 Minor, Level 1
42 ISB-04 B5 0.8 Minor, Level 1
43 ISB-02 B5 1.7 Minor, Level 1
44 ISB-12 B5 0.5 Minor, Level 1
45 ISB-01 B5 0.5 Minor, Level 1
46 ISB-10 B5 0.5 Minor, Level 1
48 ISB-08 B5 0.6 Minor, Level 1
49 ISB-07 B5 0.8 Minor, Level 1
50 ISB-18 B5 0.6 Minor, Level 1
51 ISB-17 B5 0.2 Minor, Level 1
52 ISB-15 B5 0.1 Minor, Level 1
53 ISB-16 B5 0.3 Minor, Level 1
54 ISB-19 B5 0.0 Minor, Level 1
56 Jetty Area Guard House B4 0.0 Minor, Level 1
60 Jetty Area Admin/Control Building B5 0.0 Minor, Level 1
Report No. 2514054 R01
Issue 4
Page 58 of 96
Figure 16 – Flammable Gas Frequency across the Main Plant
Report No. 2514054 R01
Issue 4
Page 59 of 96
Figure 17 – Flammable Gas Frequency across the Jetty Area
Report No. 2514054 R01
Issue 4
Page 60 of 96
Figure 18 - Frequency of Overpressure Exceeding 100 mbar Main Plant
Report No. 2514054 R01
Issue 4
Page 61 of 96
Figure 19 - Frequency of Overpressure Exceeding 100 mbar Jetty Area
Report No. 2514054 R01
Issue 4
Page 62 of 96
Figure 20 - Frequency of Overpressure Exceeding 30 mbar Main Plant
Report No. 2514054 R01
Issue 4
Page 63 of 96
Figure 21 - Frequency of Overpressure Exceeding 30 mbar Jetty Area
Report No. 2514054 R01
Issue 4
Page 64 of 96
Figure 22 - Explosion Risk Plot for Building Type B2 Main Plant
Report No. 2514054 R01
Issue 4
Page 65 of 96
Figure 23 - Explosion Risk Plot for Building Type B2 Jetty Area
Report No. 2514054 R01
Issue 4
Page 66 of 96
Figure 24 - Explosion Risk Plot for Building Type B4 Main Plant
Report No. 2514054 R01
Issue 4
Page 67 of 96
Figure 25 - Explosion Risk Plot for Building Type B4 Jetty Area
Report No. 2514054 R01
Issue 4
Page 68 of 96
Figure 26 - Explosion Risk Plot for Building Type B5 Main Plant
Report No. 2514054 R01
Issue 4
Page 69 of 96
Figure 27 - Explosion Risk Plot for Building Type B5 Jetty Area

Report No. 2514054 R01 Issue 4
Page 70 of 96
6.5.2 Fire Risk
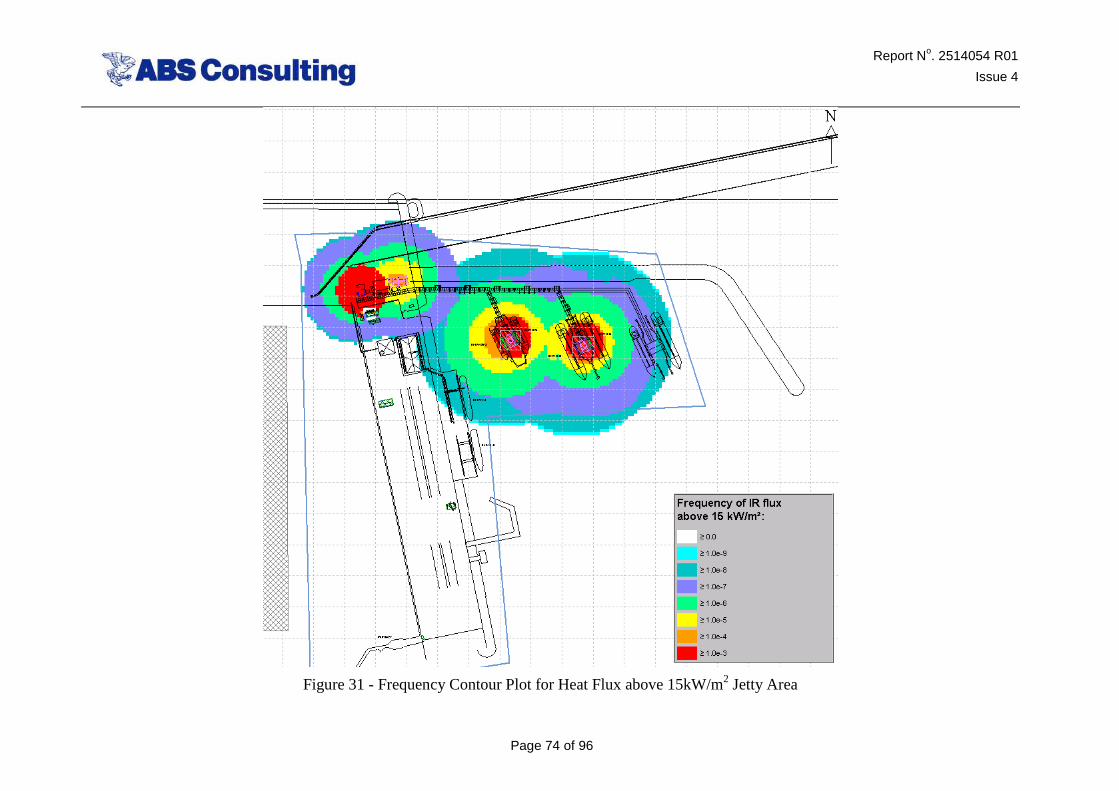
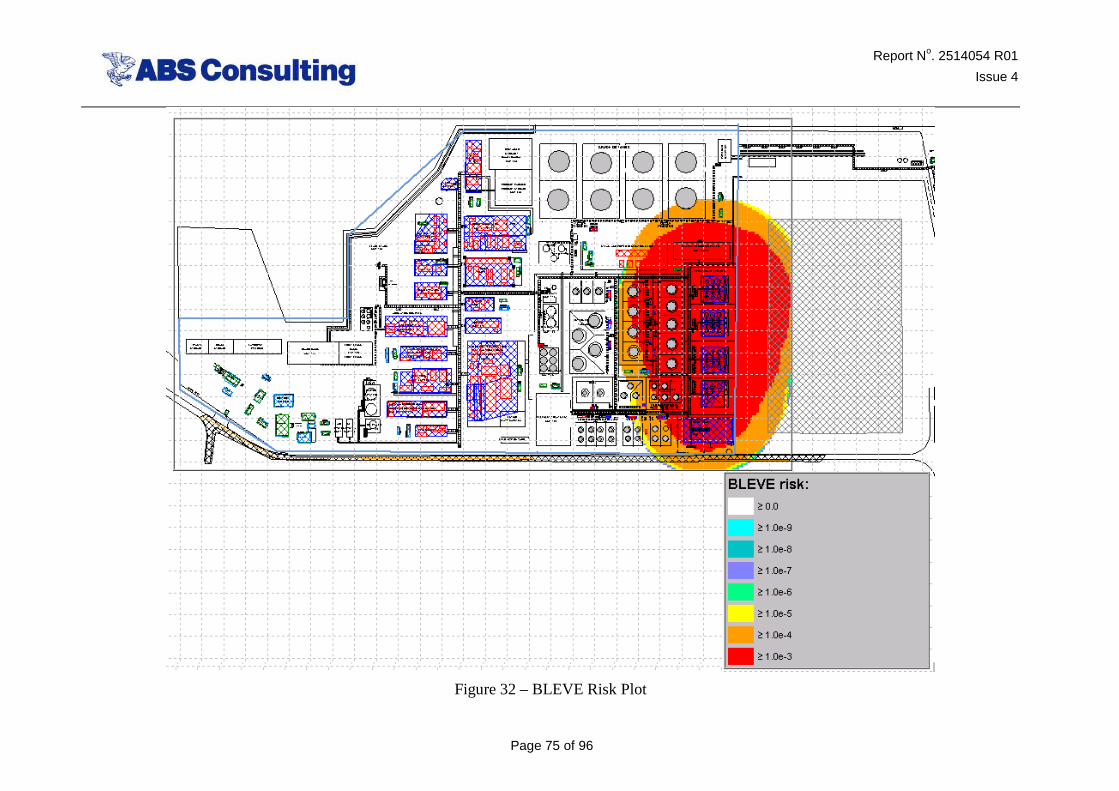
The frequency of cloud fire, frequency contour plots for heat flux exceeding 15kW/m2 and BLEVE frequency plots are shown in Figure 28, Figure 29, Figure 30, Figure 31 and Figure 32 respectively.
Report No. 2514054 R01
Issue 4
Page 71 of 96
Figure 28 - Cloud Fire Frequency Contour Plot Main Plant
Report No. 2514054 R01
Issue 4
Page 72 of 96
Figure 29 - Cloud Fire Frequency Contour Plot Jetty Area
Report No. 2514054 R01
Issue 4
Page 73 of 96
Figure 30 - Frequency Contour Plot for Heat Flux above 15kW/m2 Main Plant
Report No. 2514054 R01
Issue 4
Page 74 of 96
Figure 31 - Frequency Contour Plot for Heat Flux above 15kW/m2 Jetty Area
Report No. 2514054 R01
Issue 4
Page 75 of 96
Figure 32 – BLEVE Risk Plot
Report No. 2514054 R01 Issue 4
Page 76 of 96
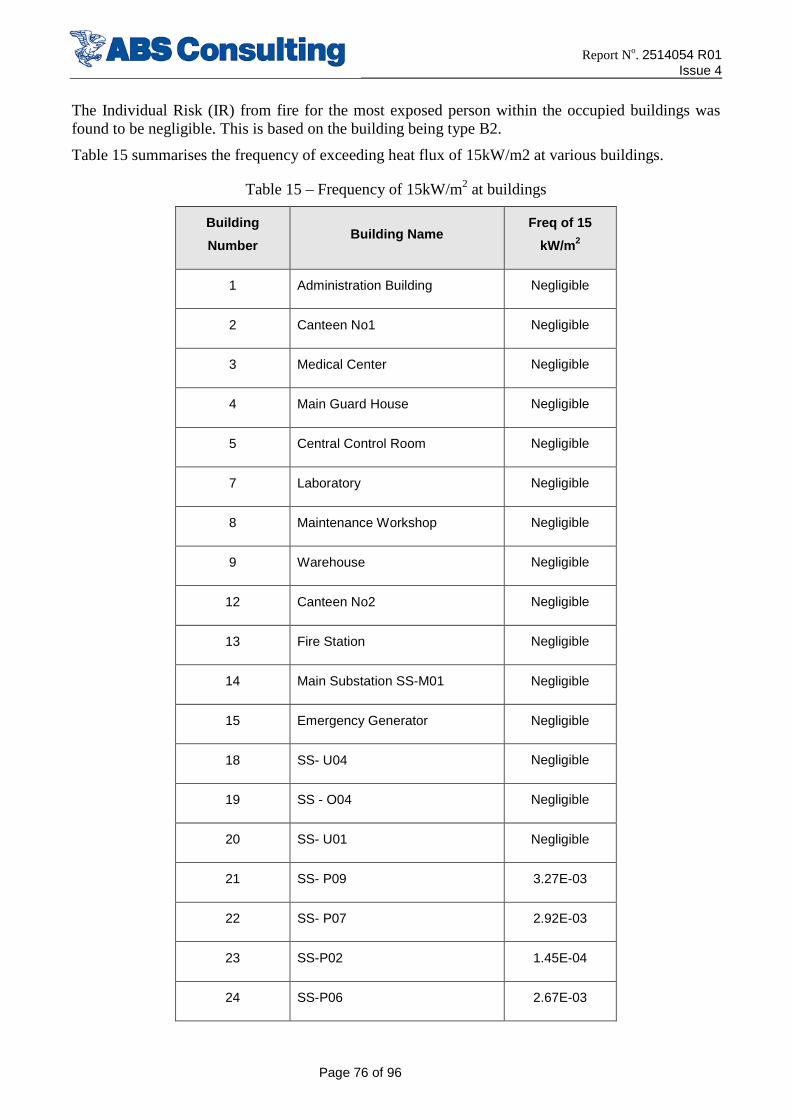
The Individual Risk (IR) from fire for the most exposed person within the occupied buildings was found to be negligible. This is based on the building being type B2.
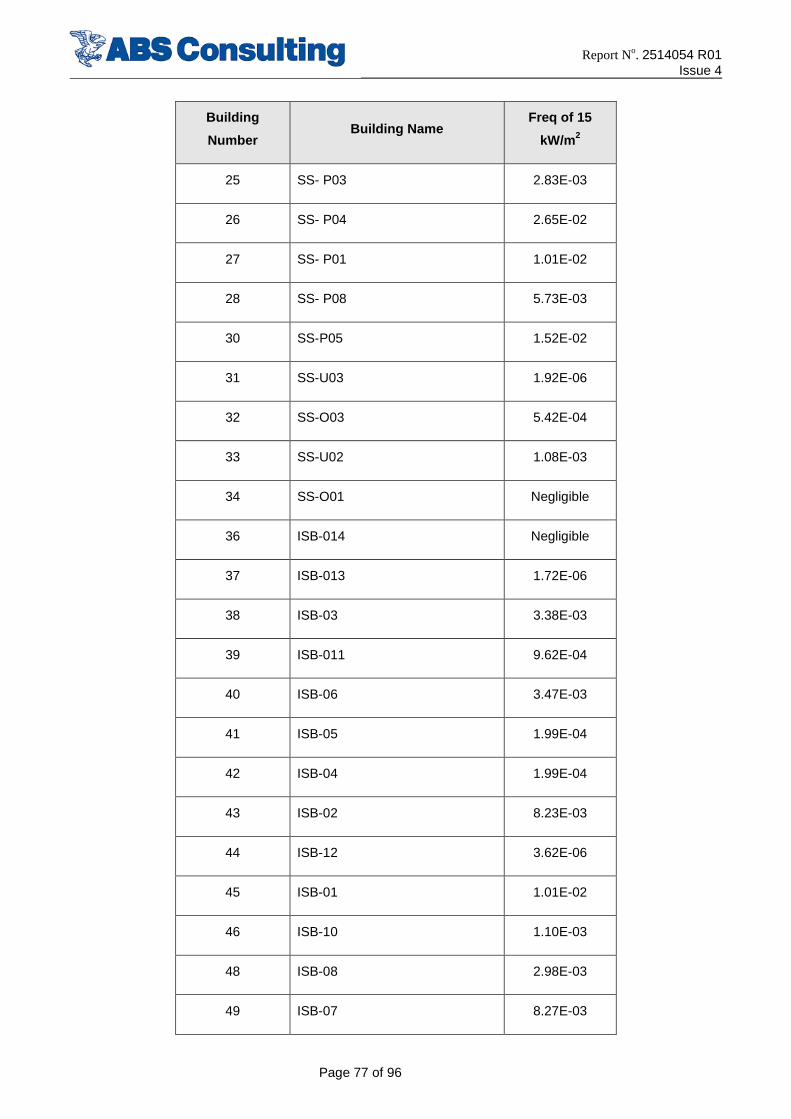
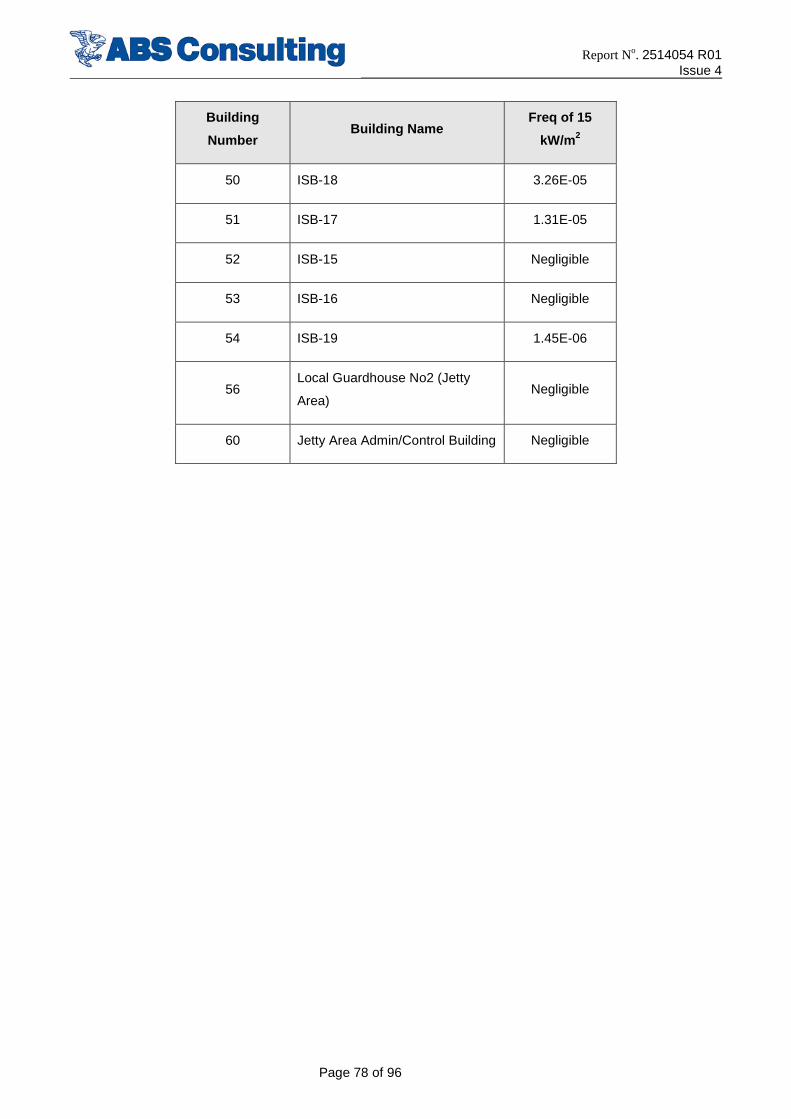
Table 15 summarises the frequency of exceeding heat flux of 15kW/m2 at various buildings.
Table 15 – Frequency of 15kW/m2 at buildings
Building
Number Building Name
Freq of 15
kW/m2
1 Administration Building Negligible
2 Canteen No1 Negligible
3 Medical Center Negligible
4 Main Guard House Negligible
5 Central Control Room Negligible
7 Laboratory Negligible
8 Maintenance Workshop Negligible
9 Warehouse Negligible
12 Canteen No2 Negligible
13 Fire Station Negligible
14 Main Substation SS-M01 Negligible
15 Emergency Generator Negligible
18 SS- U04 Negligible
19 SS - O04 Negligible
20 SS- U01 Negligible
21 SS- P09 3.27E-03
22 SS- P07 2.92E-03
23 SS-P02 1.45E-04
24 SS-P06 2.67E-03
Report No. 2514054 R01 Issue 4
Page 77 of 96
Building
Number Building Name
Freq of 15
kW/m2
25 SS- P03 2.83E-03
26 SS- P04 2.65E-02
27 SS- P01 1.01E-02
28 SS- P08 5.73E-03
30 SS-P05 1.52E-02
31 SS-U03 1.92E-06
32 SS-O03 5.42E-04
33 SS-U02 1.08E-03
34 SS-O01 Negligible
36 ISB-014 Negligible
37 ISB-013 1.72E-06
38 ISB-03 3.38E-03
39 ISB-011 9.62E-04
40 ISB-06 3.47E-03
41 ISB-05 1.99E-04
42 ISB-04 1.99E-04
43 ISB-02 8.23E-03
44 ISB-12 3.62E-06
45 ISB-01 1.01E-02
46 ISB-10 1.10E-03
48 ISB-08 2.98E-03
49 ISB-07 8.27E-03
Report No. 2514054 R01 Issue 4
Page 78 of 96
Building
Number Building Name
Freq of 15
kW/m2
50 ISB-18 3.26E-05
51 ISB-17 1.31E-05
52 ISB-15 Negligible
53 ISB-16 Negligible
54 ISB-19 1.45E-06
56 Local Guardhouse No2 (Jetty
Area) Negligible
60 Jetty Area Admin/Control Building Negligible
Report No. 2514054 R01 Issue 4
Page 79 of 96
7 RISK ASSESSMENT
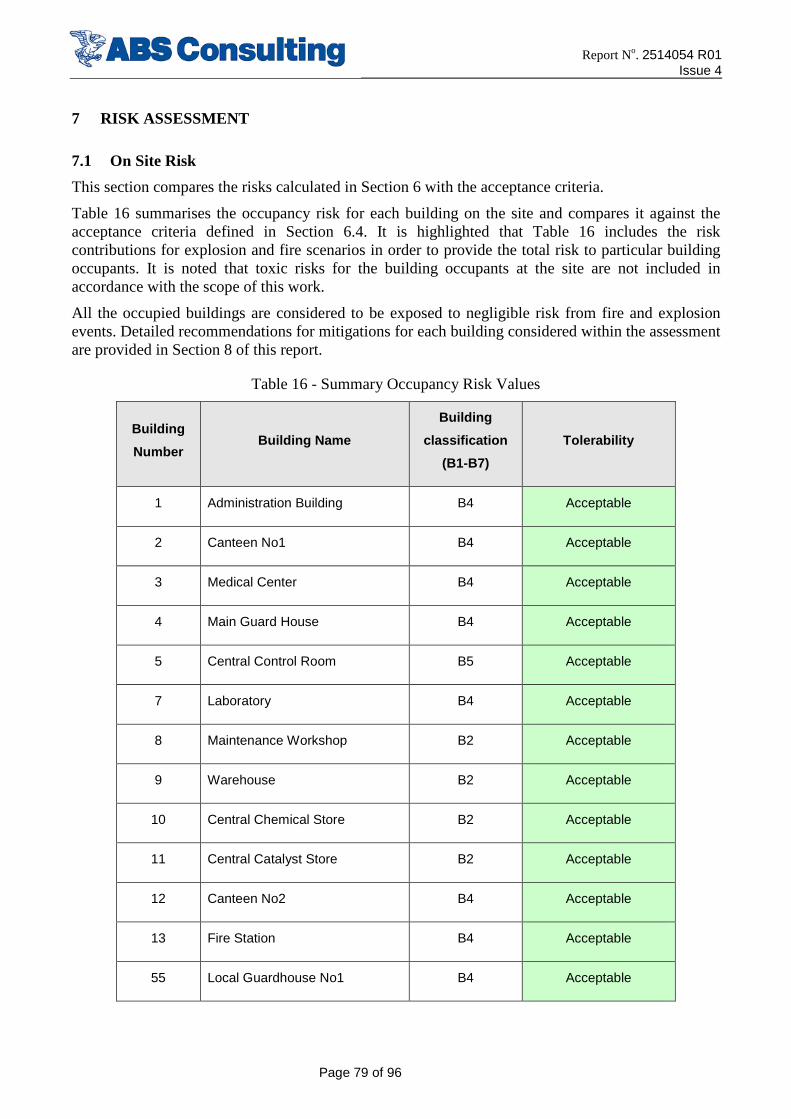
7.1 On Site Risk
This section compares the risks calculated in Section 6 with the acceptance criteria.
Table 16 summarises the occupancy risk for each building on the site and compares it against the acceptance criteria defined in Section 6.4. It is highlighted that Table 16 includes the risk contributions for explosion and fire scenarios in order to provide the total risk to particular building occupants. It is noted that toxic risks for the building occupants at the site are not included in accordance with the scope of this work.
All the occupied buildings are considered to be exposed to negligible risk from fire and explosion events. Detailed recommendations for mitigations for each building considered within the assessment are provided in Section 8 of this report.
Table 16 - Summary Occupancy Risk Values
Building
Number Building Name
Building
classification
(B1-B7)
Tolerability
1 Administration Building B4 Acceptable
2 Canteen No1 B4 Acceptable
3 Medical Center B4 Acceptable
4 Main Guard House B4 Acceptable
5 Central Control Room B5 Acceptable
7 Laboratory B4 Acceptable
8 Maintenance Workshop B2 Acceptable
9 Warehouse B2 Acceptable
10 Central Chemical Store B2 Acceptable
11 Central Catalyst Store B2 Acceptable
12 Canteen No2 B4 Acceptable
13 Fire Station B4 Acceptable
55 Local Guardhouse No1 B4 Acceptable
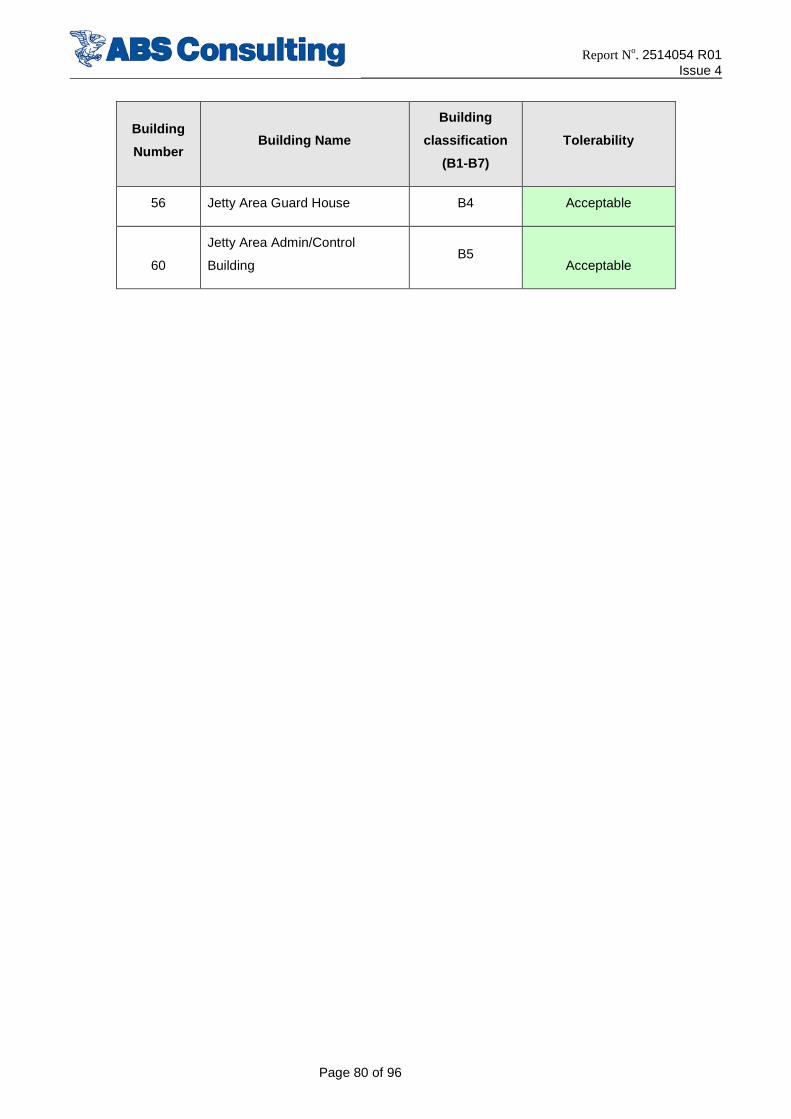
Report No. 2514054 R01 Issue 4
Page 80 of 96
Building
Number Building Name
Building
classification
(B1-B7)
Tolerability
56 Jetty Area Guard House B4 Acceptable
60
Jetty Area Admin/Control
Building B5
Acceptable
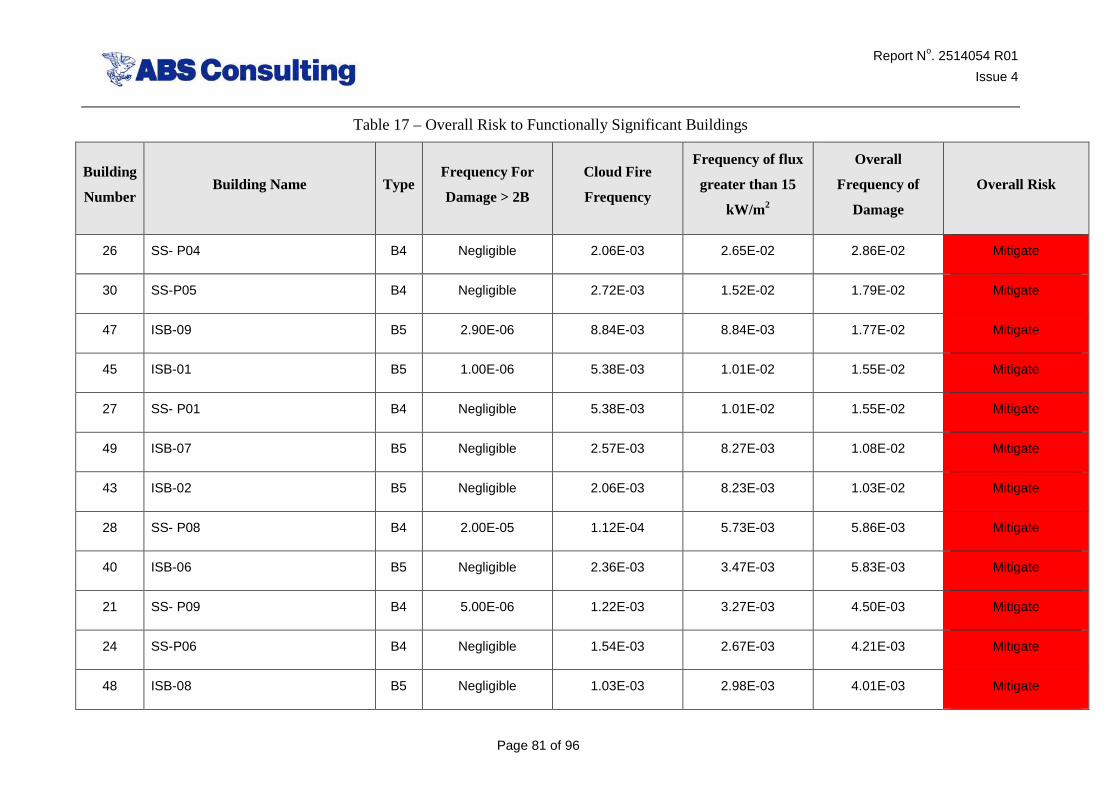
Report No. 2514054 R01
Issue 4
Page 81 of 96
Table 17 – Overall Risk to Functionally Significant Buildings
Building
Number Building Name Type
Frequency For
Damage > 2B
Cloud Fire
Frequency
Frequency of flux
greater than 15
kW/m 2
Overall
Frequency of
Damage
Overall Risk
26 SS- P04 B4 Negligible 2.06E-03 2.65E-02 2.86E-02 Mitigate
30 SS-P05 B4 Negligible 2.72E-03 1.52E-02 1.79E-02 Mitigate
47 ISB-09 B5 2.90E-06 8.84E-03 8.84E-03 1.77E-02 Mitigate
45 ISB-01 B5 1.00E-06 5.38E-03 1.01E-02 1.55E-02 Mitigate
27 SS- P01 B4 Negligible 5.38E-03 1.01E-02 1.55E-02 Mitigate
49 ISB-07 B5 Negligible 2.57E-03 8.27E-03 1.08E-02 Mitigate
43 ISB-02 B5 Negligible 2.06E-03 8.23E-03 1.03E-02 Mitigate
28 SS- P08 B4 2.00E-05 1.12E-04 5.73E-03 5.86E-03 Mitigate
40 ISB-06 B5 Negligible 2.36E-03 3.47E-03 5.83E-03 Mitigate
21 SS- P09 B4 5.00E-06 1.22E-03 3.27E-03 4.50E-03 Mitigate
24 SS-P06 B4 Negligible 1.54E-03 2.67E-03 4.21E-03 Mitigate
48 ISB-08 B5 Negligible 1.03E-03 2.98E-03 4.01E-03 Mitigate
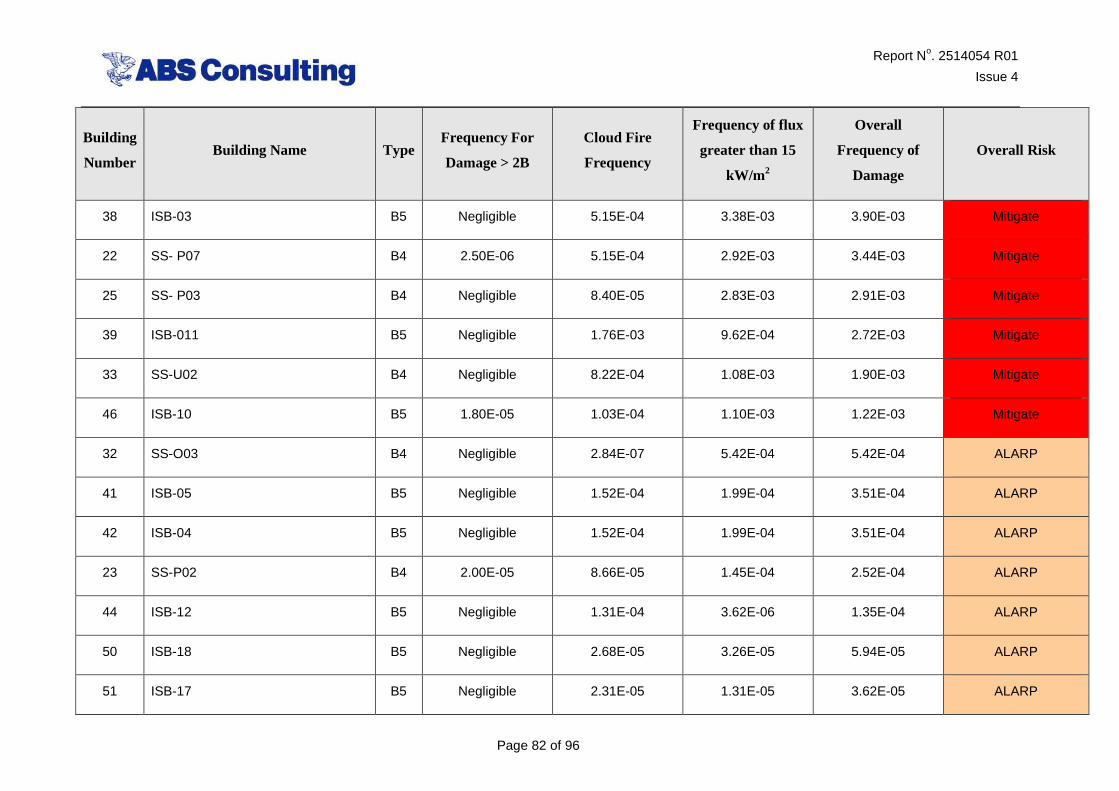
Report No. 2514054 R01
Issue 4
Page 82 of 96
Building
Number Building Name Type
Frequency For
Damage > 2B
Cloud Fire
Frequency
Frequency of flux
greater than 15
kW/m 2
Overall
Frequency of
Damage
Overall Risk
38 ISB-03 B5 Negligible 5.15E-04 3.38E-03 3.90E-03 Mitigate
22 SS- P07 B4 2.50E-06 5.15E-04 2.92E-03 3.44E-03 Mitigate
25 SS- P03 B4 Negligible 8.40E-05 2.83E-03 2.91E-03 Mitigate
39 ISB-011 B5 Negligible 1.76E-03 9.62E-04 2.72E-03 Mitigate
33 SS-U02 B4 Negligible 8.22E-04 1.08E-03 1.90E-03 Mitigate
46 ISB-10 B5 1.80E-05 1.03E-04 1.10E-03 1.22E-03 Mitigate
32 SS-O03 B4 Negligible 2.84E-07 5.42E-04 5.42E-04 ALARP
41 ISB-05 B5 Negligible 1.52E-04 1.99E-04 3.51E-04 ALARP
42 ISB-04 B5 Negligible 1.52E-04 1.99E-04 3.51E-04 ALARP
23 SS-P02 B4 2.00E-05 8.66E-05 1.45E-04 2.52E-04 ALARP
44 ISB-12 B5 Negligible 1.31E-04 3.62E-06 1.35E-04 ALARP
50 ISB-18 B5 Negligible 2.68E-05 3.26E-05 5.94E-05 ALARP
51 ISB-17 B5 Negligible 2.31E-05 1.31E-05 3.62E-05 ALARP
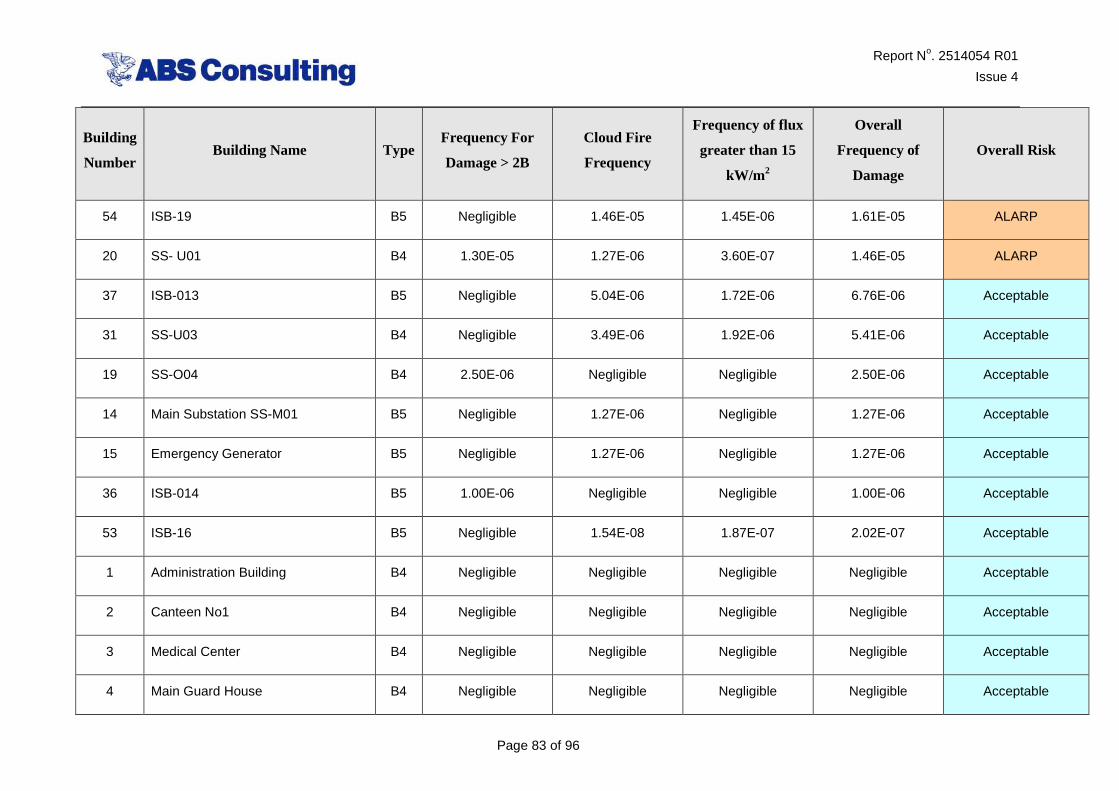
Report No. 2514054 R01
Issue 4
Page 83 of 96
Building
Number Building Name Type
Frequency For
Damage > 2B
Cloud Fire
Frequency
Frequency of flux
greater than 15
kW/m 2
Overall
Frequency of
Damage
Overall Risk
54 ISB-19 B5 Negligible 1.46E-05 1.45E-06 1.61E-05 ALARP
20 SS- U01 B4 1.30E-05 1.27E-06 3.60E-07 1.46E-05 ALARP
37 ISB-013 B5 Negligible 5.04E-06 1.72E-06 6.76E-06 Acceptable
31 SS-U03 B4 Negligible 3.49E-06 1.92E-06 5.41E-06 Acceptable
19 SS-O04 B4 2.50E-06 Negligible Negligible 2.50E-06 Acceptable
14 Main Substation SS-M01 B5 Negligible 1.27E-06 Negligible 1.27E-06 Acceptable
15 Emergency Generator B5 Negligible 1.27E-06 Negligible 1.27E-06 Acceptable
36 ISB-014 B5 1.00E-06 Negligible Negligible 1.00E-06 Acceptable
53 ISB-16 B5 Negligible 1.54E-08 1.87E-07 2.02E-07 Acceptable
1 Administration Building B4 Negligible Negligible Negligible Negligible Acceptable
2 Canteen No1 B4 Negligible Negligible Negligible Negligible Acceptable
3 Medical Center B4 Negligible Negligible Negligible Negligible Acceptable
4 Main Guard House B4 Negligible Negligible Negligible Negligible Acceptable
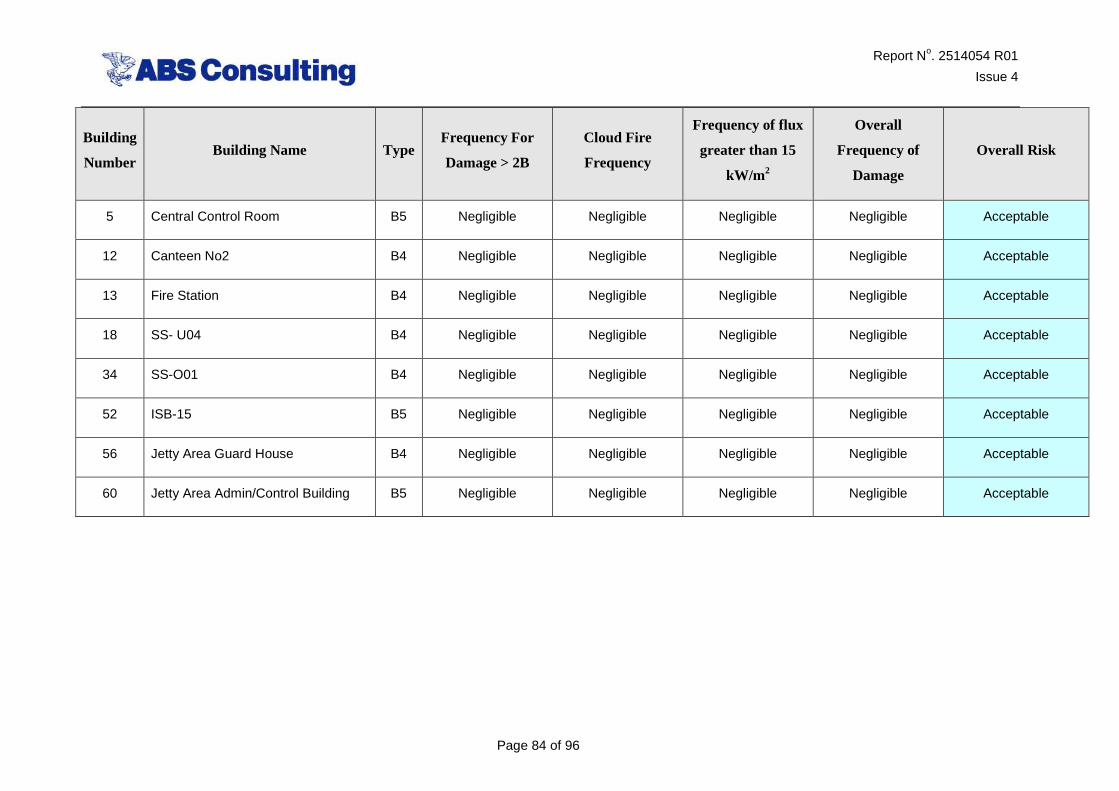
Report No. 2514054 R01
Issue 4
Page 84 of 96
Building
Number Building Name Type
Frequency For
Damage > 2B
Cloud Fire
Frequency
Frequency of flux
greater than 15
kW/m 2
Overall
Frequency of
Damage
Overall Risk
5 Central Control Room B5 Negligible Negligible Negligible Negligible Acceptable
12 Canteen No2 B4 Negligible Negligible Negligible Negligible Acceptable
13 Fire Station B4 Negligible Negligible Negligible Negligible Acceptable
18 SS- U04 B4 Negligible Negligible Negligible Negligible Acceptable
34 SS-O01 B4 Negligible Negligible Negligible Negligible Acceptable
52 ISB-15 B5 Negligible Negligible Negligible Negligible Acceptable
56 Jetty Area Guard House B4 Negligible Negligible Negligible Negligible Acceptable
60 Jetty Area Admin/Control Building B5 Negligible Negligible Negligible Negligible Acceptable
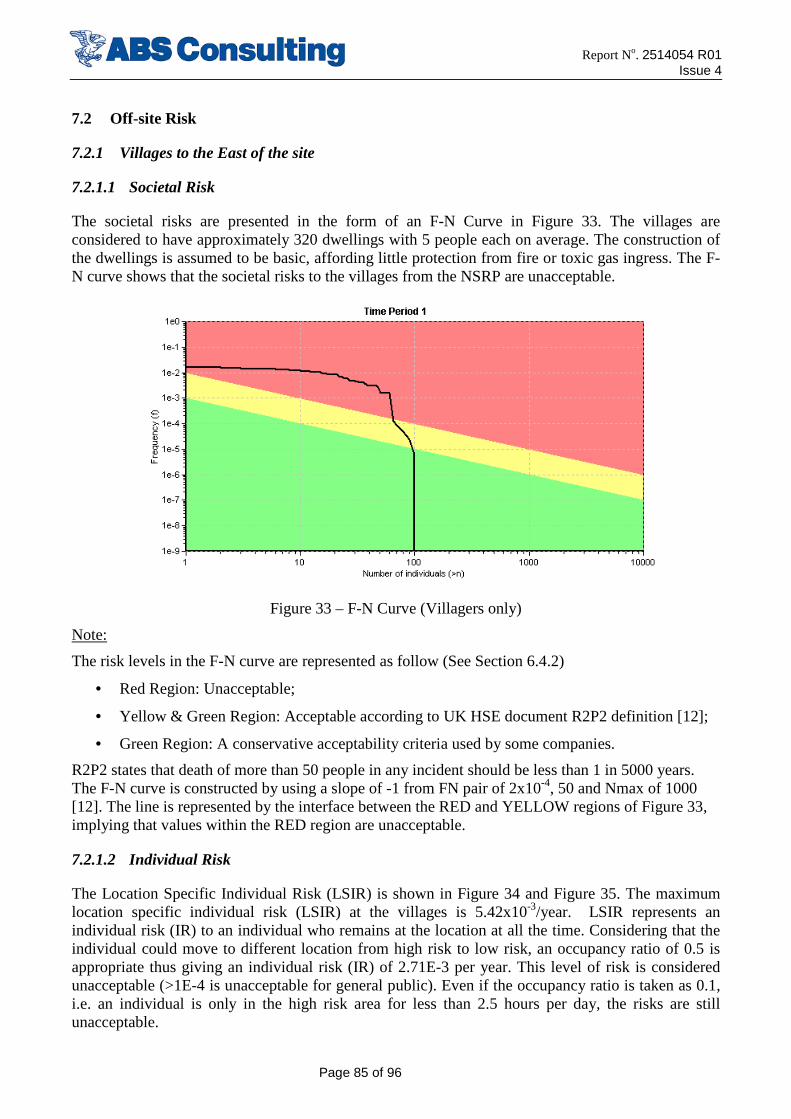
Report No. 2514054 R01 Issue 4
Page 85 of 96
7.2 Off-site Risk
7.2.1 Villages to the East of the site
7.2.1.1 Societal Risk
The societal risks are presented in the form of an F-N Curve in Figure 33. The villages are considered to have approximately 320 dwellings with 5 people each on average. The construction of the dwellings is assumed to be basic, affording little protection from fire or toxic gas ingress. The F-N curve shows that the societal risks to the villages from the NSRP are unacceptable.
Figure 33 – F-N Curve (Villagers only)
Note:
The risk levels in the F-N curve are represented as follow (See Section 6.4.2)
• Red Region: Unacceptable;
• Yellow & Green Region: Acceptable according to UK HSE document R2P2 definition [12];
• Green Region: A conservative acceptability criteria used by some companies.
R2P2 states that death of more than 50 people in any incident should be less than 1 in 5000 years. The F-N curve is constructed by using a slope of -1 from FN pair of 2x10⁻⁴, 50 and Nmax of 1000 [12]. The line is represented by the interface between the RED and YELLOW regions of Figure 33, implying that values within the RED region are unacceptable.
7.2.1.2 Individual Risk
The Location Specific Individual Risk (LSIR) is shown in Figure 34 and Figure 35. The maximum location specific individual risk (LSIR) at the villages is 5.42x10⁻³/year. LSIR represents an individual risk (IR) to an individual who remains at the location at all the time. Considering that the individual could move to different location from high risk to low risk, an occupancy ratio of 0.5 is appropriate thus giving an individual risk (IR) of 2.71E-3 per year. This level of risk is considered unacceptable (>1E-4 is unacceptable for general public). Even if the occupancy ratio is taken as 0.1, i.e. an individual is only in the high risk area for less than 2.5 hours per day, the risks are still unacceptable.
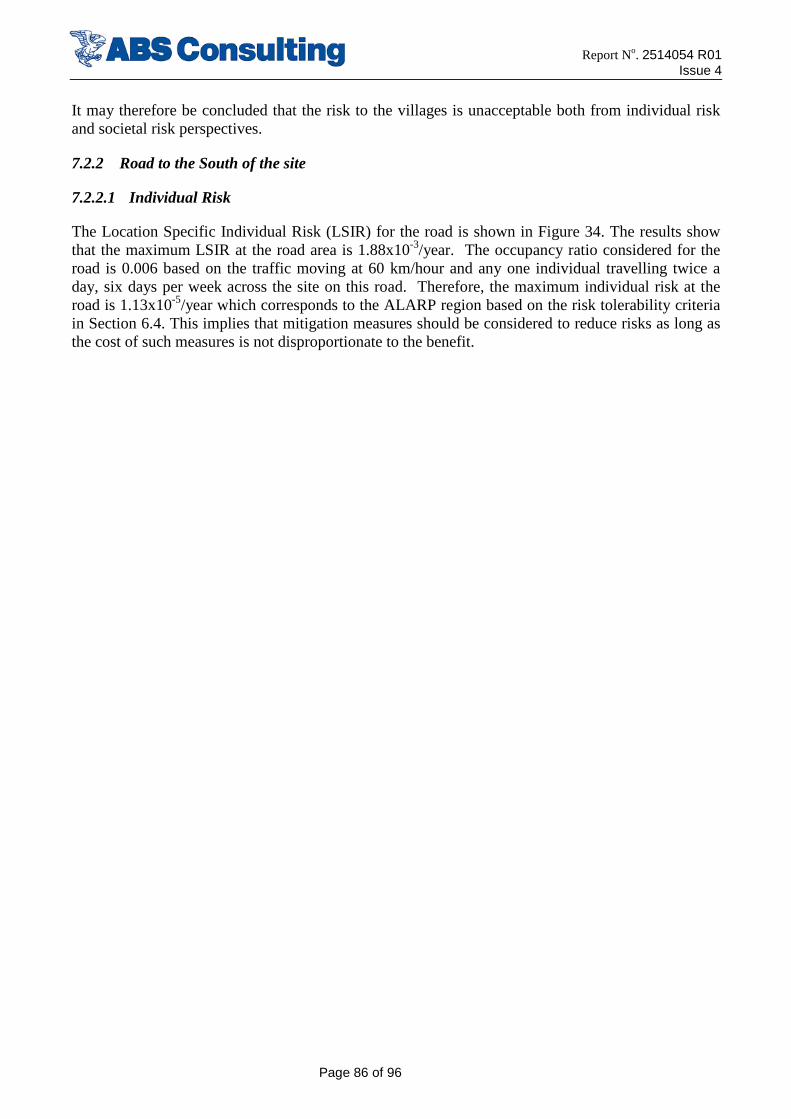
Report No. 2514054 R01 Issue 4
Page 86 of 96
It may therefore be concluded that the risk to the villages is unacceptable both from individual risk and societal risk perspectives.
7.2.2 Road to the South of the site
7.2.2.1 Individual Risk
The Location Specific Individual Risk (LSIR) for the road is shown in Figure 34. The results show that the maximum LSIR at the road area is 1.88x10⁻³/year. The occupancy ratio considered for the road is 0.006 based on the traffic moving at 60 km/hour and any one individual travelling twice a day, six days per week across the site on this road. Therefore, the maximum individual risk at the road is 1.13x10⁻⁵/year which corresponds to the ALARP region based on the risk tolerability criteria in Section 6.4. This implies that mitigation measures should be considered to reduce risks as long as the cost of such measures is not disproportionate to the benefit.
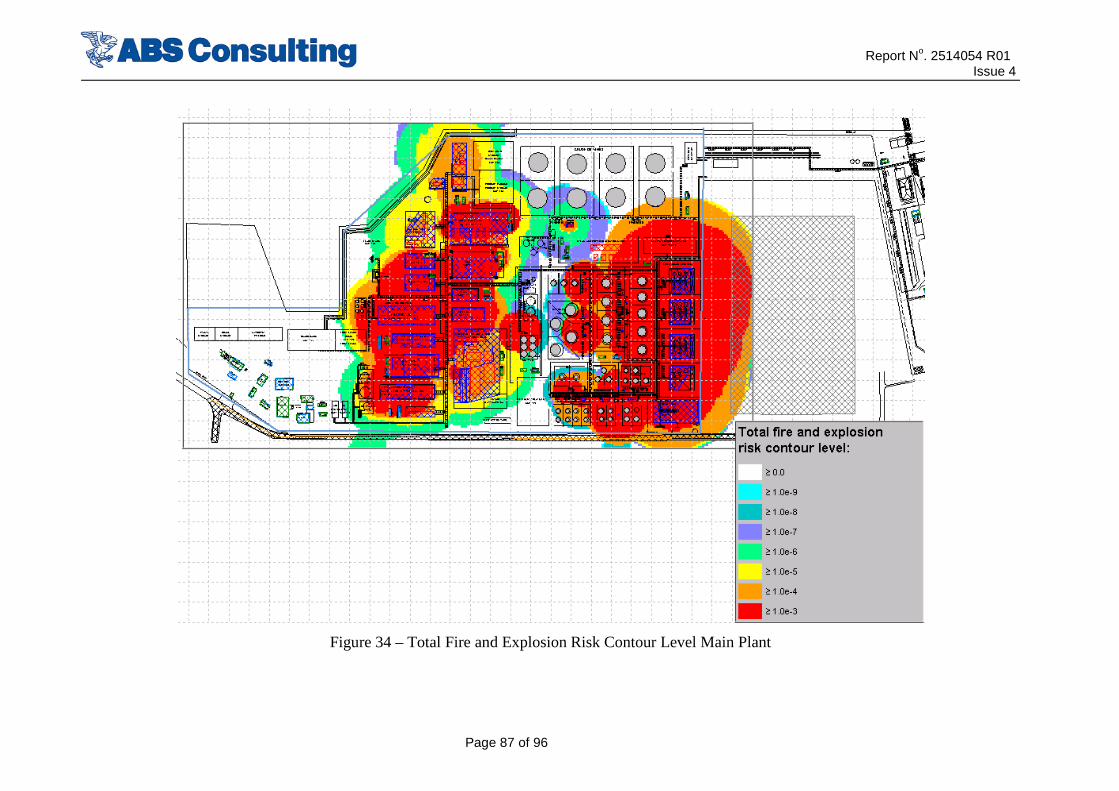
Report No. 2514054 R01 Issue 4
Page 87 of 96
Figure 34 – Total Fire and Explosion Risk Contour Level Main Plant
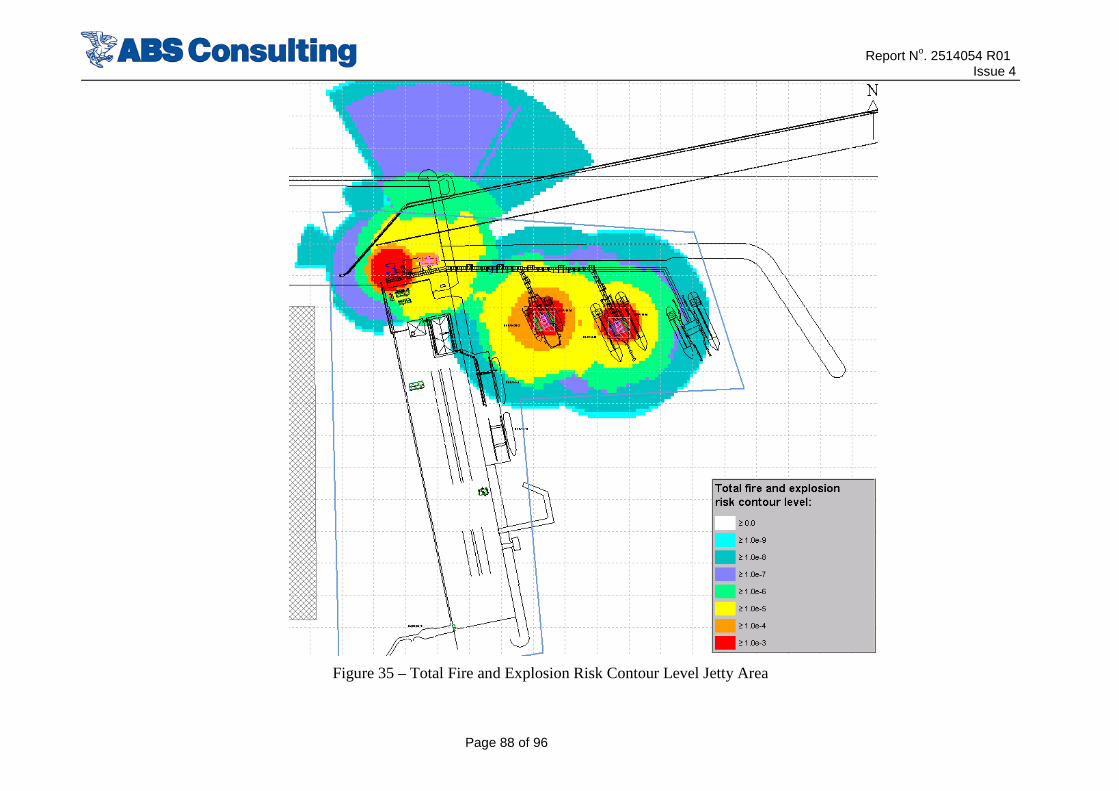
Report No. 2514054 R01 Issue 4
Page 88 of 96
Figure 35 – Total Fire and Explosion Risk Contour Level Jetty Area
Report No. 2514054 R01 Issue 4
Page 89 of 96
8 CONCLUSIONS & RECOMMENDATIONS
8.1 Buildings at the site
The results from this coarse QRA indicate that there are a number of buildings at the site that require risk reduction measures. This includes 18 buildings where risk mitigation must be undertaken and 10 buildings where risk mitigation should be considered, and implemented as necessary, in order to demonstrate that the building’s risk status is ALARP. Total fire and explosion risk contour level
The focus of the Risk mitigation is to reduce the likelihood and/or consequences of explosions/Fire on the site.
Based on this analysis, the following Table 18 provides a summary of recommendations for refinement of the risk predicted for an area/building or for mitigation of its risk. The recommendations are presented as General, Explosion and Fire.
Even though the explosion risk at NSRP is low, it is recommended that best industrial practice should be used and building classification not be downgraded based on the results of this risk assessment.
Furthermore, a detailed QRA must be undertaken once detailed plant design is in place to confirm or update the explosion risks in particular which are sensitive to plant congestion but also other risks which are based on the early plant information. At the detailed QRA stage, it may be possible to take account of various mitigations in place such as the water deluge, shutdown and blowdown and risk based inspection and maintenance and regular fugitive emission testing.
Table 18 –Recommendations
Ref. No. Description of Recommendations Options
General Recommendations
Reduce Event Likelihood
L1 Ensure that the design specifications for all plant include performance standards such that plant failure, and thus hydrocarbon release scenarios, will be minimized through design.
L2
Reduce the hazard magnitude through the installation of gas (toxic and flammable) detectors with emergency shutdown (ESD) systems within the critical hazard locations. Emergency shutdown valves to be located outside fire impact zone. If the valve is located inside a fire/explosion zone then fire proofing is necessary to provide protection for a specified period of time in line with API 2001.
L3 Minimize the presence of ignition sources around the process units
L4 Where possible, consider leak point minimization for all equipment (e.g. welded, rather than flanged pipe connections, fail safe valves, spring loaded manual valves, flange covers)
L5 Implement a risk-based inspection (RBI) and maintenance process such that the plant items that pose the greatest risk to the plant receive the greatest levels of inspection and maintenance
L6 Since there is a risk of an event moving onto the public highway, provisions will need to be in place to prevent traffic movement on the highway in the event of a site incident.
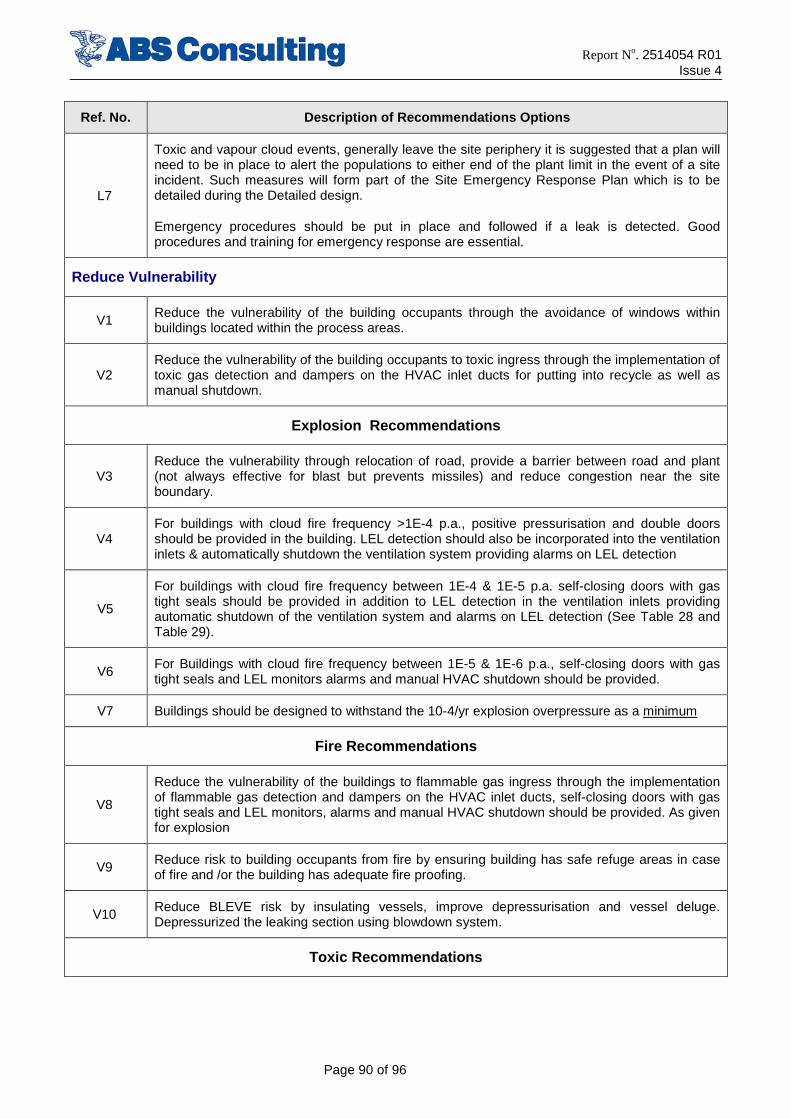
Report No. 2514054 R01 Issue 4
Page 90 of 96
Ref. No. Description of Recommendations Options
L7
Toxic and vapour cloud events, generally leave the site periphery it is suggested that a plan will need to be in place to alert the populations to either end of the plant limit in the event of a site incident. Such measures will form part of the Site Emergency Response Plan which is to be detailed during the Detailed design.
Emergency procedures should be put in place and followed if a leak is detected. Good procedures and training for emergency response are essential.
Reduce Vulnerability
V1 Reduce the vulnerability of the building occupants through the avoidance of windows within buildings located within the process areas.
V2 Reduce the vulnerability of the building occupants to toxic ingress through the implementation of toxic gas detection and dampers on the HVAC inlet ducts for putting into recycle as well as manual shutdown.
Explosion Recommendations
V3 Reduce the vulnerability through relocation of road, provide a barrier between road and plant (not always effective for blast but prevents missiles) and reduce congestion near the site boundary.
V4 For buildings with cloud fire frequency >1E-4 p.a., positive pressurisation and double doors should be provided in the building. LEL detection should also be incorporated into the ventilation inlets & automatically shutdown the ventilation system providing alarms on LEL detection
V5
For buildings with cloud fire frequency between 1E-4 & 1E-5 p.a. self-closing doors with gas tight seals should be provided in addition to LEL detection in the ventilation inlets providing automatic shutdown of the ventilation system and alarms on LEL detection (See Table 28 and Table 29).
V6 For Buildings with cloud fire frequency between 1E-5 & 1E-6 p.a., self-closing doors with gas tight seals and LEL monitors alarms and manual HVAC shutdown should be provided.
V7 Buildings should be designed to withstand the 10-4/yr explosion overpressure as a minimum
Fire Recommendations
V8
Reduce the vulnerability of the buildings to flammable gas ingress through the implementation of flammable gas detection and dampers on the HVAC inlet ducts, self-closing doors with gas tight seals and LEL monitors, alarms and manual HVAC shutdown should be provided. As given for explosion
V9 Reduce risk to building occupants from fire by ensuring building has safe refuge areas in case of fire and /or the building has adequate fire proofing.
V10 Reduce BLEVE risk by insulating vessels, improve depressurisation and vessel deluge. Depressurized the leaking section using blowdown system.
Toxic Recommendations
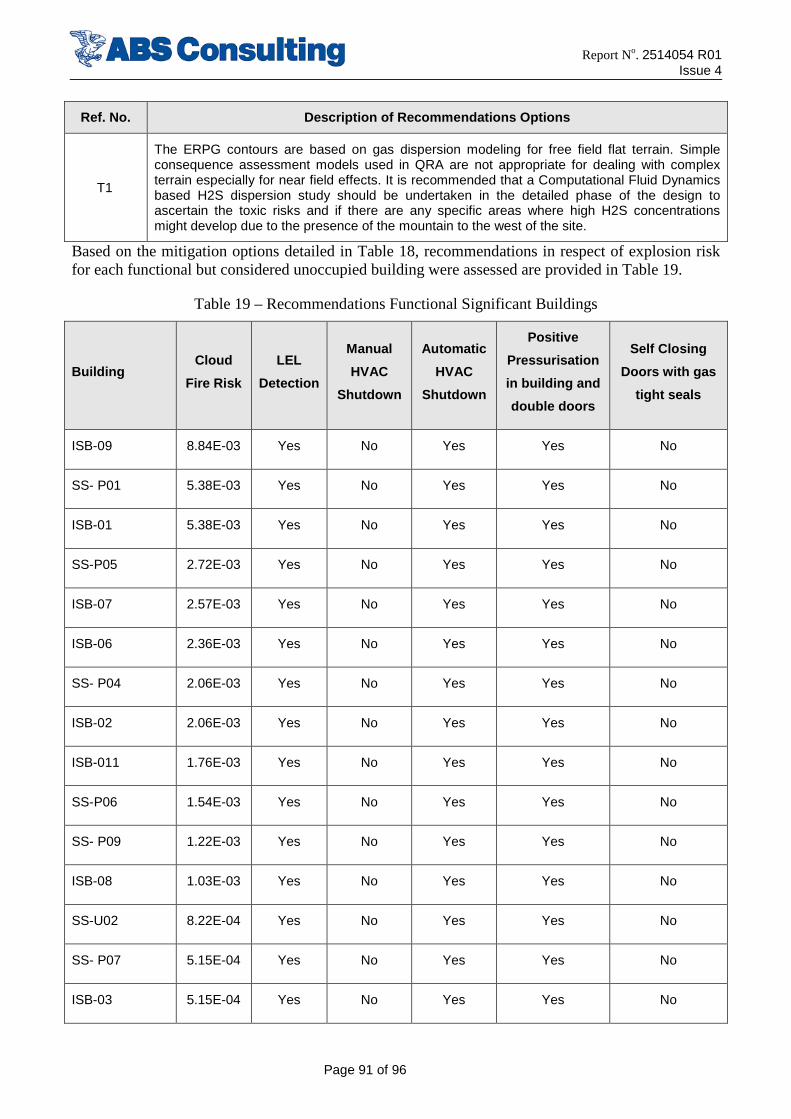
Report No. 2514054 R01 Issue 4
Page 91 of 96
Ref. No. Description of Recommendations Options
T1
The ERPG contours are based on gas dispersion modeling for free field flat terrain. Simple consequence assessment models used in QRA are not appropriate for dealing with complex terrain especially for near field effects. It is recommended that a Computational Fluid Dynamics based H2S dispersion study should be undertaken in the detailed phase of the design to ascertain the toxic risks and if there are any specific areas where high H2S concentrations might develop due to the presence of the mountain to the west of the site.
Based on the mitigation options detailed in Table 18, recommendations in respect of explosion risk for each functional but considered unoccupied building were assessed are provided in Table 19.
Table 19 – Recommendations Functional Significant Buildings
Building Cloud
Fire Risk
LEL
Detection
Manual
HVAC
Shutdown
Automatic
HVAC
Shutdown
Positive
Pressurisation
in building and
double doors
Self Closing
Doors with gas
tight seals
ISB-09 8.84E-03 Yes No Yes Yes No
SS- P01 5.38E-03 Yes No Yes Yes No
ISB-01 5.38E-03 Yes No Yes Yes No
SS-P05 2.72E-03 Yes No Yes Yes No
ISB-07 2.57E-03 Yes No Yes Yes No
ISB-06 2.36E-03 Yes No Yes Yes No
SS- P04 2.06E-03 Yes No Yes Yes No
ISB-02 2.06E-03 Yes No Yes Yes No
ISB-011 1.76E-03 Yes No Yes Yes No
SS-P06 1.54E-03 Yes No Yes Yes No
SS- P09 1.22E-03 Yes No Yes Yes No
ISB-08 1.03E-03 Yes No Yes Yes No
SS-U02 8.22E-04 Yes No Yes Yes No
SS- P07 5.15E-04 Yes No Yes Yes No
ISB-03 5.15E-04 Yes No Yes Yes No
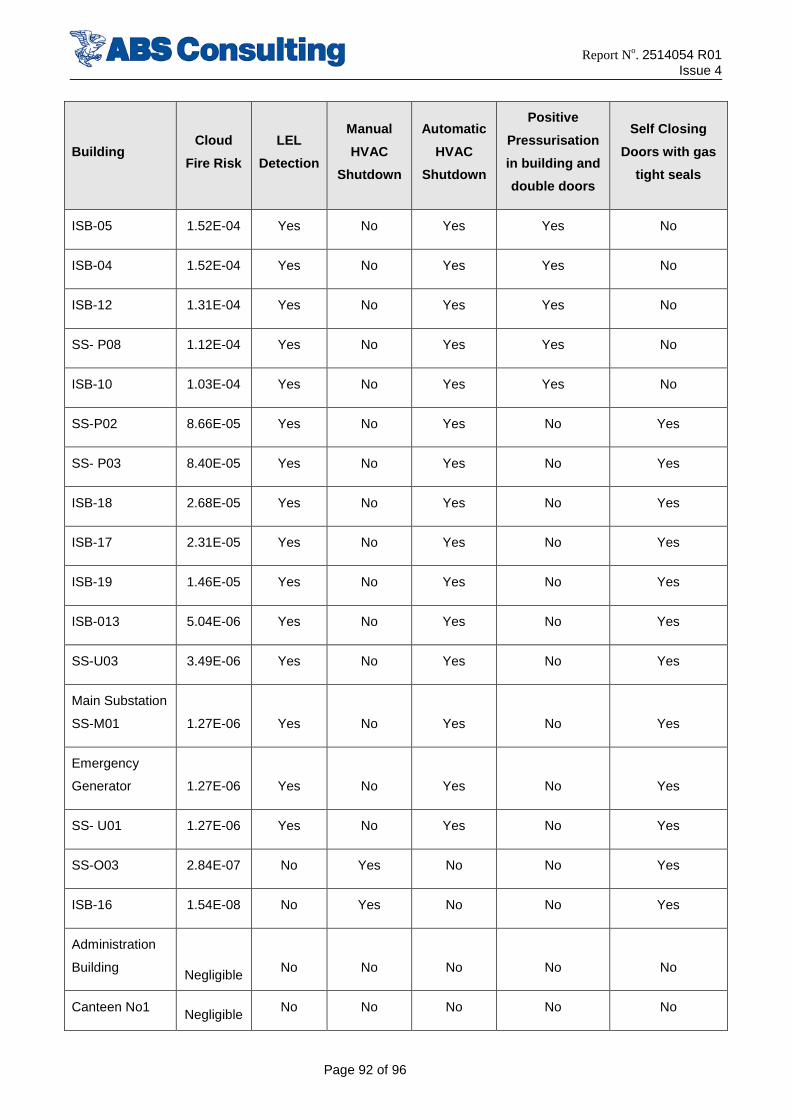
Report No. 2514054 R01 Issue 4
Page 92 of 96
Building Cloud
Fire Risk
LEL
Detection
Manual
HVAC
Shutdown
Automatic
HVAC
Shutdown
Positive
Pressurisation
in building and
double doors
Self Closing
Doors with gas
tight seals
ISB-05 1.52E-04 Yes No Yes Yes No
ISB-04 1.52E-04 Yes No Yes Yes No
ISB-12 1.31E-04 Yes No Yes Yes No
SS- P08 1.12E-04 Yes No Yes Yes No
ISB-10 1.03E-04 Yes No Yes Yes No
SS-P02 8.66E-05 Yes No Yes No Yes
SS- P03 8.40E-05 Yes No Yes No Yes
ISB-18 2.68E-05 Yes No Yes No Yes
ISB-17 2.31E-05 Yes No Yes No Yes
ISB-19 1.46E-05 Yes No Yes No Yes
ISB-013 5.04E-06 Yes No Yes No Yes
SS-U03 3.49E-06 Yes No Yes No Yes
Main Substation
SS-M01 1.27E-06 Yes No Yes No Yes
Emergency
Generator 1.27E-06 Yes No Yes No Yes
SS- U01 1.27E-06 Yes No Yes No Yes
SS-O03 2.84E-07 No Yes No No Yes
ISB-16 1.54E-08 No Yes No No Yes
Administration
Building Negligible No No No No No
Canteen No1 Negligible No No No No No
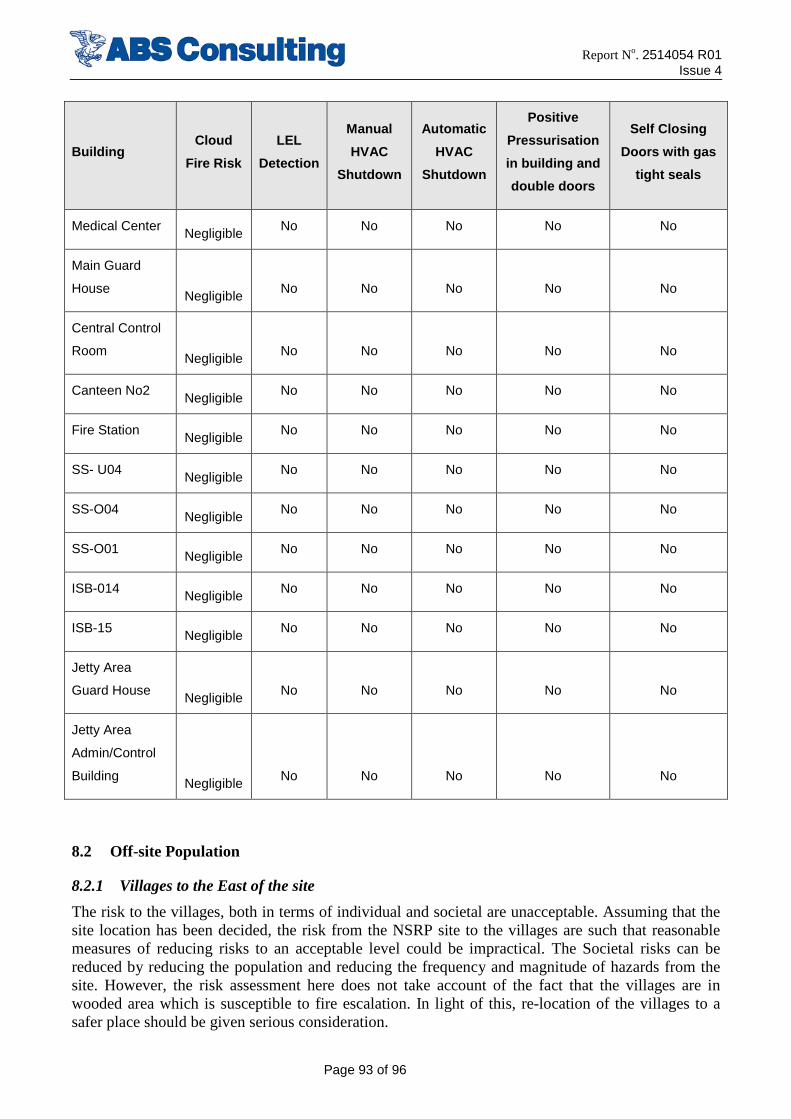
Report No. 2514054 R01 Issue 4
Page 93 of 96
Building Cloud
Fire Risk
LEL
Detection
Manual
HVAC
Shutdown
Automatic
HVAC
Shutdown
Positive
Pressurisation
in building and
double doors
Self Closing
Doors with gas
tight seals
Medical Center Negligible No No No No No
Main Guard
House Negligible No No No No No
Central Control
Room Negligible No No No No No
Canteen No2 Negligible No No No No No
Fire Station Negligible No No No No No
SS- U04 Negligible No No No No No
SS-O04 Negligible No No No No No
SS-O01 Negligible No No No No No
ISB-014 Negligible No No No No No
ISB-15 Negligible No No No No No
Jetty Area
Guard House Negligible No No No No No
Jetty Area
Admin/Control
Building Negligible No No No No No
8.2 Off-site Population
8.2.1 Villages to the East of the site
The risk to the villages, both in terms of individual and societal are unacceptable. Assuming that the site location has been decided, the risk from the NSRP site to the villages are such that reasonable measures of reducing risks to an acceptable level could be impractical. The Societal risks can be reduced by reducing the population and reducing the frequency and magnitude of hazards from the site. However, the risk assessment here does not take account of the fact that the villages are in wooded area which is susceptible to fire escalation. In light of this, re-location of the villages to a safer place should be given serious consideration.
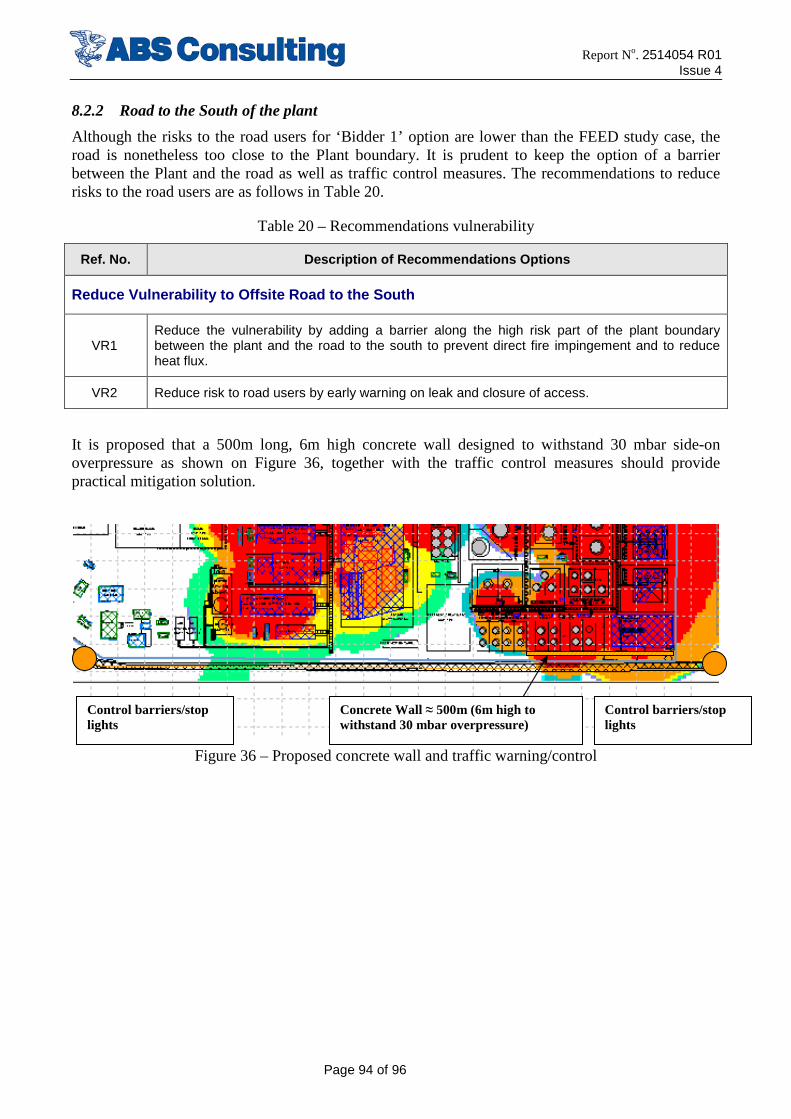
Report No. 2514054 R01 Issue 4
Page 94 of 96
8.2.2 Road to the South of the plant
Although the risks to the road users for ‘Bidder 1’ option are lower than the FEED study case, the road is nonetheless too close to the Plant boundary. It is prudent to keep the option of a barrier between the Plant and the road as well as traffic control measures. The recommendations to reduce risks to the road users are as follows in Table 20.
Table 20 – Recommendations vulnerability
Ref. No. Description of Recommendations Options
Reduce Vulnerability to Offsite Road to the South
VR1 Reduce the vulnerability by adding a barrier along the high risk part of the plant boundary between the plant and the road to the south to prevent direct fire impingement and to reduce heat flux.
VR2 Reduce risk to road users by early warning on leak and closure of access.
It is proposed that a 500m long, 6m high concrete wall designed to withstand 30 mbar side-on overpressure as shown on Figure 36, together with the traffic control measures should provide practical mitigation solution.
Figure 36 – Proposed concrete wall and traffic warning/control
Control barriers/stop lights
Control barriers/stop lights
Concrete Wall ≈ 500m (6m high to withstand 30 mbar overpressure)
Report No. 2514054 R01 Issue 4
Page 95 of 96
9 UNCERTAINTY IN QRA
There will always be uncertainty as to whether certain events will occur or not, what the immediate effects will be, and what the consequences for people, environment, or assets may be. This uncertainty reflects the insufficient information and knowledge available for the analysis, in relation to technical solutions, operations, and maintenance philosophies, logistic premises etc [13].
Uncertainties in the QRA will derive from the following examples:
• Since the design is at FEED stage, the level of detail in the system drawings necessitates the use of assumptions in terms of the equipment types and volumes.
• The distribution of flanges, valves, connections, instruments and pipe sizes are assumed based on work undertaken by Shell (default values in Shepherd) and are taken to be an average reflection of the distribution that is to be expected. However, the actual distributions may vary in the final design.
• The consequence modelling of the release scenarios has made some simplifications in terms of modelling the release of mixed fluids (e.g predominantly liquid material containing gases that may flash). The analysis of this phenomenon is very complex and as such, the consequence results for some scenarios are a best representation of the actual scenario.
• The flow rates are taken conservatively as the instantaneous release rates. These rates could be far in excess of the actual mass flow rates of materials through the process segments. This is considered to be accepted methods of undertaking such studies since the results are on the side of conservatism. However, if required, such conservatisms could be explored in detail if considered necessary.
• The explosion overpressures are derived from assumed congestion levels based on a simple 2D plant layout drawing and at the time of this assessment only were available for the RFCC, ARC and HMU units. It is usual to visit the actual site to undertake such assessments of site congestion. Clearly, this is not possible with a proposed plant; therefore, as the plant design progresses, the explosion parameters should be re-visited.
• A moderate damage to site buildings is assumed if thermal flux exceeds 15kW/m2. For concrete or masonry infill buildings this is a conservative assumption. However this gives an estimate as to which buildings should be considered to be at risk from fire and appropriate insulation measures.
Report No. 2514054 R01 Issue 4
Page 96 of 96
10 REFERENCES
1. Management of hazards associated with location of process plant buildings, API recommended practice 752, Second Edition, Nov. 2003.
2. HAZID-ENVID Review Report, 3550-8150-RP-0002 Rev.01, 01.05.2009, FWEL
3. FRED v 5.1 Technical manual, 2009.
4. SHEPHERD v2.1 Technical manual, 2009.
5. Refinery Design basis overall 3550-8110-PD-0005 Rev. 01, FWEL.
6. NSRP Refinery and Petrochemical Complex Plot plant, H-000-1225-501_5 REV 5, FWEL.
7. NRSP Marine Facility Plot plant, 3550-8230-01-0002, FWEL.
8. Hydrocarbon Leak and Ignition Database, EP Forum Risk Assessment Data Directory, EP Forum Report No. 11.8/250, E&P Forum, 1996.
9. Cox, A. W., Lees, F.W. and Ang M. Lm, “Classification of Hazardous Locations”, IChemE, Rugby, England, 1990.
10. American Industrial Hygiene Association ERPG Table, 2008.
11. Frank P Lees, “Loss Prevention in Process Industries”, 2nd Edition, BH, 1996.
12. HSE, Reducing risks, protecting people - R2P2, 2001.
13. Nicolet-Monnier M. Gheorghe V. Andrian , Topics in Safety, Risk, Reliability and Quality “Quantitative Risk Assessment of Hazardous Material Transport Systems”,. Kluwer Academic Publishers, 1996.
14. NSRP Refinery and Petrochemical Complex Project Coarse QRA, Issue 4 FINAL, Report No.2204898 R01, ABSC, Sep 2009
Recommended
![QRA Technical Guidance - National Environment Agency · QRA Technical Guidance [Revision No: 1] [Date of Revision: 31st March 2016] Contents 1 QRA Study](https://img.pdfslide.us/doc/110x75/5ace3a7d7f8b9a1d328b8ec2/qra-technical-guidance-national-environment-technical-guidance-revision-no-1.jpg)