Nothing left to chance:
characteristics of schools successful in mathematics
Report of the building an evidence base for best practice in mathematics education project
Rosemary Callingham
University of Tasmania
with
Judy Anderson University of Sydney
Kim Beswick University of Tasmania
Colin Carmichael University of Southern Queensland
Vince Geiger Australian Catholic University
Merrilyn Goos University of Queensland
Derek Hurrell Notre Dame University
Christopher Hurst Curtin University
Tracey Muir University of Tasmania
Helen Watt Monash University
Linda Page University of Tasmania (Project Manager)

i
© Commonwealth of Australia 2016
Ownership of intellectual property rights
Unless otherwise noted, copyright (and any other intellectual property rights, if any) in this
publication is owned by the Commonwealth of Australia.
Creative Commons licence
Attribution: CC BY NC
All material presented in this publication is provided under a Creative Commons Attribution Non-
Commercial 3.0 Australia Licence, save for content supplied by third parties, logos, any material
protected by trademark or otherwise noted in this publication and the Commonwealth Coat of Arms.
Creative Commons Attribution Non-Commercial 3.0 Australia Licence is a standard for licence
agreement that allows you to copy, distribute, transmit and adapt this publication provided you
attribute the work. A summary of the licence terms is available from
http://creativecommons.org/licenses/by-nc/3.0/au/legalcode.
Content contained herein should be attributed as Callingham, R., Beswick, K., Carmichael, C., Geiger,
V., Goos, M., Hurrell, D., Hurst, C., Muir, T., (2017). Nothing left to chance. Characteristics of schools
successful in mathematics. (Report of the Building an Evidence Base for Best Practice in Mathematics
Education Project). Hobart: University of Tasmania.
Cover image: Faculty of Education, University of Tasmania, stock image.
Commonwealth of Australia Disclaimer
This publication was prepared by the University of Tasmania with assistance from certain other
Universities. The purpose of this publication is to provide information to stakeholders about the
factors that influence student learning, particularly in the subject of mathematics. The opinions
expressed in this publication are the author's own and do not necessarily reflect the views of the
Commonwealth of Australia as represented by the Office of the Chief Scientist, a division of the
Department of Industry, Innovation and Science (Commonwealth) whose role was to commission
the author to undertake the research topic published herein.
The Commonwealth is not providing professional advice through this publication. Any findings,
recommendations or opinions contained in this publication are based on information available at the
time of writing. You must exercise your own judgement and carefully evaluate the information in
the publication for accuracy, currency, completeness and relevance for your intended purpose
having regard to the purpose of this publication above. Where the information in this publication is
used for a purpose other than that which is described above, the Commonwealth, its officers,
employees, or agents accept no liability arising from, or in connection with, this publication to the
extent permitted at law.
This publication does not indicate a commitment by the Australian Government to any particular
course of action.

ii
Contents
Contents ii
List of tables vi
List of figures viii
Glossary and abbreviations ix
1 Executive summary 1
1.1 Goal 1
1.2 Summary of findings 1
1.2.1 Schools and classrooms 1
1.2.2 Systems 2
1.3 Key findings 2
1.3.1 Key finding 1 3
1.3.2 Key finding 2 4
1.3.3 Key finding 3 4
1.4 Terms of reference 5
1.5 Methodology 5
2 Introduction 7
2.1 Underpinning assumptions 9
2.2 Previous research 10
2.2.1 Recent reports 10
2.2.2 General factors that influence learning 12
2.2.3 Mathematics factors that influence learning 13
2.2.4 Factors of interest to this study 17
3 Methodology 18
3.1 Data collection approaches 18
3.1.1 Desktop review 18
3.1.2 Surveys 19
3.1.3 Survey responses 22
3.1.4 Case studies 25

iii
4 Evidence from the desktop review 32
4.1 Key findings 32
4.1.1 Curriculum implementation 32
4.1.2 Support for mathematics/numeracy across states and territories 33
4.1.3 Particular programs or approaches 34
4.1.4 Strategic directions 35
5 Evidence from the surveys 37
5.1 Key findings 37
5.1.1 School characteristics 38
5.1.2 Classroom characteristics 53
5.1.3 Students’ characteristics 61
5.1.4 Teachers’ and students’ responses in successful schools 63
6 Evidence from the case studies 68
6.1 Key findings 68
6.2 Characteristics of case study schools 69
6.2.1 School organisation and staffing 75
6.2.2 Teachers’ knowledge 79
6.2.3 Professional learning 80
6.2.4 Use of data and collaborative planning 85
6.2.5 Attitudes to NAPLAN 87
6.2.6 Programs and resources used in teaching 88
6.2.7 Assessment and reporting 89
6.3 Approaches to teaching 89
6.3.1 Explicit teaching 89
6.3.2 Supporting students’ mathematical thinking 91
6.3.3 Differentiating teaching for learning 95
6.3.4 Supporting teachers 97
6.4 Students’ thinking about mathematics in their schools 98
iv
7 Findings and conclusions 100
7.1 Key findings 100
7.1.1 Key finding 1 100
7.1.2 Key finding 2 100
7.1.3 Key finding 3 101
7.2 Key findings for systems-level policymakers 102
7.2.1 Key finding for policymakers 1 102
7.2.2 Key finding for policymakers 2 102
7.2.3 Key finding for policymakers 3 103
7.3 Key findings for school leaders 104
7.3.1 Key finding for school leaders 1 104
7.3.2 Key finding for school leaders 2 104
7.3.3 Key finding for school leaders 3 105
7.4 Key findings for classroom teachers of mathematics 105
7.4.1 Key finding for classroom teachers 1 105
7.4.2 Key finding for classroom teachers 2 106
7.5 Limitations of the study 106
7.6 Suggestions for future work 107
References 108
Appendix A 115
A1. Websites considered for the desktop review 115
A2. Survey instruments 121
School leaders’ survey 122
Teachers’ survey 130
Secondary (older) students’ survey 139
Primary (younger) students’ survey 148
A3. Case study instruments 154
Appendix B 169
Details of the ACARA sample of superior gain schools and the survey samples of schools 169
v
Appendix C 180
Professional learning (professional development) and commercial programs and resources that influence teaching in successful schools 180
Appendix D 183
Technical details of survey analyses 183

vi
List of tables
Table 3.1:1 Leaders’ responses 23
Table 3.1:2 Teachers’ responses by school type 23
Table 3.1:3 Students’ responses 24
Table 3.1:4 Students’ responses by school type 24
Table 3.1:5 Case study schools by state and sector 27
Table 3.1:6 Case study schools by school type 28
Table 3.1:7 Case study sample schools 30
Table 5.1:1 Number of respondents who taught in different year levels 39
Table 5.1:2 Teachers’ reported educational levels 41
Table 5.1:3 Leaders’ reported educational levels 41
Table 5.1:4 Teachers’ and leaders’ reported educational levels by success 42
Table 5.1:5 Teachers’ and leaders’ highest reported level of mathematics studied by success 42
Table 5.1:6 Teaching experience of survey respondents 43
Table 5.1:7 Leadership experience 44
Table 5.1:8 Professional learning by school type 45
Table 5.1:9 Target year groups for professional learning by primary or secondary teacher 46
Table 5.1:10 Ability grouping for mathematics by school type 47
Table 5.1:11 Reported incidence of ability grouped mathematics classes by success 48
Table 5.1:12 Time allocation in hours per week for mathematics learning 48
Table 5.1:13 Mean time allocation in hours per week for mathematics learning by success 48
Table 5.1:14 Responses from school leaders about the use of AC-M 49
Table 5.1:15 Responses from school leaders about the use of commercial programs 49
Table 5.1:16 Responses from school leaders about programs and resources used in individual
schools 50
Table 5.1:17 Students’ self-reported grades for mathematics by percentage of respondents
in each year level 51
Table 5.1:18 Students’ self-reported grades for mathematics by school success 52
Table 5.1:19 Correlations between teacher enthusiasm and classroom environment variables 55
Table 5.1:20 Correlations among teacher and classroom variables and students’ costs 56
Table 5.1:21 Frequency of homework by school type 57
Table 5.1:22 Duration of homework by school type 57
Table 5.1:23 Frequency of homework set by teachers by success 58

vii
Table 5.1:24 Students’ responses to ‘how often does your maths teacher assign maths
homework?’ by success 58
Table 5.1:25 Duration of homework expected by teachers by success 59
Table 5.1:26 Students’ responses to the amount of time spent on mathematics homework on
weekdays by success 59
Table 5.1:27 Students’ responses to the amount of time spent on mathematics homework on
weekends by success 60
Table 5.1:28 Key constructs from students’ survey responses by success 61
Table 5.1:29 Differences between younger and older students on personal mathematics
constructs 62
Table 5.1:30 Older students’ responses to personal mathematics constructs by success 62
Table 5.1:31 Distribution of students and teachers across year levels 63
Table 6.2:1 Summary of key findings of characteristics of case study schools 69
Table 6.2:2 Summary of analysis of data from case study schools 70
Table 6.2:3 Summary of themes reported in the vignettes 74
Table 6.2:4 Resources used in successful schools based on survey responses and case study
observations 88

viii
List of figures
Figure 3.1:1 Distribution of student responses by the ICSEA value of their school 25
Figure 3.1:2 Locations of case study schools 27
Figure 3.1:3 ICSEA value distribution of case study schools 28
Figure 5.1:1 Year levels taught by respondents as a percentage of teachers who identified
as either primary (p %, blue line) or secondary (s %, orange line) teachers 39
Figure 5.1:2 Mathematics teaching experience in years for teacher respondents by success 43
Figure 5.1:3 Leadership experience by success 44
Figure 5.1:4 Duration of professional learning by success 46
Figure 5.1:5 Proportion of A to E grades by year level 51
Figure 5.1:6 Structural equation model showing factors that impact on primary students’
interest in mathematics 64
Figure 5.1:7 Students’ engagement profiles showing the relative components of engagement 66
ix
Glossary and Abbreviations
A to E reporting The mandated grading system used by all schools for
reporting to parents
AAMT Australian Association of Mathematics Teachers
AAS Australian Academy of Science
ACARA Australian Curriculum, Assessment and Reporting Authority
AC-M Australian Curriculum: Mathematics
AusVELS AusVELS was the Foundation to year 10 curriculum (2013–
2016) for Victorian government and Catholic schools at the
time of this study, and from 1 January 2017 has been
replaced by the Victorian Curriculum F–10
C2C Curriculum to Classroom, an approach to the National
Curriculum used in Queensland
Combined school A school providing education across primary and secondary
school years
Concrete materials Concrete materials, also referred to as manipulatives, are
objects designed to represent concretely mathematical ideas
that are essentially abstract. Examples of concrete materials
commonly used in mathematics include counters, ten-
frames, base-10 blocks and pattern blocks
DAP Developmentally Appropriate Practice
Direct instruction model A model of teaching in which the teacher explains a concept
or demonstrates a skill directly to students
Ecological systems theory Theory that suggests that development of an individual is
nested within a series of interacting environmental
influences, from the immediate environment in which the
individual exists, through localised influences (micro-level),
broader influences (meso-level) to overarching influences
macro-level). In schools, for example, students (individuals)
exist within classrooms (micro-level), within schools (meso-
level), within systems (macro-level)
Explicit teaching An approach to teaching which has a focus on curriculum
content, including having clear goals for every lesson, making
connections within and between concepts and monitoring
student progress. Explicit teaching can occur with whole
class, small groups or individuals as the teacher changes the
approach in response to students’ feedback

x
Flexible grouping The practice of allocating students to classes or teaching
groups based on frequent diagnostic assessments, and for
particular purposes, such as learning a specific topic or
undertaking a particular learning task. Flexible groupings can
occur in classrooms that are mixed ability or grouped by
ability, within year groups or across year groups
IB International Baccalaureate
IBPYP International Baccalaureate Primary Years Programme
ICSEA Index of Community Socio-Educational Advantage
ICT Information and communications technology
LMS Learning Management System. A software application used
to track educational progress
Mastery learning environment A learning environment or classroom where the emphasis is
on developing deep understanding of the mathematics
rather than emphasising acquisition of particular skills
MCK Mathematics Content Knowledge
Mixed ability class A class in which students are placed using criteria other than
measured ability
Metro/provincial/remote
geolocation
In 2015, the schools’ geographic location classification
system was based on the locality of individual schools and
was used to disaggregate data according to metropolitan,
provincial, remote and very remote. The classifications used
in this study were provided by ACARA. The geolocation
categorisation was changed in 2016 after this study had
concluded
MfT Mathematics for Teaching
NAPLAN National Assessment Program – Literacy And Numeracy
NCEE National Center on Education and the Economy
NTWD National Teaching Workforce Dataset
NumPA Numeracy Project Assessment – a diagnostic interview tool
developed in New Zealand
OCS Office of the Chief Scientist
OECD Organisation for Economic Cooperation and Development
Other school Any school that does not meet the criteria as a successful
school or as a superior gain school
xi
PaLM Principals as Leaders of Mathematics
PAT-Maths (ACER) Progressive Achievement Test – Mathematics from the
Australian Council for Educational Research
PCK Pedagogical Content Knowledge
Performance learning
environment
A learning environment or classroom where the emphasis is
on demonstrating competence, achievement and
competition rather than developing understanding
PISA Programme of International Student Assessment
Primary school A school that provides education from Foundation to year 6
or year 7 (QLD, SA, WA at the time of this study)
Professional learning communities A group of teachers that has a focus on ‘(1) professional
learning; (2) within the context of a cohesive group; (3) that
focuses on collective knowledge, and (4) occurs within an
ethic of interpersonal caring that permeates the life of
teachers, students and school leaders’ (Stoll & Louis, 2007,
p. 3)
Secondary school A school that provides education beyond the primary years,
usually year 7 or year 8 (QLD, SA, WA at the time of this
study) to year 10 or year 12
SD Standard deviation
School vignette A short story taken from a particular school site visit that
exemplifies a particular point within the broader school
context
SCM Students’ perceptions of a Classroom Mastery goal
orientation
SCP Students’ perceptions of a Classroom Performance goal
orientation
SNMY Supporting Numeracy in the Middle Years project
STE Students’ perceptions of Teachers’ Enthusiasm for teaching
mathematics
Streaming The practice of allocating students to classes for a full year
with little or no movement between classes based on some
assessment process or test

xii
Student-centred teaching An approach to teaching in which students are provided with
opportunities to become active in their learning by engaging
in discussion, following their own interests and problem
solving. The focus of instruction shifts from teachers to
students
Successful school A school that has achieved growth or performance +1
standard deviation (SD) above the mean growth or
performance for Australian schools. Successful schools
include superior gain schools but also include some High
Performance Schools where gain scores were not available
Superior gain school A school that has achieved growth from years 3 to 5 or years
7 to 9 of +1 SD above the mean growth for Australian schools
in the time periods 2011–2013, or 2012–2014
System For the purpose of this study, ‘system’ is used to mean
Government, Catholic, and Independent sectors working
within a state or territory jurisdiction
TCM Teachers’ perceptions of a Classroom Mastery goal
orientation. See ‘Mastery learning environment’
TCP Teachers’ perceptions of a Classroom Performance goal
orientation. See ‘Performance learning environment’
TEMPEST Towards Educating Mathematics Professionals Encompassing
Science and Technology
TIMSS Trends in International Mathematics and Science Study
TSE Teachers’ perceptions of their Subject Enthusiasm for
mathematics
1
1 1 Executive summary
1.1 Goal
The Developing an Evidence Base for Best Practice in Mathematics Education project aimed to
identify factors that influence the learning and teaching of mathematics in Australian schools.
The purpose of the project was to build a compelling evidence base for national best practice in
mathematics education. This goal was achieved through examining mathematics education practices
in schools (termed successful schools) that achieved superior gains or high performance in the
numeracy component of The National Assessment Program – Literacy and Numeracy (NAPLAN).
This study was commissioned by the Office of the Chief Scientist (OCS), and the research team was
led by Associate Professor Rosemary Callingham from the University of Tasmania.
1.2 Summary of findings
The study considered the impacts of practices at the classroom, school and system levels, using
desktop research, surveys and case studies. Section 1.5 provides an explanation of the survey, case
studies and the desktop review, as well as a definition of successful schools.
1.2.1 Schools and classrooms
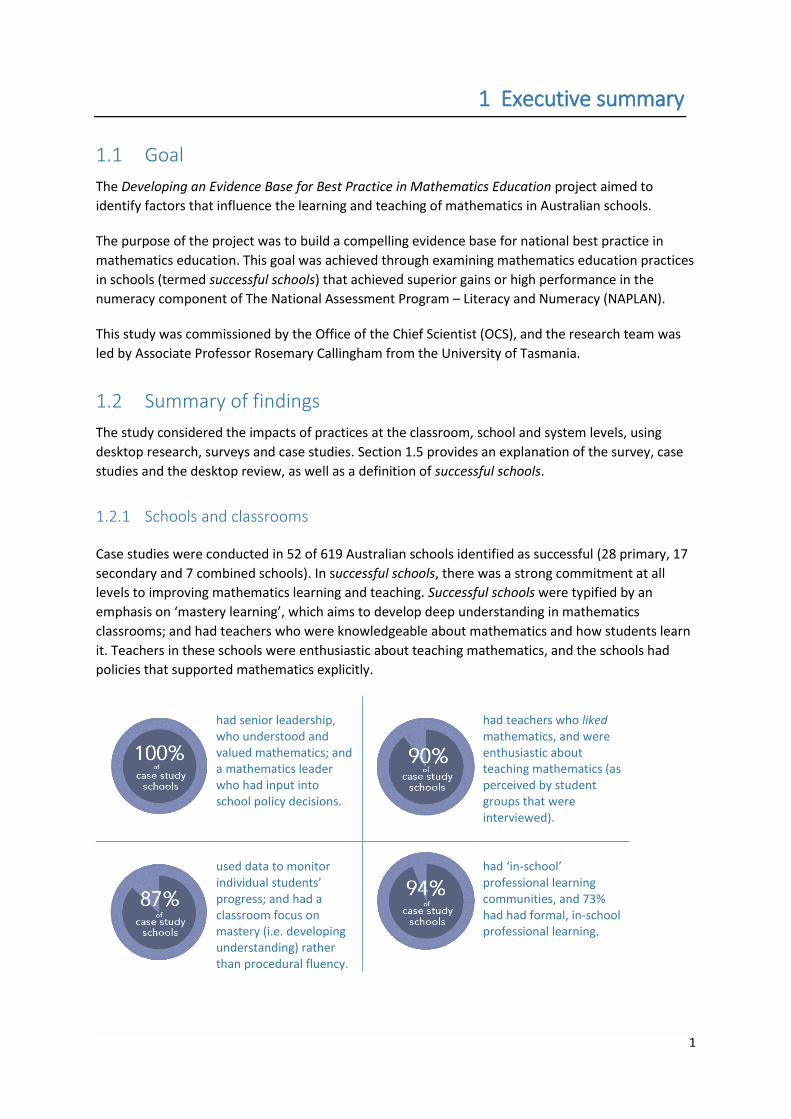
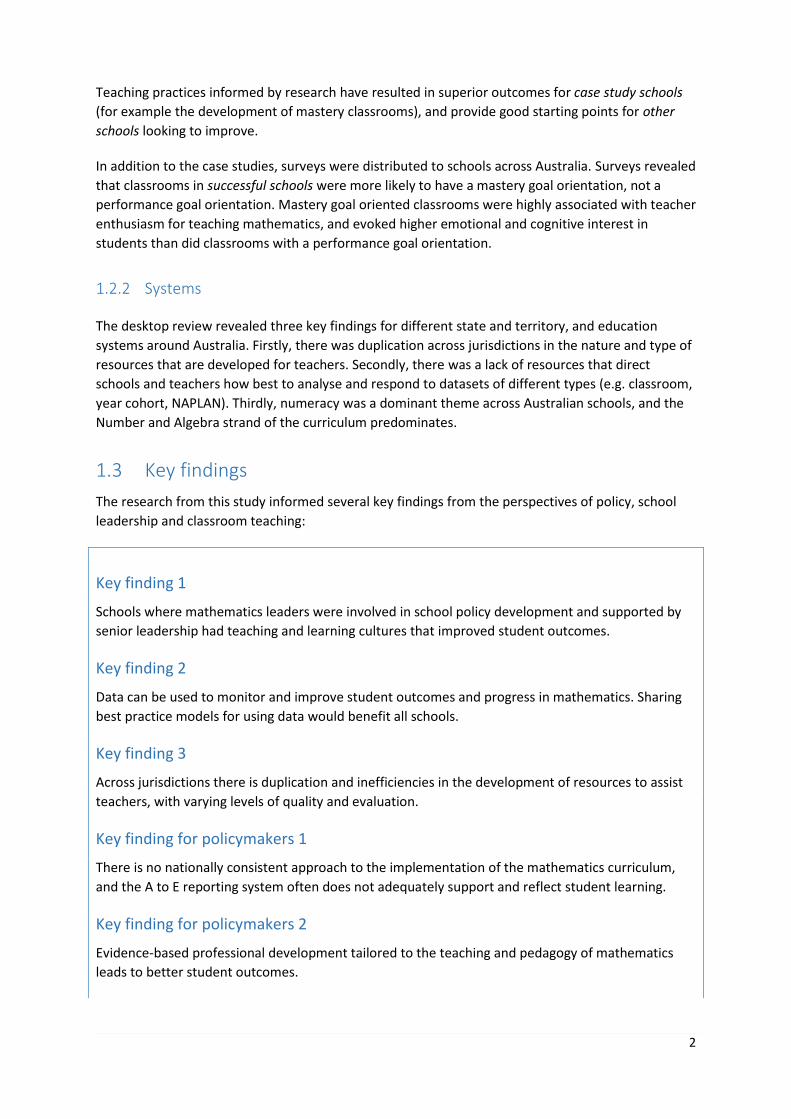
Case studies were conducted in 52 of 619 Australian schools identified as successful (28 primary, 17
secondary and 7 combined schools). In successful schools, there was a strong commitment at all
levels to improving mathematics learning and teaching. Successful schools were typified by an
emphasis on ‘mastery learning’, which aims to develop deep understanding in mathematics
classrooms; and had teachers who were knowledgeable about mathematics and how students learn
it. Teachers in these schools were enthusiastic about teaching mathematics, and the schools had
policies that supported mathematics explicitly.
had senior leadership, who understood and valued mathematics; and a mathematics leader who had input into school policy decisions.
had teachers who liked mathematics, and were enthusiastic about teaching mathematics (as perceived by student groups that were interviewed).
used data to monitor individual students’ progress; and had a classroom focus on mastery (i.e. developing understanding) rather than procedural fluency.
had ‘in-school’ professional learning communities, and 73% had had formal, in-school professional learning.
2
Teaching practices informed by research have resulted in superior outcomes for case study schools
(for example the development of mastery classrooms), and provide good starting points for other
schools looking to improve.
In addition to the case studies, surveys were distributed to schools across Australia. Surveys revealed
that classrooms in successful schools were more likely to have a mastery goal orientation, not a
performance goal orientation. Mastery goal oriented classrooms were highly associated with teacher
enthusiasm for teaching mathematics, and evoked higher emotional and cognitive interest in
students than did classrooms with a performance goal orientation.
1.2.2 Systems
The desktop review revealed three key findings for different state and territory, and education
systems around Australia. Firstly, there was duplication across jurisdictions in the nature and type of
resources that are developed for teachers. Secondly, there was a lack of resources that direct
schools and teachers how best to analyse and respond to datasets of different types (e.g. classroom,
year cohort, NAPLAN). Thirdly, numeracy was a dominant theme across Australian schools, and the
Number and Algebra strand of the curriculum predominates.
1.3 Key findings
The research from this study informed several key findings from the perspectives of policy, school
leadership and classroom teaching:
Key finding 1
Schools where mathematics leaders were involved in school policy development and supported by
senior leadership had teaching and learning cultures that improved student outcomes.
Key finding 2
Data can be used to monitor and improve student outcomes and progress in mathematics. Sharing
best practice models for using data would benefit all schools.
Key finding 3
Across jurisdictions there is duplication and inefficiencies in the development of resources to assist
teachers, with varying levels of quality and evaluation.
Key finding for policymakers 1
There is no nationally consistent approach to the implementation of the mathematics curriculum,
and the A to E reporting system often does not adequately support and reflect student learning.
Key finding for policymakers 2
Evidence-based professional development tailored to the teaching and pedagogy of mathematics
leads to better student outcomes.

3
Key finding for policymakers 3
Teachers of upper primary and lower secondary years undertake the lowest levels of professional
development and may benefit from numeracy and/or mathematics coaches.
Key finding for school leaders 1
Student outcomes were improved in schools with staff members who had responsibility for
mathematics and school level policy making input.
Key finding for school leaders 2
Schools with a culture of in-house, discipline specific professional development create collegial and
non-judgemental environments for both teachers and students.
Key finding for school leaders 3
Targeted, data-driven approaches for planning and delivering mathematics learning and teaching
leads to improved student outcomes.
Key finding for classroom teachers 1
Mathematics taught with enthusiasm, and classrooms focussed on the deep understanding of
mathematical concepts and ideas leads to increased student engagement.
Key finding for classroom teachers 2
Students develop better understanding when provided with the opportunity to talk about their
mathematics, and to articulate their mathematical thinking and solution strategies.
The first three key findings straddle all three perspectives of policy, school leadership and classroom
teaching, and these are discussed in this executive summary. Chapter 7 details additional evidence
for all of the key findings for further consideration.
1.3.1 Key finding 1
Schools where mathematics leaders were involved in school policy development and supported by
senior leadership had teaching and learning cultures that improved student outcomes.
All case study schools had a leader of mathematics (for example principals or heads of mathematics)
who had input into school policy decisions and received support from senior leadership who
understood and valued mathematics. This value was reflected by the amount of formal in-school
professional development (also called professional learning) (73% of case study schools) and the
prevalence of in-school professional learning communities (94% of case study schools). It is
important that principals understand how they can build a culture that improves students’
mathematics outcomes.
4
Next steps
There is currently a Principals as Literacy Leaders program, which was developed in 2009, and has
been widely successful in different jurisdictions and education systems. A Principals as Leaders of
Mathematics program could follow a similar model. Western Australia piloted a Principals as
Numeracy Leaders project in 2012, and it received positive feedback.
1.3.2 Key finding 2
Data can be used to monitor and improve student outcomes and progress in mathematics. Sharing
best practice models for using data would benefit all schools.
In 87% of case study schools, data were used to monitor student progress and change teaching
practices, however, the desktop research indicated that there was a lack of examples in numeracy of
how to use data. If data can be used to improve student outcomes, then teachers should have
access to best practice examples.
Next steps
The Dimensions online portal, which is scheduled to go public in 2017, will include evidence-based
resources and professional development programs for mathematics teachers. The portal is partly
funded by the Australian Government Department of Education, and led by the Australian
Association of Mathematics Teachers (AAMT). Resources for data-use could be developed as part of
Dimensions.
1.3.3 Key finding 3
Across jurisdictions there is duplication and inefficiencies in the development of resources to assist
teachers, with varying levels of quality and evaluation.
The desktop review revealed that there is duplication across jurisdictions in the nature and type of
resources that are developed for teachers. Although a number of resources were reported to be
used in schools, neither the case studies nor the surveys uncovered particular resources that were
associated with successful schools. A national plan and communication between education systems
within and across jurisdictions could help to increase efficiency and deliver quality information to
teachers nationwide.
Next steps
Dissemination of mathematics teaching research, resources and programs could be built into
Dimensions (an online portal for mathematics teachers, which is scheduled to go public in 2017, as
discussed in Finding 1). A national program for communication between education systems could be
implemented through the Australian Government Department of Education and Training. These
findings could be implemented as a part of the National STEM School Education Strategy from the
Education Council (Education Council, 2015).

5
1.4 Terms of reference
The goal of the project was to build a compelling evidence base for national best practice in
mathematics education, and included the following objectives:
1. To identify state and territory level, system level, school level, and teacher practices that
achieve superior gain in NAPLAN numeracy test performance between 2011 and 2013,
for years 3 and 5, and years 7 and 9.
2. To identify defined practices in primary and secondary schools that result in superior gain
at the state and territory, educational system and school levels.
3. To identify schools with superior gain where students:
a. are confident to use mathematics in routine and non-routine ways to solve real
world and mathematical problems;
b. feel positive about what they are doing in mathematics; and
c. have the cognitive skills to think deeply and meaningfully about application of
mathematics to problems, and communicate these thoughts.
4. To identify the levels and types of mathematics teacher qualifications in these schools.
5. To identify the levels and types of professional development available to and undertaken
by mathematics teachers in these schools.
6. To describe the teaching resources used by mathematics teachers in these schools.
7. To describe the practices, teaching philosophies and pedagogies used by mathematics
teachers in these schools.
8. To understand the principal's and the school approach to mathematics teaching in these
schools.
9. To determine the number of hours and lesson configurations for mathematics lessons in
these schools.
1.5 Methodology
This study defined successful schools as those showing superior gain or performance in NAPLAN
during the time periods 2011–2013, and 2012–2014 from data provided by ACARA. Superior gain
was defined as greater than one standard deviation (+1 SD) above the mean growth based on overall
numeracy results, compared with like schools and with schools with similar starting scores. Superior
performance was measured for schools in jurisdictions where no gain scores were possible for
years 7–9. All other schools were defined as other schools.
To investigate the practices used in successful schools, this study used three data collection
approaches: a desktop review of system level provisions; surveys of school leaders (for example
principals, heads of mathematics), classroom teachers and students; and case study research in
successful schools.

6
In addition to investigating the processes and practices of different education systems, the desktop
review included a summary of factors that influence learning mathematics, as identified in academic
literature.
Surveys were distributed across schools in Australia where permission had been given by relevant
education systems. Responses were collected from 207 teachers (124 of whom were from 28
different successful schools), 111 school leaders (16 successful schools), 466 older students (years 7–
10) and 601 younger students (years 3–6). Approximately half of the students were from successful
schools.
Case studies were conducted in 52 different schools of the 619 that were identified as successful
schools (28 primary, 17 secondary and 7 combined schools). Researchers in case study schools
interviewed students, teachers, leaders, and parents. They also observed classes, and reviewed
relevant school documents. The schools were located in every state and territory, and covered
primary, secondary, and combined schools in all three sectors: Government, Catholic and
Independent. The ICSEA values ranged from 899 to 1212.
7
2 2 Introduction
Teaching mathematics is a complex task. In addition to having a deep understanding of appropriate
mathematics, teachers need to recognise the cognitive, emotional, and social development of the
students they teach, to draw on a wide range of pedagogical practices, and, most importantly, have
that specialised knowledge of mathematics for teaching that has become known as pedagogical
content knowledge. Teachers, however, work within schools and the ethos and organisational
arrangements, policies and practices of that school impact on teachers’ effectiveness. Schools are
part of wider societal provisions for education that provide processes for curriculum development
and delivery, accountability and accreditation within a legal framework. These different levels of
influence are interactive and dynamic, making the task of teaching mathematics a constantly
changing process.
The Developing an Evidence Base for Best Practice in Mathematics Education Project aimed to
identify key aspects that influence the learning and teaching of mathematics in Australian schools
showing superior gain in NAPLAN numeracy. It provides a snapshot in time of schools successful in
mathematics.
This study was commissioned by the Office of the Chief Scientist (OCS). The purpose of the project
was to identify the practices of schools that achieved superior gains (or high performance in year 9
where gain scores were not available for growth from year 7 to year 9 in West Australia and
Queensland) in NAPLAN numeracy during the time periods 2011–2013 and 2012–2014. NAPLAN is
acknowledged as a narrow measure of success, but it is the only common tool used across the whole
of Australia.
The goal of the project was to build a compelling evidence base for national best practice in
mathematics education. To this end, the OCS identified a series of objectives:
1. To identify state and territory level, system level, school level, and teacher practices that
achieve superior gain in NAPLAN numeracy test performance between 2011 and 2013 for
years 3 and 5 and years 7 and 9.
2. To identify defined practices in primary and secondary schools that result in superior gain
at the state and territory, educational system and school levels.
3. To identify schools with superior gain where students:
a. are confident to use mathematics in routine and non-routine ways to solve real
world and mathematical problems;
b. feel positive about what they are doing in mathematics;
c. have the cognitive skills to think deeply and meaningfully about application of
mathematics to problems, and communicate these thoughts.
4. To identify the levels and types of mathematics teacher qualifications in these schools.
5 To identify the levels and types of professional development available to and undertaken
by mathematics teachers in these schools.

8
6. To describe the teaching resources used by mathematics teachers in these schools.
7. To describe the practices, teaching philosophies and pedagogies used by mathematics
teachers in these schools.
8. To understand the principal's and the school approach to mathematics teaching.
9. To determine the number of hours and lesson configurations for mathematics lessons.
Successful schools were defined in this study as those showing superior gain +1 SD above the mean
gain based on overall NAPLAN numeracy results, compared with like schools and with schools with
similar starting scores) in the time periods 2011–2013, and 2012–2014. ACARA provided a list of
schools showing superior gain. In jurisdictions where limited gain scores were available for years 7 to
9 (Queensland, South Australia, and West Australia), year 9 performance at +1 SD above the score
for all Australian schools or like schools was taken as the criterion. Schools showing superior
performance in year 9 were identified from 2014 NAPLAN numeracy data, and school systems, and
were confirmed by examination of the My School website.
There were three possibilities on which to base a judgement of superior gain defined as +1 SD above
the mean gain for gains from year 3 to Year 5, and year 7 to year 9. Within each year band (year 3 to
year 5, and year 7 to year 9), the first possibility was compared to all schools across Australia. The
second was compared with ‘like’ schools as used by ACARA to provide MySchool website
comparisons. The third possibility was compared to schools with similar start scores, as identified by
ACARA. It should be noted that although these criteria were adopted, where these could be checked
almost no schools met all three conditions (that is demonstrating superior gain compared with all
Australian schools, like schools, and schools with similar starting scores). Wherever possible schools
were selected that had met at least two of the three criteria, but there was also a requirement with
the case studies to balance state, location, sector and Index of Community Socio-Educational
Advantage (ICSEA, Australian Curriculum Assessment and Reporting Authority (ACARA), 2013). In
addition, NAPLAN has some imprecision in the measurement (a margin of error) associated with it
(Wu, 2010), that would also have had an impact. Hence, schools defined as having superior gain or
performance were not as clearly defined a group as might have been expected. Nevertheless, all the
schools that participated in the case studies had made superior gains during at least one of the
defined time periods on two of the three criteria.
It is important to note that because the specified basis for school inclusion was gain, many of the
schools considered were not necessarily high performing schools. It is possible to make significant
gains from a low base, and still be performing below the national average. These schools are ‘closing
the gap’, and hence are of interest in terms of practices and policies that help them to achieve this.
There are a number of reasons why schools may make gains, some of which are contextual rather
than related to best practice. For example, schools that have a large intake of students who come
from backgrounds where English is not the first language or are new to Australia may make large
gains because the students become more proficient in English. Similarly, secondary schools that
have a very diverse intake may have somewhat depressed scores in year 7, because the students are
still settling in to the new context, but show good gains by year 9 because the students are now
settled into the secondary school situation. Nevertheless, these schools have something to offer a
study of this nature because they are able to mitigate the students’ initial disadvantage.

9
Bronfenbrenner’s (1989) Ecological Systems Theory was used as a broad structural framework.
Ecological Systems Theory posits that there are different spheres of influence on an individual within
a particular situation. These influences interact with each other, creating a complex web of effects
that may be different for each person. In this study, the spheres of influence were the education
system in the state or territory in which the school operated, the school, the classroom and teacher,
and the individual student.
Several general framing questions guided the design of the study. These questions are not
fine-grained research questions but provided guidance for the development of instruments and
acknowledged the different levels of policy and practice influencing mathematics education. These
questions were:
1. What system level influences are evident in schools with superior NAPLAN numeracy
outcomes?
2. What school level influences are evident in schools with superior NAPLAN numeracy
outcomes?
3. What classroom level influences are evident in schools with superior NAPLAN numeracy
outcomes?
4. What individual student influences are evident in schools with superior NAPLAN
numeracy outcomes?
2.1 Underpinning assumptions
The following assumptions underpinned this study:
1. There is no one method or approach that leads to the achievement of superior results in
mathematics.
It was expected that in different situations, diverse approaches would be identified in
schools achieving success in mathematics. There are many ways of considering
approaches to mathematics education, all of which have sound theoretical frameworks.
For this research no value judgements were made about the approaches taken.
2. NAPLAN numeracy is the only common tool used across Australia; however, there may be
other ways of defining success in mathematics.
Systems, schools, and individuals (teachers, parents, and students) may perceive other
outcomes to be as important as NAPLAN scores, such as participation, enjoyment,
interest and so on. It was expected that this might be a consideration for many primary
schools, for example, and because school contexts differ it was important to allow for this
consideration in the study.
3. There are out-of-school factors that impact on outcomes.
Out-of-school factors may be real or imagined but include, for example, additional
tutoring and the school enrolment profile. Family factors can impact individual students
but less so at the aggregated level of the school. Out-of-school factors are acknowledged
but not explored in depth because they fell outside the scope of the study.

10
The focus of this study was the practices and processes used in schools of all types and backgrounds
successful in NAPLAN numeracy testing in order to identify ways in which other schools (defined as
schools that did not meet the successful school criteria) could adapt and emulate them. Against this
background, a study was developed that used survey and case study approaches to collect data
about factors influencing success in mathematics education. The full methodology is described in
detail in Chapter 3.
2.2 Previous research
There is an extensive body of research that has considered successful outcomes in schools and more
specifically in school mathematics. Only a brief review will be presented here, starting with some
recent reports published during the period of this study, and then general (non-mathematics)
findings, and finally, considering mathematics specific studies.
2.2.1 Recent reports
Since the project commenced in 2015, there have been several reports that have addressed matters
of interest and relevance to this study. These are reviewed in this section.
A recent study in New South Wales aimed to identify school factors common to all schools that
added value to students’ learning based on NAPLAN data and qualitative data collected from 14
(seven primary and seven secondary schools) schools that achieved high growth over the period
2010 to 2014 (Centre for Education Statistics and Evaluation [CESE], 2015). Although not exclusively
addressing mathematics, the findings suggested high value-add schools had six factors in place:
1. effective collaboration;
2. engaging and sharing in professional learning;
3. setting whole school goals and strategies for change;
4. using explicit and effective teaching strategies;
5. creating an environment that promotes learning and high levels of student engagement;
and
6. setting high expectations for achievement.
The CESE study also identified lower level contributing factors, such as responsive use of data at the
school, class and individual level to inform development of teaching programs. Other contributing
factors identified in the literature include factors such as teachers’ beliefs (see, for example, Leder,
Pehkonen, & Törner, 2002) and student level factors such as being engaged and focussed on learning
(see, for example, Jurdak, 2009). These syntheses provide valuable guidance, but limited detail about
practices that lead to success.
The use of data to inform teaching was the focus of a report from the Grattan Institute (Goss,
Hunter, Romanes, & Parsonage, 2015) that aimed to provide strategies for schools to follow. Their
focus was less on system or school use of NAPLAN data (although they acknowledged that NAPLAN
could be useful), and more on the ways in which individual teachers could target teaching effectively

11
to cater for every student. These researchers warned, however, that many schools ‘… say they
already target teaching. Certainly, they are not short of data. But this does not mean they are
collecting the right information at the right time and using it effectively. Most have a long way to
go’ (p. 1).
Using examples from the literature and from case studies conducted in six schools, Goss et al.
provided a checklist of effective uses of data that included, among other factors, having a shared
sense of responsibility for students’ learning, developing a common language across the school, and
in-house professional development.
Professional learning was the focus of a report from the National Center on Education and the
Economy (NCEE) (Jensen, Sonnemann, Roberts-Hull, & Hunter, 2016) in which the authors used
‘system’ to refer to jurisdictions—specifically a Chinese city, a Canadian province, an autonomous
region of China, and a city state. Using evidence from four high-performing systems, gathered from
interviews with a range of stakeholders, the authors identified three potential policy reforms,
namely: ‘developing professional learning leaders, evaluation and accountability, and creating time
for teachers to pursue effective professional learning’ (p. 4). Jensen et al. illustrate these reforms
with examples of effective professional learning programs targeting the development of learning
communities, mentoring and the use of external expertise. The report provides specific tools and
approaches that schools could adopt to develop effective teachers.
A recent report from the Organisation for Economic Cooperation and Development (OECD)
considered teaching excellence (Schleicher, 2016). Of particular interest is what Schleicher terms
‘cognitive activation’ strategies, such as having students explain their thinking. Using students’
responses to the Programme for International Student Assessment (PISA) background questionnaire
(OECD, 2006), these approaches were widely used across OECD countries whereas student-centred
strategies, such as small group work, were reported by students as being infrequently used. Results
from PISA suggested that students exposed to cognitive-activation approaches scored higher on
average, and particularly at the very highest levels of the PISA scale in mathematics. In addition,
both memorisation and elaboration strategies, such as making connections with prior learning and
real-life tasks, seem to be needed for effective mathematics learning, although elaboration
strategies are associated with success on more difficult tasks. Of concern for Australia is that student
reported use of memorisation strategies was well above the OECD average, but with respect to
elaboration strategies, Australian students reported some of the lowest use.
Elaboration and cognitive activation would appear to be key teaching approaches in mathematics. In
addition, the OECD examined teacher professionalism across three domains: knowledge, autonomy,
and peer networks. Knowledge best practices included participation in long-term professional
development and support for practitioner research. Autonomy best practices included decision
making in terms of the curriculum, teaching materials and assessment. Peer networks involved
formal induction into the profession and ongoing mentoring; peer feedback based on class
observations; and development of a professional development plan. Overall, as presented in the
OECD report, Australia performs in the middle of the OECD countries in terms of teacher
professionalism but lies considerably below New Zealand, Singapore, and England. Schleicher also
discusses ways of developing teacher professionalism and provides examples from diverse countries.
Finally, a recent report from the Australian Academy of Sciences (AAS) reviewed pedagogical
approaches and learning resources for mathematics education (Stacey, Vincent, Stephens, & Holton,
2015). The key finding from this report was for ‘a well-funded, well-evaluated long-term coherent

12
approach’ (p. 7). Stacey et al. found that although there was a suitable range of pedagogical
practices available to develop mathematics for the 21st century, the curriculum was often narrowed
to a focus on a limited range of mathematical skills. In particular there was insufficient emphasis on
the proficiency strands of the Australian Curriculum: Mathematics (AC-M), especially those of
problem solving and reasoning.
With respect to resources, the AAS report identified three issues: first, teachers lack time and
knowledge to find and evaluate resources adequately. This situation was especially applicable to
beginning teachers and out-of-field teachers. Second, many available resources, especially from the
internet are ‘of poor quality’ (p. 20). Third, planning a coherent program from the wide range of
resources available, including textbooks and online resources, is a difficult and time-consuming
process. The report highlighted a need for resources for high-level problem solving, including the use
of technology as an integral component of the learning process rather than for skills practice.
There are many pointers in these reports to characteristics of effective systems, schools and
teachers and practices that lead to improved student learning outcomes. The next section considers
some aspects that influence students’ learning in general (not just in mathematics).
2.2.2 General factors that influence learning
Hattie (2009) identified over 50 factors that provide large effect sizes in enhancing students’
learning. He used meta-analysis across many different studies to provide overall measures of effect
sizes and generalised information about elements influencing success. These elements address six
areas of influence: the student, the home, the school, the curriculum, the teacher, and the
approaches to teaching. In this project, no information was gathered about home influences, and
limited data were collected about individual students as ACARA data were not available at the
student level. Each of the other aspects identified by Hattie is considered in this brief review.
2.2.2.1 Students
Hattie reported that students’ prior achievement, in the form of a self-report about their perceived
success in the past, played a very large part in determining future success. Measured prior
achievement also had a large effect. These findings imply that schools where students know that
they are successful are likely to perform at higher levels. Of interest in this study is that some schools
do not perform at high levels but create large gains, especially from year 3 to year 5. These schools
may have been able to change students’ perceptions of their mathematics learning. Additional
student factors identified by Hattie include motivation, engagement and self-concept. These factors
were also considered in this study.
2.2.2.2 School effects
Hattie identified many school level effects on learning. Classroom cohesion and management, school
size, opportunities for small group learning, and the influences of peers all contributed to learning
outcomes. School leadership had an impact, and in particular leadership that promoted, participated
in, and supported teacher development. These findings were of particular relevance to this study
because the school was the main level of reporting.

13
2.2.2.3 Curriculum effects
The nature of the curriculum has an impact on students’ learning outcomes. The impact of the
curriculum on teachers has been researched elsewhere, often in relation to high stakes testing (e.g.,
Dulfer, Polesal, & Rice, 2012). The implementation of the curriculum within a school has an impact
on students’ learning outcomes, but the school curriculum itself is subject to pressures from broader
societal influences (see, for example, Reys, Reys, &. Rubenstein, 2010). Some of these were
considered in this project, such as the nexus between numeracy and mathematics.
2.2.2.4 Teacher effects
Teachers have a large impact on their students’ outcomes. Teachers’ relationships with students, not
labelling students, and teachers’ expectations were among some of the important aspects.
Professional development and the clarity of teacher explanations were also central to students’
outcomes, and these factors may play a key role in mathematics, where many teachers are known to
lack confidence (e.g., Bursal & Paznokas, 2010), and hence these ideas were of interest in this
project.
2.2.2.5 Teaching approaches
Hattie found that teachers who provided feedback to students that gave students clear direction
about ways in which they could move forward had a powerful effect. Black and Wiliam (1998) also
identified feedback as a key classroom strategy. In mathematics, this finding implies not only that
teachers can diagnose the problem but also that they can address it. Teaching approaches that
develop meta-cognition, and opportunities for problem-solving that promote self-questioning, so
that students reflect on their learning in a focussed way, also have an impact on outcomes. Teaching
study skills themselves can help, as can direct instruction in the sense of having defined objectives
and success criteria communicated to students, and a strong lesson structure including a formal
‘wrap-up’ of learning at the end. Clearly, what happens in the classroom is a key driver of students’
outcomes.
2.2.2.6 Professional development (professional learning)
Teachers who engaged with professional development (professional learning) tended to have a
greater impact on their students; however, effective professional development is more than a single
session or presentation (Meiers & Buckley, 2009). To have an impact on students’ learning outcomes
it needs to be ongoing, and to focus on content and pedagogical knowledge. Schleicher (2016)
echoes these principles.
2.2.3 Mathematics factors that influence learning
Although many of the studies used by Hattie involved mathematics, there is also a large body of
research from the field of mathematics education. These studies are categorised in the same way as
the more general studies.
2.2.3.1 Students
Studies focussing on students’ mathematical development formed the backbone of mathematics
education research for many years. Studies of this type originated with Piaget’s research (for
example, Piaget, 1941/1952). Although Piaget’s ideas have been largely superseded, the notion of a
developmental pathway in learning mathematics underpins many research studies. Developmentally
Appropriate Practice (DAP) (Perry, 2000) for example, has been widely applied in the early years of

14
schooling, as exemplified in the work of Wright (1998). This approach underpinned many quality
mathematics programs in the early years of schooling such as Count Me In Too
(http://www.schools.nsw.edu.au/learning/k_6/maths/prosupport.php).
Programs based on developmental frameworks typically require individual student assessments,
followed by appropriate teaching that addresses student needs. First Steps, Mathematics
(http://det.wa.edu.au/stepsresources/detcms/navigation/first-steps-mathematics/) is one such
approach. In the middle years of schooling the challenge is for students to move from additive to
multiplicative thinking (Siemon, Breed & Virgona, 2010) and the use of the developmental Learning
Assessment Framework (Siemon, Izard, Breed & Virgona, 2006) can aid this shift. Developmental
hierarchies have also been identified in geometry (Crowley, 1987), statistics (Watson & Callingham,
2003), and mental computation (Callingham & Watson, 2004). Algebra also develops over a period
of time as students move from concrete representations to using abstract thought (Susac, Bubic,
Vrbanc, & Planinic, 2014). There is considerable evidence that students’ stages of cognitive
development are critical for mathematics learning. Meeting these diverse stages appropriately can
be a challenge in classrooms where the difference in students’ mathematical development can be as
much as five or six years (Goss et al., 2015). One focus of this study was identifying practices used to
meet this challenge (see Chapters 4, 5, and 6).
In addition to the intellectual aspects, students bring a wide range of beliefs and attitudes to the
mathematics classroom. In both primary (for example, House, 2006; Thomson et al., 2012) and
secondary schools (Mason, 2003; Southwell & Karmis, 1994) there is evidence that students do not
like mathematics but recognise its importance, and that students who do like mathematics tend to
do better in tests of mathematics competence. Gender effects are evident in Australia, with less
than half of year 8 girls saying they like mathematics (House, 2006; Thomson et al., 2012). These
effects impact later choices of mathematics-based enrolments and careers (Lazarides & Watt, 2015;
Watt, Jansen, & Joukes, 2013).
Interest in mathematics is also related to achievement (Heinze, Reiss & Augsburg, 2005), but may
also be mediated by other constructs such as self-efficacy (Hay, Callingham, & Carmichael, 2015).
Motivation to learn mathematics is also associated with other constructs such as self-concept
(Githua & Mwangi, 2003) and gender (Watt et al., 2012). Mathematics self-concept, interest, and
importance are the primary motivations, which drive mathematics participation and aspirations
(Watt et al., 2012). In summary, students’ beliefs and attitudes are known to have an impact on
students’ mathematics learning outcomes.
2.2.3.2 School effects on mathematics
The socio-economic index of the school has a significant impact on students’ mathematical
outcomes, although this may differ across the different levels of student performance. In general, in
international studies, Australia is identified by the OECD as high performing/high equity; that is,
overall socio-economic disadvantage reduces students’ mathematical performance somewhat less
than it does in other countries. Principals perceived school climate, including factors such as bullying,
truancy and lack of respect for teachers, as affecting students’ performance in PISA (Thomson, De
Bortoli, & Buckley, 2013). The claim of equity, however, has been challenged as being only relative to
some other countries. There are considerable inequalities within Australian education (Jorgensen &
Lowrie, 2014).

15
At the school level there are also organisational factors that impact on students’ learning outcomes.
Lamb and Fullarton (2001), using data from Trends in International Mathematics and Science Study
(TIMSS) background surveys, identified that class grouping strategies (streaming), had a differential
effect depending on the level of achievement: high performing students improved at the expense of
low performing students. Teacher morale also appeared to play a part. These factors were of
importance in considering aspects of schooling that affected students’ outcomes.
2.2.3.3 Curriculum effects
Although Australia has a national curriculum, the ways in which the AC-M is implemented makes a
difference to students’ outcomes, through its impact on teachers’ planning and programming, and
choices of materials and approach. The ‘packaging’ of the curriculum also makes a difference.
Separating content into ‘silos’ (like algebra and geometry taught as discrete courses or units) is less
effective than a more integrated approach (Grouws et al., 2013). Although the Grouws et al. study
was undertaken in the USA, (which has a very different mathematics curriculum structure to that of
Australia), this finding is consistent with research that shows students are successful in mathematics
when their teachers deliberately make connections, both within mathematics and with outside
contexts (Askew, Brown, Rhodes, Wiliam, & Johnson, 1997).
The nature, emphases, and approaches advocated by the curriculum impact on the ways in which
teachers approach their work (Callingham & Burgess, 2014). A report by Dulfer, Polesel, & Rice
(2012) suggested the mathematics curriculum was being narrowed by the impact of NAPLAN.
2.2.3.4 Teacher effects on mathematics learning
There is a large body of research about teachers’ beliefs about mathematics and its teaching.
Teachers have lower expectations for students who appear to have difficulties learning mathematics
(for example Beswick, 2007/2008). Teachers’ beliefs about mathematics, such as whether they see
the subject as a set of procedures or as a way of thinking and solving problems, have an effect on
their teaching (Beswick, 2012). In addition, more confident teachers inspire more confidence in the
students they teach (Stipek, Givvin, Salmon, & MacGyvers, 2001).
Teachers’ knowledge of mathematics has been an important area of research for many years. There
is evidence going back many decades that primary teachers may lack mathematics content
knowledge (MCK) (Ma, 1999; Hurrell, 2013). In secondary schools there is a growing number of
teachers who are teaching ‘out-of-area’ (that is, outside their area of expertise or qualification) and
have limited training to teach mathematics (Weldon, 2015) and this limitation appears to be
associated with lower mathematics performance (Hill & Dalton, 2013).
Despite this background, there is little evidence that mathematics qualifications alone lead to
successful learning outcomes (Darling-Hammond & Young, 2002; Mewborn, 2001; Wilson, Floden, &
Ferrini-Mundy, 2001). There is a growing body of evidence that teachers of mathematics need to
have specialised knowledge of mathematics, variously called pedagogical content knowledge (PCK),
or mathematics for teaching (MfT). Although defined in different ways, the specialised ways in which
teachers know mathematics appear crucial. This specialised knowledge includes such aspects as
understanding students’ likely misconceptions, appropriate ways of representing mathematical
ideas, giving clear and mathematically correct explanations in ways that students can understand,
and recognising when students are ready to learn the next stage of mathematics (Ball, Thames, &
Phelps, 2008). This type of teaching knowledge of mathematics makes an impact on students’
learning outcomes, in primary schools (Hill, Rowan, & Ball, 2005), in middle years (Callingham,

16
Carmichael, & Watson, 2015), and secondary schools (Baumert et al., 2010). Teachers’ knowledge as
well as their attitudes and beliefs were of interest to this study (see Chapters 4 and 5).
2.2.3.5 Teaching approaches
The classroom activities and approaches to teaching mathematics used by teachers are related to
issues of teachers’ knowledge for teaching. There are many ways of achieving high performance in
mathematics, and these can be placed on a continuum of teaching approaches from a didactic,
teacher-centred model at one end to a social-constructivist, student-focussed model at the other. A
detailed discussion of the theoretical underpinnings and merits of the approaches at the extremes is
beyond the scope of this study. There has been, however, considerable debate about the efficacy of
different approaches (Ewing, 2011; Klein, 2007; Schoenfeld, 2004. Anthony and Walshaw (2009)
suggested mathematics pedagogy should be founded on a number of principles:
all students have the right to access and experience ‘mathematical culture’;
all students can become ‘powerful mathematical learners’;
all cultures and heritages should be acknowledged;
the pedagogy should lead to academic outcomes including ‘conceptual understanding,
procedural fluency, strategic competence, and adaptive reasoning’; and
social outcomes should be developed within the mathematics classroom (p. 6).
In this study, no value judgements were made about different approaches to teaching mathematics,
however, different approaches were canvassed and documented to provide an evidence base of
what is happening in Australian mathematics classrooms.
2.2.3.6 Evidence-based teaching
Research indicates that using appropriate data to refine and target teaching approaches is an
effective way to improve students’ achievement (Goss, et al., 2015). NAPLAN provides useful
information to systems, schools, and classes within larger schools. It is less useful for targeting
individual student learning because of the nature of the data and associated measurement errors
(Wu, 2010). Schools are provided with a variety of complex reports and ways in which they can
consider the data from NAPLAN, but many teachers struggle with the statistical literacy needed to
interpret the information (Chick & Pierce, 2013). At the same time, the practice of rigidly streaming
students into particular groups based on a test is known to inhibit performance for some groups
(Jorgensen & Sullivan, 2010). Using growth as a basis for determining success implies that all
students will learn mathematics. There was, therefore, interest in identifying how schools and
teachers used data to inform mathematics teaching for all students in this study.
It is worth remembering that all of these effects interact in the real world of a practising school,
whereas in research studies they may be examined in isolation. In this study there was interest in
the nature of the interactions among the diverse variables, and particularly how these interactions
impacted on students’ learning outcomes in mathematics (see Chapters 4 and 5).

17
2.2.4 Factors of interest to this study
Against the background of prior research outlined earlier, a range of factors was identified that play
a part in students’ learning outcomes, in mathematics and more generally, at each level of influence
(system, school, classroom, student) following Bronfenbrenner’s (1989) model.
Specific factors that provided the focus for the study at the school level included:
ways in which the curriculum is implemented at system and school levels;
organisation and grouping for learning, including the use of data to inform school level
decisions;
professional development, qualifications and backgrounds of teachers of mathematics;
teachers’ attitudes towards mathematics and its teaching;
resources allocated to mathematics, including time and personnel, as well as material for
classroom use; and
attitudes and practices relating to NAPLAN, following reports that NAPLAN was causing
undue stress to students and teachers.
At the classroom level, factors of interest included:
teaching practices;
classroom environment; and
homework practices.
Individual level factors included:
leadership;
beliefs about mathematics and its teaching and learning;
goal orientations (mastery or performance) perceived by teachers and students; and
demographic information including teacher and student characteristics.
The study methodology which was used to investigate the different factors and their interactions is
presented in the next chapter.
18
3 3 Methodology
The project adopted a cross-sectional approach to provide a description of processes used by
schools that demonstrated successful outcomes in NAPLAN numeracy. Successful outcomes were
defined in terms of growth, and performance where growth data were not available (as in some
secondary schools in Western Australia, South Australia and Queensland).
The study considered a continuum of practices based on goal orientation of mastery or performance
(Kaplan & Maehr, 2007), and no judgements were made about the value or worth of these different
orientations. A performance orientation has a greater focus on demonstrating competence, with a
focus on skills (rather than understanding), achievement, and competition. A mastery orientation
has a greater focus on developing competence, including making connections within mathematics,
having an interest in mathematics, and cooperation (Kaplan & Maehr, 2007). The dual goal
orientation framework also provided for the examination of a wide range of factors that impact on
students’ mathematics learning outcomes, as described in the previous chapter. Both performance
and mastery goals, applied at different levels (system, school, classroom, individual) following
Bronfenbrenner’s (1989) model, were acknowledged as providing valid routes to high performance.
Regardless of the nature of the goal orientation framework, it was recognised that there are
opportunity costs associated with choices made at every level of the system, in terms of resourcing
and personal effort. Many of the factors outlined in Chapter 2 are cost variables, such as choices
made in managing teaching, class groupings, programming and so on. These factors were also
considered in this study.
3.1 Data collection approaches
Three data collection approaches were used:
1. a desktop review of system level provisions;
2. surveys of school leaders, teachers and students; and
3. case studies in schools in every state and territory.
Each of these approaches is described in the following sections.
3.1.1 Desktop review
Websites for all systems (state and territory, independent and Catholic sectors where these were
available) were identified. These websites included those of specialist curriculum authorities as well
as departmental agencies. In addition, informal interviews and conversations with curriculum
specialists, professional development (professional learning) providers, and other researchers also
helped to identify relevant activities, which addressed mathematics learning and teaching, occurring
in different states across Australia. A summary of the websites examined is provided in Appendix A1.
A key consideration in this study was how the Australian Curriculum: Mathematics (AC-M) was being
implemented across Australia. The system resources were examined for evidence of curriculum
implementation, support for mathematics/numeracy, particular programs or approaches, and

19
strategic directions. Additional information was gathered by discussion with appropriate people
within systems.
3.1.2 Surveys
Surveys were used to collect data from a wide range of schools. All schools that met the success
criteria of growth or Year 9 performance (Growth: 2011–2013, n = 319; 2012-2014, n = 204;
Performance n = 96; total = 619) were identified and a specific invitation to these schools was sent.
In addition the survey was sent out to schools that did not meet the criteria (called other schools)
across Australia, where systems agreed to participate. Survey invitations were sent by email directly
to schools, and were supplemented by sending survey links through professional associations,
including the Australian Association of Mathematics Teachers, some state systems and Catholic
dioceses, and through the personal networks of the project team. Surveys were left open until the
end of Term 4, and reminder emails send out twice during the period. In the last three weeks of
term the superior gain/ high Year 9 performance schools that had not responded were contacted by
phone.
Survey instruments were mostly taken from existing validated instruments and where these were
used the original question structure was used to maintain the integrity of the instrument. The
surveys were tailored to the target group of respondents, leaders, teachers, and students. In some
instances questions were not presented depending on responses to prior questions. Some questions
were presented only to secondary teachers at the request of the primary principals’ organisations.
Survey questions, target constructs, and response codes are provided in Appendix A2, together with
links to the online surveys.
Details about sample responses are provided in section 3.1.3. Appendix B presents an analysis of the
sample of schools identified by ACARA as superior gain schools, and the schools that responded to
the surveys.
The next sections provide details of the survey instruments and structures.
3.1.2.1 Leader and teacher surveys
Demographic questions: these questions addressed a range of personal and school factors.
3.1.2.2 School level factors included in both leaders’ and teachers’ surveys
Collective efficacy: this construct provided a measure of the coherence of the school effectiveness
in dealing with the students in the context of their community. Twelve questions from Goddard
(2002).
NAPLAN: this construct addressed the impact and effects of NAPLAN in the school. Thirteen
questions created for this study from themes identified in Thompson (2013).
Teacher practices leading to engagement: these questions addressed ways of teaching
mathematics that may lead to increased engagement in mathematics. Nineteen questions, created
from a variety of sources about mathematics teaching practices.
Teacher practices leading to achievement: these questions addressed ways of teaching
mathematics that may lead to increased achievement in mathematics. Nineteen questions.
Created from a variety of sources about mathematics teaching practices.

20
3.1.2.3 School level factors included in leaders’ survey only
School climate: this construct provided a measure of the tone or ‘feel’ of the school and factors
that impact on students’ learning. Sixteen questions (secondary schools); 14 questions (primary
schools) taken from background questionnaires from PISA 2012 (OECD, 2012).
Curriculum: this construct addressed the implementation of the AC-M and the school’s use of
external texts, as well as organisational factors such as timetable allocation for mathematics, and
homework expectations. Four questions created for this study. Additional questions addressing the
detail of the curriculum were included for teachers only.
3.1.2.4 Individual level factors included in leaders’ and teachers’ surveys
Hours worked: this construct determined the amount of time spent on teaching, and on ‘school-
related matters’ on weekdays, and weekends. Three questions.
Stress and burnout: this construct addressed teacher and leader stress, positive and negative,
including emotional exhaustion and depersonalisation. Nineteen questions. With some additions,
taken from Maslach, Jackson, and Leiter (1996).
Mindset: this construct addressed perceptions of intelligence. Three questions from Dweck, Chiu,
and Hong (1995).
3.1.2.5 Individual level factors included in leaders’ surveys only
Leadership style: this construct addressed the way in which the school is managed and decisions
are made. Twenty questions (Secondary School); 19 questions (some slightly adapted) (primary
school) from the PISA 2012 School Questionnaire (OECD, 2012).
Perceptions of goal orientation: this construct addressed the way in which the school is oriented
towards performance and/or mastery. Thirteen questions, adapted from Butler (2007).
Responsibility: this construct provided a measure of school autonomy. Eleven questions adapted
for school leaders from Lauermann and Karabenick (2013).
Self-efficacy: this construct considered the individual sense of efficacy for school leaders. Twelve
questions from Tschannen-Moran and Careis (2004).
Enthusiasm for Teaching: this construct considered the extent to which teachers and school
leaders are enthusiastic about teaching. Eight questions adapted from Kunter et al. (2011) and
Chan et al. (2008).
3.1.2.6 Individual level factors included in teachers’ surveys only
Professional learning: addressed teachers’ professional development specifically for mathematics.
Five questions created for this study.
Goal orientation: this construct addressed teachers’ perceptions of goal achievement. Twenty
questions from Butler (2007).
Teachers’ sense of efficacy: this construct addressed teachers’ sense of efficacy for teaching
mathematics. Twelve questions adapted for mathematics from Tschannen-Moran and Woolfolk-
Hoy (2001).

21
Teacher responsibility: this construct addressed teachers’ sense of how personally responsible
teachers feel for educational outcomes. Thirteen questions from Lauermann and Karabenick
(2013).
Teacher enthusiasm: this construct addressed how teachers feel about mathematics and its
teaching. Five questions, adapted for mathematics from Kunter et al. (2011).
Teaching practices: this construct addressed teachers’ approaches to teaching mathematics.
Thirteen questions, adapted for mathematics from the German translation of Clausen (2002).
Teacher knowledge: this construct considered teachers’ knowledge of mathematics and it’s
teaching, including pedagogical content knowledge. Ten questions appropriate to the school level
selected from Beswick and Callingham (2011).
3.1.2.7 Student surveys
Student surveys were provided in two forms. One was designed for students from year 3 to year 6
and the other for students from year 7 to year 10. The younger students’ survey asked similar
questions to the older students’ survey but the number of questions was reduced and questions
relevant only to secondary schools were removed. Some questions were reworded to make them
more understandable to young students.
Demographics: these questions asked only about basic information such as gender, age and year
level, and a self-report of their last mathematics grade.
Mathematics classroom climate: these questions addressed the nature of the mathematics
classroom. Sixteen questions from Watt (2012).
Friends perceptions of maths: this construct addressed the ways in which students’ peers think
about mathematics. Four questions from Watt (2012).
Perceptions of NAPLAN: this construct considered what students think about NAPLAN, Four
questions based on themes in Wyn, Turnbull, and Grimshaw (2014).
Homework: these questions investigated students’ perceptions of homework in mathematics.
Three questions created for this study.
Mathematics motivations and perceptions: this construct addressed factors that impact on
students’ thinking about mathematics and their beliefs about themselves as mathematics learners.
Twenty questions selected from Watt (2004), and the PISA (2006) Student Questionnaire (OECD,
2006).
Personal goals in mathematics: this construct identified students’ goals in mathematics classes.
Fourteen questions, selected from Fuchs et al. (1994).
Interest in mathematics: addressed students’ interest and liking for mathematics. Nine questions,
selected from Watt (2004).
Gender perceptions of mathematics: considered students’ thinking about whether boys or girls do
better in mathematics. Four questions from Watt (2012).

22
Mindset: this construct addressed perceptions of intelligence. Three questions from Dweck, Chiu,
and Hong (1995).
Perceptions of school: the construct addressed students’ perceptions of school. Four questions
adapted from You et al. (2011).
Perceptions of mathematics teaching: this construct addressed students’ views about mathematics
teaching. Nine questions from Watt (2012).
Feelings about school: considered how students feel about school and their schoolwork. Nine
questions from Samela-Aro, Kiuru, Leskinen, and Nurmi (2009).
Mathematics career: a series of mainly open questions about mathematically-related careers. Five
questions from Watt (2012).
3.1.3 Survey responses
A brief outline of the samples that responded to the surveys is presented in this section. The term
successful school is reserved for those schools defined in Chapter 1 as showing gain of +1 SD, or very
high performance where gain scores were not available, during the defined time periods. The term
other school is used for those schools that did not meet the success criteria for inclusion in the study.
Details of school level demographics of all surveys, broken down by successful and other schools are
provided in Appendix B. Successful schools from which teacher and leader responses were received
were compared with the ACARA dataset on five comparison categories: state, sector, school type,
geolocation, and ICSEA. Schools in New South Wales and Queensland were somewhat under-
represented in the surveys, as were schools in the Catholic education sector. Combined schools
(foundation to Year 10 or Year 12) were slightly over-represented in the survey schools. The
geolocation distribution was very similar. The ICSEA measure between the survey successful schools
and the ACARA dataset showed no statistically significant difference, although there was a
statistically significant difference between the successful and other schools that participated in the
survey. ICSEA, as a measure of socio-economic status, is a key determinant of educational advantage
(e.g., Sirin, 2005). The results presented in this chapter are of individual responses, and are not
aggregated by school.

23
3.1.3.1. Leaders’ survey responses
Of 107 school leaders who had started the survey, responses were received from 97 individuals. A
summary of responses by school type is shown in Table 3.1:1.
Table 3.1:1 Leaders’ responses
These leaders were located in 16 successful schools (31 responses in total) and 61 other schools (66
responses in total). Of these 16 successful schools, six had shown sustained high growth across both
time periods (2011–2013 and 2012–2014). Eleven of these schools participated in case studies.
3.1.3.2 Teacher survey responses
Of 207 teachers who had started the survey, responses were received from 202 individuals, not all of
whom responded to every question. A summary of responses by primary or secondary teachers is
shown in Table 3.1:2.
Table 3.1:2 Teachers’ responses by school type
*Note: 182 teachers responded to this question.
These teachers were located in 28 successful schools (124 responses overall) and 31 other schools
(58 responses overall). Of the 28 successful schools, 17 were also involved in case studies. Every year
of schooling was covered, from foundation to year 12, although it should be noted that respondents
could indicate more than one year level. Seven teachers were not teaching a class—these were most
likely senior teachers, curriculum leaders, or coaches.
3.1.3.3 Students’ survey responses
The data reported in this report are taken from a total of 1095 responses, of which 28 (2.6%) were
invalid—that is, they chose not to complete any part of the survey after logging on. It is possible
some of these invalid responses were from teachers or school leaders who wanted to know what the
survey contained before presenting it to their students. Of the valid responses, 56.3% came from
School type School sector
Total Government Independent Catholic
Primary school 40 2 12 54
Secondary school 14 2 1 17
Combined school 6 20 0 26
Total 60 24 13 97
School type School sector
Total Government Independent Catholic
Primary school 79 14 23 116
Secondary school 29 2 35 66
Total 108 16 58 182*
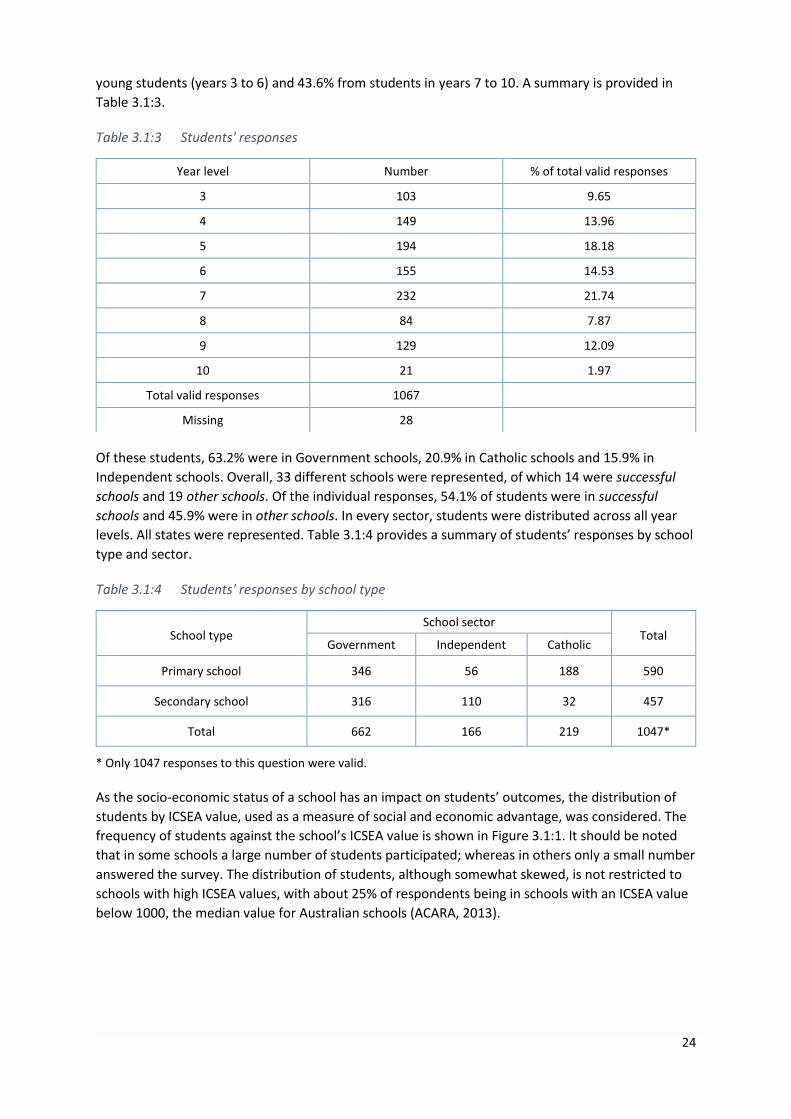
24
young students (years 3 to 6) and 43.6% from students in years 7 to 10. A summary is provided in
Table 3.1:3.
Table 3.1:3 Students' responses
Of these students, 63.2% were in Government schools, 20.9% in Catholic schools and 15.9% in
Independent schools. Overall, 33 different schools were represented, of which 14 were successful
schools and 19 other schools. Of the individual responses, 54.1% of students were in successful
schools and 45.9% were in other schools. In every sector, students were distributed across all year
levels. All states were represented. Table 3.1:4 provides a summary of students’ responses by school
type and sector.
Table 3.1:4 Students' responses by school type
School type
School sector Total
Government Independent Catholic
Primary school 346 56 188 590
Secondary school 316 110 32 457
Total 662 166 219 1047*
* Only 1047 responses to this question were valid.
As the socio-economic status of a school has an impact on students’ outcomes, the distribution of
students by ICSEA value, used as a measure of social and economic advantage, was considered. The
frequency of students against the school’s ICSEA value is shown in Figure 3.1:1. It should be noted
that in some schools a large number of students participated; whereas in others only a small number
answered the survey. The distribution of students, although somewhat skewed, is not restricted to
schools with high ICSEA values, with about 25% of respondents being in schools with an ICSEA value
below 1000, the median value for Australian schools (ACARA, 2013).
Year level Number % of total valid responses
3 103 9.65
4 149 13.96
5 194 18.18
6 155 14.53
7 232 21.74
8 84 7.87
9 129 12.09
10 21 1.97
Total valid responses 1067
Missing 28

25
Figure 3.1:1 Distribution of student responses by the ICSEA value of their school
3.1.4 Case studies
The aim for the case studies was to identify 60 successful schools across Australia.
Schools were selected from the superior gain/high performance schools identified in ACARA data
sets to cover a variety of school types (primary, secondary, combined), all sectors, diverse locations,
school size, socio-economic status as measured by ICSEA, and other features of interest such as
selective secondary schools, and single sex schools. A number of schools declined the initial
invitation because of other commitments or delays in obtaining clearance from the relevant
authority. When this happened, attempts were made to replace these schools with a similar school.
To ensure national coverage, a minimum of five schools was the target for each state or territory. In
small states and territories, this requirement meant there was a restricted pool of potential case
study sites. Schools were grouped into target schools and reserve schools that were matched as far
as possible in terms of sector, school type, and location. In particular, efforts were made to identify
schools outside capital cities. Schools were not approached until system permissions were granted;
in practice this meant that access to schools was not possible until Term 4. Perhaps because of the
time of year many schools declined to participate, and most case study schools agreed to the case
study but not the student survey because of the disruption. Of the initial 60 schools approached, 41
refused to participate. These schools were replaced with reserve list schools wherever possible,
leading to a final sample of 52 schools. In three of the combined schools, both primary and
secondary sites provided case studies. Altogether 55 case studies were conducted. Details about the
sample are provided in the next section.
To ensure consistency across such a large number of case studies, a detailed protocol was
developed. Semi-structured interviews were conducted with the principal and/or a school
0
20
40
60
80
100
120
140
160
180
200
89
9
90
4
91
2
91
5
92
3
93
6
95
8
96
7
98
2
98
9
10
04
10
05
10
09
10
13
10
21
10
27
10
30
10
60
10
64
10
79
10
98
11
13
11
37
11
45
11
47
11
71
11
83
12
02
Nu
mb
er o
f R
esp
on
ses
ICSEA value of school

26
mathematics leader, at least two teachers, and a focus group of students where appropriate
permissions were obtained (40 schools). In addition, two ordinary mathematics lessons were
observed, and in some schools a focus group was conducted with parents. Because of timing three
schools were contacted by phone only. In these instances, the appropriate school leader or teacher
interview protocol was used.
To minimise school disruption, the case studies were undertaken on a single day. The choice of
teachers and classes available was hence restricted. In general, visits were arranged on the ground
by either the principal or another school leader, as appropriate to that school. This practice is
consistent with case study research which ‘…is not sampling research’ (Stake, 1995, p. 5).
Every case study was undertaken by an experienced researcher with recent experience of visiting
schools, and familiarity with undertaking observations. These researchers reported to three
members of the project team who led ‘hubs’ responsible for about 20 case studies. The hub leaders
organised training, managed the case study process and the data collected.
A reporting template was developed for those undertaking the individual case studies to provide a
consistent reporting focus. These reports were descriptive in nature, and were submitted to the hub
leader. Each hub leader then synthesised the reports for which they were responsible to provide an
overall view of factors within these schools that impacted on mathematics learning and teaching.
These initial reports were circulated among the project team, and discussed during three
teleconferences. The hub leaders also provided the school stories that were the basis for a series of
vignettes. Finally, the three hub reports were synthesised to identify the key ideas and themes
emerging from the study. This process ensured considerable crosschecking of the qualitative data by
researchers.
Copies of the data collection and case study report protocols are provided in Appendix A3.

27
3.1.4.1 Case study sample
Case studies were undertaken in every state and territory of Australia.
The location of the case study schools is shown in Figure 3.1:2. Although all schools were classified as
metropolitan or provincial, several were in relatively remote locations.
Figure 3.1:2 Locations of case study schools
Case studies were undertaken in every sector. Table 3.1:5 shows the distribution of schools by state
and sector. Catholic schools were slightly under-represented in the case studies. The target total for
each state is shown. A number of schools invited to participate chose to decline, most likely because
of timing and the lateness of getting permissions from state authorities. Wherever possible attempts
were made to find a replacement but this was not always possible. As a result, the target was not
met in every state.
Table 3.1:5 Case study schools by state and sector
Government Independent Catholic Total Target
ACT 5 1 1 7 6
NSW 6 2 8 12
NT 2 1 3 4
QLD 2 2 1 5 7
SA 3 2 2 7 7
TAS 3 3 6 5
VIC 5 4 1 10 12
WA 2 3 1 6 7
Total 28 16 8 52 60

28
Case studies were undertaken in primary and secondary settings. In some instances in combined
schools both primary and secondary conditions were examined as a single entity. In three combined
schools, which ran as separate schools on different campuses, two case studies were conducted.
Table 3.1:6 shows the breakdown by school type.
Table 3.1:6 Case study schools by school type
School socio-economic status is a predictor of achievement so there was interest in visiting a range
of successful schools including those that were below average ICSEA values. The average ICSEA value
of the case study schools was 1068, which is slightly above the mean ICSEA value, which is set at
1000. The ICSEA values ranged from 899 to 1212. The distribution of ICSEA values for the case study
schools is shown in Figure 3.1:3.
Figure 3.1:3 ICSEA value distribution of case study schools
Combined Primary Secondary
ACT 5 2
NSW 4 4
NT 2 1
QLD 1 3 1
SA 5 2
TAS 4 2
VIC 1 5 4
WA 1 3 2
Total 7 28 17

29
Table 3.1:7 shows the case study schools sampled from the ACARA superior gain in numeracy lists
from 2011–2013 and 2012–2014. The highlighted cells indicate the gain scores deemed by ACARA to
meet criteria for high gain against either similar schools or schools with the same start scores.
Where additional NAPLAN data were available estimated values have been included (including gains
from year 5 to year 7 in combined schools). Two schools were included because of performance in
year 9 in states where there were limited examples of superior gain schools from year 7 to year 9
because of organisational arrangements in these states.
These schools were all flagged by ACARA as having superior gain in at least one of the relevant time
periods. The highlighted cells indicate the time period in which the superior gain was identified by
ACARA. No gain indicates that the school was included on the basis of year 9 performance.

30
Table 3.1:7 Case study sample schools
School ID* ICSEA Time
period State Location Sector School type
Gain Year 3–Year 5 Gain Year 5–Year 7 Gain Year 7–Year 9
2011–2013 2012–2014 2011–2013 2012–2014 2011–2013 2012–2014
101 1155 11-13 ACT Metro G Primary 123 86
102 1128 12-14 ACT Metro G Secondary 52
111 1203 12-14 ACT Metro I Secondary 82 48 56
118 1128 12-14 ACT Metro C Primary 101
126 1156 12-14 ACT Metro G Primary 102
149 973 12-14 ACT Metro G Primary 86
108 911 Both NSW Metro G Secondary 61 69
125 1022 Both NSW Metro G Secondary 63 67
127 1095 12-14 NSW Metro C Secondary 59 65
128 921 11-13 NSW Provincial G Primary 116 80
130 1149 12-14 NSW Metro G Primary 106
131 1212 11-13 NSW Metro G Secondary 78 41
140 1202 11-13 NSW Metro C Primary 129
141 939 11-13 NSW Metro G Primary 111
150 1129 11-13 NSW Metro G Secondary 59
117 1028 12-14 NT Provincial I Combined 79 69 54
119 924 12-14 NT Provincial G Primary 119
120 899 11-13 NT Provincial G Primary 123 87
100 1020 Both QLD Metro I Combined 132 92 62 58 44
124 998 12-14 QLD Metro G Primary 118 122 73
139 1052 11-13 QLD Provincial C Primary 117 130 78
144 1113 11-13 QLD Metro I Combined 116 111 64 44
148 1103 2014 QLD Metro G Secondary
109 1055 12-14 SA Metro C Combined 64
129 1021 12-14 SA Provincial I Combined 127 69 45
135 1185 11-13 SA Metro I Primary 115 95 60

31
137 1071 12-14 SA Provincial C Primary 111 43
138 1048 12-14 SA Metro G Primary 148 63
145 1004 12-14 SA Provincial G Combined 129 87 67
147 987 2014 SA Provincial G Secondary
122 1147 12-14 TAS Metro G Primary 106
123 1120 12-14 TAS Metro I Secondary 56 45 54
132 994 11-13 TAS Metro I Combined 118 92
133 1014 12-14 TAS Metro G Primary 94
143 1171 12-14 TAS Metro I Combined 77 61 57
146 923 12-14 TAS Provincial G Combined 117 71 73
103 1111 11-13 VIC Metro I Combined 109 74 99 27
105 1155 Both VIC Provincial I Combined 98 91 70 79
106 978 11-13 VIC Provincial G Combined 128 99 79 52
110 1183 11-13 VIC Metro I Secondary 87 77 63 51
112 1016 12-14 VIC Metro G Primary 114
113 936 12-14 VIC Provincial G Secondary 66
114 958 Both VIC Provincial G Primary 136 140
115 1106 12-14 VIC Provincial I Combined 116 59 39
116 1098 11-13 VIC Metro G Secondary 60 58
134 1193 12-14 VIC Metro C Primary 122
104 946 11-13 WA Metro G Primary 130 113 90
107 1130 12-14 WA Provincial I Combined 107 57 73
120 1079 Both WA Metro I Combined 126 109 63 89
121 985 Both WA Provincial G Combined 120 123 96 68
136 1016 12-14 WA Provincial C Primary 117 135
142 1075 12-14 WA Metro I Combined 108 26 65
Notes: The ‘Time period’ columns refer to the period over which the school achieved superior gain. The abbreviations in the ‘Sector’ column are C = Catholic, G = government, I =
independent. *In order to preserve school anonymity, the School IDs in Table 3.1:7 in are unrelated to the IDs in Table 6.2:2.

32
4 4 Evidence from the desktop review
This chapter outlines the evidence of system-level current practice in mathematics education at the
time of the study identified from the desktop review. For the purpose of this study, ‘system’ is used
to mean Government, Catholic, and Independent sectors working within a state or territory
jurisdiction, The sectors and jurisdictions interact in that schools within different sectors within a
state or territory generally follow the curriculum as it is implemented within the home state or
territory. The evidence from the desktop review pertains particularly to systems, but these influence
what happens in schools. The findings are organised around four key themes:
1. curriculum implementation;
2. support for mathematics and numeracy;
3. particular programs; and
4. strategic direction.
Findings at the system level are largely based on the review of websites as well as comments made
by members of the reference group during meetings and in other conversations, and from other
sources, including professional development providers and system employees. Unless otherwise
stated, all information in this chapter was obtained from the websites listed in Appendix A1.
4.1 Key findings
Across the states and territories:
there is diversity in the way in which the AC-M is delivered and supported.
there is duplication in the nature and types of materials developed and provided to
teachers;
different research-based programs are suggested, depending on the location of the
underpinning research;
the use of data is a key strategic focus, but more examples are needed in mathematics,
especially addressing the mathematics proficiencies; and
numeracy is a dominant theme, and the Number and Algebra strand of the curriculum is
emphasised.
4.1.1 Curriculum implementation
All states and territories implemented the AC-M although the two largest states, Victoria and New
South Wales, used curriculum structures with which their schools were familiar (AusVELS levels in
Victoria and Stages in New South Wales) and fitted the AC-M into this framework. Other states,
particularly small ones, referred to the ACARA website.
Mathematics and numeracy were both represented in systems’ documentation. Numeracy is
recognised in the Australian Curriculum as a cross-curriculum capability, which is the responsibility
of all teachers to develop and foster. Mathematics is the defined subject area. On websites, there

33
was a strong emphasis on numeracy, to the point where, in some places, the numeracy continuum
within the general capabilities (ACARA, 2014) appears to have become a de facto mathematics
curriculum, especially in the primary years. In part, this situation has come about because of the
requirement for the formal Australian Curriculum to be presented in a consistent way across the
country. The statutory curriculum authorities in each state are responsible for the mathematics
curriculum. Curriculum support arrangements fall within the remit of education departments. In
larger states both organisations provide good quality research-based support materials, whereas in
smaller states the mathematics curriculum is provided through a link to the ACARA website with
little additional material. That said, there is evidence of systems using publically available material
from other systems as support for the implementation of the curriculum.
Catholic systems tend to follow the state’s direction but independent schools may implement
alternative curricula, such as the International Baccalaureate (IB) programs. Teachers in some case
study schools where the IB was used pointed to the difficulty of implementing the IB and, at the
same time, having to report on the AC-M. The integrated nature of IB programs seemed to be at
odds with the Australian Curriculum, particularly through the reporting requirements. In secondary
schools offering the IB in years 11 and 12, students had to opt into either the state-based year 11/12
program or the IB because the expectations were so different.
This fragmented situation is unlikely to change in the foreseeable future because of the
constitutional arrangements for education. Nevertheless, there is room for a more focussed and
strategic approach nationally to the development of approaches for the delivery of the mathematics
curriculum.
4.1.2 Support for mathematics/numeracy across states and territories
There is considerable support provided to schools, teachers, and parents in the form of resources
and advice for numeracy in particular, with literacy and numeracy strategies available in all states
and territories. Support includes additional personnel such as coaches and curriculum leaders. There
is a strong emphasis on developing leadership.
Despite the support, there was an impression overall that literacy takes the major share of
resources. Examples provided on websites of the work of literacy and numeracy coaches, for
example, although labelled literacy and numeracy, focus on literacy, specifically reading. There is
also a focus on early- and primary years numeracy, with less support available for secondary years in
either numeracy or mathematics. The exception to the secondary years support is in the large states
with well-resourced curriculum authorities. Many of the states have excellent numeracy resources
available but these are not always accessible to all teachers and schools. Sometimes specialist
materials can only be accessed by teachers in a particular state. Although this situation is
understandable it leads to duplication of effort.
For example, in 2015 New South Wales published a Numeracy Skills Framework, and Queensland is
in the process of developing something similar, drawing on the same research background to a large
extent. Although recognising the need for contextual sensitivity, this example of duplication might
be avoidable, and points to a need for closer inter-state collaboration.
A number of systems use coaches, whose responsibility is to improve the teaching of literacy and
numeracy. These individuals are often experienced teachers with skills in pedagogical approaches,

34
but may not have specific expertise in mathematics or numeracy. They work with a group of
allocated schools. The approach that they take varies but is often based on the work of Boyd (see
Boyd, 2008). Coaches may be an effective approach to professional learning, but they may need
additional knowledge of effective mathematics pedagogy. Although in some systems numeracy and
mathematics pedagogical content knowledge was included in coaches’ training programs, the time
allocated was, of necessity, limited. In secondary schools, coaches with subject specialisation may be
more effective.
In general, systems used additional support funding through a range of federal and state initiatives.
National partnerships funding was mentioned often in the school examples available. The relatively
short-term nature of program funding raises issues about sustainability, and this was sometimes
mentioned in the school-based reports available on the web when this study was conducted.
From phone and personal discussions by researchers undertaking the system level review with
professional development providers and systems experts, the approach to curriculum
implementation appeared often to be focussed on deficit, that is bringing low achieving students
closer to the average performance, rather than on developing the mathematical capacity of all
students. Comments included many generalisations about the quality of teachers and their
pedagogy, notably in secondary schools. There seemed to be a particular philosophy of what
constituted effective mathematics or numeracy pedagogy, with a focus on student centred
approaches using small group work and concrete materials, and scaffolding students’ development
through activities that build understanding. Rather than identifying or building on effective practices,
professional learning provided a single approach to address perceived problems.
4.1.3 Particular programs or approaches
Because the AC-M does not address approaches to teaching, there was interest in examining
whether systems appeared to favour particular approaches. Depending on the state, specific
programs are presented on websites, such as Count Me In Too, QuickSmart, First Steps, and
Scaffolding Numeracy in the Middle Years (SNMY). These programs take different routes to
developing mathematics, and are intended for diverse student groups. By and large, these programs
have tended to influence their home state—the state in which the original research was
undertaken—rather than have a national influence, although individual schools across Australia did
use some aspects of programs from other states.
An example of a quality research-based resource is the Fractions and Decimals Online Interview
available to Victorian Government schools. This resource is based on empirically tested tasks
mapped to the number strand of the Victorian AusVELS and focusses on middle-years students. It is
underpinned by a sophisticated Learning Management System that provides tracking information
about individual students. The tasks are open-ended and require an active response rather than
multiple choice questions typically used in commercial products. The resource is supported by
recommended readings, classroom activities and suggestions for making use of the tool. Packages of
this type are needed in the less well-addressed areas of the curriculum.
Among the other support materials available through systems there is a strong emphasis on
investigation, together with the use of concrete materials. Queensland has developed a Curriculum
into the Classroom (C2C) resource and some of these materials are available through Scootle.
Broadly, the approaches seem to take a socio-constructivist line, underpinned by the work of

35
researchers such as Vygotsky (1986) that suggests that students need to interact with a more
knowledgeable other (teacher or peer) to develop understanding. In classrooms taking this approach
dialogue and discussion are important. Students experience different activities and discuss these to
develop mathematical understanding. The extent to which the activities suggested on systems
websites (see Appendix A1) build to a coherent mathematics program varies. There is always a
considerable emphasis on number and very little on geometry, and statistics is fairly undeveloped
compared with other countries such as New Zealand. There is, however, little emphasis on the
curriculum proficiencies of fluency, problem solving, reasoning and understanding other than some
articles and presentations. For the teacher who wants to understand what fluency, for example,
looks like in geometry there is not a lot of help. Scootle has a wide variety of resources and was
mentioned by some schools. When searching using the AC-M as a basis, the general capabilities and
cross-curriculum priorities are explicitly available but the underpinning proficiencies do not appear
to be addressed explicitly. Investigative approaches can be used to develop these aspects of
mathematical thinking, and there is a broad research base that supports an emphasis on the
proficiencies on both cognitive and equity grounds (Boaler, 2016; Kilpatrick, Swafford, & Findell,
2001).
In some states a Direct Instruction model of teaching is used, especially for low achieving and
Indigenous students. This is highly scripted and focussed on behavioural psychology (e.g., the work
of Gagné (1970)). The approach is contentious with considerable discussion about its effectiveness,
especially in numeracy (for example, ACER, 2013). There is room, however, to consider alternative
approaches as well, together with the evidence base for all pedagogical interventions, without
reverting to a transmission model of teaching (Lobato, Clarke, & Burns Ellis, 2005; Masters, 2009).
4.1.4 Strategic directions
The key strategic direction for states involves the use of data. There is considerable information
about the NAPLAN data, and schools are now provided with many ways of considering their own
data. Much of this information is of very high quality but many examples on the various websites
focus on reading rather than numeracy. The materials available to schools could usefully be
supplemented with examples of using other sources of data, including classroom assessment data
and moderation tasks. Schools and teachers need to develop skills in the interpretation of complex
assessment data, appreciating the limitations and affordances of data like NAPLAN. In addition,
information is wanted about ways of supplementing this information with classroom based data.
Schools then have to go beyond the data and use the information effectively to plan interventions at
the school, class or individual level. Specific numeracy examples are needed to realise the potential
of data use.
Targeted teaching based on effective use of data to group students for learning does impact on
students learning outcomes (Goss et al., 2015). In mathematics, however, testing can lead to high
levels of anxiety. For example, testing arithmetic computation rather than explicitly focussing on
strategies has led to depressed performance and increased worry for students (McIntosh, 2005).
Hence collecting data for the purpose of grouping students in mathematics has to be undertaken
sensitively with the purpose clearly explained to students, and the resulting teaching focussed on
the development of cognitive thinking skills in mathematics. In addition, the assessment tools
available tend to emphasise the number strand of the curriculum. Such assessment may be less
useful for effective grouping for the development of other strands of the mathematics curriculum, or
for grouping to develop the mathematics proficiencies of problem solving, reasoning, understanding,

36
and fluency. At present there is little support for teachers to develop skills in collecting and analysing
mathematics data from the classroom, drawing inferences from these data, and developing effective
teaching programs to develop students’ mathematical proficiencies.

37
5 5 Evidence from the surveys
In this chapter, evidence of best practice is taken from the survey results and includes a comparison
of responses from successful schools and other schools. The surveys had a focus on school climate
and goal orientation using teachers’ and students’ perceptions. Evidence is organised at school,
classroom, and individual level, and includes inferential analysis of the impact of variables identified
as potentially important on students’ engagement and interest in mathematics.
The analyses between groups of survey respondents, including those comparisons between
successful schools and other schools, used data provided by survey participants (principals, leaders,
teachers and students). Where a statistically significant difference was identified between any two
groups then that difference refers to the sample of respondents who completed the survey. See
Appendix B and section 3.1.3 for an indication of the surveys’ sample sizes, and a comparison of how
the survey sample of successful schools compares with all of the successful schools identified by
ACARA. Participation was voluntary; hence the leaders, teachers, and students who participated may
not have been representative of their respective schools. This caveat is relevant for survey
participants from both successful and other schools, and is in line with other education research
practice.
It should be noted that not every question was answered by the same number of respondents. Not
only were different versions of the surveys used for primary and secondary schools, but also
respondents participated voluntarily and hence could choose not to answer a particular question.
For this reason, response numbers differ from question to question.
5.1 Key findings
Teachers and leaders who responded to the surveys were better qualified in general than
teachers in the general population. There were no differences, however, in the level or type
of qualifications held by teachers and leaders of successful schools compared with other
schools.
Leaders in successful schools were more likely to acknowledge the role of community factors
in students’ learning than were leaders in other schools.
Successful schools were less likely to group mathematics classes by ability. Whereas 67% of
all teachers and school leaders in successful schools indicated that they grouped students for
at least some of their mathematics classes, in other schools this proportion was 78%. The
difference between successful and other school respondents was statistically significant for
this sample of respondents.
Allocating more time to mathematics did not ensure success.
There was no standout program or resource used in schools. Successful schools used a wide
range of resources.
Regardless of whether they went to a successful or other school, most students reported
that they had received an A or B rating in their most recent report; very few students
received a D or E.
All schools acknowledged positive aspects of NAPLAN but other schools were more likely to
focus on the negative effects.
38
Compared with secondary schools, teachers and leaders in primary schools were more likely
to acknowledge NAPLAN’s positive effects; but they were also more likely to agree that
NAPLAN can have a negative impact.
Student focussed approaches, such as students explaining their own thinking, were seen as
important by teachers for both engagement and achievement in mathematics.
Teachers’ enthusiasm for teaching mathematics had a greater impact on students’ interest
and engagement than did teachers’ enthusiasm for mathematics itself.
Teachers’ enthusiasm for teaching mathematics was highly associated with mastery goal
oriented classrooms.
Younger students were significantly more likely to value mathematics and to be interested in
mathematics overall.
For primary students in successful schools (the only group where there was sufficient data to
match students with teachers), girls and older students had less emotional and cognitive
interest in mathematics.
Within successful schools (the only group where there was sufficient data), three groups of
students were identified that showed different profiles of engagement: engaged, compliant,
and disengaged. Boys were overrepresented in the disengaged group, and girls in the
compliant group.
5.1.1 School characteristics
In this section aspects of schools and teachers identified from the surveys are presented. These
include background information about teachers, organisational arrangements in schools, resources
used in teaching, and perceptions of NAPLAN.
5.1.1.1 Year groups taught by respondents
Teachers were asked to indicate the year groups in which they were currently teaching, as well as
whether they thought of themselves as a primary or secondary mathematics teacher. Of the 120
teachers that identified as primary teachers who responded to this question, 96 were working in
multiple year groups, either on mixed year classes such as a year 2/3 class, or across multiple year
groups as a numeracy coach. In contrast all of the 67 secondary teachers who responded to this
question were teaching across more than one year group, as is usual in secondary school settings.
When the year groups were considered by the primary/secondary identifier the responses revealed
that a small number of secondary teachers taught in the primary years but a larger proportion of
primary teachers taught in the early secondary years of schooling. The findings are summarised in
Figure 5.1:1.

39
Figure 5.1:1 Year levels taught by respondents as a percentage of teachers who identified as either
primary (p %, blue line) or secondary (s %, orange line) teachers
The crossover from teachers identifying as primary or secondary teachers was clear at the transition
from year 6 to year 7. When the data were collected, only South Australia still located year 7 in
primary school. It is possible that some primary teachers had moved into secondary school settings
when the changes were made in West Australia and Queensland to include year 7 in secondary
school. There was, however, a sizeable minority of primary teachers teaching in Year 8 (12.2%). The
teaching backgrounds in the middle years of schooling appear to be more mixed than in the early or
later years. This finding has implications for professional development (professional learning)
programs (see section 5.1.1.5).
The actual number of teachers teaching in each year group was very similar as shown in Table 5.1:1.
Note that there was a total of 187 teachers who responded to the question about which year levels
they taught. The total number (431) of year level ‘mentions’ in Table 5.1:1 is larger than 187 because
of the 163 teachers who taught across multiple year levels.
Table 5.1:1 Number of respondents who taught in different year levels
Year level F Year
1 Year
2 Year
3 Year
4 Year
5 Year
6 Year
7 Year
8 Year
9 Year 10
Year 11
Year 12
N 22 22 25 33 36 37 33 30 33 26 41 46 47

40
5.1.1.2 Teacher and leader qualifications
Teachers and school leaders were asked a series of questions about their educational and
mathematics qualifications, and their teaching experience. Most teachers held a bachelor degree
(103/182, 56.6%), with nearly 20% having a postgraduate qualification in education. Among those
who had responded to the school leaders’ survey, over half had a bachelor degree (49/96, 51.0%)
and one third (32/96, 33.3%) held a postgraduate degree. The number of postgraduate degrees may
reflect the move to a Master of Teaching (MTeach) as the postgraduate entry qualification; however,
for those who achieved their highest educational level before about 2005 this is less likely. Data
from the National Teaching Workforce Dataset (NTWD), Data Analysis Report 2014 (Willett, Segal, &
Walford, 2014) indicates that in Australia overall, less than 10% of all teachers hold postgraduate
degrees, and about 7% hold educational postgraduate degree qualifications. The teachers who
responded to the survey appear to be atypical of Australian teachers overall in terms of
postgraduate study. This finding may indicate that teachers who responded to the survey had a
particular interest in further professional qualifications, and this may influence how they think about
teaching.
A majority of teachers had studied mathematics as part of a bachelor degree (101/182, 55.5%) and a
similar proportion of leader respondents also indicated this level of mathematics (55/96, 57.3%). It is
likely that some of these teachers had taken mathematics courses as part of a Bachelor of Education
(BEd) or similar degree. Some respondents indicated that they held a postgraduate degree in
mathematics or statistics (teachers: 7/182, 3.8%; leaders: 3/96, 3.1%). Such degrees are likely to
include both mathematics and mathematics education. Nevertheless, these data suggest that
around 3.5% of all respondents had some further qualification in mathematics. No data exist at the
national level about the focus of postgraduate qualifications, that is whether they are education
focussed or from some other discipline, nor whether they have a mathematics component, but given
the overall proportion of teachers holding postgraduate degrees it may be a reasonable assumption
that teachers in successful schools are well qualified in mathematics or mathematics education
although there was no apparent difference in qualifications between teachers in Successful schools
and other schools. This finding is in line with other research (Darling-Hammond & Young, 2002;
Mewborn, 2001; Wilson, Floden, & Ferrini-Mundy, 2001).
There were predictable differences between primary and secondary teachers. Table 5.1:2 shows a
comparison between the highest educational levels of teachers regarding themselves as primary or
secondary teachers. The differences in the postgraduate qualifications and the bachelor degree most
likely reflect the predominant initial teacher education pathways, with secondary teachers more
likely to undertake a specialist degree followed by teacher education, either a graduate diploma or
Master of Teaching.

41
Table 5.1:2 Teachers’ reported educational levels
The Leaders’ survey produced similar results. Leaders were not asked to nominate whether they
considered themselves a primary or a secondary teacher, but were asked about the type of school:
primary, secondary or combined primary/secondary. The results are summarised in Table 5.1:3.
Table 5.1:3 Leaders' reported educational levels
When considered by the success criterion, the overall qualification patterns were similar for
successful schools and other schools. Table 5.1:4 shows the comparison between teachers and
leaders in both successful schools and other schools. Leaders appeared to be more likely to hold a
postgraduate qualification, but there were no major differences between successful and other
schools overall.
Highest educational level Primary teachers Secondary teachers Total
N % N % N %
Postgraduate degree 15 12.9 18 27.3 33 18.1
Graduate Diploma or Graduate Certificate 14 12.1 23 34.8 37 20.3
Bachelor Degree 81 69.8 22 33.3 103 56.6
Advanced Diploma 6 5.2 2 3.0 8 4.4
Certificate 0 1 1.5 1 0.5
Total 116 100 66 100 182 100
Highest educational level Primary school Secondary
school Combined
school Total
N % N % N % N %
Postgraduate Degree 16 29.6 3 18.8 13 50.0 32 33.3
Graduate Diploma or Graduate Certificate 3 5.6 3 18.8 5 19.2 11 11.5
Bachelor Degree 32 59.3 10 62.5 7 26.9 49 51.0
Advanced Diploma 3 5.0 0 0.0 1 3.8 4 4.2
Total 54 100 16 100 26 99.9 96 100
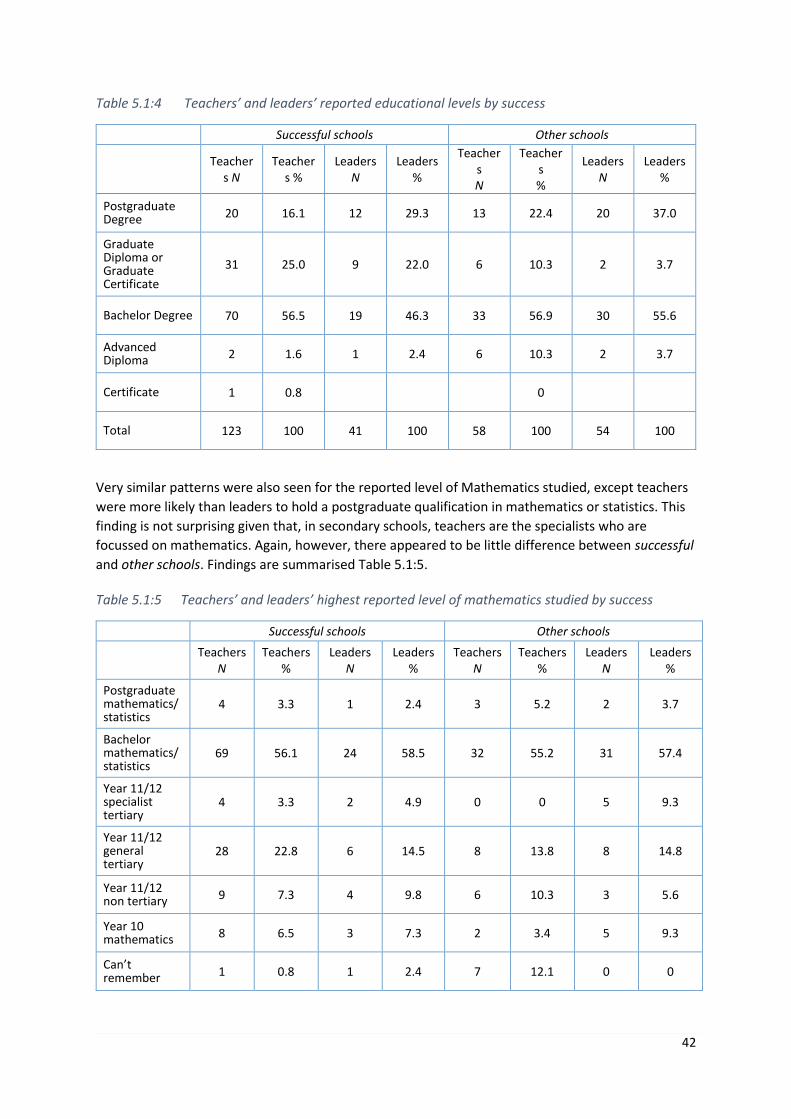
42
Table 5.1:4 Teachers’ and leaders’ reported educational levels by success
Very similar patterns were also seen for the reported level of Mathematics studied, except teachers
were more likely than leaders to hold a postgraduate qualification in mathematics or statistics. This
finding is not surprising given that, in secondary schools, teachers are the specialists who are
focussed on mathematics. Again, however, there appeared to be little difference between successful
and other schools. Findings are summarised Table 5.1:5.
Table 5.1:5 Teachers’ and leaders’ highest reported level of mathematics studied by success
Successful schools Other schools
Teachers N
Teachers %
Leaders N
Leaders %
Teachers N
Teachers %
Leaders N
Leaders %
Postgraduate Degree 20 16.1 12 29.3 13 22.4 20 37.0
Graduate Diploma or Graduate Certificate
31 25.0 9 22.0 6 10.3 2 3.7
Bachelor Degree 70 56.5 19 46.3 33 56.9 30 55.6
Advanced Diploma 2 1.6 1 2.4 6 10.3 2 3.7
Certificate 1 0.8 0
Total 123 100 41 100 58 100 54 100
Successful schools Other schools
Teachers N
Teachers %
Leaders N
Leaders %
Teachers N
Teachers %
Leaders N
Leaders %
Postgraduate mathematics/ statistics
4 3.3 1 2.4 3 5.2 2 3.7
Bachelor mathematics/ statistics
69 56.1 24 58.5 32 55.2 31 57.4
Year 11/12 specialist tertiary
4 3.3 2 4.9 0 0 5 9.3
Year 11/12 general tertiary
28 22.8 6 14.5 8 13.8 8 14.8
Year 11/12 non tertiary 9 7.3 4 9.8 6 10.3 3 5.6
Year 10 mathematics 8 6.5 3 7.3 2 3.4 5 9.3
Can’t remember 1 0.8 1 2.4 7 12.1 0 0

43
There was no association between level of qualification of a leader and whether or not a school had
displayed high growth or sustained growth, irrespective of whether it was in secondary or primary
school contexts. Similarly, the highest mathematical qualification was not associated with high
growth or sustained growth, irrespective of secondary or primary school contexts. A similar finding
was reported in Chiang, McCulloch, Lipscomb, and Gill (2016).
5.1.1.3 Teachers’ and leaders’ experience
In addition to qualifications, teachers were asked about both their overall teaching experience and
their mathematics teaching experience, and leaders were asked about their overall teaching
experience and their leadership experience. The respondents were highly experienced overall, with
about one-third of the teachers and over half of the leaders having taught for over 20 years. Table
5.1:6 shows the overall teaching experience of respondents in the teachers’ and leaders’ surveys.
Table 5.1:6 Teaching experience of survey respondents
When overall teaching experience was considered by school type there was again very little
difference across primary and secondary schools. There was, however, some suggestion in the data
that successful schools tended to have more experienced teachers, although differences were small.
The distribution of mathematics teaching experience for teacher respondents is shown in Figure
5.1:2.
Figure 5.1:2 Mathematics teaching experience in years for teacher respondents by success
0%
5%
10%
15%
20%
25%
30%
35%
40%
0-5 yrs 6-10 yrs 11-15 yrs 16-20 yrs > 20 yrs
% R
esp
on
den
ts
Successful schools % Other schools %
Years of teaching experience Teachers N Teachers % Leaders N Leaders %
0–5 years 38 20.9 9 9.2
6–10 years 36 19.8 9 9.2
11–15 years 32 17.6 16 16.3
16–20 years 16 8.9 8 8.2
> 20 years 60 33.0 55 56.1

44
A somewhat different picture emerged from the leadership experience. When asked how long they
had been working in schools as a leader, over one quarter had been in leadership roles for less than
five years. A summary of the responses is shown in Table 5.1:7.
Table 5.1:7 Leadership experience
When considered by school type and by success, the distribution of leadership experience appeared
similar. These findings are shown graphically in Figure 5.1:3.
Figure 5.1:3 Leadership experience by success
It is possible that at least some of the leaders were in roles such as numeracy coaches or numeracy
coordinators because a number of states have established these positions relatively recently. This
notion is supported by the case studies, in which a number of mathematics/numeracy leaders had
been in their role for relatively short time periods.
0.0%
10.0%
20.0%
30.0%
40.0%
50.0%
60.0%
70.0%
0-5 yrs 6-10 yrs 11-15 yrs 16-20 yrs > 20 yrs
% R
esp
on
den
ts
Success % Other %
Years of leadership experience
Success N Success % Other Other % Overall Overall %
0–5 years 0 0 9 13.6 9 9.3
6–10 years 4 12.9 5 7.6 9 9.3
11–15 years 5 16.1 11 16.7 16 16.5
16–20 years 3 9.7 5 7.9 8 8.2
> 20 years 19 61.3 36 54.5 55 56.7
Total 31 32.0 66 68.0 97 100
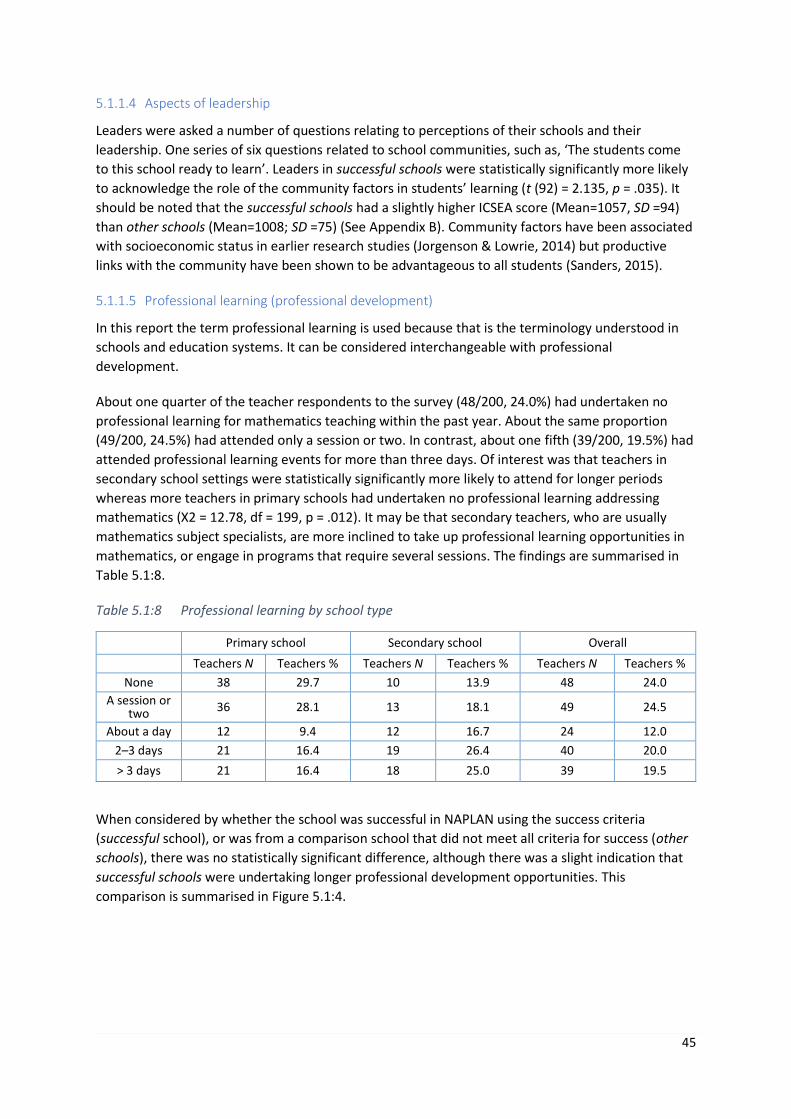
45
5.1.1.4 Aspects of leadership
Leaders were asked a number of questions relating to perceptions of their schools and their
leadership. One series of six questions related to school communities, such as, ‘The students come
to this school ready to learn’. Leaders in successful schools were statistically significantly more likely
to acknowledge the role of the community factors in students’ learning (t (92) = 2.135, p = .035). It
should be noted that the successful schools had a slightly higher ICSEA score (Mean=1057, SD =94)
than other schools (Mean=1008; SD =75) (See Appendix B). Community factors have been associated
with socioeconomic status in earlier research studies (Jorgenson & Lowrie, 2014) but productive
links with the community have been shown to be advantageous to all students (Sanders, 2015).
5.1.1.5 Professional learning (professional development)
In this report the term professional learning is used because that is the terminology understood in
schools and education systems. It can be considered interchangeable with professional
development.
About one quarter of the teacher respondents to the survey (48/200, 24.0%) had undertaken no
professional learning for mathematics teaching within the past year. About the same proportion
(49/200, 24.5%) had attended only a session or two. In contrast, about one fifth (39/200, 19.5%) had
attended professional learning events for more than three days. Of interest was that teachers in
secondary school settings were statistically significantly more likely to attend for longer periods
whereas more teachers in primary schools had undertaken no professional learning addressing
mathematics (Χ2 = 12.78, df = 199, p = .012). It may be that secondary teachers, who are usually
mathematics subject specialists, are more inclined to take up professional learning opportunities in
mathematics, or engage in programs that require several sessions. The findings are summarised in
Table 5.1:8.
Table 5.1:8 Professional learning by school type
When considered by whether the school was successful in NAPLAN using the success criteria
(successful school), or was from a comparison school that did not meet all criteria for success (other
schools), there was no statistically significant difference, although there was a slight indication that
successful schools were undertaking longer professional development opportunities. This
comparison is summarised in Figure 5.1:4.
Primary school Secondary school Overall
Teachers N Teachers % Teachers N Teachers % Teachers N Teachers %
None 38 29.7 10 13.9 48 24.0
A session or two 36 28.1 13 18.1 49 24.5
About a day 12 9.4 12 16.7 24 12.0
2–3 days 21 16.4 19 26.4 40 20.0
> 3 days 21 16.4 18 25.0 39 19.5
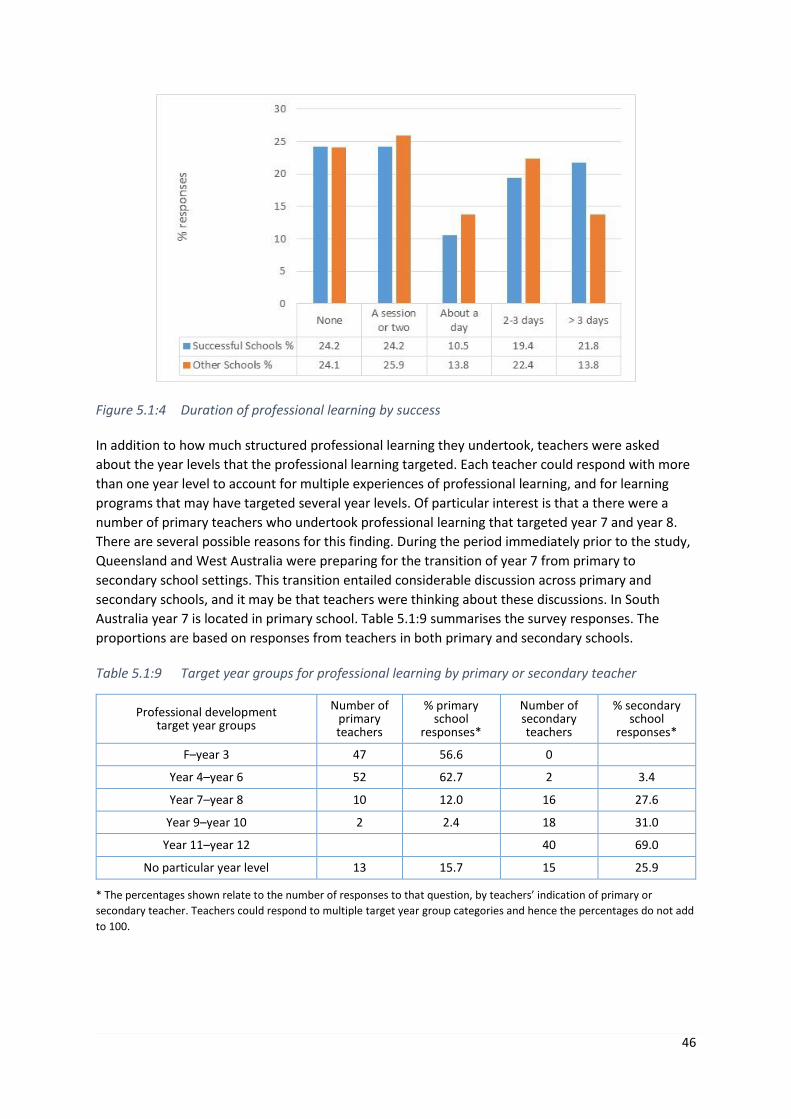
46
Figure 5.1:4 Duration of professional learning by success
In addition to how much structured professional learning they undertook, teachers were asked
about the year levels that the professional learning targeted. Each teacher could respond with more
than one year level to account for multiple experiences of professional learning, and for learning
programs that may have targeted several year levels. Of particular interest is that a there were a
number of primary teachers who undertook professional learning that targeted year 7 and year 8.
There are several possible reasons for this finding. During the period immediately prior to the study,
Queensland and West Australia were preparing for the transition of year 7 from primary to
secondary school settings. This transition entailed considerable discussion across primary and
secondary schools, and it may be that teachers were thinking about these discussions. In South
Australia year 7 is located in primary school. Table 5.1:9 summarises the survey responses. The
proportions are based on responses from teachers in both primary and secondary schools.
Table 5.1:9 Target year groups for professional learning by primary or secondary teacher
Professional development target year groups
Number of primary teachers
% primary school
responses*
Number of secondary teachers
% secondary school
responses*
F–year 3 47 56.6 0
Year 4–year 6 52 62.7 2 3.4
Year 7–year 8 10 12.0 16 27.6
Year 9–year 10 2 2.4 18 31.0
Year 11–year 12 40 69.0
No particular year level 13 15.7 15 25.9
* The percentages shown relate to the number of responses to that question, by teachers’ indication of primary or
secondary teacher. Teachers could respond to multiple target year group categories and hence the percentages do not add
to 100.

47
These results point to a limited amount of professional learning targeting the lower secondary years
of schooling, years 7–8, and years 9–10. When compared with the large 69.0% of Secondary
teachers who had undertaken professional learning targeting years 11–12 and the large proportion
of primary teachers who had undertaken professional learning targeting years F to 3 and years 4 to
6, the upper primary and lower years (years 7–10) of secondary schooling may be somewhat
neglected in professional learning provision. It should also be noted that in the period immediately
prior to this study, considerable work had been undertaken in Western Australia and Queensland
involving both primary and secondary schools in preparation for the transition of year 7 to
secondary settings which may also have influenced the results.
In response to a question about the content of the professional learning, 12 responses stated
unspecified curriculum or mathematics as a focus; eight responses indicated the new curriculum in
years 11–12. There was some mention of problem solving (two instances) and two of mathematical
investigations and applications. Data analysis was mentioned in three responses. Other responses
were spread across a range of categories, including general pedagogy, peer observation, and
dyscalculia (one mention each) or specific programs adopted by a school (one mention each). A full
list of professional learning content focus is provided in Appendix C2.
5.1.1.6 Grouping for mathematics teaching
Teachers were asked in the survey whether mathematics classes in their school were grouped by
student ability. A majority of teachers (110/181, 61%) reported that ability grouping occurred in
some classes, with only 53/181 (29%) reporting no grouping, and a small number (18/181, 10%)
reporting that ability grouping occurred in every class.
Perhaps surprisingly, the distribution of ability grouped classes in mathematics was similar for
primary and secondary schools as shown in Table 5.1:10, although a slightly higher percentage of
secondary teachers reported that all classes were grouped for mathematics.
Table 5.1:10 Ability grouping for mathematics by school type
When the results were considered by whether the school was successful or otherwise, respondents
in successful schools were statistically significantly less likely to report that their school grouped
mathematics classes by ability (Χ2 (2, N = 181 ) = 8.42, p = .01) as shown by the proportions in Table
5.1:11. Despite there being a statistically significant difference, only one third of teachers from
successful schools reported that no classes in their school were grouped by ability, compared with
one fifth of classes in other schools. At the other end of the scale only 6% reported that they
grouped students in every class compared with 19% in other schools. The predominant pattern
appeared to be grouping by ability in some classes.
Ability grouped mathematics classes Primary
teachers N Primary
teachers % Secondary teachers N
Secondary teachers %
None 34 30% 19 29%
Some 72 63% 38 58%
All 9 8% 9 14%
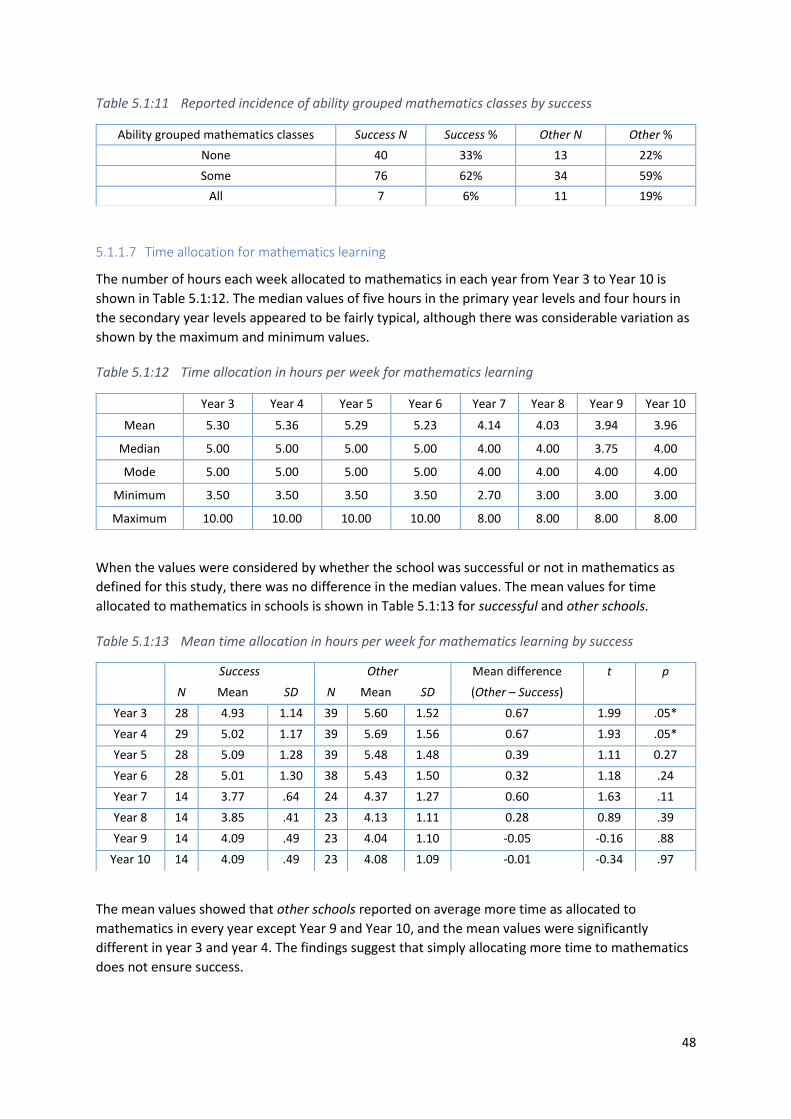
48
Table 5.1:11 Reported incidence of ability grouped mathematics classes by success
5.1.1.7 Time allocation for mathematics learning
The number of hours each week allocated to mathematics in each year from Year 3 to Year 10 is
shown in Table 5.1:12. The median values of five hours in the primary year levels and four hours in
the secondary year levels appeared to be fairly typical, although there was considerable variation as
shown by the maximum and minimum values.
Table 5.1:12 Time allocation in hours per week for mathematics learning
When the values were considered by whether the school was successful or not in mathematics as
defined for this study, there was no difference in the median values. The mean values for time
allocated to mathematics in schools is shown in Table 5.1:13 for successful and other schools.
Table 5.1:13 Mean time allocation in hours per week for mathematics learning by success
The mean values showed that other schools reported on average more time as allocated to
mathematics in every year except Year 9 and Year 10, and the mean values were significantly
different in year 3 and year 4. The findings suggest that simply allocating more time to mathematics
does not ensure success.
Ability grouped mathematics classes Success N Success % Other N Other %
None 40 33% 13 22%
Some 76 62% 34 59%
All 7 6% 11 19%
Year 3 Year 4 Year 5 Year 6 Year 7 Year 8 Year 9 Year 10
Mean 5.30 5.36 5.29 5.23 4.14 4.03 3.94 3.96
Median 5.00 5.00 5.00 5.00 4.00 4.00 3.75 4.00
Mode 5.00 5.00 5.00 5.00 4.00 4.00 4.00 4.00
Minimum 3.50 3.50 3.50 3.50 2.70 3.00 3.00 3.00
Maximum 10.00 10.00 10.00 10.00 8.00 8.00 8.00 8.00
Success Other Mean difference t p
N Mean SD N Mean SD (Other – Success)
Year 3 28 4.93 1.14 39 5.60 1.52 0.67 1.99 .05*
Year 4 29 5.02 1.17 39 5.69 1.56 0.67 1.93 .05*
Year 5 28 5.09 1.28 39 5.48 1.48 0.39 1.11 0.27
Year 6 28 5.01 1.30 38 5.43 1.50 0.32 1.18 .24
Year 7 14 3.77 .64 24 4.37 1.27 0.60 1.63 .11
Year 8 14 3.85 .41 23 4.13 1.11 0.28 0.89 .39
Year 9 14 4.09 .49 23 4.04 1.10 -0.05 -0.16 .88
Year 10 14 4.09 .49 23 4.08 1.09 -0.01 -0.34 .97

49
5.1.1.8 Teaching resources
School leaders were asked about their school’s curriculum, and commercial programs or resources
used for teaching mathematics. Most schools used the AC-M as a basis for their curriculum. Of those
that responded ‘no’, two mentioned the IB program. The basis for the curriculum in remaining
responses is unknown because no response was given to the question that asked for details. Table
5.1:14 provides a summary. Statistical significance could not be determined because of low cell
counts.
Table 5.1:14 Responses from school leaders about the use of AC-M
The majority of school leaders indicated that they did not use a commercial program for
mathematics in their school. Results are summarised in Table 5.1:15, broken down by success. There
was no statistically significant difference between responses from successful schools and other
schools.
Table 5.1:15 Responses from school leaders about the use of commercial programs
Where leaders indicated in the survey that they used a particular program or resources in their
school, a variety of packages was noted. These programs and resources included online and text
based resources. A list of programs or resources mentioned within individual schools is provided in
Table C2 in Appendix C. Where there was mention in a school, by more than one respondent, this
program or resource has been counted only once to avoid over-counting. No percentages are given
because some leaders mentioned several programs or resources whereas others only mentioned
one program or resource. Further information about resources used in successful schools is provided
in Chapter 6, section 6.2.6.
Success N Success % Other N Other % Overall Overall %
Yes 36 94.7 44 83.0 80 87.9
No 2 5.3 9 17.0 11 12.1
Total 38 53 91
Commercial Program Use
Success N Success % Other N Other % Overall Overall %
Yes 11 28.9 16 30.2 27 29.7
No 27 42.2 37 69.8 64 70.3
Total 38 41.8 53 58.2 91 100

50
Table 5.1:16 Responses from school leaders about programs and resources used in individual schools.
Program or Resource Number of Schools
International Baccalaureate 2
Origo 3
iMaths 2
Oxford 3
Mathletics 4
Pearson 2
Targeting Maths 1
Maths 300 1
Jacaranda 2
Maths Online 1
First Steps 1
Nelson 1
Macmillan MathsWorld 1
5.1.1.9 Assessment and reporting
There was interest in examining assessment practices in schools because of the emphasis on data and
evidence driven teaching. In the survey, teachers were asked about the extent to which they could
use a range of assessment strategies. On a scale of 1 (nothing) to 9 (a great deal) the overall mean
score was 7.05 (SD = 1.46) indicating that teachers felt able to use a range of assessment approaches.
There was no statistically significant difference between successful and other schools.
Students were asked to report the rating that they received for mathematics on their last school
report. All schools in Australia are required to report on an A to E scale twice a year as part of their
funding agreements. Despite the intention of this being a common scale, it has subtly different
interpretations from state to state. For example a C rating was described as:
evidence in a student’s work typically demonstrates a sound level of knowledge and
understanding of the content (facts, concepts and procedures) and application of skills;
the student has a sound knowledge and understanding of the main areas of content and has
achieved an adequate level of competence in the processes and skills;
evidence of learning demonstrates sound achievement at this year level;
C indicates that a student is performing at the standard expected;
C At the standard expected at this time of year;
your child is demonstrating satisfactory achievement of what is expected at this year level;
satisfactory. The student demonstrates satisfactory achievement of what is expected for this
year level; and
demonstrating satisfactory achievement of what is expected.
Of the students who responded to this question, it was notable that 63% reported receiving an A or
B grade, and only 6% reported a D or E grade. The distribution of responses by year level is shown in
Table 5.1:17. A graphical comparison is provided in Figure 5.1:5.

51
Table 5.1:17 Students' self-reported grades for mathematics by percentage of respondents in each
year level
Figure 5.1:5 Proportion of A to E grades by year level
This skewed distribution is rather surprising. If C is the satisfactory grade for a year group, the
distribution of grades across a sample of over 1000 students would be expected to be roughly
symmetrical around the C grade, or to peak in that level. When considered as to whether the school
was a successful or other school, the distribution was almost exactly the same as shown in Table
5.1:18.
0%
10%
20%
30%
40%
50%
60%
70%
80%
90%
100%
Year 3 Year 4 Year 5 Year 6 Year 7 Year 8 Year 9 Year 10
% o
f gr
ades
allo
cate
d
A B C D E
A B C D E
Year 3 20 43 22 4 1
Year 4 11 64 53 5 2
Year 5 30 69 62 6 4
Year 6 43 65 37 5 1
Year 7 58 61 65 18 0
Year 8 29 27 18 6 0
Year 9 48 40 25 9 3
Year 10 1 3 13 3 1
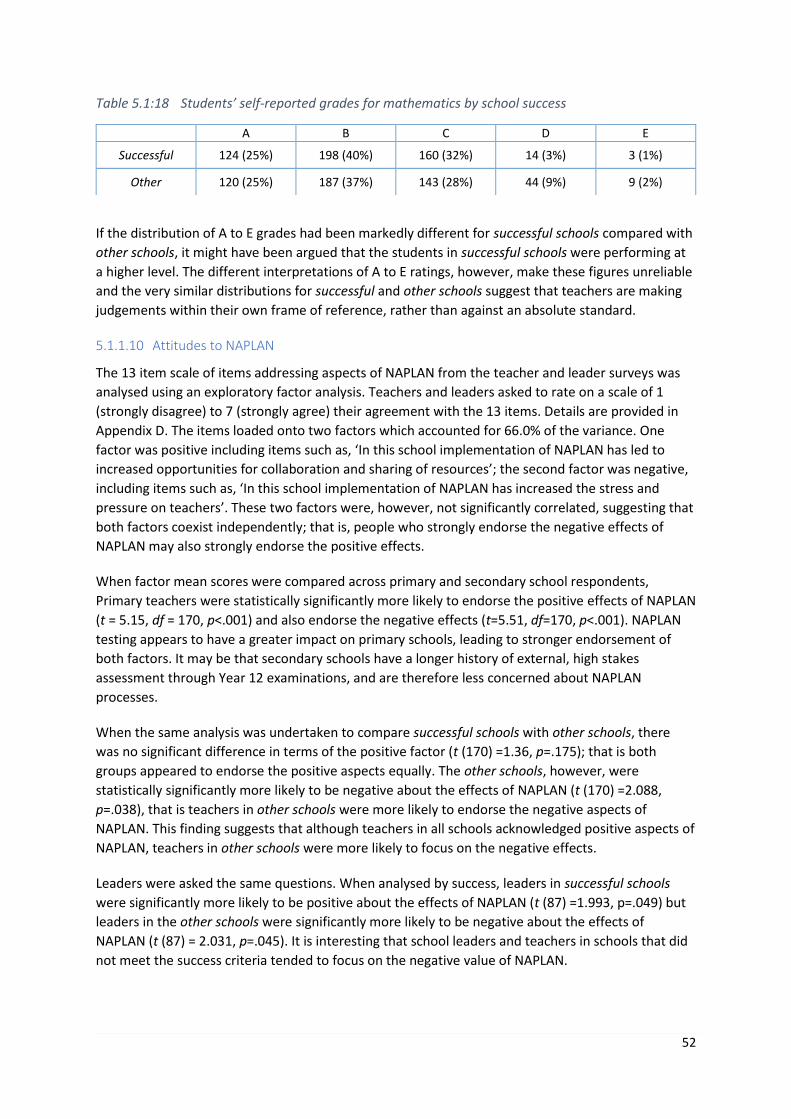
52
Table 5.1:18 Students’ self-reported grades for mathematics by school success
If the distribution of A to E grades had been markedly different for successful schools compared with
other schools, it might have been argued that the students in successful schools were performing at
a higher level. The different interpretations of A to E ratings, however, make these figures unreliable
and the very similar distributions for successful and other schools suggest that teachers are making
judgements within their own frame of reference, rather than against an absolute standard.
5.1.1.10 Attitudes to NAPLAN
The 13 item scale of items addressing aspects of NAPLAN from the teacher and leader surveys was
analysed using an exploratory factor analysis. Teachers and leaders asked to rate on a scale of 1
(strongly disagree) to 7 (strongly agree) their agreement with the 13 items. Details are provided in
Appendix D. The items loaded onto two factors which accounted for 66.0% of the variance. One
factor was positive including items such as, ‘In this school implementation of NAPLAN has led to
increased opportunities for collaboration and sharing of resources’; the second factor was negative,
including items such as, ‘In this school implementation of NAPLAN has increased the stress and
pressure on teachers’. These two factors were, however, not significantly correlated, suggesting that
both factors coexist independently; that is, people who strongly endorse the negative effects of
NAPLAN may also strongly endorse the positive effects.
When factor mean scores were compared across primary and secondary school respondents,
Primary teachers were statistically significantly more likely to endorse the positive effects of NAPLAN
(t = 5.15, df = 170, p<.001) and also endorse the negative effects (t=5.51, df=170, p<.001). NAPLAN
testing appears to have a greater impact on primary schools, leading to stronger endorsement of
both factors. It may be that secondary schools have a longer history of external, high stakes
assessment through Year 12 examinations, and are therefore less concerned about NAPLAN
processes.
When the same analysis was undertaken to compare successful schools with other schools, there
was no significant difference in terms of the positive factor (t (170) =1.36, p=.175); that is both
groups appeared to endorse the positive aspects equally. The other schools, however, were
statistically significantly more likely to be negative about the effects of NAPLAN (t (170) =2.088,
p=.038), that is teachers in other schools were more likely to endorse the negative aspects of
NAPLAN. This finding suggests that although teachers in all schools acknowledged positive aspects of
NAPLAN, teachers in other schools were more likely to focus on the negative effects.
Leaders were asked the same questions. When analysed by success, leaders in successful schools
were significantly more likely to be positive about the effects of NAPLAN (t (87) =1.993, p=.049) but
leaders in the other schools were significantly more likely to be negative about the effects of
NAPLAN (t (87) = 2.031, p=.045). It is interesting that school leaders and teachers in schools that did
not meet the success criteria tended to focus on the negative value of NAPLAN.
A B C D E
Successful 124 (25%) 198 (40%) 160 (32%) 14 (3%) 3 (1%)
Other 120 (25%) 187 (37%) 143 (28%) 44 (9%) 9 (2%)

53
Schools successful at numeracy as measured by NAPLAN appear to be able to reduce the negative
effects of the testing program. This finding implies that successful schools have identified ways to
mitigate potentially negative effects of high stakes testing without losing a focus on excellence.
5.1.2 Classroom characteristics
In this section aspects of classrooms identified from the surveys are considered. These included
approaches to teaching, homework practices, and teachers and students’ perceptions of the
classroom and school environment.
5.1.2.1 Approaches to teaching
Teachers were asked to rate the extent to which different approaches to mathematics teaching had
a positive impact on students. These questions were asked twice; once with a focus on mathematics
achievement, and once in relation to student engagement with mathematics.
An exploratory factor analysis was conducted on each set of questions (see Appendix D for details).
This analysis identified four engagement factors, together explaining 60.3% of the variance. Factor 1
explained 34.3% of the variance, with the remaining three factors explaining 11.0%, 8.5% and 6.5%,
respectively.
The four underlying engagement factors were:
Student discussion;
for example, ‘students listening to and questioning other students’ thinking’, and ‘students
explaining their own thinking’.
Using materials;
for example, ‘using concrete materials and manipulatives’, and ‘playing maths games
(including computer games)’.
Rewards;
for example, ‘extrinsic rewards (lollies, less homework)’, and positive reinforcement (smiles,
encouraging words)’.
Independent practice;
for example, ‘students learning rules and procedures’, and ‘opportunity for students to work
by themselves’.
When considered by success, there were no differences on any factor of engagement between
teachers in successful and other schools. There were statistically significant differences between
primary and secondary teachers on student discussion (t (143) = 4.31, p < .001); using materials (t
(143) = 6.02, p < .001); and independent practice (t (144) = 2.006, p = .047). In each instance primary
teachers had higher endorsement of the engagement factor than secondary teachers.
The factor analysis also identified four achievement factors, together explaining 61.5% of the
variance. Factor 1 explained 37.7% of the variance, with the remaining three factors explaining
11.0%, 7.2% and 5.5% respectively. The four achievement factors were:

54
Student language and challenge;
for example, ‘students explaining their own thinking’, and ‘working on tasks students see as
challenging’.
Practice and recognising success
for example, ‘practising skills they have already been taught’, and ‘students knowing the
purpose and intent of the lesson’.
Materials and relevance;
for example, ‘using concrete materials and manipulatives’, and ‘having tasks set in contexts
relevant to students’ lives’.
Rewards and technology use;
for example, ‘extrinsic rewards (lollies, less homework)’ and ‘students working with digital
technologies’.
When it came to achievement in mathematics, again there were no statistically significant
differences between teachers in successful and other schools on any factor. There were statistically
significant differences between primary and secondary teachers on student language and challenge
(t (159) = 3.891, p < .001); practice and recognising success (t (160) = 3.865, p < .001); and materials
and relevance (t (161) = 4.834, p < .001). There was no difference shown on the rewards factor.
Primary teachers were again more likely to endorse all factors.
These survey results indicate that student focussed approaches, with a focus on student talk such as
students explaining their own thinking, are seen as important by teachers in both successful and
other schools for both engagement in mathematics and achievement in mathematics.
Teachers were also asked about their own enthusiasm for mathematics itself (TSE) (for example I
engage in mathematics because I enjoy it). There was a statistically significant difference in favour of
secondary teachers between primary and secondary teachers (t = 2.89, df = 163, p = .004), but not
between teachers in successful and other schools (t = 0.581, df = 163, p = .163).
5.1.2.2 Classroom environment
On the surveys, all students were asked about several dimensions of the classroom environment:
mastery environment (SCM) (for example, ‘our maths teacher really wants us to enjoy
learning new things’);
performance environment (SCP) (for example, ‘our maths teacher tells us how we compare
with others’); and
teacher enthusiasm for teaching mathematics (STE) (for example, ‘our maths teacher
teaches maths with great enthusiasm’).
When responses were compared by success, students at successful schools reported statistically
significantly lower scores on performance environment (SCP) (t = 2.9, p <.001); that is, in successful
schools students were less likely to perceive their mathematics classrooms as having a focus on
doing better in comparison to other students. There was no difference, however, between successful
schools and other schools in terms of students perceiving that their teachers wanted them to
understand the mathematics that they were learning, that is had a mastery approach (SCM). These
findings suggest that, although teachers at other schools want their students to understand
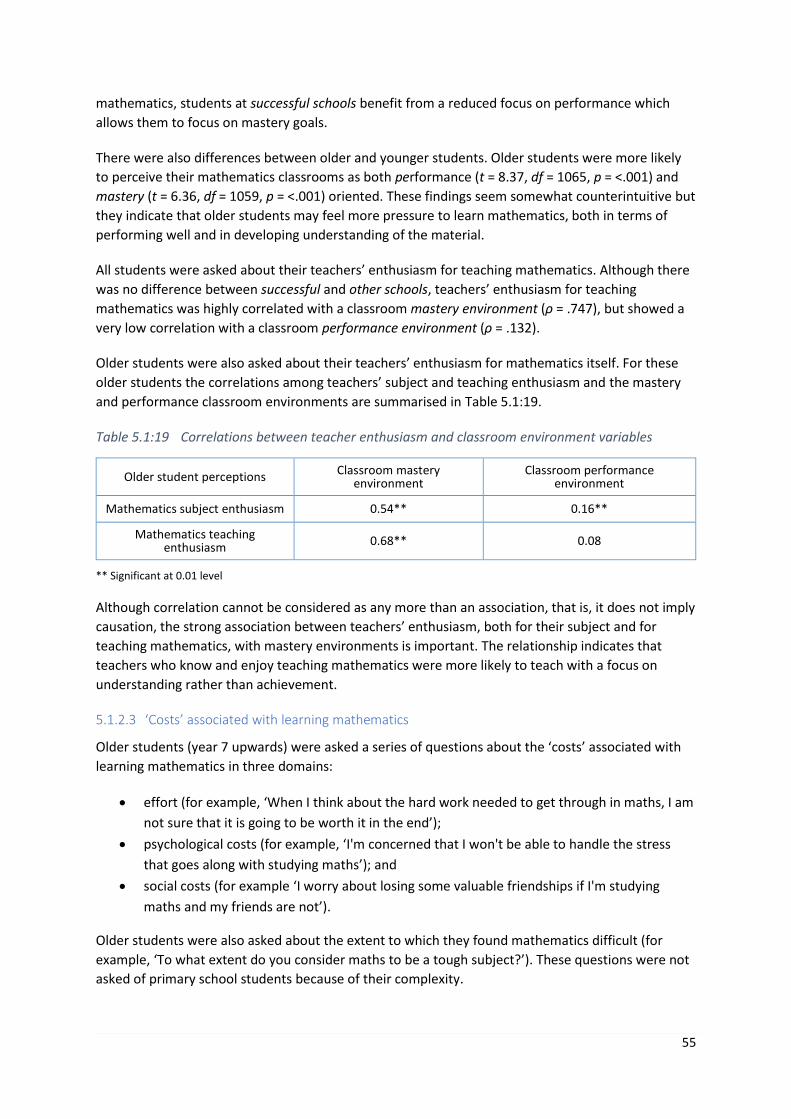
55
mathematics, students at successful schools benefit from a reduced focus on performance which
allows them to focus on mastery goals.
There were also differences between older and younger students. Older students were more likely
to perceive their mathematics classrooms as both performance (t = 8.37, df = 1065, p = <.001) and
mastery (t = 6.36, df = 1059, p = <.001) oriented. These findings seem somewhat counterintuitive but
they indicate that older students may feel more pressure to learn mathematics, both in terms of
performing well and in developing understanding of the material.
All students were asked about their teachers’ enthusiasm for teaching mathematics. Although there
was no difference between successful and other schools, teachers’ enthusiasm for teaching
mathematics was highly correlated with a classroom mastery environment (ρ = .747), but showed a
very low correlation with a classroom performance environment (ρ = .132).
Older students were also asked about their teachers’ enthusiasm for mathematics itself. For these
older students the correlations among teachers’ subject and teaching enthusiasm and the mastery
and performance classroom environments are summarised in Table 5.1:19.
Table 5.1:19 Correlations between teacher enthusiasm and classroom environment variables
Older student perceptions Classroom mastery
environment Classroom performance
environment
Mathematics subject enthusiasm 0.54** 0.16**
Mathematics teaching enthusiasm
0.68** 0.08
** Significant at 0.01 level
Although correlation cannot be considered as any more than an association, that is, it does not imply
causation, the strong association between teachers’ enthusiasm, both for their subject and for
teaching mathematics, with mastery environments is important. The relationship indicates that
teachers who know and enjoy teaching mathematics were more likely to teach with a focus on
understanding rather than achievement.
5.1.2.3 ‘Costs’ associated with learning mathematics
Older students (year 7 upwards) were asked a series of questions about the ‘costs’ associated with
learning mathematics in three domains:
effort (for example, ‘When I think about the hard work needed to get through in maths, I am
not sure that it is going to be worth it in the end’);
psychological costs (for example, ‘I'm concerned that I won't be able to handle the stress
that goes along with studying maths’); and
social costs (for example ‘I worry about losing some valuable friendships if I'm studying
maths and my friends are not’).
Older students were also asked about the extent to which they found mathematics difficult (for
example, ‘To what extent do you consider maths to be a tough subject?’). These questions were not
asked of primary school students because of their complexity.

56
Older students were also asked to rate their own teachers’ enthusiasm for mathematics – subject
enthusiasm (for example, ‘Our maths teacher finds mathematics exciting’), and their own teachers’
enthusiasm for teaching mathematics – maths teaching enthusiasm (for example, ‘our maths
teacher really enjoys teaching maths’).
The associations among the cost variables, and the students’ reports of their teachers’ enthusiasm,
for subject mathematics and for teaching mathematics were correlated to identify potential factors
that could support mathematics learning. The perceptions of their classrooms as Mastery or
Performance oriented were also considered. Results are summarised in Table 5.1:20.
Table 5.1:20 Correlations among teacher and classroom variables and students' costs
Student perception variables (older students only)
Effort cost
Psychological cost
Social cost
Mathematics difficulty
Teachers’ enthusiasm for mathematics (SSE)
-0.186** -0.071 -0.050 -0.048
Teachers’ enthusiasm for teaching mathematics (STE) -0.242** -0.136* -0.119* -0.093*
Mastery classroom (SCM) -0.269** -0.170** -0.180** -0.042
Performance classroom (SCP) 0.192** 0.120* 0.183** 0.137*
Statistically significant: * p < .05 ** p < .01
Older students’ perceptions of their teachers’ enthusiasm for mathematics (SSE) and its teaching
(STE) were generally associated with reduced costs, as shown by the negative correlation in Error!
eference source not found.. Enthusiasm for the subject (SSE) was only statistically significant in
relationship to Effort costs. Teachers’ subject enthusiasm (SSE) statistically significantly reduced
effort cost, but had almost no association with psychological or social costs or with perceptions of
difficulty. Teachers’ enthusiasm for teaching mathematics (STE) had a statistically significant
association with reduction of all costs associated with learning mathematics, especially the effort
involved. Enthusiasm for teaching mathematics (STE) also impacted on students’ perceptions of
mathematics difficulty. A mastery oriented classroom (SCM) was also significantly associated with
cost reduction in the three cost domains, but not with perceptions of the difficulty of mathematics.
A performance oriented classroom, however, was significantly positively associated with costs, that
is, the more performance oriented that students reported their classroom to be, the greater the
costs associated with learning mathematics in all domains for students.
These findings are potentially important because they suggest that teachers who are only
enthusiastic about mathematics itself are not necessarily going to be associated with productive
mathematics classrooms. Teachers have to possess a genuine passion for teaching mathematics and
create mastery oriented classrooms to be associated with reductions in student’s reported
psychological and social costs and perceptions of difficulty. In particular the performance orientation
of classrooms appears to be detrimental to learning mathematics. The common practice of
comparing students’ success on ‘10 quick questions’ at the start of a lesson, for example, is a
performance oriented activity that might be associated with students’ increased effort and
perceptions of mathematics as difficult.

57
5.1.2.4 Homework practices
In the Teacher survey, questions were asked about homework practices, including how often
homework was set, how long students were expected to spend on homework, and why teachers set
homework. Unsurprisingly, more primary than secondary teachers indicated that they never set
homework, but a larger proportion of primary teachers also set homework every weeknight. These
findings are summarised in Table 5.1:21.
Table 5.1:21 Frequency of homework by school type
When the expectations for students’ homework were examined, there were clear differences
between primary and secondary school practices. Nearly 70% of primary teachers only expected a
few minutes of homework, and this short duration may be related to the high frequency with which
homework was set by primary teachers. It is also worth noting that over half of the secondary
teachers also expected a few minutes, although homework expectations of longer duration were
also more common in secondary schools. Results are summarised in Table 5.1:22. It is interesting
that seven primary teachers who apparently set homework as shown in Table 5.1:21 did not expect
any homework to be done in Table 5.1:22 (29 responses that set homework, as opposed to 22
respondents who responded None to the frequency of homework set).
Table 5.1:22 Duration of homework by school type
School policy was given as the reason for homework practices by nearly one quarter of primary
teachers, but by less than 10% of secondary teachers (primary: 22/97; 22.7%; secondary: 6/62;
9.7%). The largest proportion of teachers indicated that homework helped students learn (primary:
36/97; 37.1%; secondary: 41/62; 66.1%). Being useful for consolidation was the most commonly
Primary schools Secondary schools Total
Teachers N Teachers % Teachers N Teachers % Teachers N Teachers %
Never 22 20.2 1 1.6 23 13.5
Rarely 13 11.9 6 9.7 19 11.1
Only when necessary 23 21.1 30 48.4 53 31.0
Every weeknight 51 46.8 25 40.3 76 44.4
Total 109 62 171
Primary schools Secondary schools Total
Teachers N Teachers % Teachers N Teachers % Teachers N Teachers %
None 29 26.6 1 1.6 30 17.5
A few minutes 76 69.7 33 54.1 109 64.1
About half an hour 4 3.7 20 32.8 24 14.1
About 1 hour 0 0 5 8.2 5 2.9
More than 1 hour 0 0 1 1.6 1 0.6
Total 109 60 169

58
cited reason in the other category. In other words, teachers saw homework as related to students’
learning.
When the responses were analysed using the success criteria, using a combined primary and
secondary school dataset because of small numbers of responses in some categories, very similar
results were observed. There appeared to be little difference in expectations for homework among
teacher respondents whether they were located in successful schools or other schools. The results
for frequency of homework assignment are shown in Table 5.1:23.
Table 5.1:23 Frequency of homework set by teachers by success
Students were asked to rate on a scale of 1 (never) to 7 (every class) their responses to the question
‘How often does your maths teacher assign maths homework?’ The results are shown in Table
5.1:24. The distribution of responses indicates that students perceived that teachers in successful
schools were more likely to assign some homework, but not every lesson; whereas teachers in other
schools were more likely to be at the extreme ends of the scale. Student perceptions were that
teachers in other schools were more likely to never assign homework (11.4%) compared to teachers
in successful schools (2.4%). These findings reinforce the teachers’ responses to the similar question.
Table 5.1:24 Students' responses to ‘how often does your maths teacher assign maths homework?’
by success
Teachers were asked about the duration of time they expected their students to spend on
homework. Most teachers in both successful and other schools expected only a few minutes of
homework. A greater proportion of teachers in other schools expected no homework to be
completed, and a greater proportion of teachers in successful schools expected about half an hour of
homework. Findings are shown in Table 5.1:25.
Successful schools Other schools Total
Teachers N Teachers % Teachers N Teachers % Teachers N Teachers %
Never 14 11.8 9 17.3 23 13.5
Rarely 13 10.9 6 11.5 19 11.1
Only when necessary 40 33.6 13 25.0 53 31.0
Every weeknight 52 43.7 24 46.2 76 44.4
Total 119 52 171
Success Success % Other Other % Total %
1 (never) 13 2.4 61 11.4 74 6.9
2 58 10.8 52 9.7 110 10.3
3 93 17.4 54 10.1 147 13.7
4 151 28.2 108 20.2 259 24.2
5 94 17.5 88 16.5 182 17.0
6 63 11.8 51 9.6 114 10.7
7 (every class) 64 11.9 120 22.5 184 17.2
Total 536 534 1070

59
Table 5.1:25 Duration of homework expected by teachers by success
Students were asked about how much homework they actually did on weekdays. Findings are
summarised in Table 5.1:26. Students in successful schools were more likely to do some homework.
The largest proportion of students from both successful and other schools reported that they spent
about half an hour on homework on weekdays. This finding indicates that in both successful and
other schools most teachers expected students to spend only a few minutes on homework; however
the most commonly reported amount of time by students was about half an hour.
Table 5.1:26 Students' responses to the amount of time spent on mathematics homework on
weekdays by success
Students were also asked how much time they spent on mathematics homework at weekends. Over
half of the students, whether in successful or other schools, responded that they did no mathematics
homework or only a few minutes at weekends. There was very little difference overall in the amount
of homework done at weekends, as shown in Table 5.1:27.
Successful schools Other schools Total
Teachers N Teachers % Teachers N Teachers % Teachers N Teachers %
None 18 15.3 12 23.1 30 17.5
A few minutes 74 62.7 35 67.3 109 64.1
About half an hour 20 16.9 4 7.7 24 14.1
About 1 hour 4 3.4 1 1.9 5 2.9
More than 1 hour 1 0.8 0 0 1 0.6
Total 117 52 169
Successful schools Other schools Total
Students N
Students %
Students N
Students %
Students N
Students %
I don’t do maths homework
26 5.2 59 11.5 85 8.4
A few minutes 184 36.5 186 36.3 370 36.4
About half an hour 215 42.7 192 37.5 407 40.1
About 1 hour 52 10.3 61 11.9 113 11.1
More than 1 hour 27 5.4 14 2.7 41 4.0
Total 504 512 1016

60
Table 5.1:27 Students' responses to the amount of time spent on mathematics homework on
weekends by success
The findings about homework indicate teachers in successful schools take a sensible, balanced
approach to homework. They set homework for a purpose, and did not expect students to spend
more than a reasonable amount of time (a few minutes to about 30 minutes) on it. Students’
responses were very consistent with those of teachers.
In other schools more students reported that their teachers assigned homework every class but a
large minority (11.5%) also indicated that they did not do homework. Teachers in other schools
either indicated that they set little or no homework, or set homework every weeknight. Nearly one
quarter of teachers in other schools, however, indicated that they did not expect students to do any
mathematics homework, despite setting homework, suggesting a potential mismatch between the
amount of homework set for students and their expectations of students. The sections earlier
related only to teachers’ or students’ responses compared between categories of success and other
showing there were no differences. When students’ comments from the two groups of schools
about what they actually did, however, were combined with the teachers’ expectations there were
differences in the mismatch of teachers/students within successful and other schools. The
expectations of teachers and students within successful schools were more consistent between
frequency and duration of homework that a reasonable amount of homework would be set and that
students would do this.
When considered by ICSEA, there was no difference on either teachers’ or students’ responses to
any of the homework questions; however, differences were observed between older and younger
students. Older students were significantly more likely to spend more time on homework during the
week and at weekends, as might have been expected, but there was no difference in the frequency
of assigned homework.
These findings about ICSEA are noteworthy. Recent studies have identified that there are often
disparities in the relationship between time spent on homework and students’ achievement
between schools and students with high or low socioeconomic status (Dettmers, Trautwein, &
Lüdtke, 2009). Australia is one country where there is no difference in mathematics achievement in
relation to time spent on homework based on PISA data, when differences in socio-economic status
are controlled (OECD, 2014). The successful schools in this study that achieved high growth in their
student performance appear to have reduced the impact of low ICSEA in terms of homework
Successful schools Other schools Total
Students N
Students %
Students N
Students %
Students N
Students %
I don’t do maths homework
199 38.6 192 38.2 391 38.4
A few minutes 114 22.1 101 20.1 215 21.1
About half an hour 114 22.1 131 26.1 245 24.1
About 1 hour 65 12.6 61 12.2 125 12.4
More than 1 hour 24 4.7 17 3.4 41 4.0
Total 504 512 1016
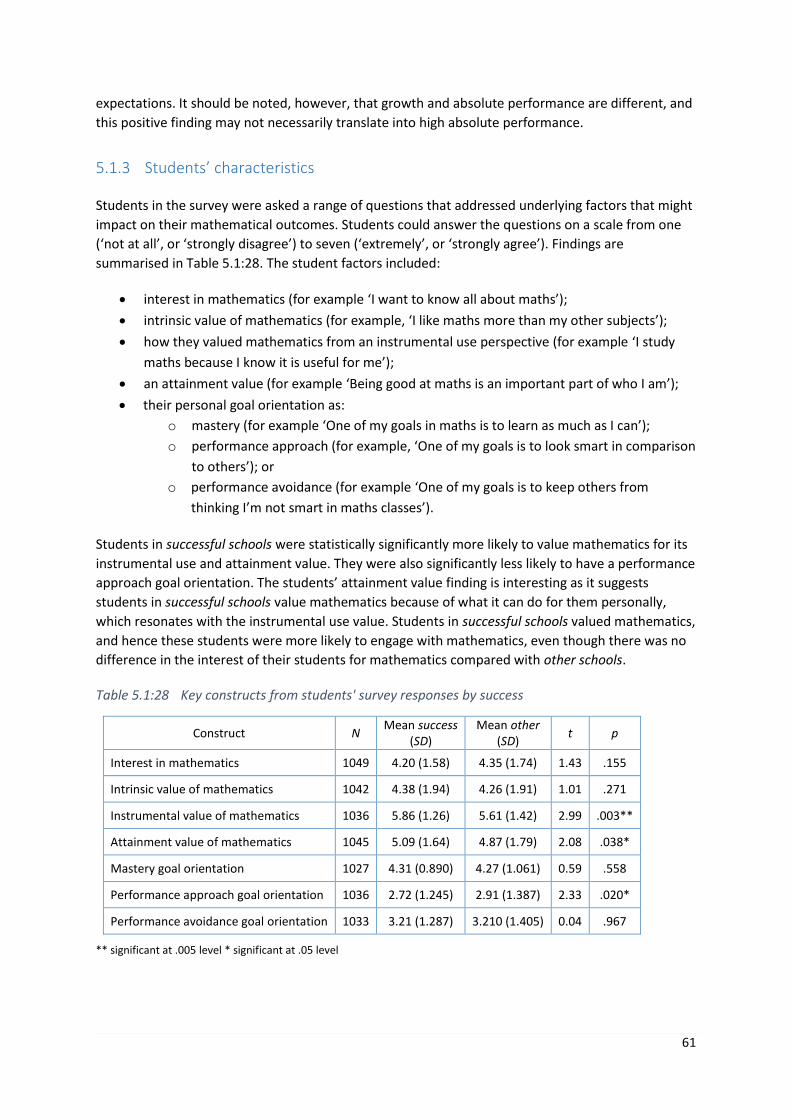
61
expectations. It should be noted, however, that growth and absolute performance are different, and
this positive finding may not necessarily translate into high absolute performance.
5.1.3 Students’ characteristics
Students in the survey were asked a range of questions that addressed underlying factors that might
impact on their mathematical outcomes. Students could answer the questions on a scale from one
(‘not at all’, or ‘strongly disagree’) to seven (‘extremely’, or ‘strongly agree’). Findings are
summarised in Table 5.1:28. The student factors included:
interest in mathematics (for example ‘I want to know all about maths’);
intrinsic value of mathematics (for example, ‘I like maths more than my other subjects’);
how they valued mathematics from an instrumental use perspective (for example ‘I study
maths because I know it is useful for me’);
an attainment value (for example ‘Being good at maths is an important part of who I am’);
their personal goal orientation as:
o mastery (for example ‘One of my goals in maths is to learn as much as I can’);
o performance approach (for example, ‘One of my goals is to look smart in comparison
to others’); or
o performance avoidance (for example ‘One of my goals is to keep others from
thinking I’m not smart in maths classes’).
Students in successful schools were statistically significantly more likely to value mathematics for its
instrumental use and attainment value. They were also significantly less likely to have a performance
approach goal orientation. The students’ attainment value finding is interesting as it suggests
students in successful schools value mathematics because of what it can do for them personally,
which resonates with the instrumental use value. Students in successful schools valued mathematics,
and hence these students were more likely to engage with mathematics, even though there was no
difference in the interest of their students for mathematics compared with other schools.
Table 5.1:28 Key constructs from students' survey responses by success
Construct N Mean success
(SD) Mean other
(SD) t p
Interest in mathematics 1049 4.20 (1.58) 4.35 (1.74) 1.43 .155
Intrinsic value of mathematics 1042 4.38 (1.94) 4.26 (1.91) 1.01 .271
Instrumental value of mathematics 1036 5.86 (1.26) 5.61 (1.42) 2.99 .003**
Attainment value of mathematics 1045 5.09 (1.64) 4.87 (1.79) 2.08 .038*
Mastery goal orientation 1027 4.31 (0.890) 4.27 (1.061) 0.59 .558
Performance approach goal orientation 1036 2.72 (1.245) 2.91 (1.387) 2.33 .020*
Performance avoidance goal orientation 1033 3.21 (1.287) 3.210 (1.405) 0.04 .967
** significant at .005 level * significant at .05 level

62
The influence of age and ICSEA on these variables was examined. ICSEA made a difference only to
the performance approach goal orientation, with students in higher ICSEA schools less likely to
endorse questions such as, ‘I aim to look smart in comparison to the other students in maths’.
There were, however, a number of differences between older (n = 366) and younger (n = 675)
students. In every instance, younger students were significantly more likely to endorse the
statements. They showed more interest in mathematics, valued it more highly in all domains, and
had stronger goal orientations towards mathematics. Findings for the comparisons between older
and younger students are shown in Table 5.1:29.
Table 5.1:29 Differences between younger and older students on personal mathematics constructs
These findings for older students are potentially of concern, as they indicate that as students get
closer to making decisions about their futures, they are losing interest in mathematics and valuing it
less. The findings are in line with other research that has reported declines in interest in
mathematics as students get older (for example, Frenzel, Dicke, Pekrun, & Goetz, 2012).
To examine whether successful schools were making a difference to older students, the same
analysis was carried out using only the older students’ responses compared by whether they
attended a successful school or not. The findings for this analysis are shown in Table 5.1:30. Older
students in successful schools were significantly more likely to value mathematics for its utility
(Instrumental Value) and the importance of doing well in mathematics (attainment value), and to
have a personal mastery goal orientation. They were no more interested in mathematics, however,
than students in other schools.
Table 5.1:30 Older students’ responses to personal mathematics constructs by success
Construct Mean success
(SD) Mean other
(SD) t p
Interest in mathematics 3.67 (1.33) 3.61 (1.75) 0.37 .712
Intrinsic value of mathematics 3.72 (1.59) 3.71 (1.95) 0.098 .922
Instrumental value of mathematics 5.25 (1.46) 4.86 (1.54) 2.45 .015*
Attainment value of mathematics 4.39 (1.68) 3.87 (1.85) 2.82 .005**
Mastery goal orientation 3.93 (0.84) 3.61 (0.94) 3.51 .001**
Construct Mean
younger (SD)
Mean older (SD)
t p
Interest in mathematics 4.61 (1.62) 3.64 (1.78) 9.38 <.001
Intrinsic value of mathematics 4.66 (1.85) 3.72 (1.78) 7.92 <.001
Instrumental value of mathematics 6.10 (1.10) 5.06 (1.51) 12.75 <.001
Attainment value of mathematics 5.43 (1.50) 4.13 (1.78) 12.46 <.001
Mastery goal orientation 4.57 (0.90) 3.77 (0.90) 13.60 <.001
Performance approach goal orientation 3.03 (1.41) 2.42 (1.02) 7.24 <.001
Performance avoidance goal orientation 3.56 (1.30) 2.55 (1.17) 12.22 <.001

63
Performance approach goal orientation 2.39 (1.01) 2.44 (1.03) -0.53 .594
Performance avoidance goal orientation 2.51 (1.12) 2.60 (1.21) -0.757 .450
** significant at .005 level * significant at .05 level
5.1.4 Teachers’ and students’ responses in successful schools
Section 5.1.4.1 further examines how teachers influence their students’ outcomes. It does this by
using student survey responses that have been matched with their classroom teachers’ responses.
There was only sufficient matched data to consider a subset of students and teachers from
successful schools. By considering students within classes, models could be built that indicate the
weighting and pathways of influence using sophisticated multi-level modelling techniques. Two
different models are reported here.
5.1.4.1 Influences on primary students’ interest in mathematics
For 303 primary students, including some in year 7, matched data were available from 28 teachers in
11 successful schools. Of these students, 44% were male. Their ages ranged from eight to 13 years
(M = 10.1 years, SD = 1.2). Table 5.1:31 shows the number of students and teachers by year level.
Table 5.1:31 Distribution of students and teachers across year levels
Year Level Year 3 Year 4 Year 5 Year 6 Year 7
Students (n) 9 53 158 48 35
Teachers (n) 1 5 11 7 4
Student interest in mathematics was assessed using the students’ self-report on a 7-point scale from
1 (not at all) to 7 (extremely). Two different constructs were involved: students’ emotional interest
(SEI) with items such as, ‘I like maths more than my other subjects at school’ and Students’ Cognitive
Interest (SCI) using items such as, ‘after a math class, I am often curious about what we are going to
do in the next lesson’. Measures of students’ learning environment were taken from the students’
and their teachers’ mastery (SCM, TCM) and performance orientation (SCP, TCP) scales, and
students’ perceptions of teachers’ enthusiasm for teaching mathematics (STE) and teachers’
perceptions of their enthusiasm for mathematics (TSE) scales (details of these scales are provided in
the survey instruments in Appendix A2). ICSEA and gender were also included as independent
variables.
Figure 5.1:6 shows the results of the student comparisons. The model shows that student
perceptions of teachers’ enthusiasm for teaching mathematics (STE) was mediated through the kind
of teaching environment created, with a strong positive association with a mastery environment,
and a smaller association with a performance environment. Boys were slightly less likely to perceive
a mastery goal orientation in the classroom, but were more likely to show both cognitive and
emotional interest in mathematics. Of concern, and somewhat unexpected, given that the primary
students in this study were generally very positive about mathematics, is the negative association
between age and interest. This has long been reported for secondary age students, but these results
indicate that students are losing interest in mathematics much earlier than might have been
expected. A mastery environment was positively associated with both cognitive and emotional
interest, but a performance environment had a small negative association with emotional interest

64
only, and no significant influence on cognitive interest. Overall these findings mirror those from
previous studies in secondary schools, but have not before been shown in a primary setting (for
example, Kunter et al., 2008; Zhang, 2014).
Figure 5.1:6 Structural equation model showing factors that impact on primary students’ interest in
mathematics * p < 0.05 ** p < .01
Note: The model included student perceptions of their teachers’ enthusiasm for teaching mathematics
(STE) mediated through students’ perceptions of classroom environment (SCM and SCP). The model
includes age and gender (male) as independent variables. Outcome measures are students’ cognitive
interest (SCI), and students’ emotional interest (SEI). Single-headed arrows show the direction of the
influence, and double headed arrows between indicate a relationship but with no direction specified.
Teaching enthusiasm (STE) impacted positively on students’ perceptions of both mastery (SCM) and
performance (SCP) orientations, but particularly in relation to the mastery orientation, which in turn
impacted students’ interest. It has been suggested that this relationship could come from two
possible causal links. Enthusiastic teachers are more likely to ‘infect’ their students with their
enthusiasm and hence generate higher levels of emotional interest. Second, enthusiastic teachers
may be more likely to seek interesting and appropriate activities for their students, hence generating
cognitive interest (Kunter et al., 2008, 2011).
There is evidence from other studies that teachers in mastery oriented classrooms are more
enthusiastic and encouraging than those in performance oriented classrooms (Patrick et al., 2000).
Teachers in mastery oriented classrooms, who are likely to be enthusiastic about teaching, motivate
their students intrinsically through encouragement, whereas teachers in performance oriented
classrooms may be more likely to use extrinsic motivation, such as challenging students to perform
well in tests. Teacher enthusiasm for teaching seems to be a critical component for creating and
maintaining a mastery oriented environment, and this environment in turn has an effect on
students’ interest in mathematics.
When a comparison was made between different classes, some surprising relationships were
identified. ICSEA was a predictor of teachers’ perceptions of a performance orientation, suggesting
that teachers in higher ICSEA schools were more likely to create environments that fostered
competition and performance against external benchmarks. Surprisingly, teachers’ perceptions of a
65
performance environment also impacted positively on their students’ emotional interest. Because of
the confounding impact of ICSEA, it may be that students in high ICSEA schools are more likely to
come from social environments where school is perceived positively, leading to more support from
parents for students and for the school. This in turn impacts on students’ general emotional interest
in school, which flows into their mathematics classrooms.
There are several implications for schools and teachers from these findings. Even among young
students in primary schools, age and gender are beginning to play a part in students’ interest in
mathematics. Programs designed to maintain girls’ interest in mathematics, for example, may need
to begin earlier than secondary school.
The strong relationship between primary students’ perceptions of teachers’ enthusiasm for teaching
and of a mastery classroom, that in turn affects students’ emotional and cognitive interest, has an
implication for professional learning programs. Professional learning programs for teachers need to
focus not only on content and pedagogical knowledge, but also on changing teachers’ attitudes and
thinking about mathematics. The challenge to change these attitudes is considerable given primary
teachers’ negative feelings and attitudes towards mathematics (Beswick et al., 2006) This could be
addressed in part by having specialist teachers of mathematics in primary schools to teach
mathematics and to lead teacher development. These finding have implications for numeracy
coaches, for example, or for in school professional learning groups.
5.1.4.2 Students’ engagement profiles in mathematics
A second analysis undertaken in successful schools considered students’ engagement with
mathematics from the perspective of different dimensions of engagement. This analysis was
undertaken with 550 students taught by 37 teachers in 15 schools, both primary and secondary
schools. Of the students, 46% were boys, the age range was from 8 to 15 years (M = 10.2, SD = 1.5),
and the students were in Years 3 to 9. Students were asked to rate their agreement with nine
statements on a seven point scale from strongly disagree to strongly agree. The word ‘engagement’
has little meaning for students, so the statements were constructed and combined to represent
student engagement for each of three dimensions:
behavioural engagement (for example ‘I work hard in maths’);
emotional engagement (for example ‘I like maths better than other subjects’); and
cognitive engagement (for example ‘I want to know all about maths’).
Scores for each student were compiled for each of these dimensions. A latent class analysis (LCA)
was applied to the data. LCA assumes that rather than being selected from one population, students
have in fact been drawn from a number of hidden (latent) classes. Details of the analysis are
provided in Appendix D. The analysis identified three subgroups of students, termed engaged (n =
305), compliant (n = 206), and disengaged (n = 40). These underlying subgroups had distinctly
different engagement profiles as shown in Figure 5.1:7.

66
Figure 5.1:7 Students’ engagement profiles showing the relative components of engagement
In terms of gender distribution, there was an almost equal proportion of boys and girls in the
engaged group (boys 51%, girls 49%), but statistically significant differences between the compliant
(Boys 34%, Girls 66%) and disengaged (boys 68%, girls 32%) groups. There was an association with
students’ self-reported most recent grade for mathematics using the A to E scale. Students in the
engaged group were statistically significantly more likely to report an A or B rating, whereas
students in the disengaged group were more likely to report a D or E grade. There was no significant
difference, however, between the engaged and compliant groups.
When these groups were compared with respect to the teacher enthusiasm and classroom goal
orientations, the results were not surprising. Disengaged students perceived less Teacher
Enthusiasm and had lower perceptions of a Mastery classroom environment than either the
compliant or engaged groups. Similarly, compliant students were lower than engaged students on
these two variables, with all differences being statistically significant. Similar results were seen with
respect to a global measure of school caring (using items from You et al. (2011). For example, the
teachers here respect me’). There was no difference among any groups for a performance
orientation. Younger students were more likely to be in the engaged group than older students.
There are implications for schools and teachers from these findings. The identification of the
compliant profile is useful: students in this group were conscientious, as shown by their high
behavioural engagement, but did not particularly like nor were they interested in mathematics. Girls
dominated this group, and it might be that to move these students to an engaged profile distinctly
different classroom activities might be needed. The disengaged group was fairly small, and
dominated by boys. The sample came only from successful schools and the small number in the
disengaged group may imply that a focus on school and classroom environment factors may be a
precursor to moving students into at least a behavioural level of engagement. Without appropriate
Mean behavioural
Mean emotional/cognitive

67
comparison data, however, this notion can only be a conjecture. These findings indicate that, in line
with current research, programs targeted at disengaged students warrant some rethinking (Taylor &
Parsons, 2011) because they may neglect the largely hidden group of compliant students. Given the
decline in mathematics enrolments in the upper years of schooling and in tertiary education, this
finding indicates that further research is needed about ways in which students can be emotionally
and cognitively engaged with mathematics.

68
6 6 Evidence from the case studies
In this chapter, findings from the analysis of the successful school case studies are presented and
discussed, with examples. The focus is on successful practice at school, classroom and individual
levels, and on providing exemplars of good practice that could inform other schools that want to
improve their mathematics’ learning and teaching. In the examples, care has been taken not to
provide any information that might identify a particular school, which is an issue for schools in small
states or systems. For that reason only brief background information is provided. The chapter is
structured around school and classroom characteristics.
Evidence is provided in the form of direct quotes from school leaders, teachers, and students;
examples of classroom or school practice taken from field notes during the visits; and vignettes in
which a particular school’s practices are provided in an elaborated form to provide an exemplar for
schools. All material presented has been anonymised to protect confidentiality.
Table 6.2:1 summarises the key characteristics of case study schools. Table 6.2:2 summarises the
information from each school visited.
6.1 Key findings
Case study schools had a clear and purposeful focus on mathematics/ numeracy.
Case study schools built on what was going well. There was a culture of continuous
improvement and they did not take a negative view of teachers or students.
Mathematics in case study schools was led by a member of staff, who had input at the
decision making or policy level at the school.
Case study schools used data effectively to identify strengths and weaknesses in programs,
classes, and students, and planned accordingly to meet the identified needs.
Resources were directed specifically at mathematics/numeracy. These resources included
provision of time and materials. Schools were creative in providing these resources.
In case study schools there was a strong emphasis on collaborative professional learning
through learning groups. In these groups, teachers discussed mathematics and its teaching
and learning.
The broad approach to mathematics across the school was consistent, in that school level
plans underpinned the collection of data upon which student groupings were based, the
language used to describe mathematical concepts, and sometimes the lesson structure.
Within the broad school frameworks established, teachers were autonomous and could
usually use resources and pedagogies that suited their particular year level or class group.
In case study schools, NAPLAN was not a primary focus; i.e. it was considered as 'one test on
one day'.
There was no standout approach to teaching mathematics.
Teachers in case study schools were able to change their teaching approaches to cater for
different types of student learning styles.
Teachers were enthusiastic about teaching mathematics. Students recognised this
enthusiasm.
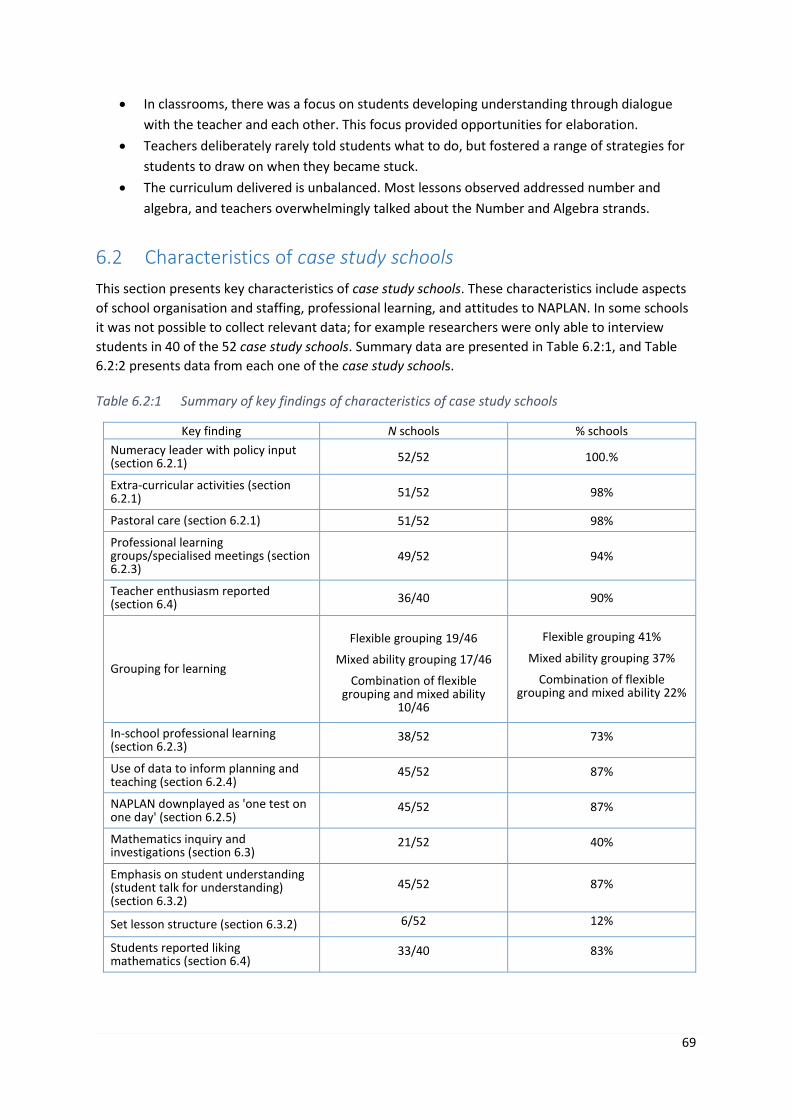
69
In classrooms, there was a focus on students developing understanding through dialogue
with the teacher and each other. This focus provided opportunities for elaboration.
Teachers deliberately rarely told students what to do, but fostered a range of strategies for
students to draw on when they became stuck.
The curriculum delivered is unbalanced. Most lessons observed addressed number and
algebra, and teachers overwhelmingly talked about the Number and Algebra strands.
6.2 Characteristics of case study schools
This section presents key characteristics of case study schools. These characteristics include aspects
of school organisation and staffing, professional learning, and attitudes to NAPLAN. In some schools
it was not possible to collect relevant data; for example researchers were only able to interview
students in 40 of the 52 case study schools. Summary data are presented in Table 6.2:1, and Table
6.2:2 presents data from each one of the case study schools.
Table 6.2:1 Summary of key findings of characteristics of case study schools
Key finding N schools % schools
Numeracy leader with policy input (section 6.2.1) 52/52 100.%
Extra-curricular activities (section 6.2.1) 51/52 98%
Pastoral care (section 6.2.1) 51/52 98%
Professional learning groups/specialised meetings (section 6.2.3)
49/52 94%
Teacher enthusiasm reported (section 6.4) 36/40 90%
Grouping for learning
Flexible grouping 19/46
Mixed ability grouping 17/46
Combination of flexible grouping and mixed ability
10/46
Flexible grouping 41%
Mixed ability grouping 37%
Combination of flexible grouping and mixed ability 22%
In-school professional learning (section 6.2.3)
38/52 73%
Use of data to inform planning and teaching (section 6.2.4)
45/52 87%
NAPLAN downplayed as 'one test on one day' (section 6.2.5)
45/52 87%
Mathematics inquiry and investigations (section 6.3)
21/52 40%
Emphasis on student understanding (student talk for understanding) (section 6.3.2)
45/52 87%
Set lesson structure (section 6.3.2) 6/52 12%
Students reported liking mathematics (section 6.4)
33/40 83%

70
Table 6.2:2 Summary of analysis of data from case study schools Sc
ho
ol I
D
ICSE
A le
vel
Tim
e
Loca
tio
n
Sch
oo
l typ
e
Nu
mer
acy
lead
er
Extr
a-cu
rric
ula
r
acti
vity
Pas
tora
l car
e
Gro
up
ing
for
lear
nin
g
Pro
fess
ion
al le
arn
ing
gro
up
Teac
he
r en
thu
sias
m
rep
ort
ed
In s
cho
ol p
rofe
ssio
nal
lear
nin
g
Use
of
dat
a to
info
rm
pla
nn
ing
and
tea
chin
g
NA
PLA
N d
ow
np
laye
d
Mat
hem
atic
s in
qu
iry
and
inve
stig
atio
ns
Stu
den
t ta
lk f
or
un
der
stan
din
g
Set
less
on
str
uct
ure
Stu
den
ts li
ke
mat
hem
atic
s
1 M Both Metro Combined Y Y Y FG Y
Y Y Y
Y Y Y
2 H 11-13 Metro Primary Y Y Y FG Y Y Y Y Y Y Y
Y
3*^ H 12-14 Metro Secondary Y Y Y FG Y
Y Y Y
4 H 12-14 Metro Secondary Y Y Y FG Y Y
Y Y
Y
Y
5 L 11-13 Metro Primary Y Y Y MA Y
Y Y Y Y Y
6 H 12-14 Metro Primary Y
Y FG Y
Y Y Y Y Y
Y
7 H 12-14 Metro Primary Y Y Y FG Y Y Y Y Y
Y Y Y
8 L Both Metro Secondary Y Y Y FG Y Y Y Y Y
Y
Y
9 M 12-14 Metro Primary Y Y Y FG Y Y
Y
Y
Y
10 M Both Metro Secondary Y Y Y MA/FG Y Y Y
Y
Y
11^ M 12-14 Metro Secondary Y Y Y FG Y Y Y Y Y
Y
12^ H 2014 Metro Secondary Y Y Y
Y Y
Y Y
Y
13^ L 11-13 Provincial Primary Y Y Y MA/FG
Y Y Y
Y
14^ H 12-14 Metro Primary Y Y Y MA Y Y Y Y Y Y Y
15 H 11-13 Metro Secondary Y Y Y
Y Y Y
Y
Y

71
Sch
oo
l ID
ICSE
A le
vel
Tim
e
Loca
tio
n
Sch
oo
l typ
e
Nu
mer
acy
lead
er
Extr
a-cu
rric
ula
r
acti
vity
Pas
tora
l car
e
Gro
up
ing
for
lear
nin
g
Pro
fess
ion
al le
arn
ing
gro
up
Teac
he
r en
thu
sias
m
rep
ort
ed
In s
cho
ol p
rofe
ssio
nal
lear
nin
g
Use
of
dat
a to
info
rm
pla
nn
ing
and
tea
chin
g
NA
PLA
N d
ow
np
laye
d
Mat
hem
atic
s in
qu
iry
and
inve
stig
atio
ns
Stu
den
t ta
lk f
or
un
der
stan
din
g
Set
less
on
str
uct
ure
Stu
den
ts li
ke
mat
hem
atic
s
16^ M 11-13 Provincial Primary Y Y Y MA Y
Y Y Y
Y
17 H 11-13 Metro Combined Y Y Y MA Y Y Y Y Y
Y
18 H Both Provincial Combined Y Y Y FG Y Y Y Y Y
Y Y Y
19 M 11-13 Provincial Combined Y Y Y FG Y Y Y Y Y Y Y
Y
20 H 11-13 Metro Secondary Y Y Y MA
Y
Y
Y
21 M 12-14 Metro Combined Y Y Y MA Y Y Y Y Y Y Y
Y
22 H 11-13 Metro Primary Y Y Y MA/FG Y
Y Y
23^ L 11-13 Metro Primary Y Y Y MA/FG Y
Y
Y
24^ H 11-13 Metro Secondary Y Y Y
Y Y
Y
25 L 12-14 Provincial Primary Y Y Y FG Y Y Y Y Y Y Y
Y
26^ H 11-13 Metro Combined Y Y Y
Y Y Y Y Y
Y
27 M 12-14 Provincial Combined Y Y Y MA Y Y Y Y Y Y
Y
28 M 12-14 Provincial Combined Y Y Y MA/FG Y Y Y Y Y Y Y
Y
29 H 11-13 Metro Primary Y Y Y MA/FG Y Y Y Y Y Y Y
Y
30 L 11-13 Provincial Primary Y Y Y FG Y Y Y Y Y Y Y
Y
31 M 12-14 Provincial Primary Y Y Y MA Y
Y Y Y Y Y
Y

72
Sch
oo
l ID
ICSE
A le
vel
Tim
e
Loca
tio
n
Sch
oo
l typ
e
Nu
mer
acy
lead
er
Extr
a-cu
rric
ula
r
acti
vity
Pas
tora
l car
e
Gro
up
ing
for
lear
nin
g
Pro
fess
ion
al le
arn
ing
gro
up
Teac
he
r en
thu
sias
m
rep
ort
ed
In s
cho
ol p
rofe
ssio
nal
lear
nin
g
Use
of
dat
a to
info
rm
pla
nn
ing
and
tea
chin
g
NA
PLA
N d
ow
np
laye
d
Mat
hem
atic
s in
qu
iry
and
inve
stig
atio
ns
Stu
den
t ta
lk f
or
un
der
stan
din
g
Set
less
on
str
uct
ure
Stu
den
ts li
ke
mat
hem
atic
s
32 M 12-14 Metro Primary Y Y Y MA Y Y Y Y Y Y Y
Y
33 M 12-14 Provincial Combined Y Y Y MA Y
Y Y Y
Y
Y
34 M 2014 Provincial Secondary Y Y Y MA Y Y
Y Y
Y
Y
35 H 12-14 Metro Primary Y Y Y FG Y Y Y Y Y Y Y
Y
36 H 12-14 Metro Secondary Y Y Y FG Y Y
Y Y
Y
Y
37^ M 11-13 Metro Combined Y Y Y MA Y Y Y
Y
38 M 12-14 Metro Primary Y Y Y FG Y
Y Y
Y Y Y Y
39 H 12-14 Metro Combined Y Y Y MA/FG Y Y
Y Y Y
Y
40 L 12-14 Provincial Combined Y Y Y MA Y
Y Y
Y
41 H 12-14 Metro Primary Y Y Y FG Y Y
Y Y
Y
Y
42^ M 12-14 Metro Primary Y Y Y MA/FG Y Y Y Y Y Y
43 L Both Provincial Primary Y Y Y MA/FG Y Y Y Y
Y Y Y Y
44 H 12-14 Provincial Secondary Y Y Y MA Y Y Y Y Y
Y
Y
45 H 12-14 Provincial Combined Y Y Y FG Y Y
Y Y Y Y
Y
46 L 12-14 Provincial Secondary Y Y Y MA Y Y Y Y
Y Y Y Y
47 M 11-13 Metro Secondary Y Y Y MA Y
Y
Y
Y
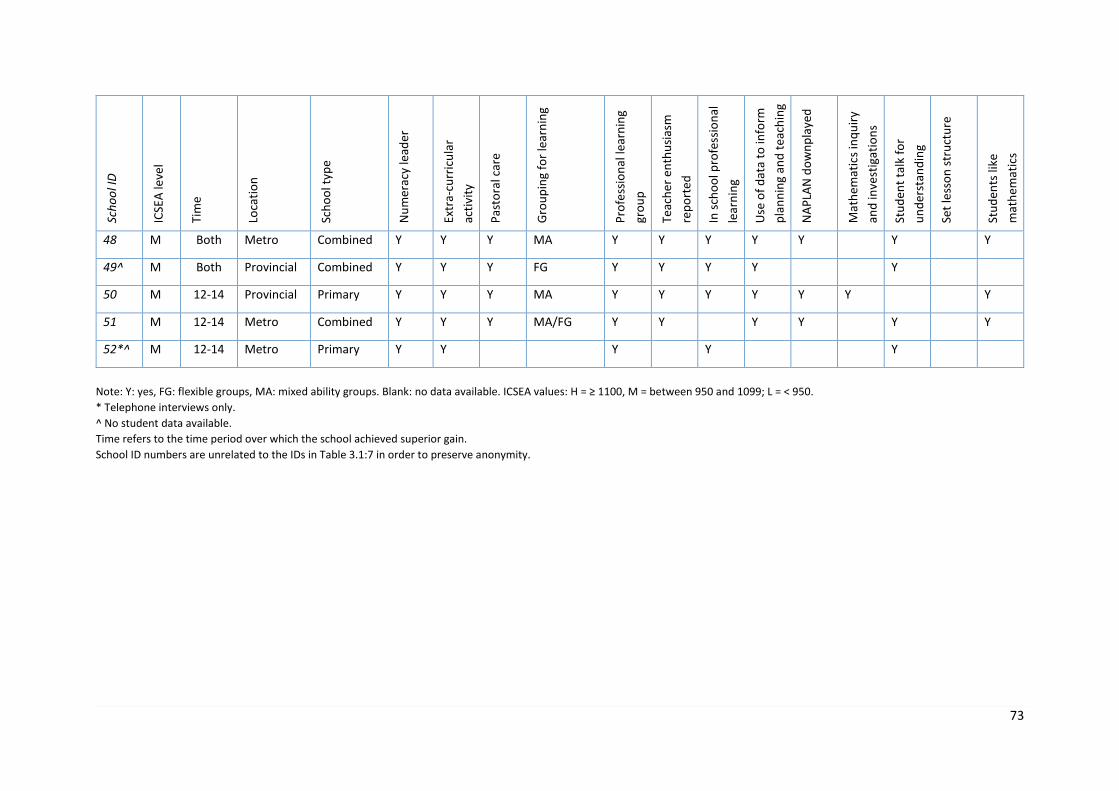
73
Sch
oo
l ID
ICSE
A le
vel
Tim
e
Loca
tio
n
Sch
oo
l typ
e
Nu
mer
acy
lead
er
Extr
a-cu
rric
ula
r
acti
vity
Pas
tora
l car
e
Gro
up
ing
for
lear
nin
g
Pro
fess
ion
al le
arn
ing
gro
up
Teac
he
r en
thu
sias
m
rep
ort
ed
In s
cho
ol p
rofe
ssio
nal
lear
nin
g
Use
of
dat
a to
info
rm
pla
nn
ing
and
tea
chin
g
NA
PLA
N d
ow
np
laye
d
Mat
hem
atic
s in
qu
iry
and
inve
stig
atio
ns
Stu
den
t ta
lk f
or
un
der
stan
din
g
Set
less
on
str
uct
ure
Stu
den
ts li
ke
mat
hem
atic
s
48 M Both Metro Combined Y Y Y MA Y Y Y Y Y
Y
Y
49^ M Both Provincial Combined Y Y Y FG Y Y Y Y
Y
50 M 12-14 Provincial Primary Y Y Y MA Y Y Y Y Y Y
Y
51 M 12-14 Metro Combined Y Y Y MA/FG Y Y
Y Y
Y
Y
52*^ M 12-14 Metro Primary Y Y
Y
Y
Y
Note: Y: yes, FG: flexible groups, MA: mixed ability groups. Blank: no data available. ICSEA values: H = ≥ 1100, M = between 950 and 1099; L = < 950.
* Telephone interviews only.
^ No student data available.
Time refers to the time period over which the school achieved superior gain.
School ID numbers are unrelated to the IDs in Table 3.1:7 in order to preserve anonymity.

74
This chapter is organised around the following major themes:
Characteristics of case study schools:
o school organisation and staffing;
o teachers’ knowledge for teaching mathematics;
o professional learning;
o use of data and collaborative planning;
o attitudes to NAPLAN; and
o assessment and reporting.
Approaches to teaching:
o explicit teaching;
o supporting students’ mathematical thinking;
o differentiating teaching for learning; and
o supporting teachers.
Students and mathematics.
Each of these themes is described and quotes, examples and vignettes are presented as evidence.
Vignettes, because of their elaborated format often address more than one aspect of the themes.
Table 6.2:3 summarises the key themes addressed in each vignette.
Table 6.2:3 Summary of themes reported in the vignettes
Vignette Theme 1 Theme 2 Theme 3 Theme 4 Theme 5
Vignette 1 School organisation
Cross school and cross-campus consistency
Leadership of mathematics/ numeracy
Grouping for mathematics learning
Use of data
Vignette 2 School organisation
Catering for difference
Teacher autonomy
Vignette 3 Grouping for learning
Implementing the AC-M
Using data to set goals
Vignette 4 Planning for mathematics
‘Guaranteed and viable’ curriculum
Grouping for learning
Vignette 5 Teachers’ knowledge
Catering for high ability
Student engagement
Classroom performance orientation
Grouping for learning
Vignette 6 Professional learning communities
Feedback Use of data Use of community resources
Vignette 7 Real-life problems
Teachers sharing ideas
Classroom discussion
Student talk
Vignette 8 Backwards mapping
Using data to diagnose program weaknesses
Collaborative programming to develop strengths K-3
Vignette 9 Collaborative planning
Whole school program Resource use
Use of NAPLAN data
Vignette 10 Choosing a good problem
Involving students in solutions

75
6.2.1 School organisation and staffing
In every case study school (52/52, 100%) there was a dedicated mathematics/numeracy leader who
had input into school policy decisions. This curriculum leader or mathematics coordinator had a
passion for mathematics and led the development process in the school, often through extensive
mentoring of other staff. This person was able to articulate a clear vision for the school in terms of
mathematics. The schools had a clear sense of cohesion that was freely acknowledged by
administrators and teachers alike; the latter acknowledging the extent to which they felt ‘part of a
strong team’. School vignette 1 demonstrates these ideas.
6.2.1.1 School vignette 1: Independent co-educational F to year 12 school in Tasmania
Key themes: school organisation; cross school and cross-campus consistency; leadership of
mathematics/numeracy; grouping for mathematics; and use of data.
The school operates on three campuses covering primary (years F to 6), high (years 7 to 10) and senior
secondary (years 11 and 12) programs. These campuses are geographically close and are linked by faculty
structures, shared facilities and underpinning values. To maintain a whole of school approach to teaching there
are eight faculties matching the eight learning areas of Arts, English, Health and Personal Development,
Humanities, Languages, Mathematics, Science, and Technology. Each Head of Faculty is responsible for the
delivery of their subject area from K–12, supported by senior staff in each part of the school, and the Deputy
Principal – Curriculum. This approach ensures continuity in each subject area across the school.
The school has just appointed a mathematics coordinator at each campus who, along with the Deputy Principal
– Curriculum, is responsible for how mathematics is organised in the school. Colleagues mentor and support
each other. In the primary years the school follows the International Baccalaureate Primary Years Programme
(IBPYP). This program takes an investigative approach, rather than the content focus of the AC-M. The AC-M is
used to inform planning alongside the IBPYP and reporting is against the A to E standards, although teachers
did say that this was difficult in an IBPYP environment.
Secondary mathematics classes are divided into two types: classroom groups for general mathematics classes
and grouped for speciality topics, such as proportions, where year groups are pre-tested and re-grouped.
Internal data are used more than NAPLAN. Re-grouping is not necessarily about ability, although this does play
Vignette 11 Teaching for understanding
Mathematical connections
Vignette 12 Classroom risk-taking
Using different teaching approaches
Cross-curriculum integration
Vignette 13 Lesson structure Learning intentions
Vignette 14 Lesson structure Classroom talk Focus on strategies
Small-group work
Vignette 15 Differentiated teaching
Grouping for learning
Teacher enthusiasm
Vignette 16 Independent learning contracts
Problem solving Inquiry teaching
Vignette 17 Whole-school focus
Changing teaching approaches
Community involvement

76
an important part. For example, groups often include students who may assist with the learning of the group,
and there are different groups for different topics. Each teacher has a diverse group made up from all students
in a particular year level. Parents find the organisation fluid and positive and are kept informed through the
school’s intranet system.
Mathematics was afforded a position of importance in schools, but not to the detriment of other
learning areas. Notably, in nearly every case study school analysed (51/52, 98%) there were broad
curriculum offerings and a range of extra-curricular opportunities such as school camps, excursions,
sport and music. Principals and leaders were emphatic they aimed to develop their students in
holistic ways, with a rounded education. Pastoral care programs were strong in every school where
this could be determined (51/51, 100%) and supported both individual teachers and students. In no
schools were there any comments about teachers or students not being capable of teaching or
learning mathematics; that is, case study schools did not take a view that either students or teachers
were lacking in some way. They aimed to move students onwards from where they were, whatever
their level of achievement or understanding, and teachers were supported to do this task, through
methods such as flexible grouping, provision of internal professional learning, and opportunities to
observe other teachers. The approach taken was universally to start from what students and
teachers knew and could do, and to build on these strengths. School vignette 2 illustrates some of
these ideas.
6.2.1.2 School vignette 2: co-educational government secondary school in Victoria
Key themes: school organisation; catering for difference; and teacher autonomy.
The school has an emphasis on personalised learning, lifelong learning, and integration of information
communication technologies (ICT) into the teaching practices, for example using Smartboards. A high
proportion of the students speak languages other than English.
The middle school mathematics leader plans the overview of the year, using the Australian Curriculum in
Victoria (AusVELS), the Victorian version of the Australian Curriculum. Teachers are given this overview, which
consists of topics and associated concepts rather than a detailed program. Some variation from AusVELS is
included. Once the overall scope and sequence is decided, after some discussion with teachers, individual
teachers have a high level of autonomy to prepare lessons suited to their classes. The mathematics leader
stated ‘[you might be working] on the same topic at the same time [but] maybe only within the same
staffroom because it’s easier. I think probably all the different teachers are doing different things. I wouldn’t
say they’re all doing the same topic at the same time.’ There was considerable flexibility for teachers to follow
approaches that best suited their classes.
There is no ability grouping (the allocation of students to classes based on ability) in the school before year 10
when some students take units 1 & 2 Foundation Mathematics; some do units 1 & 2 of Mathematical
Methods; and most do core year 10 leading onto units 1 & 2 of Mathematical Methods in year 11. NAPLAN is
seen as an opportunity to gain more information about students in order to identify those needing extra
support or enrichment.
Support is provided in the form of a before-school maths club twice a week where students are invited to
attend. The attendance, however, is ‘not that great’ and consists mostly of girls. Enrichment takes the form of
withdrawal from class for invited students to engage in ‘breadth not depth’ activities looking at mathematical
topics not usually part of the curriculum. It is taken by a mathematics teacher as part of the allocated load.
Opportunities are limited, however, because of timetable pressures on both students and staff. There is no
accelerated program, with many staff not in favour of acceleration.

77
Different case study schools used alternative approaches to address the same issue of catering for a
wide range of abilities and students. Grouping for learning was used in 90% (47/52) of schools and
this grouping was either mixed ability (a class in which students are placed using criteria other than
measured ability) or flexible grouping, or some combination of these approaches rather than
differentiating by ability. Grouping students was often on the basis of some form of assessment or
test, but schools did not maintain these groupings rigidly (‘streaming’) but rather formed and
reformed groups as needed. Sometime these groupings took place within the classroom, sometime
across year levels. The schools where no flexible grouping was mentioned (5/52, 11%) were either
small schools where provision for individual learning was made within the classroom using individual
programs (see School Vignette 16), or schools that espoused streaming.
School vignette 3 demonstrates another approach to managing a diverse intake. Described as
streaming but lacking the rigidity of fully streamed classes, this flexible grouping of identifying top,
middle, and bottom students was seen in secondary schools. The flexibility to move between classes
in the school in vignette 3 was genuine, with interviewed students reporting they had moved from
group to group.
6.2.1.3 School vignette 3: Catholic all boys secondary school in New South Wales
Key themes: grouping for learning; implementing the AC-M; and using data to set goals.
No academic standards are set for school entry—the purpose of the school is to provide a Catholic education
for boys. Students entering the school in year 7 come from up to 40 different primary schools. The school has a
large population of Asian students.
The school uses the AC-M syllabus and program as handed down by the New South Wales Board of Studies
The school does not adapt it, apart from putting it online and adding their own resources and material to it.
The school is grappling with implementing AC-M and the time needed to teach it. What used to be senior work
(year 11/12) is now in the junior syllabus (year 9/10). There are regular teacher meetings to work out how to
roll it out.
Mathematics is the only subject to stream students most of the way through secondary school. Year 7 students
are often at very different levels of mathematics understanding. They are graded on their previous NAPLAN
results and an entrance exam when they first enter the school. This forms the basis for mathematics
streaming. Following the school’s strategic plan, mathematics students are streamed into high ability, middle
and support groupings. The high ability students are extended through a quicker teaching pace and more
complex tasks, the middle group focus on consolidating their mathematics knowledge so they reach a
‘standard’ while the support group works to bring them up to a ‘standard’. There is ‘relegation’ and
‘promotion’ between streams.
NAPLAN data are used to create a document for staff with an analysis of results that helps set the goals for the
following years. Students and teachers discussed the data during a program being run by the school’s CEO in
which the group’s strengths and weaknesses around NAPLAN were identified.
In large secondary schools one or two classes were sometimes created for students needing
extension in mathematics, with a similar grouping for those students requiring additional support.
All other classes were heterogeneous, comprising students grouped randomly or according to home
groups rather than by some ability measure.
All case study schools (52/52, 100%) had a dedicated time for mathematics/numeracy, that is
students were required to spend a certain number of hours learning mathematics/numeracy each

78
week. This is significant because, in some Australian schools, mathematics is hardly taught, or is left
to the individual teacher despite a mandated requirement for mathematics to be taught. A minority
of case study schools (6/52, 12%), mainly in primary schools, used a specific structure for lessons and
planning that had been collaboratively developed over time. In some schools mathematics time was
deliberately uninterrupted, that is students were not withdrawn from mathematics (or literacy) for
any purpose. Although not a universal practice, there was a sense that interruptions were kept to a
minimum. School vignette 4 is an example of the level of planning that case study schools undertook.
6.2.1.4 School vignette 4: government primary school in Queensland
Key themes: planning for mathematics; ‘guaranteed and viable’ curriculum; and grouping for
learning.
Teachers are using AC-M as the basis for planning and drawing upon and incorporating, where appropriate,
the curriculum into the classroom (C2C) resources available from Education Queensland. The Administration
team allocates time for staff to plan for mathematics learning in Professional Learning Communities (PLCs).
These planning sessions have occurred as part of professional learning days and as part of staff meetings.
Teachers are required to use their own time to plan on a weekly basis. Teachers have taken ownership of
planning and are developing a Guaranteed and Viable Curriculum (Marzano, 2012), based on the AC-M to suit
their needs. The guaranteed and viable curriculum is a process where teachers unpack the AC-M and classify
the content descriptions as either essential or supportive. This classification allows teachers to focus on
learning specific to their year level. A scope and sequence for mathematics from Prep to year 6 has been
developed with the essential and supportive content descriptions identified. Teachers have contributed to the
development of this program and can see where the students have come from, where they are expected to be
now for the students in a particular cohort, and where the students are going. The analysis of the curriculum in
this way has assisted teachers to see the development of mathematics as a continuum.
At a cohort level, teachers also develop a weekly ‘Maths Push in’ test. This test, usually comprising
10 questions based on the content focus for that particular week, is administered every Friday. The primary
purpose of the weekly test is to monitor student progress. Based on the individual’s test result, students are
allocated to a particular group (such as, like results/like successes/like difficulties) the following week to attend
three half-hour lessons for targeted mathematics learning to receive extension, or to address individual needs.
The school is focusing resources in this area of using small groups to develop targeted and differentiated
learning. In Terms 1 and 2 of 2015, the year 3 cohort of 81 students (a NAPLAN cohort) was divided into eight
groups based on learning needs. The three year 3 teachers, members of the administration team (three
teachers), and two other available teachers were rostered to take their allocated group of students for three
half-hour lessons the following week. It was the allocated teachers’ responsibility to prepare the learning
activities for these targeted lessons for their group of students, thus not impacting on the year level teachers’
preparation time. In Terms 3 and 4, the same process was undertaken with the year 2 and year 4 cohorts of
students. The school has allocated finances to enable this small group teaching with extra teachers to occur.
In case study schools there were regular meetings and discussions about mathematics between
administrators, curriculum leaders, mentors and teachers, to ensure that the best available learning
opportunities were provided for every student. Time was allocated during staff meetings or within
professional learning groups (49/52, 94%). Informal discussions focussing on mathematics were also
observed. For example, a researcher in one school reported that as the Principal was coming along
the corridor to meet her, a teacher stopped the Principal to discuss some aspect of mathematics.
The researcher observed that the Principal followed up this brief conversation during recess, when a
time was set aside to discuss the idea more formally. In secondary schools, teachers of mathematics

79
usually shared a staff room or had a common area where mathematics was taught. These spaces
created opportunities for Informal conversations, about students and mathematics.
6.2.2 Teachers’ knowledge
Information from the case study schools suggested that mathematics teaching qualifications were
highly valued. School principals, where they had control of their staffing and particularly in
secondary schools, tended to stress that they sought qualified mathematics teachers who knew the
mathematics content. It was evident in the lessons observed that teachers in these case study
schools had a deep knowledge and understanding of the mathematics they were teaching. They
recognised potentially productive problems and provided good explanations. Where students were
observed in classes and interviewed in focus groups (40 schools) 90% (36/40) commented that their
mathematics teachers liked mathematics, and were able to explain it clearly. As one student
commented, ‘he re-languaged’ it for us’. Students appreciated this understanding of the
mathematics by their teachers.
Those teachers who undertook further study, appreciated formal opportunities for accredited study.
For example, this quote came from a secondary mathematics teacher:
I’m doing a final [Masters] unit in mathematics education … it’s certainly made
me question how I teach mathematics. It’s certainly changed my approach to the
classes and it’s also given me some ideas … its broadened my horizons a little bit
because sometimes you can fall into ‘this is what we do this is how we do it this is
the way we’ll keep doing it’ … you can find yourself trapped in it.
A similar comment was made by a non-mathematics trained teacher who had undertaken a
graduate certificate as part of a retraining program. This teacher would not, however, have taken on
this retraining program if it had not been fully funded. Teachers confident with mathematics were
able to cater for students in a variety of ways. School vignette 5 describes a school where all
teachers were qualified and enjoyed mathematics.
6.2.2.1 School vignette 5: Independent secondary school in the Australia Capital Territory
Key themes: teachers’ knowledge; catering for high ability; student engagement; performance
orientation; and grouping for learning.
Although students are not heavily streamed, they are grouped for learning mathematics when they enter the
school, based on an internal test. High ability students, and those needing additional support, are grouped
together for learning, but all other classes are heterogeneous. There is movement in and out of these groups,
although one teacher commented that some students preferred to stay in lower groups as there was less
pressure. One student interviewed said that when he came into the school he was in a lower group but quickly
became bored and was moved into another group, which he described as ‘a pretty good group’. Additional
support was offered to students at lunchtimes, as well as before and after school for any student who
requested it.
All teachers were qualified to teach mathematics. There was no ‘out of area’ teaching. Classrooms were
conventional with students sitting at desks usually placed in rows. Some classrooms had mathematics posters
on the walls, and all had Smartboards. There was a sense of teachers caring for the students. One student with
diagnosed Asperger’s Syndrome, for example, was able to come late into the class and complete the work
without having to interact with other students, although the rest of the class was working in pairs and small
80
groups. Although the teaching was explicit and teacher-led, and had a focus on high performance, the feeling
within the classrooms was of the whole class aiming to perform well, rather than the individualistic
performance orientation often described in the literature.
One teacher extended her Year 8 class by giving them opportunities to explore different aspects of
mathematics. Each student chose a topic and taught this to the rest of the class. The topics were varied
including a way of squaring 2-digit numbers mentally, Japanese multiplication, lucky numbers, multi-
dimensional space, and Keeler’s Theorem (as part of a Futurama episode). Activities such as these kept these
mathematically capable students engaged with mathematics.
There was a strong emphasis on performance in exams in the school. This focus did not come at the expense
of developing understanding. In two revision lessons observed, teachers were questioning, providing
opportunities for students to suggest approaches to problems, and using a wide variety of materials, including
from the nrich website (nrich.maths.org) and Geogebra (geogebra.org). Teachers identified and used different
resources for teaching, and did not simply rely on the textbook. Textbooks were used as a resource for
examples.
Students were engaged and appeared to enjoy their classes. There were strong positive relationships among
the teachers and the students, including the students’ use of nicknames for the teachers, and an obvious
feeling of students being able to ask any questions that they wished without fear of being seen as foolish.
6.2.3 Professional learning
From the case studies, it appeared professional learning was valued, but that much of it took place
‘in-house’. Formal professional learning within the school was mentioned by nearly three-quarters of
the case study school personnel (38/52, 73%). Schools promoted models of collegiality, such as a
‘community of learners’, or a ‘professional learning community’ with formal meetings where
resources were available to support this approach. These sessions were sometimes led by numeracy
coaches in primary schools, or by the mathematics leader in secondary schools. Wealthier schools
had made strategic decisions about the use of funds, whereas others used additional funding
provided through a range of state and federal programs, such as national partnerships, or student
free days to provide time for meetings.
The impression of predominantly school based professional learning was confirmed by discussion
with 10 professional learning providers from different parts of Australia, including Tasmania, West
Australia, South Australia, Queensland, and New South Wales. The expense associated with finding
relief teachers, and in many areas the difficulty of finding relief teachers, made releasing a large
number of teachers to attend professional learning sessions impractical for many schools. Typically
one or two teachers might attend a professional learning session and these teachers then relayed
the information to their colleagues. At its best, this approach works well when there is sufficient
time allocated for the new ideas to be shared and developed. In many situations, however, this
approach can become like ‘Chinese whispers’ and important core concepts can be diluted or lost.
Where this approach was taken, in case study schools the time was made available through learning
groups.
Professional learning communities or similar teacher groups were common in case study schools
(49/52, 94%). Although these groups may have had a general focus on all subjects, mathematics was
addressed explicitly, and sometimes exclusively when these groups were located in secondary school
subject groups. There was a strong theoretical focus, with readings and case studies often being

81
allocated to groups. Teachers regularly observed each other’s mathematics lessons in a structured
and purposeful way, using a framework agreed by the school. They discussed their teaching of
mathematics, tried new approaches and set goals. Often an action research framework, that is a
model of professional learning in which teachers undertake some focussed change in their
classrooms, reflect on the outcomes, usually with colleagues, and then refine the new approach in a
cycle of continuous improvement, supported these new ideas. In some schools numeracy coaches or
coordinators were used to promote professional conversations, in others the impetus came from the
Principal or from a senior staff member.
All teachers were expected to engage in activities of this kind, and to participate in regular, genuine
appraisal activities. There was no sense that these undertakings were tokenistic—the teachers
worked hard at improvement in mathematics but did this willingly and with enjoyment. These case
study schools created working environments that were challenging, exciting and non-judgemental
for both teachers and students.
These learning groups within schools provided most of the professional learning in mathematics for
teachers. This learning may be supplemented by sessions with outside providers, including from
education departments. Typical arrangements were for a single teacher, or at most two teachers, to
attend external sessions and then share their new experience with all staff.
Teachers of mathematics in case study schools were knowledgeable about mathematics. They
explained and represented mathematical ideas in a variety of ways. They were able to challenge
their students in a variety of ways, and were not afraid to admit to not knowing some aspect of
mathematics.
Internal professional learning sessions are exemplified in school vignette 6. This school had received
some additional funding to support change but had also worked with its community to organise
additional time for teacher discussion. There was a whole school commitment to action and local
resources, including the school farm, were used to make mathematics meaningful and relevant.
6.2.3.1 School vignette 6: government F to 10 school in Western Australia
Key themes: professional learning communities; feedback; use of data and community resources;
and use of data.
Responsibility for mathematics is in the hands of an experienced mathematics coordinator who has the full
confidence of the Principal. This person was identified as having considerable knowledge and passion about
mathematics that was gained from working with influential others at previous schools. A change in approach
to planning for mathematics was based on the development of professional learning communities (PLCs)
across the school. The PLCs have fortnightly meetings, for which time has been found through a 2.30pm ‘early
finish’ every Monday. PLC activities usually consist of a reading done by all members, which has a focus on a
particular strategy, this strategy is then put into practice in classrooms, and teachers bring back the feedback
for discussion. Strategies are all based on the work of Dylan Wiliam (for example, Wiliam, 2011) in formative
assessment, which is considered to be one of the biggest factors in the improvement of mathematics teaching.
The strategies include, for example, ‘traffic lights’ where students show a card indicating ‘I’ve got this’ (green),
‘getting there but need a bit more help’ (yellow), and ‘I’m stuck’ (red) and the use of small individual
whiteboards on which students record their answers and show to the teacher. These practices give immediate
feedback to the teacher about the progress of the lesson and changes can be made as needed on the run. For
each strategy trialled, teachers provide comments to their PLC group. Following this PLC meeting, observations
are set up so teachers can watch teachers in other year levels and provide each other observational feedback

82
about how the formative strategies are working. A number of teachers also went to a Dylan Wiliam conference
and found that ‘incredible’.
In addition to the immediate feedback at classroom level, the school makes extensive use of NAPLAN data. The
focus is on grouping children of like ability, because of a time factor. Once teachers have identified children
who don’t understand specific concepts, such as place value or money, they form ‘guided numeracy groups’. In
the secondary school, where there are small numbers of students, the school has begun to use case
management strategies, identifying strengths and weaknesses at an individual level, using NAPLAN and other
school based data.
Teachers analyse NAPLAN data forensically to see which questions the students had got wrong, and identify
the cognitive demands in the questions and the common misconceptions. Teachers consider whether or not
the same issues are happening across the school. This analysis then becomes the focus of term planning
documents and lesson planning. For case management groups, there is a column in planning documents asking
‘what was the specific identified target that these children didn’t understand?’ Teachers use this data every
day to make sure that they are teaching those students what they didn’t know, from the higher order thinking
questions in NAPLAN.
The school also makes extensive use of the school farm with many teaching episodes based on resources
available through the farm. For example, students in the secondary school worked out the fencing
requirements of the farm, and calculations relating to fertiliser, seeding, and the wool cheque are part of the
mathematics program. This work is undertaken in classrooms and the students then go onto the farm to
implement their findings.
Case study schools put considerable resources into providing opportunities for professional
conversations to occur. For example, one primary school had organised the timetable such that
groups of teachers had a long block of time from 10:30 am onwards, providing nearly a full day to
work together once a week. There was a requirement during this time to focus on learning and
teaching through, for example, structured discussion and working through case studies. One
secondary school required all teachers to commit to a process of continuous appraisal and
improvement using collegial lesson observations.
Another successful approach that supported teachers’ professional learning is described in school
vignette 7. This school was one of three using the International Baccalaureate (IB) curriculum.
6.2.3.2 School vignette 7: independent F to 12 school in the Northern Territory
Key themes: real-life problems; teachers sharing ideas; classroom discussion; and student talk.
The school has a strong Christian ethos and aims to develop the whole person. The Principal stated, ‘it is about
equipping kids not only to be great academically but also to take their part in society, understand the nature of
service, compassion and respect.’ The school introduced the IB curriculum in 2009 and the general feeling
among teachers and senior staff was that this curriculum had made a huge difference in the school.
The focus on inquiry in the IB has forced teachers to pose problems and look at deep questions such as, ‘what
does equal mean?’ real-life problems where children have to use mathematics to solve problems of relevance
to them are important. Through the IB, everything is brought back to a real world context, which can be quite
difficult especially for young mathematics teachers who may not have the background and breadth of
understanding because they perceive mathematics as being about having the answers.
The school is textbook free from years 6 to 9. There are some small sets of textbooks, not full class sets,
available for short-term use and teacher reference. The AC-M provides the content for mathematics, but the IB

83
frameworks in primary and middle years are used to develop understanding through an inquiry approach.
Inquiry is being developed into the middle school and up into senior classes. The head of mathematics said,
‘It’s about getting the children to discover what’s happening and why it’s happening … it’s so powerful for
them and they remember it into the following year.’ Taking this IB approach has made demands on staff.
A program of sharing ideas was instituted to develop the content knowledge of the teachers and to get them
used to teaching understanding through inquiry, rather than procedures.
Good mathematics lessons are those where there is a lot of discussion and dialogue, ‘lots of conversations to
unpack the maths’. A certain amount of noise was expected, with students talking to each other as they
worked on problems, students engaged with the material and were not on phones or iPads (unless they were
part of the lesson), and the teacher circulating through the class talking with students. Teachers ask leading
questions, students pose questions and work out the answers for themselves. At times students drive the class
agenda. Discussion has a focus as to why an approach worked and what didn’t work, and the lesson ends with
a reflection on the lesson objectives.
These principles were observed in classrooms. For example, a year 8 lesson was following up on the previous
lesson, which had taken place outside the classroom measuring steps and slopes. The teacher re-introduced
the concept of slope, and emphasised that it took time to fully understand a new idea. A series of problems
was presented with different approaches to slope, including positive and negative slopes. All of these
examples were accompanied by dialogue between students, and with the teacher. Questions were posed by
students and by the teacher that not only addressed the idea of slope, but also picked up on incidental
opportunities (for example, ‘why can’t we simplify 2/5?’). In a year 9 classroom, data about the students were
used to develop a stem and leaf plot, from which the mean, median and mode were calculated. The lesson
concluded with an interactive discussion and explanation of the comparison between different data
representations histogram, box and whisker plot, frequency table, stem and leaf plot—using aggregated data
from the whole year 9 cohort (heights, and so on) on a laptop linked to a display screen. Individual students
are tracked using a Learning Management System. The Learning Support Team monitors progress and
develops individual plans as needed. There is a clear and unambiguous focus on catering for the needs of each
individual student and providing opportunities for each person to ‘be the best that they can be’.
Faculty meetings are seen as very important, as they provide a forum for professional learning, collaborative
planning across cohorts, and moderation and cross marking of student work. Considerable effort has been put
into building staff expertise through a ‘show and tell’ process. Teachers will ‘bring maybe a game that they
play so we’ll play it as a staff and then everyone can take that game away or they can say, ‘no it’s not for me or
my class’. It works really well’. Within the inquiry approach, explicit teaching is used when content is newly
introduced or as needed during the course of an inquiry.
Overall, professional learning was seen as important but tended to focus on opportunities within the
school, rather than external provision. Some teachers did attend sessions with different providers
and generally shared what they had learned with their colleagues at school. Teachers also
mentioned attending local mathematics conferences, but it was not clear whether they considered
these as structured professional learning.
When asked about specific opportunities for professional learning, the major theme was that of in-
house groups, with a focus on internal mentoring and ongoing professional conversations
(49/25, 94%). Sometimes a school (38/52, 73%) would have sessions with an external provider,
usually an individual consultant. These sessions were tailored to individual schools’ identified needs.
These sessions were not always related to mathematics and tended to have a local focus, depending
on the provider available. In some instances, professional learning had a focus on a particular
program. Visible Learning (http://visiblelearningplus.com/) based on Hattie’s (2009) work was a
84
priority in three case study schools. Programs for the younger years of schooling, such as Count Me
In and First Steps, were also mentioned.
Some schools appeared to use several external providers, whereas others relied on internal staff
leading professional development, or encouraged staff to attend professional development
opportunities (Professional learning) such as local mathematics association conferences or
professional development (professional learning) sessions run by local associations. Sometimes a
school identified a particular need, such as using graphing calculators, and arranged for sessions
addressing this. Teachers also drew on their previous experiences to contribute to school-based
professional learning. Teachers who had come from New Zealand, for example, mentioned
numeracy projects from that country. Others talked about IB programs and approaches.
When teachers were asked about their professional learning, no individual standout program,
provider or theme emerged, apart from the school based focus. Nor was there any particular
mathematical topic or approach, although aspects of using data to understand the school’s and
individual students’ progress were mentioned fairly frequently (45/52, 87%). Case study schools
appeared to make use of available professional development sessions, as needed or as identified by
the school. The standout feature was the focus on teaching and learning of mathematics by small
groups of teachers, supported by decisions made by school leaders about resource use.
In some schools however, there were comments that where a system provided support personnel,
such as coaches or curriculum support officers, these were not available for a sufficiently long period
to make a lasting change in teachers’ practice. Principals and teachers in the case study schools all
recognised the value of ongoing professional learning, although they also acknowledged the limited
resources that systems had available, and the difficult decisions that had to be made about access to
support. This unavoidable tension was addressed in case study schools by in house provision.
Data from the National Teaching Workforce Dataset (NTWD), data analysis report 2014 (Willett,
Segal, & Walford, 2014) suggest that the focus of the professional development undertaken by
teachers in case study schools was similar to that undertaken nationally. For example, there was a
strong focus in the NTWD of, ‘learning how to evaluate and improve my own teaching’ with around
60% of all teachers indicating some professional development in this area. Professional development
communities in the case study schools also directly addressed these issues. Case study schools in this
study may be more deliberately focussing on numeracy than was observed in the NTWD, where
about half of all primary teachers, and one-third of secondary teachers were reported as engaging in
‘developing strategies for teaching numeracy’. In contrast, a majority of case study primary schools
(19/22, 86%) reported a professional learning focus on numeracy. In secondary and combined
schools the school level focus was more general, although teachers within mathematics faculties in
large schools did engage in mathematical professional development activities, including in one
school solving mathematics problems collegially in the mathematics staffroom during recess or
lunch.
These finding were confirmed by discussion with members of the Towards Educating Mathematics
Professionals Encompassing Science and Technology (TEMPEST) project team. As part of the project
they surveyed teachers about professional learning. As in this project, there was a wide range of
professional development undertaken but no clear themes emerged. TEMPEST respondents
indicated that schools made use of state-based programs delivered by systems by sending one or
two teachers to these when the school deemed this was an appropriate use of resources, but this
approach was not universal.
85
6.2.4 Use of data and collaborative planning
One standout feature identified in the case studies was the ongoing and purposeful use of data
(45/52, 87%). A range of data sources were used extensively to diagnose issues with programs,
classes and individuals. Action was then taken to address the identified challenges, and this action
was broader than simply fixing up the program in a NAPLAN year group (year 3, 5, 7 and 9). It usually
involved the whole school, or specific year groups.
A variety of approaches to using data was identified in case study schools (see examples in school
vignettes 1, 3, 6, 8 and 9), including whole school planning, grouping students for learning, and goal
setting. School Vignette 8 describes one school’s approach in the early years of schooling, well
before NAPLAN testing.
6.2.4.1 School vignette 8: government K–10 school in Western Australia
Key themes: backwards mapping; using data to diagnose program weaknesses; and collaborative
programming to develop strengths K–3.
The ‘backwards mapping’ process starts in year 2, where the teacher ‘backwards maps’ from the year 3 data,
then blends that with entry data from year 1, and therefore has data coming in from both the year level above
and below. NAPLAN data is used to identify concepts that the year 3 students lacked so that the teacher of the
in-coming year 2 children will cover those areas. At the end of the year, the current year 2 students are given
the year 3 test and are then tracked to see how they achieved, on the basis of where the school would expect
them to be placed on NAPLAN. This tracking is done to ensure that the target groups were sufficiently well
identified and also to detect children about whom there were high expectations, but who didn’t achieve in line
with those expectations. The school uses a case management approach to ensure that every student is catered
for appropriately: ‘we have an interest in NAPLAN for the entire year assessment and we also have our case
management groups in our off years as well, so we have them all the way down to Kindy now where we use
on-entry testing’.
In addition to identifying students’ needs, NAPLAN data were also used to inform programming.
School vignette 9 is one example of addressing a program issue through a whole school commitment
to action.
6.2.4.2 School vignette 9: government primary school in Western Australia
Key themes: collaborative planning; whole school program; resource use; and use of NAPLAN data.
Several years ago, the staff identified through NAPLAN that algebra and algebraic thinking was an area of
weakness and resolved that it was all based on the notion of pattern. Rather than patching up the issue by
teaching fragmented splinter skills in year 5, the school took a more encompassing approach and determined
that patterns and algebra needed to be an explicit focus of teaching from the Foundation year upwards. The
teachers collegially and collaboratively planned a new school scope and sequence for patterns and algebra. As
a group they decided to do intensive and explicit work on patterns from year K to 6. Targeted resources and
manipulatives were identified and purchased and included work cards, pattern cards, sets of manipulatives,
including sets of different sized and coloured teddies, counters, tiles, shapes and so on. The resources were
based in the K and prep rooms initially and teachers of other year levels were able to borrow them as needed.
The resources have been very widely used since they were purchased. All the teachers made a commitment to
the new program.

86
In addition to NAPLAN data, teachers in case study schools used a variety of data sources, including
teacher developed assessments, common tasks, and other forms of testing such as the Progressive
Achievement Test - Mathematics (PAT-M) available from the Australian Council of Educational
Research. These were used to identify the needs of particular students—not just remedial needs but
also extension needs.
Students were regrouped frequently in different ways to address specific requirements for learning.
At times the students were clustered in friendship groups, sometimes in like ability groups,
sometimes for behaviour management reasons. The groupings varied according to the topic, the
class, the school organisation, and teacher availability.
In schools that reported some form of grouping for learning (47/52), one feature of the grouping and
regrouping (flexible grouping (FG): 19/46, 40%, mixed ability classes (MA): 18/46, 38%; mixture of
both FG and MA: 10/46, 21%) was that the students were not locked into a level or grouping. Groups
were not characterised as high or low achieving so that students’ self-perceptions were about
learning and succeeding in mathematics.
Where assessment was used prior to teaching, it was used effectively. Students did not repeat
material they already understood. The aim of the data use at the student level was to find the critical
point where students would make maximum gains by focussed and targeted teaching. Schools
recognised that to use data effectively in these ways, teachers required ongoing professional
development and conversations. Time was spent on discussing students’ work samples and
developing moderation tasks to support teachers’ decisions, and further develop their mathematical
knowledge for teaching.
These strategies were made explicit to students and the school community. In this way there was
little stigma attached to being in a particular grouping—it was understood the regrouping was
purposeful and about learning. Judgements were objective, based on data, and not fixed for the
whole term or year. Students understood this aim, as exemplified by the following quote from a
primary student. When asked what happens if they got the pre-test ‘right’ one student replied: ‘Oh
then she says you might be a good person to teach other people, so if someone gets half of them
wrong, she might bring them down the back with her and get them to work with her. Then someone
gets 75% wrong then she’ll bring them over to the Educational Assistant (EA) (Year 5 student,
provincial primary school)’.

87
6.2.5 Attitudes to NAPLAN
NAPLAN testing was deliberately under-played in the case study schools (45/52, 87%). There was no
‘teaching to the test’ preparation for NAPLAN was restricted to familiarisation with the format in the
week or so leading up to the NAPLAN date. In secondary schools even this low level of preparation
was not undertaken everywhere, and NAPLAN seemed to be ‘just another activity’ as indicated in
this typical quote:
We had a meeting a few years ago about NAPLAN and decided not to get too
paranoid about it … we looked at the structure … and we made sure kids were
exposed to those sorts of things but we weren’t over paranoid about it so we only
give kids in the week leading up to NAPLAN a previous year’s NAPLAN to
familiarise them with the structure.
Head of secondary mathematics, Independent Pre-foundation to year 12 school
Despite this low-key approach, there were comments from around the country that the media
attention and parent pressure about NAPLAN was not helpful. Some schools described how they
deliberately tried to ‘protect’ the students from the emotional turmoil, by advising parents not to
purchase practice materials, and not to over emphasise the importance of NAPLAN to their children.
Some students, however, described how they felt about the testing process:
It is like you are on a giant roller coaster–your stomach is all twisted.
Year 5 student, metro primary school
When it is finished, it is like a big weight has been lifted off your shoulders.
Year 5 student, metro primary school
My Mum is like really enthusiastic and she like wants me to get the stuff and like
get good marks and she gets me these NAPLAN books and you do them and it like
gets you up to the actual NAPLAN.
Year 5 student, provincial combined school
These quotes all came from students in different case study schools. Several students from these
schools also commented that their teachers helped them to relax. The negative effects of NAPLAN
seemed to be greater in primary school students and among primary teachers.
Case study schools did, however, realise that NAPLAN data were helpful. They made good use of the
data for considering their whole school programs and to refine their understanding of the students.
This dual recognition of the positive and negative aspects of NAPLAN was also identified in the
surveys.

88
6.2.6 Programs and resources used in teaching
Case study schools used a variety of programs, materials and resources to teach mathematics.
Concrete materials, such as counters, blocks, Multibase Arithmetic Blocks (MAB), trundle wheels and
so on, were available in all schools. Teachers sometimes came to interviews with a collection of
resources that they used, but these were idiosyncratic and particular to the individual, and no single
program or resource stood out. Where textbooks were used these seemed to come from all the
major publishers, and again there was no standout popular text.
A summary of resources mentioned by use in successful schools is provided in Table 6.2:4. These
findings were taken from both surveys and case studies. No counts are provided for these resources
because some schools provided explicit examples of several different resources whereas others
simply stated that they had a roomful of mathematics resources without specifying these, or
mentioned general resources, such as ‘websites’.
Table 6.2:4 Resources used in successful schools based on survey responses and case study
observations
Resource use Texts Online resources
Concrete materials
Learning management systems (LMS)
Other
Teaching activities
nrich, Scootle, Illuminations
Variety Maths 300; Origo
Student practice and revision
All major publishers Khan Academy
Mathletics, Studyladder, Maths Tracker, My Maths Online
Professional development
CAS calculators Origo, various consultants, IB training
Planning and programming
AC-M (state versions)
Scootle Origo
Assessment Standards in AC-M (state versions)
Some parts of the LMS programs, Improve
PAT Maths, Tests in texts
Other School farm, local resources
www.amaths dictionaryfor kids.com
N.B. Respondents could mention more than one resource, and some schools used many different resources whereas
others did not respond. Hence no frequencies are provided.
Appendix C2 provides a count of resources used in successful schools based on both survey and case
study data. It should be noted that this list may not be comprehensive because teachers and leaders
in schools visited in case studies sometimes talked about a ‘resource room’ or indicated that they
used a variety of materials, programs and resources without specifying anything in particular.

89
6.2.7 Assessment and reporting
Despite systems’ efforts to provide advice and exemplars of reporting, teachers, as shown by the
survey results (Chapter 5), appeared to be making relatively generous judgements of the standard
that students were reaching. In particular, they appeared reluctant to use ratings of D and E that are
associated with failure. This was reinforced by discussion with teachers in case study schools. Only in
competitive, high ICSEA schools was there little interest in the form of reporting.
When asked about the reporting standards, a number of teachers criticised the approach. There was
a feeling that because the standard changed each year as students moved through school, students
who were making good progress in developing mathematical understanding were never able to
demonstrate that progress. One teacher described a student in his year 10 class who frequently
missed school as saying, ‘why should I come to school? I’ve been at school for 10 years and I’m still
a D’.
The A to E reporting specifically expects comparison with a student’s peer group and is therefore
performance focussed. It does not allow for growth because as weak students improve, so do all
others in their peer group. As such, this approach does not encourage mastery learning.
6.3 Approaches to teaching
Approaches to teaching varied in the case study schools, from teacher directed traditional, textbook
focussed lessons to practical, contextually based approaches, regardless of whether the school was
primary or secondary. The school context appeared to make a difference. More traditional lessons
seemed to be observed in high ICSEA schools; whereas in low ICSEA schools the approach seemed to
be more hands-on. In all schools observed, the teachers understood the mathematics involved, and
understood their students, and catered for them accordingly.
6.3.1 Explicit teaching
Explicit teaching is an approach to teaching which has a focus on curriculum content, including
having clear goals for every lesson, making connections within and between concepts and
monitoring student progress. Explicit teaching can occur with whole class, small groups or individuals
as the teacher changes the approach in response to students’ feedback. Although many of the
observed lessons in this study were teacher directed, students were actively involved in determining
the lesson direction. In many observed classes students were encouraged to attempt problems that
would challenge them. Teachers were responsive to student questions, and often used these to
make a more general point to the whole class. Teachers were excited by the mathematical ideas and
how their students responded to these. One Principal commented, ‘children should be driving the
class agenda at all times’.
School vignette 10 provides one example of explicit teaching that is nevertheless student focussed.
90
6.3.1.1 School vignette 10: Independent secondary school in the Australian Capital Territory
Key themes: choosing a good problem; and involving students in solutions.
In one lesson, students were revising integration by substitution. A student asked for a particular example
from the text to be explained. It was obvious from the body language that the teacher immediately recognised
this as a potentially rich example that would bring out a number of points. Through careful questioning of the
students she established that none of them had thought to draw a sketch. The teacher suggested this would
be useful, and while they were sketching the curve, prepared a display using Geogebra. She did not
immediately share this with the students, but projected the axes on the smartboard.
One student then volunteered to draw the sketch, and the teacher compared this sketch with the one she had
drawn on Geogebra. The point was then able to be made, again through some questioning, that finding the
area under a curve was not always identical to finding the integral, and that a sketch would help them decide.
Teachers demonstrated deep understanding of their pedagogical approaches, and shared these with
the students where appropriate, for example, ‘When teaching I will say to a student, ‘I am giving you
wait time here’’. Another example of explicit teaching focussed on understanding came from
discussion with the school mathematics leader in a Queensland independent school. It is shown in
school vignette 11. This teacher had a deep understanding of the importance of making connections
within mathematics and deliberately made these explicit.
6.3.1.2 School vignette 11: Independent secondary school in Queensland
Key themes: teaching for understanding; and mathematical connections.
The head of mathematics has a pedagogical view that learning is about understanding, and this is more
important that memorising or recalling. So while note taking through direct instruction may be useful, if the
students understand something, that’s more important than them taking notes ‘understanding will stick with
you rather than memorising’. His view was that 'little learning occurs when teachers fill the board with notes
and expect students to copy it down’.
The preferred method of instruction by this teacher is to unpack questions as a class, through questioning and
examples, and develop understanding while pointing out the intricacies in solutions. He aims to flag where silly
mistakes are made in procedural situations, before mistakes are made. In addition, he recognises the necessity
of building connections across mathematical concepts. This personal view is not imposed on the other
teachers within the department, as there is recognition that both teaching and learning styles are very
individual.
In a large majority of case study schools (45/52, 87%) there was a focus on developing understanding
in the mathematics classroom rather than on simply developing procedural fluency. This is in line
with findings from the surveys (Chapter 5) where students from successful schools indicated that
their teachers developed a mastery oriented classroom.

91
6.3.2 Supporting students’ mathematical thinking
Students in case study schools were encouraged to take risks and ‘have a go’ but were also provided
with strategies for when they had difficulties. Students were able to describe these strategies. When
asked what they did when they got stuck on a mathematics problem some typical responses were:
We don’t ask for help. We find it out for ourselves using different stuff like we
have a lot of maths charts in our room and maths dictionaries and she tells us to
look at these before we ask her.
Primary student, Low ICSEA F-12 School
I discuss with someone who is also stuck because they might have a bit which I
was missing and then we work it out together.
Primary student, High ICSEA Primary School
Many teachers were explicit about developing independence and confidence in their students so
that the students knew that they could do mathematics.
The notion of taking risks in the mathematics classroom and learning from mistakes was identified in
87% (45/52) of case study schools. Repeatedly, students in case study schools stated their teachers
didn’t tell them what to do but asked them questions, suggested where they might source
information, or provided a specific strategy such as ‘reread the problem’. This approach is
exemplified in school vignette 12. This school was the only secondary school that explicitly used
cross-curriculum integrated approaches.
Across the case study schools there was a lack of genuine mathematical inquiry observed or
mentioned. Only 21/52 (40%) of case study schools indicated that they used mathematical inquiry or
mathematical investigations where students were presented with challenging mathematical
situations to which they had to formulate a solution. Schools using the IB curriculum were more
likely to implement inquiry approaches.
6.3.2.1 School vignette 12: Catholic year 7 to 10 school in Western Australia.
Key themes: classroom risk taking; using different teaching approaches; and cross-curriculum
integration.
The school vision is based on a tradition of academic rigour and excellence for all, which aligns well with the
strong pastoral focus of the school. Parents seek out the school because of its well rounded approach that
includes music, sport and academic studies. The school also caters for a group of special needs students.
Classrooms are places where students feel safe to take risks. One teacher talked about an explicit focus on
growth mindsets, and that mistakes are part of learning. Additional help is provided at lunchtime for any
student who comes along to ask for support. These comments were borne out by students with one
commenting, ‘always just really positive in class, and he’s always just saying like I want to help you, like I don’t
want you to necessarily get A’s, I just want you to understand it. [He] doesn’t care if we get it wrong as long as
we understand the process and just keep trying. There’s less pressure because if you have that constant
pressure of wanting to get things right over and over again it’s just gonna [sic] make yourself stumble and get
things wrong’.

92
The school intentionally aims to use a range of approaches and resources when teaching mathematics. Scootle
and other online sites are used which are often suggested by students. Textbooks are available but their use
depends on individual teachers. Overall, the philosophy is to use a variety of methods.
Cross-curriculum integration of mathematics is encouraged across the school, with some evidence that it is
occurring in the senior years as well as in the middle school. The cross-curriculum approach is managed more
easily in middle school where teachers have the same students for more than one subject. There are also
conversations with different learning area coordinators as the students go into higher year levels, to determine
where and how they can support one another. For example, teachers in the legal studies program might ask
‘How do we support students in our mathematics program?’, and look for teachable moments in the same way
as literacy is supported in mathematics. The cross-curriculum approach is increasingly being used in senior
classes.
In some case study schools (6/52, 12%) there was an agreed set lesson structure. This structure often
took the form of a ‘whole part-whole’ lesson, in which the whole class was presented with some
engaging starter, followed by a segment when students worked individually or in small groups on a
given task, coming back together for a final summary and reflection. In the other case study schools,
although the lesson structure was not formally agreed, teachers and students could describe a
‘typical’ lesson, which was similar to the agreed approach. Students knew what to expect in the
classroom.
For example, this description was taken from the case study report from a low ICSEA, provincial
primary school:
Students are given a topic and a learning goal that everyone is expected to meet,
they can make their own learning goal, answer questions: what we know, what
we want to know, what we learnt, and provide proof of what they learnt. At the
end of the week students write a reflection and at the end of the lesson they have
a technique for showing the teacher how they are going by using number of
fingers to indicate understanding of topic. Each lesson usually has a session
where they learn the new work, then group rotations of activities.
An example of the use of a lesson structure is provided in school vignette 13.
6.3.2.2 School vignette 13: government primary school in Victoria
Key themes: lesson structure; and learning intentions.
All levels have a 12 month scope and sequence for mathematics, which was designed using the Australian
Curriculum. Teachers then plan their lessons using this document.
The classroom teachers provide learning that caters for the needs of the different student levels within all
classrooms. The school does not stream. The principal encourages the lesson structure of starting together,
and then declaring of the learning intention and success criteria. The students might work on independent
tasks while the teacher has a focus group. Students are brought together at the end of the lesson to reflect on
their learning. For example, the year 1 and 2 lessons start with a mathematics fluency number activity before
every lesson. The prep students focus on kinaesthetic learning that includes touching and hands on
experiences. The upper levels also use materials and resources during many of their lessons.

93
Discussion was an important lesson component. Mathematical language was used accurately and
consistently across the schools—in some schools there were deliberate practices around the ways in
which language was used so that the words that students met as they moved through the school did
not change. Questioning was used effectively:
If you can really fine tune questioning, you are making them think anyway.
Teacher, high ICSEA Primary School
In most classrooms (45/52, 87%) there was a focus on understanding, rather than replicating,
procedures. One teacher explained that students who were good at mathematics:
... are kids who are not just able to solve a question but to be able to talk and
reason a solution to you; to represent in different ways
Curriculum leader, high ICSEA Primary School
A similar comment was made by another teacher who stated that a good student:
(i) was good at unpacking questions;
(ii) could order their information; and
(iii) and could undertake critical thinking by examining the question from
different aspects.
Primary teacher, high ICSEA primary school
Students recognised teachers wanted more than right answers:
[He] doesn’t care if we get it wrong as long as we understand the process and just
keep trying.
Secondary school student, average ICSEA secondary school
Teachers also recognised that developing understanding took longer for some students than others,
and that it was sometimes counterproductive to try to do everything at once. School Vignette 14
describes an approach to classroom organisation that ensures that all students have dedicated time
in small groups with the teacher, during which they are taught at their own level.
6.3.2.3 School vignette 14: government primary school in the Northern Territory
Key themes: lesson structure; classroom talk; focus on strategies; and small group work.
Classes are not streamed. Mathematics is taught in a dedicated one hour lesson every day. In each class the
lessons start as a whole group with the teacher. They then break into ability groups. Each group has
appropriate activities to do while the teacher explicitly teaches one group at their level. During the teaching
episodes there is a focus on and discussion about what strategies the students will use and which one would
be the most efficient to be able to solve the problem. Students will talk about why they chose their strategy
and they may present their approach to the class. Since taking this approach, children are talking amongst
themselves more and the teacher has become more of a facilitator. The groups rotate and a different group
works with the teacher. Some classes do two rotations per hour and some three, but over the week they
would all rotate through the groups a number of times and all students have dedicated small group time with
the teacher.
94
The school uses the New Zealand developed NumPA one-to-one test/interview to establish a database of
children’s understanding (see www.nzmaths.co.nz/plan/slb09/numpa). This test is used once a year with
children along with a range of more regular specific topic tests. Learning targets are set for each child and
these are communicated to the children and their parents to ensure that there is transparency.
The theme of teaching for understanding was universal across all of the schools visited. The stated
aim of one teacher was to challenge students to ‘build upon and apply knowledge to a variety of
situations, not just tick a box’. Similar statements were made frequently, and opportunities were
reated to draw on student’s experiences through discussion. One teacher described a Year 1 student
in her class demonstrating deep understanding:
One little girl said something like ‘I know recess is at 11 o’clock. I know it’s 10:30
now. I think recess is in half an hour.’ So I felt she had a great understanding.
Early childhood teacher, low ICSEA, F-10 school.
In the case study schools, 87% (45/52) had a focus on classrooms that encouraged questioning and
development of understanding through student talk. One principal stated that children best learn
through:
… a lot of discussion … children being able to work independently and teachers in
there with them, doing it with them, rather than setting them work and standing
back.
Principal, low ICSEA, provincial primary school
In another school a teacher commented:
It’s about establishing a rapport with them so they’re not worried about getting it
wrong … having children explain how they got there helps to develop their higher
order thinking [as an assessment tool] … it’s a lot more effective than pen and
paper.
Year 7 teacher, average ICSEA, F-12 school
Among the case study schools, however, there was some imbalance across the curriculum content.
Of the 46 lessons where there was explicit mention of the lesson content in the Case Study reports,
61% (28/46) had a focus on the Number and Algebra strand, 28% (13/46) addressed Measurement
and Geometry, and 11% (5/46) had a focus on Statistics and Probability. These proportions may be
appropriate but are open to discussion. The study took place towards the end of the school year and
there is anecdotal evidence that many schools leave teaching geometry and statistics until the final
weeks of the year, which is when this study took place. Had the study been conducted early in the
school year it is possible that even fewer lessons would have addressed geometry or statistics. The
issue of balance across the curriculum may need further exploration.
95
6.3.3 Differentiating teaching for learning
Over half of case study schools (29/52, 56%) reported using at least some flexible groupings to cater
for individual student’s needs. The flexibility was reported as being important, with opportunities for
students to move in or out of groups according to their needs. Some schools targeted groups based
not only on assessed mathematical ability but also on the contribution that each student could make
to the group, or ways of thinking mathematically. The groupings focussed on developing
mathematical thinking—the reasoning and understanding proficiencies of the AC-M; and
mathematical challenge—the problem-solving proficiency of the AC-M, rather than on improving
fluency in processes and procedures.
Students recognised they were not locked in to particular groupings, and appreciated there were
opportunities for both support when needed and for advancement. Some teachers indicated that
there were some students who felt safer in lower achieving groups and wanted to stay in these. The
teachers reported that part of their job was to develop the students’ confidence in mathematics.
One teacher stated that he thought that the problems with students taking lower levels of
mathematics was not with the material but ‘in their heads’ with the students’ beliefs about
mathematics and their capacity to do mathematics. He felt strongly that, although the school was a
case study school, and therefore performed well in NAPLAN, they should be doing more, and to
some extent the school was settling for mediocrity as it was not challenging the students’ beliefs.
Schools had a variety of ways of grouping students for learning mathematics. Although many
grouped on the basis of ability, in some schools social outcomes were the focus. School vignette 15
provides one example of grouping socially and the adaptations teachers made to accommodate
different groups of students.
6.3.3.1 School vignette 15: government primary school in the Northern Territory
Key themes: differentiated teaching; and grouping for learning; teacher enthusiasm.
The school has a high percentage of Indigenous students and students speaking English as a second or third
language (about 43% of the enrolment have these backgrounds). There is a fairly high turnover of students as
families move in and out of the district. The school has worked with Tyson Yunkaporta to incorporate the
8 Aboriginal Ways of Learning (http://8ways.wikispaces.com/), and also draws on Tribes Learning Community
(www.tribes.com) and Mind Matters (www.mindmatters.edu.au). A year 5/6 teacher said ‘the main priority as
a teacher is to have the children gain a thirst for learning, which first starts off with relationships and
values …Trust is the first step of building that and once we have that, to help the children take risks … Once
I’ve got them with a thirst for learning, it is easy to teach them … however they need to want and be ready to
learn otherwise they can just put blockers on.
Students are grouped for learning socially rather than by ability, but in practice this approach means that high
achieving students usually end up in the same group; and the same with low achievers. Teaching is focussed on
catering for students’ needs and one teacher described how she had to change her approach with different
groups. Her current class is mainly disengaged boys ‘This class this year is nearly all hands on manipulatives,
and a lot of competition. They learn best from working in groups, talking about an answer, not being put on
the spot for answers, and using hands-on and competition in lessons’. Her previous class had been the high
achieving group and she felt their learning was more about extension and rich tasks where they could work
more independently, and that this did not always need teacher assistance. The school draws on many different
resources to cater for students’ learning needs. In the early years they use Count Me In Too
(http://www.schools.nsw.edu.au/learning/k_6/maths/prosupport.php) and all new teachers are trained in this

96
program. For selected students (only in Year 5 and 6) QuickSmart
(https://simerr.une.edu.au/quicksmart/pages/qsmathematics-intervention.php) is used as an intervention.
Other resources mentioned included Peter Sullivan’s Open-Ended Maths Activities (Sullivan & Lilburn, 2004),
NZ Maths (https://nzmaths.co.nz/), and Maths 300 (http://www.maths300.com/).
The school has adopted a consistent method for teaching mathematics to provide continuity for students. This
approach involves a clear teaching cycle based on ‘switching on’, review, explicit teaching, practice,
consolidating games, and check-in and reflection. Lessons usually follow this sequence. Teachers plan lessons
to use technology, manipulatives and group work so students enjoy learning and it is relevant. There is no
room for chalk and talk type lessons in the school.
The students in the focus groups universally stated that they enjoyed mathematics with one year 5 student
saying, ‘when I walk into my maths class, I see lots of happy people’. They enjoyed the challenge of
mathematics but also described how their teachers supported their learning, ‘she wouldn’t think you’re bad,
she’d think you’ll need a little bit more help. She’ll look in your book and she’ll find like the pros and cons and
she’ll normally just focus on the pros … she won’t really bother about the cons ... until like find out if you need
help with them. If half the class are struggling with that thing she’ll make a new lesson out of that’. Their
teachers were described as enjoying teaching mathematics, ‘yeah, when she’s teaching something she’s
always excited and quite enthusiastic … it helps us learn because she keeps us happy and she always has a
smile on her face so we can learn’.
A different approach to differentiating learning was taken by the school showcased in school
vignette 16. This was a small rural school, which had limited easy access to additional personnel, in
terms of relief teachers or additional staffing. The school provided for students’ needs by using a
variety of approaches, including learning contracts and inquiry tasks.
6.3.3.2 School vignette 16: government K–10 school in Tasmania.
Key themes: independent learning contracts; problem solving; and inquiry teaching.
The school is situated in a rural area. It is small, and as a result secondary school students (Years 7 to 10) are
sometimes grouped into classes across multiple year levels. Teachers teach across the school—the numeracy
coordinator teaches a Year 5 and a Year 9 mathematics class. The science teacher, who has a physics
background, teaches Year 10 mathematics. One teacher, who retrained as a technical studies teacher from a
trades background, has completed a further retraining program to gain a graduate certificate in mathematics
teaching for middle years mathematics classes.
The school aims to develop independent learners with a focus on problem solving. In the Year 7/8 class
observed, the students were following a ‘contract’ in which they had to complete negotiated tasks over one
week. These tasks included a Study Ladder (studyladder.com.au) task, some problem solving tasks, an
investigative task building on work from previous weeks (the 4 Fours puzzle extended to 5 Fives and 6 Sixes), a
practice worksheet, and a ‘brainteaser’ (for example, students were required to design the net of a cube with a
Christmas wish or drawing on each face, so that when the net is folded up to form the cube, every picture is up
the right way). Examples of students’ mathematics work were displayed around the room, including
photographs of models of their bodies. This was a mathematics inquiry task in which students were challenged
to make a scale model of their own body. During the lesson the teacher worked with small groups of students
on specific concepts to extend their understanding of algebra (substitution). The students appeared
comfortable with the autonomy they had, and worked in a focussed way on their contract tasks.
The numeracy coordinator was using Maths 300 (http://www.maths300.com/) resources, and used ‘Eric the
Sheep’ as a task for her Year 5 students. The students were obviously familiar with the kind of task, and

97
willingly used materials to explore the problem. Several began to predict the answers and were working on
developing a pattern. As in the older class, there was mathematics work displayed around the classroom.
When the students in the focus groups were asked about their mathematics lessons, they were all enthusiastic
about mathematics. They had good strategies for solving problems, and were explicit about these. One Year 3
student described how a visiting numeracy coach had taught the class, and had asked students to share their
thinking. The regular teacher had been watching and was now using some similar strategies. This student had
particularly enjoyed hearing about other students’ approaches and was pleased this idea was being continued.
All of the teachers who were interviewed emphasised the idea of starting where students were confident and
building on from that point. They identified students’ progress using a variety of strategies including problem-
solving reports, short tests—mainly in upper primary and secondary school—and classroom observations.
Because of small numbers, grouping across year groups and classes was not possible, but it was evident that
grouping did occur within class groups.
6.3.4 Supporting teachers
Some schools had access to a numeracy coach, or had designated a staff position to the role. In one
school the coach had been working exclusively within the school for four years. School vignette 17
describes the work of the numeracy coach in one primary school.
6.3.4.1 School vignette 17: government primary school in the Northern Territory
Key themes: whole school focus; changing teaching approaches; and community involvement.
The numeracy coach has been at the school for four years, during which time the NAPLAN results have
improved. Both the Principal and numeracy coach have strong mathematics backgrounds; the principal in First
Steps in Mathematics (http://det.wa.edu.au/stepsresources/detcms/navigation/first-steps-mathematics/) and
the numeracy coach in New Zealand Maths (www.nzmaths.co.nz), both of which have similar philosophies.
Initially, they had found a lot of worksheet use, a lot of children doing algorithms and a lot of children working
at the same level. They tried to change the approach without having a coach but recognised that change would
not come about ‘unless we absolutely changed the teaching style and teach the teachers’. They commented
how they wanted to change the student’s beliefs about mathematics. When the students were asked if they
liked mathematics three years ago they said ‘No’, so they needed to get children enjoying mathematics,
believing in themselves and being confident that they can do mathematics. Students had stated that they
didn’t like mathematics because they couldn’t do it. The Principal felt the reason they couldn’t do it was
because there were a lot of gaps, there was no assessment of children to find out where they were at in order
to make teaching decisions, and the students were learning by rote more than by understanding.
A whole-school approach to mathematics was identified as a need and the numeracy coach introduced the
numeracy project, a NZ developed program of professional development (www.nzmaths.co.nz). ‘It was a
professional development for teachers to increase student learning … It raises the students’ learning by
developing the teachers’. The numeracy coach also initiated a maths day, which was originally designed to
bring parents into the school to familiarise them with mathematics and to let them experience how it could be
fun. During the event, they experienced mathematics activity rotations, mathematics trails, relay races and
number lines of the relay. Over the years, this event has developed and now each teacher organises an activity
whereas when it started the numeracy coach initiated most of the activities.
This concept has infiltrated through to all areas of the curriculum, and the school now also runs a science day
and a literacy day.

98
The key focus of the school is on students gaining an understanding about what they are learning, as well as
being challenged by mathematics and ‘doing a problem-solving approach’. Mathematics strategies are
deliberately and explicitly discussed and students decide which strategies they are going to use. This approach
has put control into the hands of students, and they are now having ‘a lot more conversations in mathematics’.
Whether there was a coach or not, every case study school (52/52, 100%) had a numeracy leader
who had input at the school policy making level, and who had carriage of improving the school’s
mathematics program and outcomes.
6.4 Students’ thinking about mathematics in their schools
Where students were interviewed in the case study school focus groups, nearly all of them (33/40,
83%) reported that they liked mathematics. In the seven schools where students were not explicit
about liking mathematics, it was more that they were equivocal—they enjoyed some aspects of
mathematics, but did not like others. In particular students enjoyed the challenge of mathematics:
I like complicated stuff to stretch my brain a bit.
Primary school student, high ICSEA School
I do love maths quite a lot because I have improved in it since I came here in year
4. One reason I love it is because it’s fun. It just depends on how you look at it.
Secondary school student, high ICSEA F–12 School
My brain works well in maths.
Secondary school student, low ICSEA F–10 school
It shows that you can work things out.
Secondary school student, low ICSEA F–10 school
The students in case study school focus groups varied in their approach when presented with a non-
routine problem by the project team—for example, how many squares on a chessboard? This
problem was chosen by the project team because although not difficult in itself, there are many
ways of approaching the problem, so that it is accessible to primary and secondary school students.
Students’ responses to the chessboard task varied based on their school. All students appeared to be
happy to attempt the task, even when they said that they had not encountered a problem of this
type before, suggesting that they were confident to tackle new problems. It was clear some students
had been exposed to problem solving strategies, such as ‘make a list’, as these were called upon in
planning an approach to solving the chessboard task. Some students simply took the task at face
value and said ’64 squares’ and even when prompted could not go forward, indicating a fairly fixed
view of mathematics. Some began to see that they could count 2 x 2, 3 x 3 and so on, but then
disengaged as it seemed like too much work, suggesting that they had had limited exposure to
extended problems. Others were keen to finish the task and, where time constraints prevented
them from finishing the task, took it back to class.

99
The different reactions by students to the chessboard task indicate a variety of approaches to
mathematics in classrooms. In particular, the idea that mathematics problems have to be solved
quickly is a limiting one. It appears that even in schools that are successful in improving mathematics
performance based on NAPLAN, not all of the students are being exposed to extended open-ended
tasks or inquiry and problem-solving approaches.
In case study schools where the data were available, teacher enthusiasm was widely reported by
students in the focus groups (36/40, 90%) and sometimes by principals and teachers. Principals,
teachers and students all recognised enthusiasm for mathematics and its teaching was important.
100
7 7 Findings and conclusions
The first four sections of this chapter present findings informed by this study. The first section
(section 7.1) details three key findings for consideration that could make a lasting, system wide
difference. The next three sections (sections 7.2–7.4) provide additional findings at the system,
school and classroom levels.
No single case study school had every element of every relevant finding in place, but all were actively
working to cover key aspects of mathematics. Educators and policymakers should consider the
findings holistically, but acknowledge that school and classroom level practices need to be
contextualised.
7.1 Key findings
7.1.1 Key finding 1
Schools where mathematics leaders were involved in school policy development and supported by
senior leadership had teaching and learning cultures that improved student outcomes.
All case study schools had a leader of mathematics who had input into school policy decisions and
received support from senior leadership who understood and valued mathematics. This value was
reflected by the amount of formal in-school professional development (73% of case study schools)
and the prevalence of in-school professional development groups (94% of case study schools). It is
important that principals understand how they can build a culture that improves students’
mathematics outcomes (see section 6.2).
Next steps
There is currently a Principals as Literacy Leaders programme, which was developed in 2009, and has
been widely successful in different jurisdictions and education systems. A Principals as Leaders of
Mathematics program could follow a similar model. Western Australia piloted a Principals as
Numeracy Leaders project in 2012, and has received positive feedback.
7.1.2 Key finding 2
Data can be used to monitor and improve student outcomes and progress in mathematics. Sharing
best practice models for using data would benefit all schools.
In 87% of case study schools data were used to monitor student progress and change teaching
practices (see section 6.2.4). If data can be used to improve student outcomes, then teachers should
have access to best practice examples of how to analyse it, and how to use it. Examples are
important, because teachers might not have the statistical literacy to interpret relevant datasets
(see section 2.2.3.6). Additionally, a recent Grattan Institute report (Goss, Hunter, Romanes, &
Parsonage, 2015) suggested that many schools weren’t ‘collecting the right information at the right
time and using it effectively’ (see section 2.1). Desktop research indicated that there is little support
for teachers to develop skills in collecting and analysing mathematics data from the classroom,

101
drawing inferences from these data and developing effective teaching programs to develop
students’ mathematical proficiencies (see section 4.1.4).
Next steps
The Dimensions online portal for mathematics teachers, which is scheduled to go public in 2017, will
include evidence based resources and professional development programs. The portal is partly
funded by the Australian Government Department of Education, and led by the Australian
Association of Mathematics Teachers (AAMT). Resources for data-use could be developed as part of
Dimensions.
7.1.3 Key finding 3
Across jurisdictions there is duplication and inefficiencies in the development of resources to assist
teachers, with varying levels of quality and evaluation.
A 2015 report from the Australian Academy of Sciences (Stacey, Vincent, Stephens, & Holton, 2015)
highlighted that teachers lack the time and knowledge to find and evaluate resources; and that
planning a coherent program from the wide range of existing resources is difficult and time
consuming (see section 2.1). The desktop review revealed that there is duplication across
jurisdictions in the nature and type of resources that are developed for teachers. For example, New
South Wales has published a Numeracy Skills Framework, and Queensland is in the process of
developing something similar, drawing on the same research background to a large extent (see
section 4.1.2). Duplication is inefficient and avoidable, and points to a need for closer inter-
jurisdictional collaboration. While a number of resources were reportedly used in schools (see
section 6.2.6), neither the case studies, nor the surveys uncovered particular resources that were
associated with successful schools.
The quality of mathematics education research in Australia is recognised worldwide. Within the
nation, however, it appears to have limited influence on policy and practice. Where research and
resources have been developed within a particular state it appears to remain there, even when it is
disseminated across the nation. For example, New South Wales has a focus on Count Me In, Victoria
uses the Early Years Numeracy Project, and Western Australia has First Steps (see section 4.1.3).
Each of these projects and programs has a sound research basis and deserves to be disseminated
more generally.
It is important to acknowledge the rights of different states and systems to maintain their own
approaches and develop their own resources. However, fragmentation has limitations and means
that valuable resources may not be as well used as they might, considering the time, effort, and
money that has gone into their development. It would be sensible for education systems to share
ideas and resources, and clarify approaches, but this will require formal processes. A national plan
and communication between education systems could help to increase efficiency and deliver quality
information to teachers nationwide.
Next steps
Dissemination of mathematics teaching research, resources and programs could be built into
Dimensions (an online portal for mathematics teachers, which is scheduled to go public in 2017). A
national programme for communication between education systems could be implemented through

102
the Australian Government Department of Education and Training. These findings could be
implemented as a part of the National STEM School Education Strategy from the Education Council
(Education Council, 2015) which highlights ‘increasing teacher capacity and STEM teaching quality’ as
one of Australia’s five key areas for action (p. 6).
7.2 Key findings for systems-level policymakers
7.2.1 Key finding for policymakers 1
There is no nationally consistent approach to the implementation of the mathematics curriculum,
and the A to E reporting system often does not adequately support and reflect student learning.
The implementation of the Australian mathematics curriculum (AC-M) is inconsistent across
jurisdictions (see section 4.1). This is unlikely to change in the foreseeable future because of the
constitutional arrangements for education. In some systems, numeracy appears to have become a
de facto replacement for mathematics (see section 4.1). Although numeracy is a powerful and
important idea and support for numeracy should be continued, it should not replace mathematics.
Although further investigation is required, it is possible that curriculum delivery is unbalanced, with
61% of observed lessons focusing on the Number and Algebra strand of the curriculum (see section
6.3.2). Australia needs a strategic and focussed approach that takes a long-term view of the skills
that a well-rounded mathematics education provides. A starting point could be the Decadal Plan for
Mathematics (Australian Academy of Science, 2016).
The A to E reporting system—in use as a national requirement—has subtly different interpretations
in each jurisdiction. Additionally, there is some evidence that teachers appear reluctant to use the
full scale, especially the ‘failing’ grades (see sections 5.1.1.9 and 6.2.7). Some teachers from case
study schools suggested that the A to E reporting system does not support students’ mathematics
learning. In addition, several schools that used the International Baccalaureate curriculum indicated
that although they reported on an A to E scale, it did not fit with their philosophy and focus (see
school vignette 1 for an example).
As with curriculum implementation, it is important that the reporting system is designed to
maximise student benefit. To facilitate this, curriculum leaders and mathematics coordinators from
each education system should discuss the best approaches to deliver the AC-M.
7.2.2 Key finding for policymakers 2
Evidence-based professional development tailored to the teaching and pedagogy of mathematics
leads to better student outcomes.
Mathematics, as with other learning areas, has specific teaching and learning demands and these
should be acknowledged in programs designed to improve mathematics outcomes (see section
4.1.2). It should not be assumed that what works in, for example, literacy learning, will be equally
effective in mathematics learning. Research indicates that it is particularly important for teachers in
the lower secondary years to be able to access quality professional development in mathematics
because in these years students move into algebraic thinking that provides the foundation for later
mathematics learning (e.g., Siemon, Breed, & Virgona, 2010). Professional development programs

103
for these years of schooling should have a sound research base that promotes practices that can be
used in the context of secondary school classrooms (see sections 5.1.1.1 and 5.1.1.5).
Schools can use existing web based materials for example, the STEMCrAft Project (University of
Tasmania, 2015) to evaluate programs and resources. The TEMPEST (Towards Educating
Mathematics Professionals Encompassing Science and Technology) project (University of Tasmania,
2016) is also in the process of developing similar materials to evaluate professional learning, and
some of these materials will focus on school-based professional learning. These materials will be
made available through AAMT’s Dimensions portal.
Professional development packages should not only address teachers’ mathematical and
pedagogical content knowledge, but also their attitudes and beliefs. Teachers’ enthusiasm for
teaching mathematics emerged as a key factor in student engagement (see section 5.1.4). Teachers
who were enthusiastic about teaching mathematics were more likely to create mastery learning
environments where the focus was on developing understanding. Negative attitudes to mathematics
and its teaching must be addressed directly.
7.2.3 Key finding for policymakers 3
Teachers of upper primary and lower secondary years undertake the lowest levels of professional
development and may benefit from numeracy and/or mathematics coaches.
Many education systems employ numeracy/mathematics coaches. While these individuals usually
have some knowledge of general pedagogical approaches, they often don’t have specific expertise in
mathematics or numeracy (see section 4.1.2). Although numeracy and mathematics pedagogical
content knowledge is included in some coaches’ training programs, the time allocated is, of
necessity, limited. If a mathematics coach is knowledgeable, and spends sufficient time in a school,
the effects can be transformational (see school vignette 17 for an example).
Given the evidence that primary students are beginning to disconnect from mathematics as they
move through the school (see section 5.1.4.1), Australia needs solid approaches to teaching middle-
school mathematics that will engage students. It is important that students remain engaged as they
progress into senior school, however, year 9–10 appears to be the age bracket for which teachers
undertake the least amount of professional development (see section 5.1.1.5). Coaches with the
relevant mathematical and pedagogical content knowledge could provide useful support for
teachers in these classes, particularly those who lack relevant mathematical knowledge.
In addition to addressing mathematics specific pedagogical and content knowledge, programs for
coaches also need to consider attitudes and beliefs about mathematics, and ways in which these can
be addressed. The finding that teachers’ enthusiasm for teaching mathematics is a key factor has
implications for professional development programs (see section 5.1.4). Program leaders, such as
coaches, need this enthusiasm, as well as Principals and teachers.
This finding aligns with the National STEM School Education Strategy’s recommendation to ‘support
schools to access specialist teachers in mathematics, science and technology’ (Education Council,
2015).

104
7.3 Key findings for school leaders
7.3.1 Key finding for school leaders 1
Student outcomes were improved in schools with staff members who had responsibility for
mathematics and school level policy making input.
In every case study school, mathematics was led by a member of staff sufficiently senior to be able
to have input at the policy level of the school, and to advocate for mathematics (see section 6.2.1).
One or two good teachers were not what made the difference in case study schools. The culture was
created by quality leadership from the principal and numeracy or mathematics leaders who were
passionate about mathematics, and teaching mathematics well (see school vignette 17 for an
example). Policies and processes to support mathematics teaching were deliberately and carefully
built up in the school over time; for this to happen a senior staff member was needed. In a
secondary school this person was often an appropriately qualified head of mathematics; in primary
schools a curriculum leader or deputy principal took the role. The key aspect was the mathematics
leader’s focus on quality mathematics teaching, sharing good teaching practices in mathematics, and
what the school needed to do to support this development (see section 6.2.1). Without policy
influence in a school, it is difficult for a mathematics leader to successfully champion a positive,
school-wide mathematics teaching culture.
7.3.2 Key finding for school leaders 2
Schools with a culture of in-house, discipline specific professional development create collegial
and non-judgemental environments for both teachers and students.
Case study schools consistently had a culture of in-house professional development for their staff.
One avenue for staff development was through professional development communities or similar
teacher groups, which were observed in 94% of case study schools. Although some professional
development communities had a general focus on all subjects, mathematics was addressed explicitly
during sessions. The professional development groups held formal meetings, which were sometimes
led by numeracy coaches, mathematics leaders, or senior teachers. Formal, in-school professional
development for mathematics teachers was reported in 73% of case study schools. The requirement
for ongoing in-school professional development is supported by the literature (see section 2.2.2.6).
Discussion with 10 different professional development providers indicated that school based
professional development is common, so it may be happening in other schools, as well as successful
schools. According to the professional development providers, where external professional
development is accessed a typical arrangement is for one or two teachers to attend out-of-school
sessions and then share their experiences with all appropriate staff. Principals and professional
development providers indicated that this approach can work well, but only if there is sufficient time
allocated for the new ideas to be shared and developed. In successful schools, this time was available
through learning groups.
A standout feature of the case study schools was that professional development efforts were
genuine, and not tokenistic. Teachers worked hard at improving, and did so willingly and with
enjoyment. Processes were in place to support professional learning. For example, time was

105
allocated, sometimes through timetable arrangements or in staff meetings, with an expectation that
staff would engage in professional discourse. ‘Creating time for teachers to pursue effective
professional learning’ was a policy reform identified in a recent National Center on Education and
the Economy (NCEE) report (see section 2.2.1).
7.3.3 Key finding for school leaders 3
Targeted, data-driven approaches for planning and delivering mathematics learning and teaching
leads to improved student outcomes.
Data can effectively improve students’ achievement by helping to refine and target teaching
approaches (see section 2.2.3.6). The majority of case study schools (87%) used data to understand
the progress of individual students, classes or the school as a whole (see section 6.2.4). Different
schools used various datasets (e.g. NAPLAN, school-based assessments), for a range of purposes. For
example, some schools used NAPLAN data at the item level to identify commonly misunderstood
concepts within a cohort, while others used it to inform whole-of-school programming, or to set
goals.
Data can also be used to group and regroup students for learning. In case study schools, a majority
(56%) reported some use of flexible grouping based on both quantitative and qualitative data. These
data included formal assessment data such as PAT-M (ACER) and teacher assessments, as well as
teacher knowledge of the individual students. These groups aimed to identify the learning needs in
mathematics of every student, and to meet these needs (see sections 6.3.2 and 6.3.3).
This finding would be directly supported by and complementary to Key Finding 1. It is important that
data use isn’t a box ticking exercise: schools should use data strategically.
7.4 Key findings for classroom teachers of mathematics
7.4.1 Key finding for classroom teachers 1
Mathematics taught with enthusiasm, and classrooms focussed on the deep understanding of
mathematical concepts and ideas leads to increased student engagement.
For both older and younger students, teachers’ enthusiasm for teaching mathematics was associated
with a mastery environment, which focussed on developing students’ deep understanding of the
mathematical ideas, rather than on procedural fluency. For younger students, a mastery
environment was associated with students’ emotional, and cognitive interest (see section 5.1.4.1).
For older students, teacher enthusiasm for teaching mathematics was significantly correlated with
reduced costs on the student, including emotional and psychological costs (see section 5.1.2.3).
Latent class analysis revealed three subgroups of students within successful schools (engaged,
compliant, and disengaged). Engaged students were most likely to perceive a mastery environment
and high teacher enthusiasm. Disengaged students were least likely to perceive their classrooms as
mastery oriented (see section 5.1.4.2), and perceived less teacher enthusiasm. Students with a
compliant profile fell between these other two groups.

106
In addition, 87% of the case study schools had a focus on developing understanding in the
mathematics classroom rather than on simply developing procedural fluency (see section 6.3.1).
Furthermore, in 90% of schools where student focus groups were undertaken, students reported
that their teacher was enthusiastic about mathematics and its teaching.
7.4.2 Key finding for classroom teachers 2
Students develop better understanding when provided with the opportunity to talk about their
mathematics, and to articulate their mathematical thinking and solution strategies.
Students explaining their thinking is recognised as an important factor in mathematics learning, both
in the research literature (see section 2.2.1) and by teachers who participated in the survey and case
studies. Factor analysis of teachers’ perceptions of teaching approaches that led to both
mathematics engagement and mathematics achievement identified student talk as a key component
(see section 5.1.2.1) in both successful and other schools. Although there was no statistically
significant difference between the two groups of schools, students and teachers from case study
schools appreciated that by explaining mathematics to someone else and sharing other students’
approaches they developed better understanding of mathematics (section 6.3.2). A starting point
could be a short ‘plenary’ session at the end of every class in which students share what they have
learned during the lesson (see section 6.3 and associated school vignettes). Talking about
mathematics is one important step towards the ‘cognitive activation’ strategies described by
Schleicher (2016) as associated with success in mathematics.
7.5 Limitations of the study
The study was not designed as a ‘scientific’ study but rather aimed to provide rich information about
the practices in schools identified as being successful in mathematics. As such the study was limited
in several ways. Samples for both the surveys and the case studies were targeted rather than
random, and limited to those who were willing and available to participate. Case study research in
particular is not sample research but is designed to uncover detailed information about cases
identified using a specific set of criteria.
The survey and case study process took a cross-sectional approach at one point in time
(Term 4, 2015). There was no longitudinal tracking of schools across time, which might have
provided better information about how schools embed the processes they use into the school
culture. Future studies that tracked schools across a school year to identify practices and processes
over time would be useful.
Although some comparison schools participated in the survey, there were no comparison schools for
the case studies. As such, although every researcher involved could provide anecdotal information
about the practices in the case study schools, and had stories about schools that were both not
successful and using practices very different to those of the case study schools, there was no direct
evidence. Hence inferences are limited about causes of success.
The timing of the study (Term 4) was not conducive to schools’ participation. Teachers and students
are generally tired at this time, and looking towards the end of the school year. Further studies
should be organised so that data collection is undertaken in Term 1 as far as possible, or sometime
shortly after NAPLAN testing.

107
7.6 Suggestions for future work
The lack of genuine mathematical inquiry and investigations was surprising. Only 40% (21/52) of
case study schools emphasised inquiry in their classrooms (see Table 6.2:3). Developing conceptual
understanding of mathematics is important, but using this understanding creatively to investigate
mathematical and real world situations is critical for future development. Where mathematical
inquiry was observed, it was supported by clear and explicit strategies that students could use when
they had difficulties. There was a sense, however, that the practices in successful schools, although
of good quality, were to some extent self-limiting in that they tended to have a strong focus on
either curriculum achievement at very high levels, or encouraging students to enjoy and appreciate
mathematics, through the use of community links and practical activities. These differences are
explored in several of the vignettes in Chapter 6. The schools that had a focus on high curriculum
achievement might benefit from incorporating some of the inquiry approaches adopted by schools
that had a different set of values, including encouraging students to be independent learners who
value education. Similarly, many of those schools undertaking practical investigations might benefit
from the strong focus on pure mathematical ideas for their own sake observed in some successful
schools. Students deserve to experience both pure mathematics in all its beauty and elegance, and
the powerful uses of mathematics in modelling and solving real world problems.
Many students in the successful schools were compliant in mathematics classes, and were not
emotionally or cognitively engaged with mathematics. This finding indicates that even in successful
schools there is room for improvement. The identification of a group of students with a compliant
profile of engagement is new and potentially important. Programs designed for disengaged students
may not be suitable for compliant students, but if this group does not become emotionally and
cognitively engaged with mathematics then it seems unlikely that the trend away from higher levels
of mathematics will be reversed. A research agenda is needed to address this issue.
This study only considered schools deemed successful in NAPLAN, using the criterion of growth of
+ 1 SD above the average. A study examining the practices of schools that are well below the
average growth would provide a useful comparison. This study should be undertaken in a spirit of
improvement by both mapping the current practices in these schools, and then suggesting
potentially fruitful interventions.
A further suggestion for future work is to consider whether school and teacher autonomy plays a
part in success. For example, there was evidence that schools preferred to employ qualified
mathematics teachers, but where schools have no autonomy to choose their staff this may become
impossible. The schools in this study were part of almost every state and territory, and from almost
all systems with those jurisdictions. Although outside the scope of this study, there were indications
of differing levels of autonomy across schools and systems.
This report has presented the findings from a complex study providing a snapshot of practices in
Mathematics in successful schools. From this report, a series of papers should be developed for
different audiences. These should target the three spheres of influence: systems, schools, and
classrooms. In addition, there is potentially useful information for professional development
providers, curriculum developers, teacher educators, and education consultants. Work such as this
could include brief summary papers or one page memos addressing specific aspects of the findings.

108
References
ACER. (2013). Evaluation of the Cape York Aboriginal Australian academy initiative: Final report. Camberwell,
VIC: ACER. Retrieved from http://research.acer.edu.au/indigenous_education/36
Australian Academy of Science. (2016). The mathematical sciences in Australia: A Vision for 2025. Canberra:
Australian Academy of Science. Retrieved from http://www.science.org.au/mathematics-plan-2016-
25
Anthony, G., & Walshaw, M. (2009). Effective pedagogy in mathematics. Geneva: International Academy of
Education. Retrieved from
http://www.ibe.unesco.org/fileadmin/user_upload/Publications/Educational_Practices/EdPractices_1
9.pdf
Askew, M., Brown, M., Rhodes, V., Wiliam, D., & Johnson, D. (1997). Effective teachers of numeracy: Report of
a study carried out for the Teacher Training Agency. London: King's College, University of London.
Australian Curriculum Assessment and Reporting Authority (ACARA). (2013). Guide to understanding 2013
Index of Community Socio-educational Advantage (ICSEA) values. Retrieved from
http://www.acara.edu.au/verve/_resources/Guide_to_understanding_2013_ICSEA_values.pdf
Australian Curriculum Assessment and Reporting Authority (ACARA). (2014). General capabilities: Numeracy.
Retrieved from
http://www.australiancurriculum.edu.au/generalcapabilities/numeracy/introduction/introduction
Australian Curriculum Assessment and Reporting Authority (ACARA). (2016). My school. Retrieved from
http://www.myschool.edu.au/
Ball, D. L., Thames, M. H., & Phelps, G. (2008). Content knowledge for teaching: What makes it so special?
Journal of Teacher Education, 59(5), 389–407.
Baumert, J., Kunter, M., Blum, W., Brunner, M., Voss, T., Jordan, A., Klusmann, U., Krauss, S., Neubrand, M., &
Tsai Yi-Miau. (2010). Teachers’ mathematical knowledge, cognitive activation in the classroom, and
student progress. American Educational Research Journal, 47(1), 133–180.
Beswick, K., Watson, J., & Brown, N. (2006). Teachers’ confidence and beliefs and their students’ attitudes to
mathematics. In P. Grootenboer, R. Zevenbergen & M. Chinnappan (Eds.), Identities, cultures and
learning spaces: Proceedings of the 29th annual conference of the Mathematics Education Research
Group of Australasia (Vol. 1, pp. 68–75). Adelaide, SA: MERGA.
Beswick, K., & Callingham, R. (2011). Building a culture of evidence-based practice in teacher education:
Instrument development and piloting. In J. Wright (Ed.) Proceedings of the annual conference of the
Australian Association for Research in Education. Retrieved from
http://www.aare.edu.au/11pap/papers_pdf/aarefinal00649.pdf
Beswick, K. (2007/2008). Influencing teachers' beliefs about teaching mathematics for numeracy to students
with mathematics learning difficulties. Mathematics Teacher Education and Development, 9, 3–20.
Beswick, K. (2012). Teachers’ beliefs about school mathematics and mathematicians’ mathematics and their
relationship to practice. Educational Studies in Mathematics, 79(1), 127–147.
Black, P., & Wiliam, D. (1998). Assessment and classroom learning. Assessment in Education, 5(1), 1–74.
Boaler, J. (2016). Mathematical mindsets. San Francisco, CA: Jossey Bass.
Boyd, J. (2008) Coaching in context. Melbourne: Department of Education and Early Childhood Development.
109
Bronfenbrenner, U. (1989). Ecological systems theory. In R. Vasta (Ed.), Annals of child development, Vol. 6
(pp. 187–249). Greenwich, CT: JAI Press.
Bursal, M., & Paznokas, L. (2010). Mathematics anxiety and pre-service elementary teachers’ confidence to
teach mathematics and science. School Science and Mathematics, 106(4), 173–180.
Butler, R. (2007). Teachers' achievement goal orientations and associations with teachers' help seeking:
Examination of a novel approach to teacher motivation. Journal of Educational Psychology, 99(2),
241–252. http://dx.doi.org/10.1037/0022-0663.99.2.241
Callingham R., & Watson, J. M. (2004). A developmental scale of mental computation with part whole
numbers. Mathematics Education Research Journal, 16(2), 69–86.
Callingham, R., & Burgess, T. (2014). How the curriculum shapes teachers’ thinking: A comparison of New
Zealand and Australian teachers’ thinking about statistics. In K. Makar & R. Gould (Eds.), Proceedings
of the 9th International Conference on the Teaching of Statistics, Flagstaff, Arizona. Voorburg, The
Netherlands: International Statistical Institute. Retrieved from
http://icots.info/9/proceedings/pdfs/ICOTS9_10C3_CALLINGHAM.pdf
Callingham, R., Carmichael, C., & Watson, J. M. (2015). Explaining student achievement: The influence of
teachers’ pedagogical content knowledge in statistics. International Journal of Science and
Mathematics Education. Retrieved from Online First http://link.springer.com/article/10.1007/s10763-
015-9653-2?wt_mc=email.event.1.SEM.ArticleAuthorOnlineFirstDOI 10.1007/s10763-015-9653-2
Centre for Education Statistics and Evaluation. (2015). High value-add schools: Key drivers of school
improvement. Sydney, NSW: Department of Education and Communities.
Chan, W., Lau, S., Nie, Y., Lim, S., & Hogan, D. (2008). Organisational and personal predictors of teacher
commitment: The mediating role of teacher efficacy and identification with school. American
Educational Research Journal, 45(3), 597–630.
Chiang, H., McCullough, M., Lipscomb, S., & Gill, B. (2016). Can student test scores provide useful measures of
school principals’ performance? (NCEE 2016–002). Washington, DC: U.S. Department of Education,
Institute of Education Sciences, National Center for Education Evaluation and Regional Assistance.
Available from http://ies.ed.gov/ncee.
Chick, H., & Pierce, R. (2013). The statistical literacy needed to interpret school assessment data. Mathematics
Teacher Education and Development, 15(2), 5–26.
Clausen, M. (2002). Unterrichtsqualitat: Eine Frage der Perspektiv? [Quality of Education: A problem of
perspective?]. Munster: Waxmann.
Commonwealth of Australia (2014). National teaching workforce dataset. Data analysis report. Canberra, ACT:
Commonwealth of Australia. Retrieved from
http://docs.education.gov.au/system/files/doc/other/ntwd_data_analysis_report.pdf
Crowley, M. L. (1987) The van Hiele model of the development of geometric thought. In M. M. Lindquist (Ed.)
Learning and Teaching Geometry, K-12, (1987 Yearbook of the National Council of Teachers of
Mathematics, pp. 1–16.) Reston, Va.: National Council of Teachers of Mathematics.
Darling-Hammond, L., & Young, P. (2002). Defining “highly qualified teachers”. What does scientifically based
research tell us? Educational Researcher, 31(9), 13–25.
Dettmers, S., Trautwein, U., & Lüdtke, O. (2009). The relationship between homework time and achievement is
not universal: Evidence from multilevel analyses in 40 countries. School Effectiveness and School
Improvement, 20, 375– 405. http://dx.doi.org/10.1080/ 09243450902904601
Dulfer, N., Polesel, J., & Rice, S. (2012). The experience of education: The impacts of high stakes testing on

110
school students and their families – An educator’s perspective. Sydney, NSW: Whitlam Institute.
Dweck, C. S., Chiu, C., & Hong, Y. (1995). Implicit theories and their role in judgements and reactions: A word
from two perspectives, Psychological Inquiry: An international Journal for the Advancement of
Psychological Theory, 6(4), 267–285.
Education Council. (2015). National STEM School Education Strategy, 2016 – 2026. Retrieved from
http://www.educationcouncil.edu.au/site/DefaultSite/filesystem/documents/National%20STEM%20S
chool%20Education%20Strategy.pdf
Ewing, B. (2011). Direct instruction in mathematics: Issues for schools with high Indigenous enrolments: A
literature review. Australian Journal of Teacher Education, 36(5), 65–92.
Fuchs, L. S., Fuchs, D., Hamlett, C. L., Thompson, A., Roberts, P. H., Kubek, P., & Stecker, P. S. (1994). Technical
features of a mathematics concepts and applications curriculum-based measurement
system. Diagnostique, 19(4), 23–49.
Frenzel, A. C., Pekrun, R., Dicke, A. L., & Goetz T. (2012). Beyond quantitative decline: conceptual shifts in
adolescents' development of interest in mathematics. Developmental Psychology, 48(4), 1069–1082.
Gagné, R. (1970). The conditions of learning (2nd ed.). New York: Holt, Rinehart & Winston.
Githua, N., & Mwangi, J.G. (2003). Students’ mathematics self-concept and motivation to learn mathematics:
relationship and gender differences among Kenya’s secondary-school students in Nairobi and Rift
Valley provinces. International Journal of Educational Development, 23, 487–499.
Goddard, R. (2002). A theoretical and empirical analysis of the measurement of collective efficacy: The
development of the short form. Educational and Psychological Measurement, 62(1), 97–110.
Goss, P., Hunter, J., Romanes, D., & Parsonage, H. (2015). Targeted teaching: How better use of data can
improve student learning. Melbourne, VIC: Grattan Institute.
Grouws, D. A., Tarr, J. E., Chávez, O., Sears, R., Soria, V. M., & Taylan, R. D. (2013). Curriculum and
implementation effects on high school students' mathematics learning from curricula representing
subject-specific and integrated content organizations. Journal for Research in Mathematics Education,
44(2), 416–463.
Hattie, J. A. C. (2009). Visible learning. A synthesis of over 800 meta-analyses relating to achievement.
Abingdon, OXON: Routledge.
Hay, I., Callingham, R., & Carmichael, C. (2015). Interest, self-efficacy and academic achievement in a statistics
lesson. In K. A. Renninger, M. Nieswandt, & S. E. Hidi (Eds.) Interest in K-16 Mathematics and Science
Learning and Related Activity. Washington, DC: American Educational Research Association.
Heinze, A., Reiss, K., Augsburg, F.R. (2005). Mathematics achievement and interest in mathematics from a
differential perspective. ZDM, 37(3), 212–220.
Hill, H. C., Rowan, R., & Ball, D. L. (2005). Effects of teachers' mathematical knowledge for teaching on student
achievement. American Educational Research Journal 42(2), 371–406.
Hill, J. G., & Dalton, B. (2013). Student math achievement and out-of-field teaching. Educational Researcher,
42(7), 403–405.
House, J .D. (2006). Mathematics beliefs and achievement of elementary school students in Japan and the
United States: Results from the Third International Mathematics and Science Study. The Journal of
Genetic Psychology, 167(1), 31-45.
Hurrell, D. P. (2013). What teachers need to know to teach mathematics: An argument for a reconceptualised
model. Australian Journal of Teacher Education, 38(11).
http://dx.doi.org/10.14221/ajte.2013v38n11.3

111
Jensen, B., Sonnemann, J., Roberts-Hull, K., & Hunter, A. (2016). Beyond PD: Teacher professional learning in
high-performing systems, Australian edition. Washington, DC: National Center on Education and the
Economy.
Jorgensen, R., & Sullivan, P. (2010). Scholastic heritage and success in school mathematics: Implications for
remote Aboriginal learners. In I. Snyder & J. Nieuwenhuysen (Eds.), Closing the gap in education?
Improving outcomes in southern world societies (pp. 23-36). Clayton, VIC: Monash University.
Jorgenson, R., & Lowrie, T. (2014). Mathematics education in rural Australia. Issues for equity and success. Em
Teia: Recista de Educacao Matemitca e Techologia Iberoamerica, 1, 1–13.
Jurdak, M. (2009). Toward equity in quality in mathematics education. Dordrecht: Springer.
Kaplan, A., & Maehr, M. L. (2007). The contributions and prospects of goal orientation theory. Educational
Psychology Review, 19(2), 141–184.
Kilpatrick, J., Swafford, J., & Findell, B. (Eds.). (2001). Adding it up: Helping children learn mathematics.
Washington, DC: National Academy Press.
Klein, D. (2007). A quarter century of US ‘math wars’ and political partisanship. BSHM Bulletin: Journal of the
British Society for the History of Mathematics, 22(1), 22–33.
Kunter, M., Frenzel, A., Nagy, G., Baumert, J., & Pekrun, R. (2011). Teacher enthusiasm: Dimensionality and
context specificity. Contemporary Educational Psychology, 36, 298–301.
Kunter, M., Tsai, Y-M., Klusmann, U., Brunner, M., Krauss, S., & Baumert, J. (2008). Students’ and mathematics
teachers’ perceptions of teacher enthusiasm and instruction. Learning and Instruction, 18, 468–482.
Lamb, S., & Fullarton, S. (2001). Classroom and school factors affecting mathematics achievement: A
comparative study of the US and Australia using TIMSS. Retrieved from
http://research.acer.edu.au/timss_monographs/10
Lauermann, F., & Karabenick, S. A. (2013). The meaning and measure of teachers' sense of responsibility for
educational outcomes. Teaching and Teacher Education, 30(1), 13–26.
Lazarides, R., & Watt, H. M. G. (2015). Girls’ and boys’ perceived mathematics teacher beliefs, classroom
learning environments and mathematical career intentions. Contemporary Educational Psychology,
41, 51-61. DOI http://dx.doi.org/10.1016/j.cedpsych.2014.11.005
Leder, G. C., Pehkonen, E., & Törner, G. (Eds.) (2002). Beliefs: A hidden variable in mathematics education?
Dordrecht: Kluwer.
Lobato, J., Clarke, D., & Burns Ellis, A. (2005). Initiating and eliciting in teaching: A reformulation of telling.
Journal for Research in Mathematics Education, 36(2), 101–136.
Ma, L. (1999). Knowing and teaching elementary school mathematics. Mahwah, NJ, Lawrence Erlbaum
Associates.
Marzano, R. J. (2012). Marzano levels of school effectiveness. Centennial, CO: Marzano Research Center.
Retrieved from http://legisweb.state.wy.us/InterimCommittee/2012/Z02MarzanoLevels.pdf
Maslach, C., Jackson, S. E., & Leiter, M. P. (1996). Maslach burnout inventory manual (3rd ed.). Palo Alto, CA:
Consulting Psychologist Press.
Mason, L. (2003). High school students' beliefs about maths, mathematical problem solving, and their
achievement in maths: A cross-sectional study. Educational Psychology: An International Journal of
Experimental Educational Psychology, 23(1), 73-85. DOI: 10.1080/01443410303216

112
Masters, G. N. (2009). A shared challenge: Improving literacy, numeracy and science learning in Queensland
primary schools. Camberwell: ACER. Retrieved from
http://education.qld.gov.au/mastersreview/pdfs/final-report-masters.pdf
McIntosh, A. (2005). Mental computation: A strategies approach. Hobart: Department of Education, Tasmania.
Meiers, M., & Buckley, S. (2009) Successful professional learning. The Digest, issue 3. Sydney: NSW Institute of
Teachers.
Mewborn, D. S. (2001). Teachers’ content knowledge, teacher education, and their effects on the preparation
of elementary teachers in the United States. Mathematics Teacher Education and Development, 3,
28–36.
OECD. (2012). Delivering school transparency in Australia: National reporting through My School, OECD.
Retrieved from http://dx.doi.org/10.1787/9789264096660-en
OECD Program for International Student Assessment. (2006). Student questionnaire. Paris: OECD.
OECD Program for International Student Assessment. (2012). School questionnaire. Paris: OECD.
OECD. (2014). Does homework perpetuate inequities in education?, PISA in Focus, No. 46, OECD: Paris.
DOI: http://dx.doi.org/10.1787/5jxrhqhtx2xt-en
Patrick, B. C., Hisley, J., & Kempler, T. (2000). “What's everybody so excited about?”: The effects of teacher
enthusiasm on student intrinsic motivation and vitality. The Journal of Experimental Education, 68(3),
217–236.
Perry, B. (2000). Early childhood numeracy. Commonwealth of Australia/Australian Association of Mathematics
Teachers.
Piaget, J. (1941/1952). The child’s conception of number (English translation). Abingdon, OXON: Routledge.
Reys, B., Reys, R., &. Rubenstein, R. (2010). Mathematics curriculum: Issues, trends and future directions. (72nd
Yearbook). Reston, VA: National Council of Teachers of Mathematics.
Salmela-Aro, K., Kiuru, N., Leskinen, E., & Nurmi, J-E., (2009). School burnout inventory (SBI): Reliability and
validity. European Journal of Psychological Assessment, 25, 48-57. DOI: 10.1027/1015-5759.25.1.48
Sanders, M. G. (2015). Building school-community partnerships. Collaboration for success. New York: Skyhorse.
Schleicher, A. (2016). Teaching excellence through professional learning and policy reform: Lessons from
around the world. (International Summit on the Teaching Profession) Paris: OECD. Retrieved from
http://dx.doi.org/10.1787/9789264252059-en
Schoenfeld, A. H. (2004). The maths wars. Educational Policy, 18(1), 253–286.
Siemon, D., Breed, M., & Virgona, J. (2010). From additive to multiplicative thinking – The big challenge of the
middle years. Melbourne: RMIT. Retrieved from
https://www.eduweb.vic.gov.au/edulibrary/public/teachlearn/student/ppaddmulti.pdf
Siemon, D., Izard, J., Breed, M., & Virgona, J. (2006). The derivation of a learning assessment framework for
multiplicative thinking. In In J. Novotna, H. Moraova, M. Kratka & N. Stehlikova (Eds.), Mathematics in
the centre. (Proceedings of the 30th Conference of the International Group for the Psychology of
Mathematics Education, pp. 113-120). Prague, Czech Republic: PME. Retrieved from
http://www.education.vic.gov.au/Documents/school/teachers/teachingresources/discipline/maths/a
ssessment/ppderivationlaf.pdf
Sirin, S. R. (2005). Socioeconomic status and academic achievement: A meta-analytic review of research.
Review of Educational Research, 75(3), 417–453.

113
Southwell, B., & Karmis, M. (1994). Beliefs of secondary school students concerning mathematics and
mathematics education. Paper presented at the Australian Association for Research in Education
Conference, Newcastle. Retrieved from
http://www.aare.edu.au/data/publications/1994/soutb94168.pdf
Stacey, K., Vincent, J., Stephens, M., & Holton, D. (2015). Desktop review of mathematics school education
pedagogical approaches and learning resources. Canberra, ACT: Australian Academy of Sciences.
Retrieved from https://www.science.org.au/
Stake, R. E. (1995). The art of case study research. Thousand Oaks, CA: Sage.
Stipek, D. J., Givvin, K. B., Salmon, J. M., & MacGyvers, V. L. (2001. Teachers' beliefs and practices related to
mathematics instruction. Teaching and Teacher Education, 17, 213–226.
Stoll, L., & Louis, K.S. (2007). Professional learning communities. Divergence, depth and dilemmas.
Maidenhead, England: Open University Press.
Susac, A., Bubic, A., Vrbanc, A., & Planinic, M. (2014). Development of abstract mathematical reasoning: The
case of algebra. Frontiers in Human Neuroscience 8(679) (online). DOI: 10.3389/fnhum.2014.00679
Sullivan, P., & Lilburn, P. (2004). Open-ended Maths Activities: Using "Good" Questions to Enhance Learning in
Mathematics (2nd ed.). Melbourne: Oxford University Press Australia.
Taylor, L., & Parsons, J. (2011). Improving student engagement. Current Issues in Education, 14(1). Retrieved
from http://cie.asu.edu/
Thompson, G. (2013). NAPLAN, MySchool and accountability: Teacher perceptions of the effects of testing. The
International Education Journal: Comparative Perspectives, 1292, 62–84.
Thomson, S., De Bortoli, L., & Buckley, S. (2013). PISA 2012: how Australia measures up. Camberwell, VIC:
ACER. Retrieved from https://www.acer.edu.au/documents/PISA-2012-Report.pdf
Thomson, S., Hillman, K., Wernert, N., Schmid, M., Buckley, S., & Munene, A. (2012). Highlights from TIMSS and
PIRLS 2011 from Australia’s perspective. Camberwell, VIC: ACER. Retrieved from
https://www.acer.edu.au/files/TIMSS-PIRLS_Australian-Highlights.pdf
Tschannen-Moran, M., & Careis, C.R. (2004). Principals' sense of efficacy: Assessing a promising construct.
Journal of Educational Administration, 42(5), 573–585.
Tschannen-Moran, M., & Woolfolk Hoy, A. (2001). Teacher efficacy: Capturing an elusive construct. Teaching
and Teacher Education, 17, 783–805.
University of Tasmania. (2015). The STEMCrAfT Project: Capacity building for teachers in Science, Technology,
Engineering and Mathematics. Retrieved from http://www.utas.edu.au/education/research/research-
groups/maths-education/stemcraft-project
University of Tasmania. (2016). TEMPEST: Towards Educating Mathematics Professionals Encompassing
Science and Technology. Retrieved from http://www.utas.edu.au/education/research/research-
groups/maths-education/tempest
Vygotsky, L. S. (1986). Thought and language. (Translated by A. Kozulin). Cambridge, MT: The MIT Press.
Watson, J., & Callingham, R. (2003). Statistical literacy: A complex hierarchical construct. Statistics Education
Research Journal, 2(2), 3–46.
Watt, H. M. G. (2004). Development of adolescents’ self-perceptions, values and task perceptions according to
gender and domain in 7th through 11th grade Australian students. Child Development, 75, 1556–
1574.
Watt, H. M. G. (2012). STEPS Study. Retrieved from www.stepsstudy.org

114
Watt, H. M. G., Jansen, N., & Joukes, G. (Guest Eds.). (2013). Gendered pathways towards (and away from)
STEM fields. International Journal of Gender, Science and Technology, 5(3).
Watt, H. M. G., Shapka, J. D., Morris, Z. A., Durik, A. M., Keating, D. P., & Eccles, J. S. (2012). Gendered
motivational processes affecting high school mathematics participation, educational aspirations, and
career plans: A comparison of samples from Australia, Canada, and the United States. Developmental
Psychology, 48(6), 1594–1611.
Weldon, P. R. (2015). The teacher workforce in Australia: Supply, demand and data issues. Policy Insights Issue
2. Melbourne, ACER.
Wiliam, D. (2011). Embedded formative assessment. Bloomington, IN: Solution Tree Press.
Willett, M., Segal, D., & Walford (Ernst and Young) (2014). National Teaching Workforce Dataset Data Analysis
Report 2014. Canberra: Commonwealth of Australia.
Wilson, S., Floden, R., & Ferrini-Mundy, J. (2001). Teacher preparation research: Current knowledge, gaps and
recommendations. Seattle, WA: University of Washington.
Wright, R. (1998). An overview of a research-based framework for assessing and teaching early number. In C.
Kanes, M. Goos, & E. Warren (Eds.) Teaching mathematics in new times. Gold Coast: Mathematics
Education Research Group of Australasia.
Wu, M. (2010). Measurement, sampling, and equating errors in large scale assessments. Educational
Measurement: Issues and Practice, 29(4), 5–27.
Wyn, J., Turnbull, M., & Grimshaw, L. (2014). The experience of education: The impacts of high stakes testing
on school students and their families. Sydney: Whitlam Institute. Available from
http://www.whitlam.org/
You, S., Ritchey, K., Furlong, M., Shochet, I. M., & Boman, P. (2011). Examination of the latent structure of the
psychological sense of school membership scale, Journal of Psychoeducational Assessment, 29(3),
225–237.
Zhang, Q. (2014). Assessing the effects of instructor enthusiasm on classroom engagement, learning goal
orientation, and academic self-efficacy. Communication Teacher, 28(1), 44–56.

115
Appendix A
A1. Websites considered for the desktop review
Note: Websites change frequently and some of these may have moved
since this study was completed.

116
System Home page Useful URL
TASMANIA
Department of Education
https://www.education.tas.gov.au/Pages/default.aspx
http://www.education.tas.gov.au/parents_carers/schools-colleges/Programs-Initiatives/Pages/Literacy-and-Numeracy.aspx
http://www.scootle.edu.au/ec/viewing/S7080/pdf/tls71_raising_the_bar.pdf
Catholic http://catholic.tas.edu.au/ http://catholic.tas.edu.au/our-schools/curriculum/numeracy-strategy
Independent http://www.independentschools.tas.edu.au/
VICTORIA
Department of Education and Training
http://www.education.vic.gov.au/school/teachers/teachingresources/discipline/maths/Pages/default.aspx
http://www.education.vic.gov.au/school/teachers/teachingresources/discipline/maths/Pages/support.aspx
http://www.education.vic.gov.au/school/teachers/teachingresources/discipline/maths/continuum/Pages/mathcontin.aspx
http://www.education.vic.gov.au/school/teachers/teachingresources/discipline/maths/assessment/Pages/mathsassess.aspx
Catholic Victoria http://www.cecv.catholic.edu.au/
Catholic Melbourne http://www.ceomelb.catholic.edu.au/ http://www.ceomelb.catholic.edu.au/learning-teaching/mathematics/vision-for-mathematics/
http://www.ceomelb.catholic.edu.au/learning-teaching/mathematics/mathematics-projects/
Catholic Ballarat
http://www.ceoballarat.catholic.edu.au/media/uploads/prof_learning_2016/learningteaching/EssentialLearnMaths.pdf
Victorian Curriculum and Assessment Authority
http://www.vcaa.vic.edu.au/ http://ausvels.vcaa.vic.edu.au/
http://victoriancurriculum.vcaa.vic.edu.au/
NEW SOUTH WALES
Department of Education and Communities
http://www.dec.nsw.gov.au/ http://www.curriculumsupport.education.nsw.gov.au/policies/numeracy/

117
http://www.curriculumsupport.education.nsw.gov.au/primary/mathematics/numeracy/
http://www.curriculumsupport.education.nsw.gov.au/secondary/mathematics/numeracy/
http://www.curriculumsupport.education.nsw.gov.au/digital_rev/mathematics/index.htm
http://www.schools.nsw.edu.au/learning/7-12assessments/naplan/teachstrategies/yr2008/numeracy/NN_Over.htm
http://www.schools.nsw.edu.au/learning/7-12assessments/naplan/teachstrategies/yr2011/index.php
http://www.dec.nsw.gov.au/documents/15060385/15385042/implementation2014.pdf
http://www.schools.nsw.edu.au/learning/7-12assessments/naplan/teachstrategies/yr2013/index.php?id=numeracy/nn_over
http://www.schools.nsw.edu.au/learning/7-12assessments/smart/What_is_new_in_SMART_NAPLAN_2014.pdf
http://www.curriculumsupport.education.nsw.gov.au/beststart/ten/index.htm
http://www.curriculumsupport.education.nsw.gov.au/beststart/lighthouse/general/index.htm
Catholic (also covers ACT)
http://www.catholicschools.nsw.edu.au/home
Independent https://www.aisnsw.edu.au/Pages/default.aspx https://www.aisnsw.edu.au/Services/Partnerships_in_Education/STEM/Pages/default.aspx
Board of Studies, Teaching and Educational Standards
https://www.boardofstudies.nsw.edu.au/ http://syllabus.bostes.nsw.edu.au/mathematics/mathematics-k10/
QUEENSLAND
Department of Education and Training
http://education.qld.gov.au/ http://education.qld.gov.au/literacyandnumeracy/
http://education.qld.gov.au/nationalpartnerships/lit-num-national-partnership.html

118
http://education.qld.gov.au/naplan/
http://education.qld.gov.au/schools/grants/state/core/targeted-invervention-grant.html
http://www.proportionalreasoning.com/queensland-conference-20131.html http://education.qld.gov.au/projects/educationviews/talking-point/2013/jan/numeracy-250113.html
http://education.qld.gov.au/projects/educationviews/talking-point/2013/may/maths-090513.html
http://education.qld.gov.au/community/beam/index.html
http://education.qld.gov.au/stem/pdfs/stem-brochure.pdf
Catholic http://www.qcec.catholic.edu.au/ http://www.qcec.catholic.edu.au/queensland-catholic-education-commission/responses-reports-and-submissions
http://www.qcec.catholic.edu.au/queensland-catholic-education-commission/responses-reports-and-submissions
http://www.qcec.catholic.edu.au/upload/publicsite/Education/Queensland%20Catholic%20Schools%20and%20Curriculum%20February%202008.pdf
Independent http://www.isq.qld.edu.au/ http://www.isq.qld.edu.au/lnca
http://isqcollaborate.ning.com/main/authorization/signUp?target=http%3A%2F%2Fisqcollaborate.ning.com%2F%3Fxgi%3D0En9tAttU0gHJh%253EGroups%253E%2BLNCA%2BGroup%26xgkc%3D1
http://www.isq.qld.edu.au/files/file/News%20and%20Media/Publications/SISBrochureJan2015.pdf
http://www.isq.qld.edu.au/using-data-in-schools
Queensland Curriculum and Assessment Authority
https://www.qcaa.qld.edu.au/ https://www.qcaa.qld.edu.au/p-10/aciq/p-10-mathematics
ACT
Education and Training Directorate
http://www.det.act.gov.au/ http://www.det.act.gov.au/teaching_and_learning/literacy_and_numeracy#n
http://www.curriculumsupport.education.nsw.gov.au/countmein/
www.det.act.gov.au/__data/assets/…/Middle_Years_Mental_Computation.doc

119
Catholic http://www.catholicschools.nsw.edu.au/home
Independent http://ais.act.edu.au/ http://ais.act.edu.au/?s=numeracy
NORTHERN TERRITORY
Department of Education
http://www.education.nt.gov.au/ http://www.education.nt.gov.au/teachers-educators/literacy-numeracy/evidence-based-literacy-numeracy-practices-framework/principles
http://www.education.nt.gov.au/teachers-educators/literacy-numeracy/evidence-based-literacy-numeracy-practices-framework
http://www.education.nt.gov.au/media-releases/media-releases/2012/june/new-resources-to-help-parents-and-families
http://www.education.nt.gov.au/parents-community/assessment-reporting/diagnostic-assessments/sena-cmit
http://www.education.nt.gov.au/__data/assets/pdf_file/0011/38369/Northern-Territory-Literacy-and-Numeracy-Panel-Report-2014.pdf
Catholic http://www.ceont.catholic.edu.au/ http://www.ceont.catholic.edu.au/learning-teaching/student-support/literacy-numeracy
Independent http://www.aisnt.asn.au/
WESTERN AUSTRALIA
Department of Education
http://www.education.wa.edu.au/home/detcms/portal/
http://portal.det.wa.edu.au/portal/page?_pageid=803,886439&_dad=portal&_schema=PORTAL
Catholic http://internet.ceo.wa.edu.au/Pages/default.aspx
http://internet.ceo.wa.edu.au/ReligiousEducationCurriculum/CurriculumK-12/Pages/Initiatives.aspx
Independent http://www.ais.wa.edu.au/
WA School Curriculum and Standards Authority
http://www.scsa.wa.edu.au/ http://k10outline.scsa.wa.edu.au/home/p-10-curriculum/curriculum-browser/mathematics-v8
SOUTH AUSTRALIA
Department for Education and Child Development
http://www.decd.sa.gov.au/ http://www.decd.sa.gov.au/docs/documents/1/numeracyliteracystrategy.pdf

120
http://www.decd.sa.gov.au/portal/aboutdept.asp?group=reports&id=numeracyliteracy
http://www.decd.sa.gov.au/numeracy/files/links/team_details.pdf
http://www.decd.sa.gov.au/vocationalpathways/files/links/leadertool_13_v1.pdf
http://www.decd.sa.gov.au/accountability/a8_publish/modules/publish/content.asp?id=37723&navgrp=3763
http://www.decd.sa.gov.au/mediacentre/files/pages/linked/numeracyliteracy_initiativ.pdf
www.decd.sa.gov.au/numeracy/files/links/the_year_8_project.docx
www.decd.sa.gov.au/mediacentre/files/pages/linked/mike_chartres_all_27_oct.docx
Catholic http://www.cesa.catholic.edu.au/ http://www.cesa.catholic.edu.au/about/support-we-provide/educational-support-services#2891
http://www.cesa.catholic.edu.au/our-schools/learning-teaching/assessment-reporting
Independent schools http://www.ais.sa.edu.au/ http://www.ais.sa.edu.au/teaching-learning/australian-curriculum/support-and-resources#170051
http://www.ais.sa.edu.au/teaching-learning/australian-curriculum/support-and-resources#170051
http://www.ais.sa.edu.au/teaching-learning/numeracy

121
A2. Survey instruments
Survey instruments were mostly taken from existing validated instruments (see details in Chapter 2)
and where these were used the original question structure was used to maintain the integrity of the
instrument.
Four surveys were used, each of which was tailored to the target group of respondents. In some
instances questions were not presented depending on responses to prior questions. Survey
questions, target constructs, and response codes are provided here, together with links to the online
surveys.

122
School leaders’ survey
A link to the survey can be accessed here: Best practice leaders' survey
Focus LEADERS Construct/item Question
Name Create personal ID
Demographics Name of school To be removed when School ID assigned
Sex MALE=1 FEMALE=2
DOBDAY date of birth - day
DOBMONTH date of birth - month
DOBYEAR date of birth - year
Time teaching How long have you worked in schools in total?
Time as principal/leader How long have you worked in schools as a leader?
Time at this school as principal/leader How long have you worked in this school as a leader?
Major teaching area What is your major teaching area? 1 (Generalist), 2 (Sciences), 3 (Mathematics), 4 (English and/or languages), 5 (social sciences), Other (please specify):
Mathematics qualifications
What formal qualifications do you have in mathematics? 1 (none), 2 (one semester of tertiary level study), 3 (1 year of tertiary level study), 4 (undergraduate major), Other (please specify)
Education qualifications What qualifications do you have in teaching and/or education, please tick all that apply? 1 (certificate in education) 2 (diploma in education), 3 (bachelor in education), 4 (master in education), 5 (doctorate in education).
School level factors School population How many students are currently enrolled in this school?
Number of teachers How many teachers are currently employed in this school (including part-time, but not casual)?
For secondary only
Number of maths teachers How many teachers in this school currently teach mathematics?
For secondary only
Number of out-of-field teachers How many teachers currently teaching mathematics classes do not have tertiary qualifications (a major) in mathematics?
Time spent in maths
Lessons/week teaching maths
How many hours per week are scheduled for the teaching of mathematics in: (a) Year 3 (b) Year 4 (c) Year 5 (d) Year 6 OR (a) Year 7 (b) Year 8 (c) Year 9 (c) Year 10
Staff turnover How many teachers left this school in: (a) 2012 (b) 2013 (c) 2014
How many teachers joined the school in: (a) 2012 (b) 2013 (c) 2014.
Collective efficacy Teachers in this school are able to get through to difficult students.1 (strongly disagree) to 5 (strongly agree).
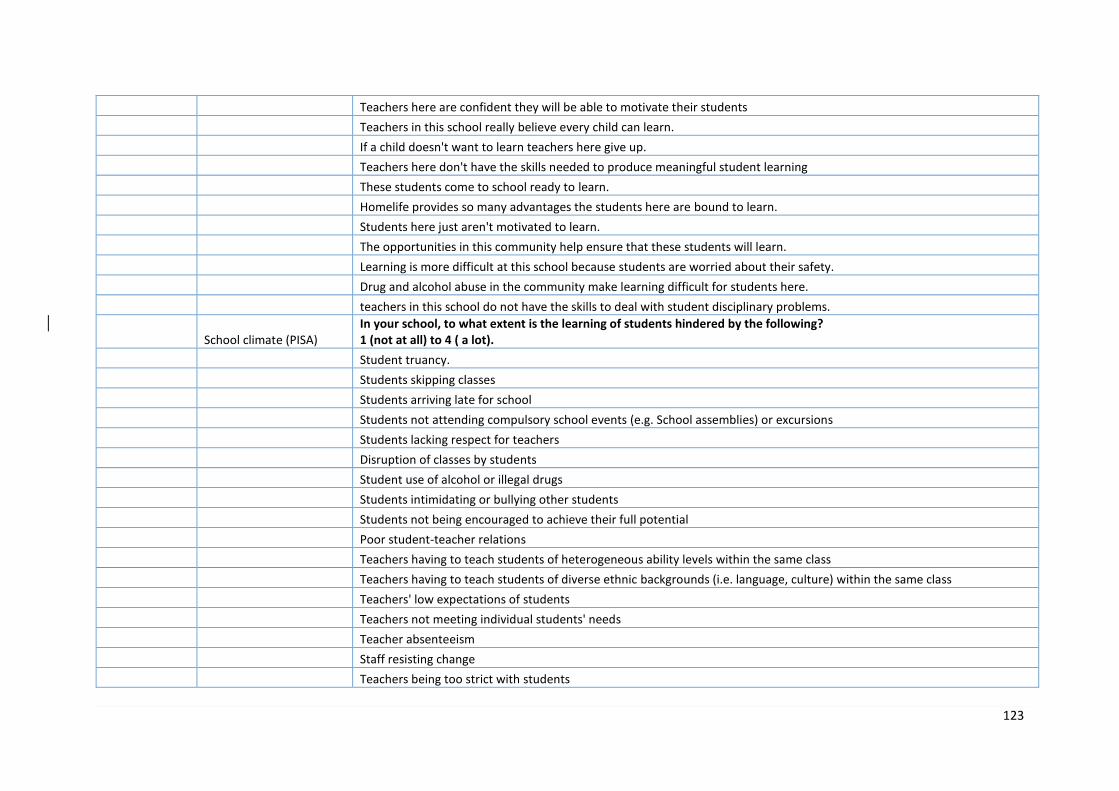
123
Teachers here are confident they will be able to motivate their students
Teachers in this school really believe every child can learn.
If a child doesn't want to learn teachers here give up.
Teachers here don't have the skills needed to produce meaningful student learning
These students come to school ready to learn.
Homelife provides so many advantages the students here are bound to learn.
Students here just aren't motivated to learn.
The opportunities in this community help ensure that these students will learn.
Learning is more difficult at this school because students are worried about their safety.
Drug and alcohol abuse in the community make learning difficult for students here.
teachers in this school do not have the skills to deal with student disciplinary problems.
School climate (PISA) In your school, to what extent is the learning of students hindered by the following? 1 (not at all) to 4 ( a lot).
Student truancy.
Students skipping classes
Students arriving late for school
Students not attending compulsory school events (e.g. School assemblies) or excursions
Students lacking respect for teachers
Disruption of classes by students
Student use of alcohol or illegal drugs
Students intimidating or bullying other students
Students not being encouraged to achieve their full potential
Poor student-teacher relations
Teachers having to teach students of heterogeneous ability levels within the same class
Teachers having to teach students of diverse ethnic backgrounds (i.e. language, culture) within the same class
Teachers' low expectations of students
Teachers not meeting individual students' needs
Teacher absenteeism
Staff resisting change
Teachers being too strict with students

124
Teachers being late for class
Teachers not being well prepared for classes
NAPLAN In this school, the implementation of NAPLAN has… 1 (strongly disagree) to 5 (strongly agree)
...improved whole school coordination in numeracy.
...led to increased opportunities for collaboration and sharing of resources.
...supported teacher and school assessments.
...helped students get better at test-taking practices.
...helped promote desirable student attributes such as planning, goal setting and engagement, through preparing for NAPLAN tests.
...allowed for better monitoring of student progress over time.
…had a negative impact on learning through a narrow focus.
…negatively impacted student learning through lack of relevance.
…been disconnected from the mathematics that students do in my class.
...increased the stress and pressure on students.
...increased the stress and pressure on teachers.
...led to a greater prevalence of 'teaching to the test'.
…interfered with a balanced and effective curriculum.
Curriculum leadership ACM documentation
Is there a school level document that is derived from the Australian Curriculum Mathematics? (e.g. Mathematics program that reflects the curriculum). Yes/No
Homework
How many hours per week are students required to do maths homework in: (a) Year 3 (b) Year 4 (c) Year 5 OR (a) Year 7 (b) Year 8 (c) Year 9: 1 (none), 2 (less than 2 hours), 3 (More than 2 hours but less than 5 hours), 4 (more than 5 hours but less than 10 hours), 5 (more than 10 hours), 6 (Don't know).
Optimal mathematics teacher practices Student engagement
From the list below, rate how much you believe each contributes to increased student engagement in mathematics (1=not at all, 7=extremely)
a) Playing maths games (including computer games)
b) Teacher giving clear explanations
c) Students explaining their own thinking (either verbally or written)
d) Students listening to and questioning other students’ thinking
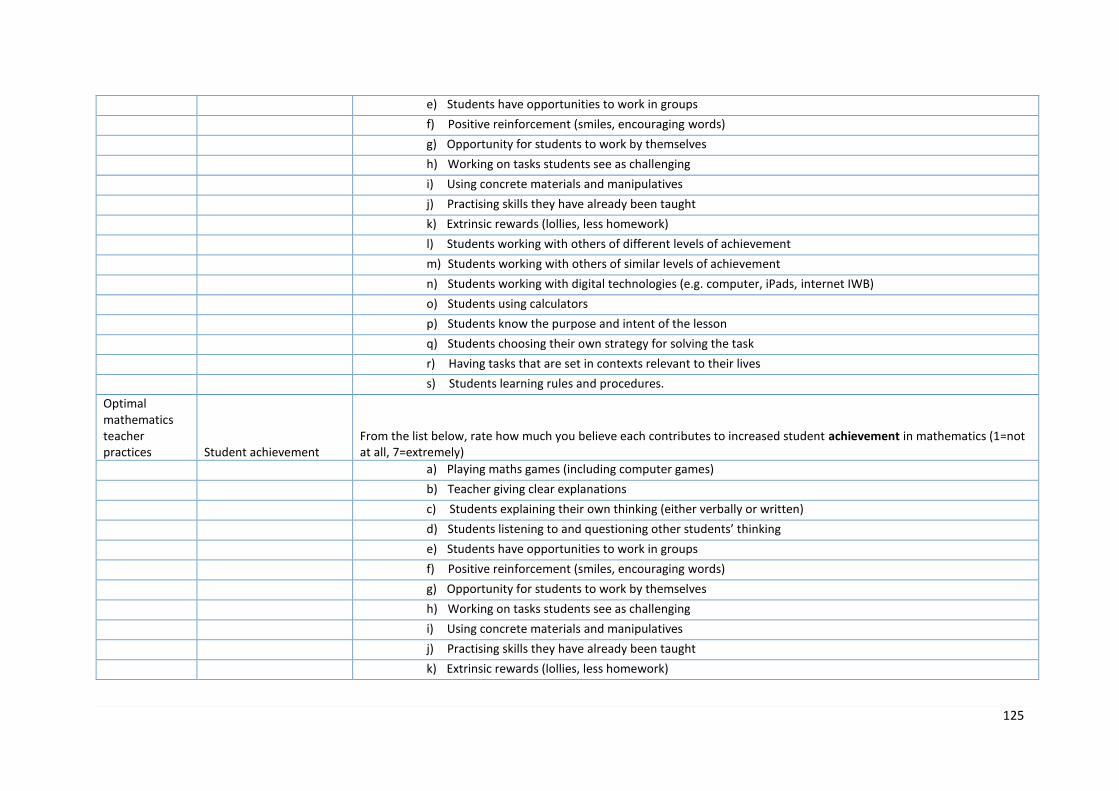
125
e) Students have opportunities to work in groups
f) Positive reinforcement (smiles, encouraging words)
g) Opportunity for students to work by themselves
h) Working on tasks students see as challenging
i) Using concrete materials and manipulatives
j) Practising skills they have already been taught
k) Extrinsic rewards (lollies, less homework)
l) Students working with others of different levels of achievement
m) Students working with others of similar levels of achievement
n) Students working with digital technologies (e.g. computer, iPads, internet IWB)
o) Students using calculators
p) Students know the purpose and intent of the lesson
q) Students choosing their own strategy for solving the task
r) Having tasks that are set in contexts relevant to their lives
s) Students learning rules and procedures.
Optimal mathematics teacher practices Student achievement
From the list below, rate how much you believe each contributes to increased student achievement in mathematics (1=not at all, 7=extremely)
a) Playing maths games (including computer games)
b) Teacher giving clear explanations
c) Students explaining their own thinking (either verbally or written)
d) Students listening to and questioning other students’ thinking
e) Students have opportunities to work in groups
f) Positive reinforcement (smiles, encouraging words)
g) Opportunity for students to work by themselves
h) Working on tasks students see as challenging
i) Using concrete materials and manipulatives
j) Practising skills they have already been taught
k) Extrinsic rewards (lollies, less homework)

126
l) Students working with others of different levels of achievement
m) Students working with others of similar levels of achievement
n) Students working with digital technologies (e.g. computer, iPads, internet IWB)
o) Students using calculators
p) Students know the purpose and intent of the lesson
q) Students choosing their own strategy for solving the task
r) Having tasks that are set in contexts relevant to their lives
s) Students learning rules and procedures.
Individual level factors
Hours worked/week Approximately how many hours per week do you work on school related matters?
Approximately how many hours per week do spend teaching?
Health and well-being
Hours worked/weekend Approximately how many hours do you work (on school related matters) over the weekend?
Emotional exhaustion I feel emotionally drained from my work . 1 (strongly disagree) to 5 (strongly agree)
I feel used up at the end of the workday
I feel fatigued when I get up in the morning and have to face another day on the job
Working with people all day is really a strain for me
I feel burned out from my work
I feel frustrated by my job
I feel I’m working too hard on my job
Working with people directly puts too much stress on me
I feel like I’m at the end of my rope
Depersonalisation I feel I treat some students as if they were impersonal ‘objects’
I’ve become more callous toward people since I took this job
I worry that this job is hardening me emotionally
I don’t really care what happens to some students
I feel students blame me for some of their problems
Teacher mind-set
Incremental You have a certain amount of intelligence and really can't do much to change it. 1 (strongly disagree) to 6 (strongly agree)
Entity Your intelligence is something about you that can't change very much.
You can learn new things but you can't really change your basic intelligence.

127
Leadership style
Management Below are statements about your management of this school. Please indicate the frequency of the following activities and behaviours in your school during the 2014 academic year. 1 (did not occur), 2 (1–2 times during the year), 3 (3–4 times during the year), 4 (once a month), 5 (once a week), 6 (more than once a week).
I worked to enhance the school's reputation in the community. 1
I used student performance results to develop the school's educational goals.
I made sure that the professional development activities of teachers were in accordance with the teaching goals of the school.
I ensured that teachers worked according to the school's educational goals.
I promoted teaching practices that were based on educational research.
I praised teachers whose students were actively participating in learning.
When a teacher had problems in his/her classroom, I took the initiative to discuss matters.
I drew teachers' attention to the importance of students' development of critical and social capabilities.
I paid attention to disruptive behavior in classrooms.
I provided staff with opportunities to participate in school decision making.
I engaged teachers to help build a school culture of continuous improvement.
I asked teachers to participate in reviewing management practices.
When a teacher brought up a classroom problem, we solved the problem together.
I discussed the school's academic goals with teachers at faculty meetings.
I referred to the school's academic goals when making curricular decisions with teachers.
I discussed academic performance results with faculty to identify curricular strengths and weaknesses.
I led or attended in-service activities concerned with instruction.
I set aside time at faculty meetings for teachers to share ideas or information from in-service activities.
I conducted informal observations in classrooms on a regular basis (informal observations are unscheduled, last at least 5 minutes, and may or may not involve written feedback or a formal conference).
I reviewed work produced by students when evaluating classroom instruction.
I evaluated the performance of staff.
Leader's perception of schools' goal orientation
Mastery In this school: 1 (not at all true ) to 5 (very true)
The importance of trying hard is really stressed to students.

128
Students are told that making mistakes is OK as long as they are learning and improving.
A lot of the work students do is boring and repetitious.
Students are frequently told that learning should be fun.
The emphasis is on really understanding schoolwork, not just memorizing it.
A real effort is made to recognise students for effort and improvement.
A real effort is made to show students how the work they do in school is related to their lives outside of school.
Performance It’s easy to tell which students get the highest grades and which get the lowest grades.
Students who get good grades are pointed out as an example to others.
Students hear a lot about the importance of getting high test scores.
Grades and test scores are not talked about a lot.
Students hear a lot about the importance of making the honor roll or being recognised at honour assemblies.
Students are encouraged to compete with each other academically.
Responsibility Regarding your school, who has considerable responsibility for the following tasks? (Please check all that apply) 1 (Principal), 2 (Teachers), 3 (School-level governing board), 4 (Local education agency), 5 (State education agency).
Selecting teachers for hire.
Firing teachers.
Establishing teachers' starting salaries.
Determining teachers' salary increases.
Formulating the school budget.
Deciding on budget allocations within the school.
Establishing student assessment policies.
Approving students for admission to the school.
Choosing which textbooks are used.
Determining course content.
Deciding which courses are offered.
Self-efficacy for leaders
In your current role as principal, to what extent can you: 1 (none at all), 3 (very little), 5 (some degree), 7 (quite a bit), 9 (a great deal)
Instructional Motivate teachers.
Generate enthusiasm for a shared vision for the school.
Manage change in your school.

129
Create a positive learning environment in your school.
Facilitate student learning in your school.
Raise student achievement on standardised tests.
Moral leadership Promote acceptable behavior among students
Promote school spirit among a large majority of the student population
Handle effectively the discipline of students in your school.
Promote a positive image of your school with the media.
Promote the prevailing values of the community in your school.
Promote ethical behavior among school personnel.
Teacher enthusiasm Teaching enthusiasm I teach with great enthusiasm.
I really enjoy teaching.
I always enjoy teaching students new things.
I enjoy interacting with students in classes.
It's a pleasure to teach.
Identification with school I like to work in this school. 1 (completely disagree) to 5 (completely agree)
I have a strong sense of belonging to this school.
Being a member of this school gives me a sense of pride.
I enjoy being involved in activities in this school.
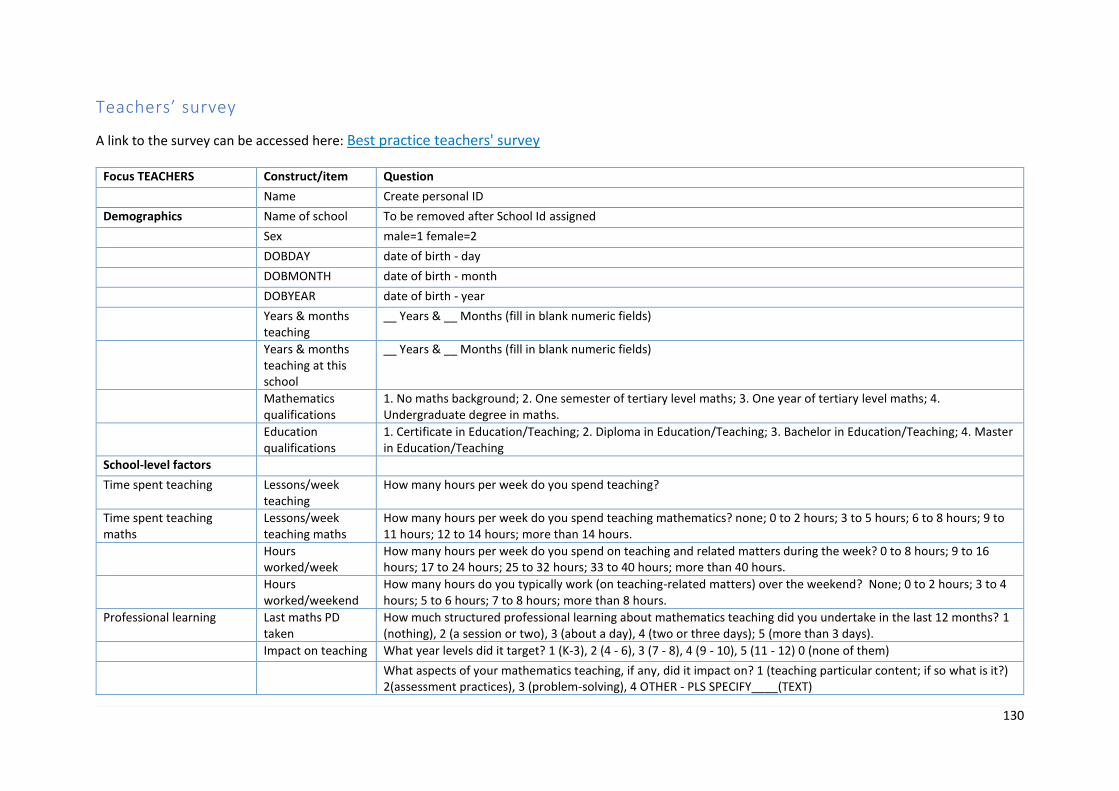
130
Teachers’ survey
A link to the survey can be accessed here: Best practice teachers' survey
Focus TEACHERS Construct/item Question
Name Create personal ID
Demographics Name of school To be removed after School Id assigned
Sex male=1 female=2
DOBDAY date of birth - day
DOBMONTH date of birth - month
DOBYEAR date of birth - year
Years & months teaching
__ Years & __ Months (fill in blank numeric fields)
Years & months teaching at this school
__ Years & __ Months (fill in blank numeric fields)
Mathematics qualifications
1. No maths background; 2. One semester of tertiary level maths; 3. One year of tertiary level maths; 4. Undergraduate degree in maths.
Education qualifications
1. Certificate in Education/Teaching; 2. Diploma in Education/Teaching; 3. Bachelor in Education/Teaching; 4. Master in Education/Teaching
School-level factors
Time spent teaching Lessons/week teaching
How many hours per week do you spend teaching?
Time spent teaching maths
Lessons/week teaching maths
How many hours per week do you spend teaching mathematics? none; 0 to 2 hours; 3 to 5 hours; 6 to 8 hours; 9 to 11 hours; 12 to 14 hours; more than 14 hours.
Hours worked/week
How many hours per week do you spend on teaching and related matters during the week? 0 to 8 hours; 9 to 16 hours; 17 to 24 hours; 25 to 32 hours; 33 to 40 hours; more than 40 hours.
Hours worked/weekend
How many hours do you typically work (on teaching-related matters) over the weekend? None; 0 to 2 hours; 3 to 4 hours; 5 to 6 hours; 7 to 8 hours; more than 8 hours.
Professional learning Last maths PD taken
How much structured professional learning about mathematics teaching did you undertake in the last 12 months? 1 (nothing), 2 (a session or two), 3 (about a day), 4 (two or three days); 5 (more than 3 days).
Impact on teaching What year levels did it target? 1 (K-3), 2 (4 - 6), 3 (7 - 8), 4 (9 - 10), 5 (11 - 12) 0 (none of them)
What aspects of your mathematics teaching, if any, did it impact on? 1 (teaching particular content; if so what is it?) 2(assessment practices), 3 (problem-solving), 4 OTHER - PLS SPECIFY____(TEXT)

131
Teacher perception of schools' goal orientation
Mastery In this school: 1 (not at all true ) to 5 (very true)
The importance of trying hard is really stressed to students.
Students are told that making mistakes is OK as long as they are learning and improving.
A lot of the work students do is boring and repetitious.
Students are frequently told that learning should be fun.
The emphasis is on really understanding schoolwork, not just memorising it.
A real effort is made to recognise students for effort and improvement.
A real effort is made to show students how the work they do in school is related to their lives outside of school.
Performance It’s easy to tell which students get the highest grades and which get the lowest grades.
Students who get good grades are pointed out as an example to others.
Students hear a lot about the importance of getting high test scores.
Grades and test scores are not talked about a lot.
Students hear a lot about the importance of making the honour roll or being recognised at honour assemblies.
Students are encouraged to compete with each other academically.
Communication with parents
In the last four weeks have you contacted any parents regarding their child? Yes/No
If yes, approximately how many times (in total) did this occur?
In the last four weeks have you contacted any parents regarding the mathematical progress of their child? Yes/No
If yes, approximately how many times (in total) did this occur?
School climate Collective efficacy Teachers in this school are able to get through to difficult students.1 (strongly disagree) to 5 (strongly agree).
Teachers here are confident they will be able to motivate their students
Teachers in this school really believe every child can learn.
If a child doesn't want to learn teachers here give up.
Teachers here don't have the skills needed to produce meaningful student learning
These students come to school ready to learn.
Home life provides so many advantages the students here are bound to learn.
Students here just aren't motivated to learn.
The opportunities in this community help ensure that these students will learn.
Learning is more difficult at this school because students are worried about their safety.
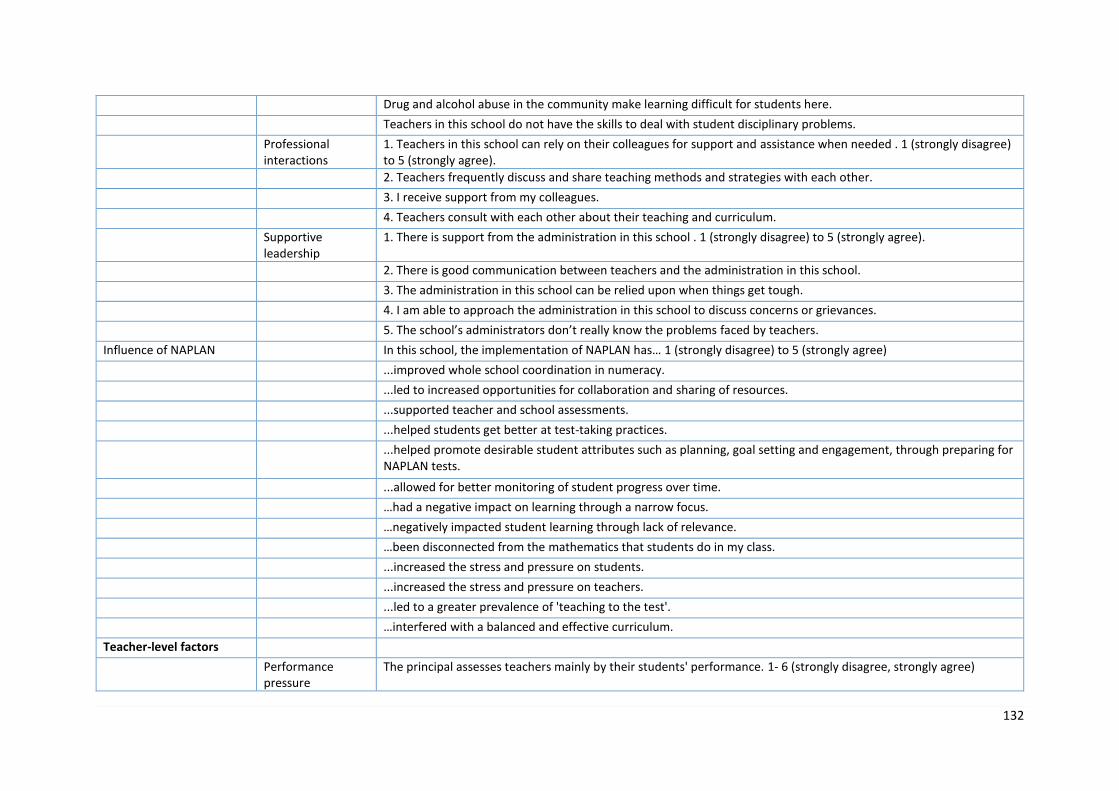
132
Drug and alcohol abuse in the community make learning difficult for students here.
Teachers in this school do not have the skills to deal with student disciplinary problems.
Professional interactions
1. Teachers in this school can rely on their colleagues for support and assistance when needed . 1 (strongly disagree) to 5 (strongly agree).
2. Teachers frequently discuss and share teaching methods and strategies with each other.
3. I receive support from my colleagues.
4. Teachers consult with each other about their teaching and curriculum.
Supportive leadership
1. There is support from the administration in this school . 1 (strongly disagree) to 5 (strongly agree).
2. There is good communication between teachers and the administration in this school.
3. The administration in this school can be relied upon when things get tough.
4. I am able to approach the administration in this school to discuss concerns or grievances.
5. The school’s administrators don’t really know the problems faced by teachers.
Influence of NAPLAN In this school, the implementation of NAPLAN has… 1 (strongly disagree) to 5 (strongly agree)
...improved whole school coordination in numeracy.
...led to increased opportunities for collaboration and sharing of resources.
...supported teacher and school assessments.
...helped students get better at test-taking practices.
...helped promote desirable student attributes such as planning, goal setting and engagement, through preparing for NAPLAN tests.
...allowed for better monitoring of student progress over time.
…had a negative impact on learning through a narrow focus.
…negatively impacted student learning through lack of relevance.
…been disconnected from the mathematics that students do in my class.
...increased the stress and pressure on students.
...increased the stress and pressure on teachers.
...led to a greater prevalence of 'teaching to the test'.
…interfered with a balanced and effective curriculum.
Teacher-level factors
Performance pressure
The principal assesses teachers mainly by their students' performance. 1- 6 (strongly disagree, strongly agree)

133
The principal puts pressure on teachers to achieve high student grades.
The principal creates a climate of pressure and criticism.
The principal often compares our achievements to those of other schools.
Burnout Emotional exhaustion
1 (strongly disagree) to 5 (strongly agree)
Secondary Teachers Only
I feel emotionally drained from my work.
Secondary Teachers Only
I feel used up at the end of the workday
Secondary Teachers Only
I feel fatigued when I get up in the morning and have to face another day on the job
Working with people all day is really a strain for me
Secondary Teachers Only
I feel burned out from my work
I feel frustrated by my job
I feel I’m working too hard on my job
Working with people directly puts too much stress on me
Secondary Teachers Only
I feel like I’m at the end of my rope
Depersonalisation
I feel I treat some students as if they were impersonal ‘objects’
Secondary Teachers Only
I worry that this job is hardening me emotionally
I don’t really care what happens to some students
I feel students blame me for some of their problems
Work satisfaction I look forward to coming to work
I enjoy the challenges I meet at work
Work is satisfying for me
I feel the students learn because of my leadership
I want all students to learn
Homework Frequency expected
How often do you expect your students to do homework? 0 (never), 1 (rarely), 2 (Only when it is necessary), 3 (every week night)
Hours per week How many hours of homework per week do you expect students to do? 1 (none), 2 (less than 2 hours), 3 (More than 2 hours but less than 5 hours), 4 (more than 5 hours but less than 10 hours), 5 (more than 10 hours), 6 (Don't know).

134
Reason HW set Why do you set homework? 1 (it is school policy) 2 (parents expect it to be set), 3 (because I believe it helps them learn), 4 (other): Pls specify___(text)
In regards to the Australian Curriculum Mathematics (ACM), how knowledgeable are you about its:
Knowledge of ACM Content descriptors
....content descriptors? 1 (not at all knowledgeable), 5 (very knowledgeable)
Proficiency strands ...proficiency strands? 1 (not at all knowledgeable), 5 (very knowledgeable)
Assessment ...assessment requirements? 1 (not at all knowledgeable), 5 (very knowledgeable)
Impact of ACM To what exent is the planning of your maths lessons influenced by the ACM's… 1 (not at all) to 5 (very much).
Impact of ACM Content descriptors
...content descriptors? 1 (not at all) to 5 (very much).
Proficiency strands ...proficiency strands? 1 (not at all) to 5 (very much).
Assessment ...assessment requirements? 1 (not at all) to 5 (very much).
Approaches to instruction Mastery I make a special effort to recognise students’ individual progress, even if they are below grade level.1 (not at all true) to 5 (very true)
During class, I often provide several activities so that students can choose among them.(not at all true) to 5 (very true)
I consider how much students have improved when I give them report card grades.(not at all true) to 5 (very true)
I give a wide range of assignments, matched to students' needs and skill level.(not at all true) to 5 (very true)
Performance I give special privileges to students who do the best work.(not at all true) to 5 (very true)
I display the work of the highest achieving students as an example.(not at all true) to 5 (very true)
I help students understand how their performance compares to others.(not at all true) to 5 (very true)
I encourage students to compete with each other.(not at all true) to 5 (very true)
I point out those students who do well as a model for the other students.(not at all true) to 5 (very true)
Teachers' goal orientation I would feel that I had a successful day at school if: 1 (strongly disagree) to 5 (strongly agree).
Ability approach 1. The principal commended me for having a higher teaching ability than most of my colleagues.
2. My classes did better than those of other teachers on an exam.
3. The principal said I was one of his or her best teachers.
4. In a comparison of lesson plans, mine was considered the best.
Mastery approach 5. I learned something new about teaching or myself as a teacher.
6. After finishing a class I wanted to learn more about the topic that had been taught.
7. One of my pupil's questions really made me think.

135
8. I saw that I was developing professionally and teaching more effectively than in the past.
Ability avoidance 9. None of my students asked me a question that I couldn't do.
10. My class did no worse than those of other teachers in an exam.
11. The principal did not identify me as one of his or her low performing teachers.
12. At a staff meeting none of my classes were identified as being furthest behind.
Work avoidance 13. Some of my classes were cancelled because students were on a school trip.
14. The material was easy and I did not have to prepare lessons.
15. I was able to get through the day without working too hard.
16. I didn't have to do or take home any marking.
Relational 1 (strongly disagree) to 5 (strongly agree).
I would feel most successful as a teacher if I saw that I was developing closer and better relationships with my students.
My main goal as a teacher is to show my students that I care about them.
More than anything, I aspire to create deep personal relationships with each and every student.
As a teacher, building relationships with students is most important for me.
Teacher's views of intelligence
Incremental You have a certain amount of intelligence and really can't do much to change it. 1 (strongly disagree) to 6 (strongly agree)
Entity Your intelligence is something about you that can't change very much.
You can learn new things but you can't really change your basic intelligence.
Teacher confidence Confidence Please rate your confidence to teach mathematics at the grade levels that you teach. 1 Not at all confident -> 5 Completely confident
Class composition Ability grouping Are mathematics classes in your school grouped by student ability? 1 (none), 2 (some), 3 (all).
Are English classes in your school grouped by student ability? 1 (none), 2 (some), 3 (all).
Teacher practices Student engagement
From the list below, rate how much you believe each contributes to increased student engagement in mathematics (1=not at all, 7=extremely)
a) Playing maths games (including computer games)
b) Teacher giving clear explanations
c) Students explaining their own thinking (either verbally or written)
d) Students listening to and questioning other students’ thinking
e) Students have opportunities to work in groups
f) Positive reinforcement (smiles, encouraging words)
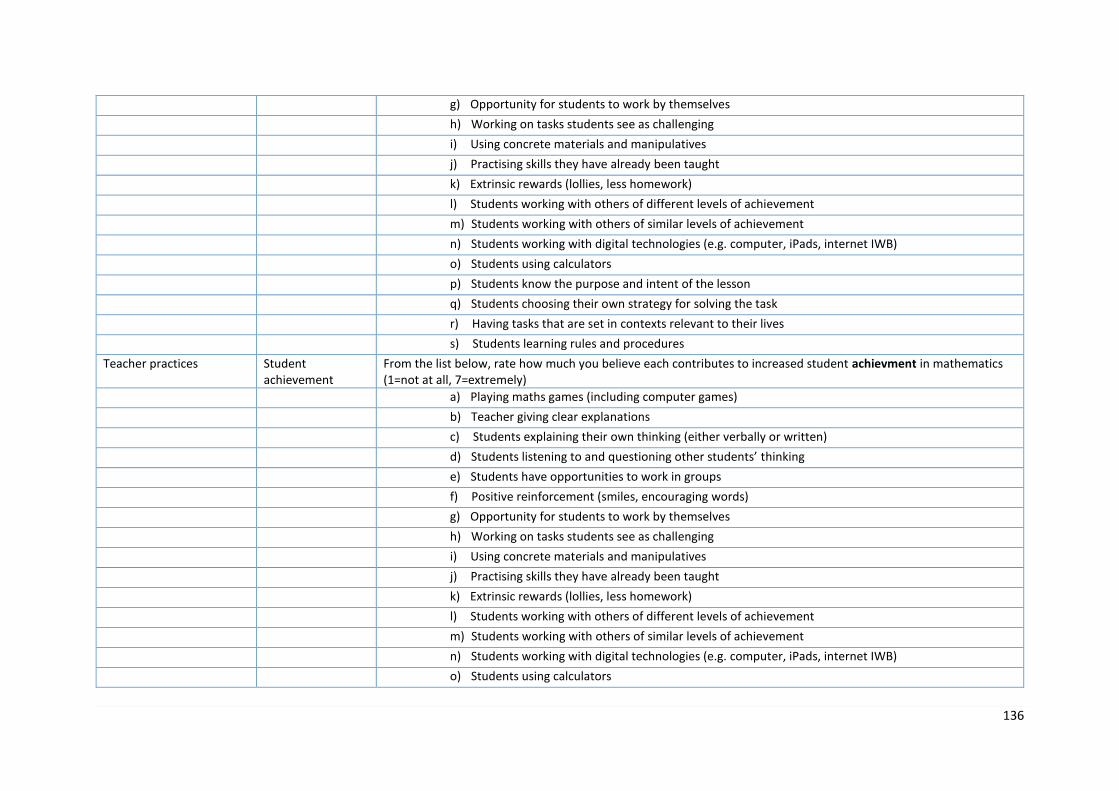
136
g) Opportunity for students to work by themselves
h) Working on tasks students see as challenging
i) Using concrete materials and manipulatives
j) Practising skills they have already been taught
k) Extrinsic rewards (lollies, less homework)
l) Students working with others of different levels of achievement
m) Students working with others of similar levels of achievement
n) Students working with digital technologies (e.g. computer, iPads, internet IWB)
o) Students using calculators
p) Students know the purpose and intent of the lesson
q) Students choosing their own strategy for solving the task
r) Having tasks that are set in contexts relevant to their lives
s) Students learning rules and procedures
Teacher practices Student achievement
From the list below, rate how much you believe each contributes to increased student achievment in mathematics (1=not at all, 7=extremely)
a) Playing maths games (including computer games)
b) Teacher giving clear explanations
c) Students explaining their own thinking (either verbally or written)
d) Students listening to and questioning other students’ thinking
e) Students have opportunities to work in groups
f) Positive reinforcement (smiles, encouraging words)
g) Opportunity for students to work by themselves
h) Working on tasks students see as challenging
i) Using concrete materials and manipulatives
j) Practising skills they have already been taught
k) Extrinsic rewards (lollies, less homework)
l) Students working with others of different levels of achievement
m) Students working with others of similar levels of achievement
n) Students working with digital technologies (e.g. computer, iPads, internet IWB)
o) Students using calculators
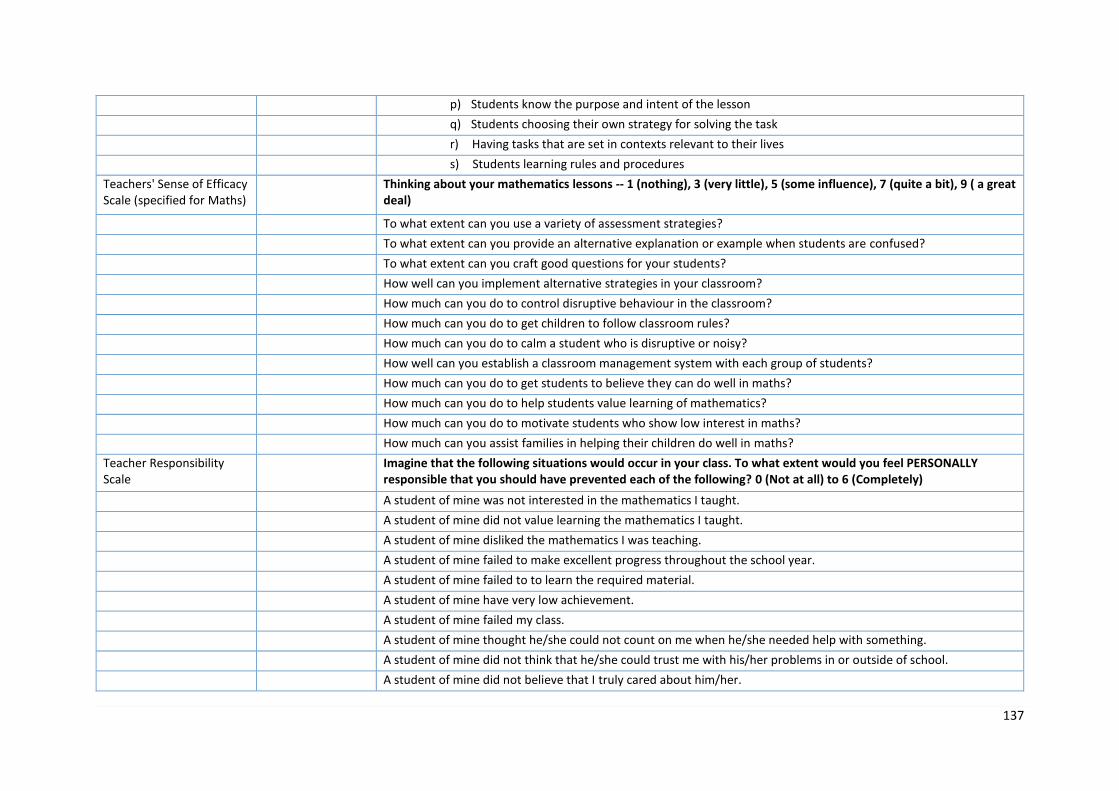
137
p) Students know the purpose and intent of the lesson
q) Students choosing their own strategy for solving the task
r) Having tasks that are set in contexts relevant to their lives
s) Students learning rules and procedures
Teachers' Sense of Efficacy Scale (specified for Maths)
Thinking about your mathematics lessons -- 1 (nothing), 3 (very little), 5 (some influence), 7 (quite a bit), 9 ( a great deal)
To what extent can you use a variety of assessment strategies?
To what extent can you provide an alternative explanation or example when students are confused?
To what extent can you craft good questions for your students?
How well can you implement alternative strategies in your classroom?
How much can you do to control disruptive behaviour in the classroom?
How much can you do to get children to follow classroom rules?
How much can you do to calm a student who is disruptive or noisy?
How well can you establish a classroom management system with each group of students?
How much can you do to get students to believe they can do well in maths?
How much can you do to help students value learning of mathematics?
How much can you do to motivate students who show low interest in maths?
How much can you assist families in helping their children do well in maths?
Teacher Responsibility Scale
Imagine that the following situations would occur in your class. To what extent would you feel PERSONALLY responsible that you should have prevented each of the following? 0 (Not at all) to 6 (Completely)
A student of mine was not interested in the mathematics I taught.
A student of mine did not value learning the mathematics I taught.
A student of mine disliked the mathematics I was teaching.
A student of mine failed to make excellent progress throughout the school year.
A student of mine failed to to learn the required material.
A student of mine have very low achievement.
A student of mine failed my class.
A student of mine thought he/she could not count on me when he/she needed help with something.
A student of mine did not think that he/she could trust me with his/her problems in or outside of school.
A student of mine did not believe that I truly cared about him/her.

138
A lesson I taught failed to reflect my highest ability as a teacher.
A lesson I taught was not as effective for student learning as I could have possibly made it.
A lesson I taught was not as engaging for students as I could have possibly made it.
Teacher enthusiasm Subject enthusiasm
Even now, I am still enthusiastic about mathematics.
I find mathematics exciting and try to convey my enthusiasm to students.
Engaging in mathematics is one of my favourite activities.
I engage in mathematics because I enjoy it.
Because engaging in mathematics is fun, I wouldn't want to give it up.
Teaching enthusiasm
I teach mathematics with great enthusiasm
I really enjoy teaching mathematics.
I always enjoy teaching students new things in maths.
I enjoy interacting with students in maths classes.
It's a pleasure to teach mathematics.
Instructional practices Promotion of surface learning
In order to consolidate a newly taught procedure in maths, I set a lot of tasks that are only slightly different from the initial one. 1 (not true at all) to 4 (absolutely true).
I let students work on as many tasks as possible independently and quietly during the lesson in order to consolidate a newly taught mathematical procedure or concept.
I let students solve as many tasks as possible from a textbook or worksheet in order to reinforce a newly taught procedure or concept.
I make students repeat rules and formulas so that they become sure of them.
Comprehensive learning
If students make a mistake when working on a new topic, I first accept their suggestions without comment, and then later follow up on the consequences with them until their mistake becomes obvious.
I sometimes consciously mislead students until they notice that something is not right.
I act on students' mathematical misconceptions and run through the consequences of these until the students recognise striking inconsistencies.
Discipline I attach importance to doing things absolutely quietly in maths lessons.
When taking a class, I commence by making it unmistakably clear which rules must be kept in the lesson.
When I enter a classroom, the lesson starts immediately and quietly.
Social orientation I discuss general or current topics with the students even if the subject matter has to take a back seat.

139
Personal relationships are more important to me than progressing quickly with the learning material.
I also take time for personal and social matters in lessons.
Secondary (older) students’ survey
A link to the survey can be accessed here: Best practice secondary (older) students' survey
Construct/item Stem (if applicable) Question Response options
ID 4-DIGIT NUMERIC
MCLASS 4-DIGIT NUMERIC
MTEACHER 4-DIGIT NUMERIC
SCHOOL Write the name of your school in the box TEXT
SCHOOL_PCODE Write the postcode of your school in the box 4-DIGIT NUMERIC
GENDER gender 1 = boy 2 = girl
DOBDAY date of birth - day 2-DIGIT NUMERIC
DOBMONTH date of birth - month 2-DIGIT NUMERIC
DOBYEAR date of birth - year 2-DIGIT NUMERIC
BIRTHCOUNTRY What country were you born in? Drop down menu
HOMELANG What language is mostly spoken at home? TEXT
MUMBIRTH about your mother What country was she born in? Drop down menu
MEDN What level of education does she have? 1 = university 2 = college or TAFE 3 = completed high school 4 = partly completed high school 5 = don't know
DADBIRTH about your father What country was he born in? Drop down menu
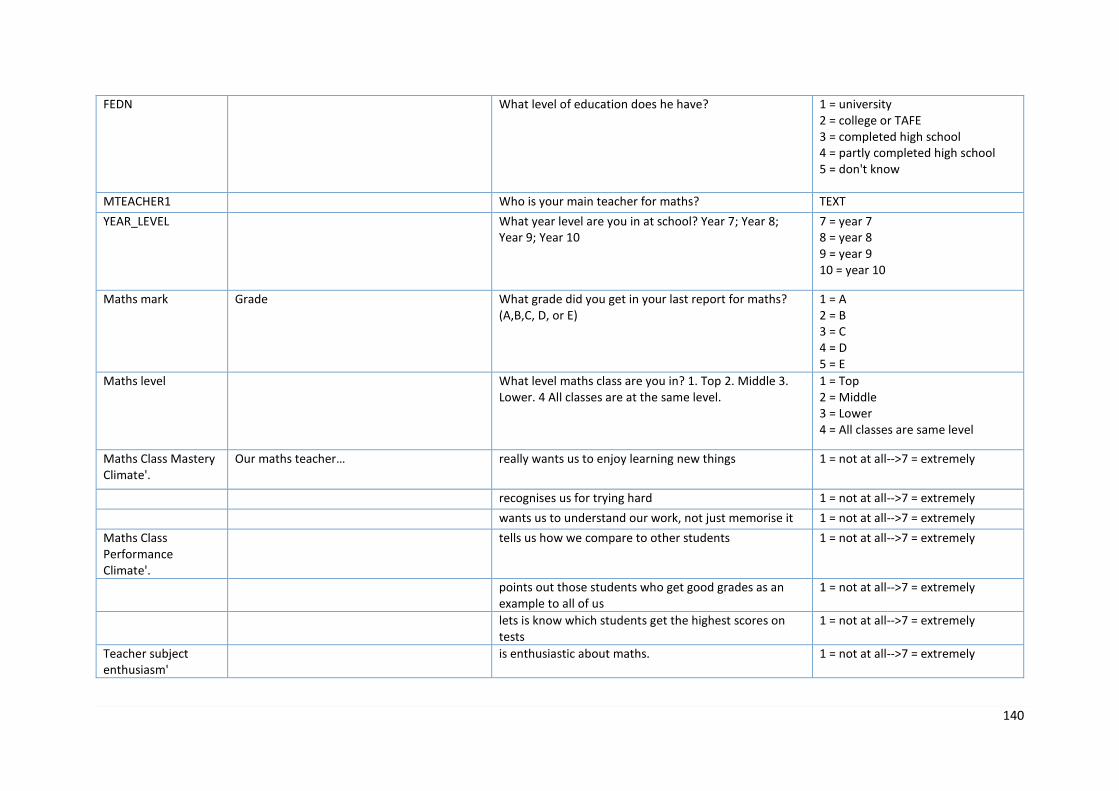
140
FEDN What level of education does he have? 1 = university 2 = college or TAFE 3 = completed high school 4 = partly completed high school 5 = don't know
MTEACHER1 Who is your main teacher for maths? TEXT
YEAR_LEVEL What year level are you in at school? Year 7; Year 8; Year 9; Year 10
7 = year 7 8 = year 8 9 = year 9 10 = year 10
Maths mark Grade What grade did you get in your last report for maths? (A,B,C, D, or E)
1 = A 2 = B 3 = C 4 = D 5 = E
Maths level What level maths class are you in? 1. Top 2. Middle 3. Lower. 4 All classes are at the same level.
1 = Top 2 = Middle 3 = Lower 4 = All classes are same level
Maths Class Mastery Climate'.
Our maths teacher… really wants us to enjoy learning new things 1 = not at all-->7 = extremely
recognises us for trying hard 1 = not at all-->7 = extremely
wants us to understand our work, not just memorise it 1 = not at all-->7 = extremely
Maths Class Performance Climate'.
tells us how we compare to other students 1 = not at all-->7 = extremely
points out those students who get good grades as an example to all of us
1 = not at all-->7 = extremely
lets is know which students get the highest scores on tests
1 = not at all-->7 = extremely
Teacher subject enthusiasm'
is enthusiastic about maths. 1 = not at all-->7 = extremely

141
finds maths exciting 1 = not at all-->7 = extremely
finds maths one of her/his favourite activities. 1 = not at all-->7 = extremely
engages in maths because s/he enjoys it. 1 = not at all-->7 = extremely
finds maths fun, and wouldn't want to give it up. 1 = not at all-->7 = extremely
Teacher maths teaching enthusiasm
teaches maths with great enthusiasm 1 = not at all-->7 = extremely
really enjoys teaching maths. 1 = not at all-->7 = extremely
always enjoys teaching us new things in maths. 1 = not at all-->7 = extremely
enjoys interacting with us in maths classes. 1 = not at all-->7 = extremely
finds it a pleasure to teach maths. 1 = not at all-->7 = extremely
Peers Maths Views' This section is about what your friends think about maths
My friends find working on maths assignments boring 1 (strongly disagree) 7 (strongly agree).
My friends are interested in maths. 1 (strongly disagree) 7 (strongly
agree).
My friends like maths more than other subjects. 1 (strongly disagree) 7 (strongly agree).
My friends wish that they were doing something else when they do maths.
1 (strongly disagree) 7 (strongly agree).
NAPLAN Think back to May this year (or last year), when you did the NAPLAN maths tests and answer the following questions.
1. We did a lot of practice maths questions in class before the NAPLAN test.
1 (strongly disagree) 7 (strongly agree).
2. The maths questions covered in the NAPLAN test were different to the work we normally cover in maths classes.
1 (strongly disagree) 7 (strongly agree).
3. Doing the NAPLAN test was quite stressful for me. 1 (strongly disagree) 7 (strongly agree).
4. I was uptight before the NAPLAN test. 1 (strongly disagree) 7 (strongly agree).
Homework How often does your maths teacher assign maths homework?
1 = never-->7 = every class

142
How many hours do you spend on maths homework?
On weekdays 1 = I don't do homework 2 = A few minutes 3 = About half an hour 4 = About an hour 5 = More than one hour
On weekends 1 = I don't do homework 2 = A few minutes 3 = About half an hour 4 = About an hour 5 = More than one hour
Maths Cost - Effort'. Please click on the button that best describes what you think about maths.
When I think about the hard work needed to get through in maths, I am not sure that it is going to be worth it in the end.
1 = strongly disagree -->7 = strongly agree
Considering what I want to do with my life, studying maths is just not worth the effort
1 = strongly disagree -->7 = strongly agree
Achieving in maths sounds like it really requires more effort than I'm willing to put into it.
1 = strongly disagree -->7 = strongly agree
Maths Cost - Psychological'.
It frightens me that maths courses are harder that other courses
1 = strongly disagree -->7 = strongly agree
I'm concerned that I won't be able to handle the stress
that goes along with studying maths 1 = strongly disagree -->7 = strongly agree
Maths Cost - Social'. I'm concerned that working hard in maths classes might mean I lose some of my close friends
1 = strongly disagree -->7 = strongly agree
I worry about losing some vauable friendships if I'm
studying maths and my friends are not 1 = strongly disagree -->7 = strongly agree
Maths Difficulty'. To what extent do you consider maths to be a tough subject?
1 = not at all-->7 = extremely
How complicated is maths for you? 1 = not at all-->7 = extremely
Compared to most other students in your class, how difficult do you think maths is?
1 = not at all-->7 = extremely
Maths Effort Exerted'.
How hard do you work at maths? 1 = not at all-->7 = extremely

143
How much effort do you put into maths? 1 = not at all-->7 = extremely
Maths self-concept (talent)'
Compared with other students in your Year, how talented do you consider yourself to be at maths?
1 = not at all-->7 = extremely
Compared with your friends, how talented do you consider yourself to be at maths?
1 = not at all-->7 = extremely
Compared with other subjects at school, how talented do you consider yourself to be at maths?
1 = not at all-->7 = extremely
Maths behavioural interest/engagement.
Making an effort in maths is worth it because this will help me in the work I want to do later on.
1 = not at all-->7 = extremely
What I learn in maths is important for me because I need this for what I want to study later on.
1 = not at all-->7 = extremely
I study maths because I know it is useful for me. 1 = not at all-->7 = extremely
Studying maths is worthwhile for me because what I learn will improve my career prospects
1 = not at all-->7 = extremely
I will learn many things in maths that will help me get a job
1 = not at all-->7 = extremely
Maths emotional interest/engagement.
I like maths more than other subjects. 1 = not at all-->7 = extremely
I find maths interesting. 1 = not at all-->7 = extremely
I find maths enjoyable. 1 = not at all-->7 = extremely
Maths cognitive interest/engagement
After a math class, I am often curious about what we are going to do in the next lesson.
1 = not at all-->7 = extremely
I would like to find out more about some of the things we deal with in our maths class.
1 = not at all-->7 = extremely
I want to know all about maths. 1 = not at all-->7 = extremely
Maths Attainment Value'.
Being someone who is good at maths is important to me.
1 = not at all-->7 = extremely
Being good at maths is an important part of who I am. 1 = not at all-->7 = extremely
It is important for me to be someone who is good at solving maths problems.
1 = not at all-->7 = extremely

144
Maths Sex-typing. These questions are about boys and girls doing maths
Are boys better than girls at maths? 1 = boys better --> 4 = equally --> 7 = girls better
Do boys or girls work harder in maths? 1 = boys better --> 4 = equally --> 7 = girls better
How gifted are boys compared with girls at maths? 1 = boys better --> 4 = equally --> 7 = girls better
Do other people think boys are better than girls at maths?
1 = boys better --> 4 = equally --> 7 = girls better
Personal mastery goal
It’s important to me that I learn a lot of new concepts this year in maths.
1 = not at all true --> 3 = somewhat true --> 5 = very true
One of my goals in maths is to learn as much as I can. 1 = not at all true --> 3 = somewhat
true --> 5 = very true
One of my goals in maths is to master a lot of new skills this year.
1 = not at all true --> 3 = somewhat true --> 5 = very true
It’s important to me that I thoroughly understand my maths.
1 = not at all true --> 3 = somewhat true --> 5 = very true
It’s important to me that I improve my skills in maths this year.
1 = not at all true --> 3 = somewhat true --> 5 = very true
Personal performance approach goal'
It’s important to me that other students in my class think I am good at maths.
1 = not at all true --> 3 = somewhat true --> 5 = very true
One of my goals is to show others that I’m good at maths.
1 = not at all true --> 3 = somewhat true --> 5 = very true
One of my goals is to show others that maths work is easy for me.
1 = not at all true --> 3 = somewhat true --> 5 = very true
One of my goals is to look smart in comparison to the other students in maths.
1 = not at all true --> 3 = somewhat true --> 5 = very true
It’s important to me that I look smart compared to
others in maths. 1 = not at all true --> 3 = somewhat true --> 5 = very true

145
Personal performance avoidance goal'
It’s important to me that I don’t look stupid in maths lessons.
1 = not at all true --> 3 = somewhat true --> 5 = very true
One of my goals is to keep others from thinking I’m not smart in maths classes.
1 = not at all true --> 3 = somewhat true --> 5 = very true
It’s important to me that my teacher doesn’t think that I know less than others in maths.
1 = not at all true --> 3 = somewhat true --> 5 = very true
One of my goals in maths lessons is to avoid looking like
I have trouble doing the work. 1 = not at all true --> 3 = somewhat true --> 5 = very true
Student mindset Incremental You have a certain amount of intelligence and really can't do much to change it.
1 (strongly disagree) to 6 (strongly agree)
Entity Your intelligence is something about you that can't change very much.
1 (strongly disagree) to 6 (strongly agree)
You can learn new things but you can't really change your basic intelligence.
1 (strongly disagree) to 6 (strongly agree)
School caring These questions are about your school. The teachers here respect me 1 = not at all true -->7 = completely true
Most teachers at this school are interested in me 1 = not at all true -->7 = completely true
There's at least one teacher or other adult in this school I can talk to if I have a problem
1 = not at all true -->7 = completely true
Teachers here are not interested in people like me 1 = not at all true -->7 = completely true
Your maths teacher's views about you How talented does you teacher think you are at maths? 1 = not at all-->7 = extremely
How well does your teacher expect you to do at maths in high school?
1 = not at all-->7 = extremely
How difficult does your teacher think you find maths? 1 = not at all-->7 = extremely
How much effort does your teacher think you need to put into maths in order to do well?
1 = not at all-->7 = extremely
How interested does your teacher think you are in maths?
1 = not at all-->7 = extremely

146
How useful does your teacher believe maths is? 1 = not at all-->7 = extremely
How high in prestige/status does your teacher think maths is, compared with other school subjects?
1 = not at all-->7 = extremely
Does your teacher think maths is more suited to males? 1 = not at all-->7 = extremely
How well do you and your teacher relate to each other? 1 = not at all-->7 = extremely
Student attitudes to school
These questions are about how you feel about school.
I feel overwhelmed by my schoolwork 1 2 3 4 5 6: Completely disagree, Partly disagree, Disagree, Partly agree, Agree, Completely agree
I often sleep badly because of matters related to my schoolwork.
1 2 3 4 5 6: Completely disagree, Partly disagree, Disagree, Partly agree, Agree, Completely agree
I brood over matters related to my schoolwork a lot during my free time
1 2 3 4 5 6: Completely disagree, Partly disagree, Disagree, Partly agree, Agree, Completely agree
The pressure of my schoolwork causes me problems in my close relationships with others
1 2 3 4 5 6: Completely disagree, Partly disagree, Disagree, Partly agree, Agree, Completely agree
I feel a lack of motivation in my schoolwork and often think of giving up
1 2 3 4 5 6: Completely disagree, Partly disagree, Disagree, Partly agree, Agree, Completely agree
I feel that I am losing interest in my schoolwork 1 2 3 4 5 6: Completely disagree, Partly disagree, Disagree, Partly agree, Agree, Completely agree
I’m continually wondering whether my schoolwork has any meaning
1 2 3 4 5 6: Completely disagree, Partly disagree, Disagree, Partly agree, Agree, Completely agree
I often have feelings of inadequacy in my schoolwork 1 2 3 4 5 6: Completely disagree, Partly disagree, Disagree, Partly agree, Agree, Completely agree

147
I used to have higher expectations of my schoolwork than I do now
1 2 3 4 5 6: Completely disagree, Partly disagree, Disagree, Partly agree, Agree, Completely agree
CAREER How much would you like to have a maths-related career?
1 = not at all-->7 = extremely
MCAREERWHY Why/why not? TEXT
CDECISION Have you decided what career you plan to pursue? 2 = yes 1 = somewhat 0 = no
CAREER What job would you like to have in the future? TEXT
CAREERWHY Why would you like to have this job? TEXT

148
Primary (younger) students’ survey
A link to the survey can be accessed here: Best practice primary (younger) students' survey
Focus primary students
Construct/item Question Response options
Unique numeric identifier created
ID 4-DIGIT NUMERIC
MCLASS 4-DIGIT NUMERIC
MTEACHER 4-DIGIT NUMERIC
SCHOOL Write the name of your school in the box TEXT
SCHOOL_PCODE Write the postcode of your school in the box 4-DIGIT NUMERIC
These questions are about you.
GENDER gender 1 = boy
2 = girl
DOBDAY date of birth - day 2-DIGIT NUMERIC
DOBMONTH date of birth - month 2-DIGIT NUMERIC
DOBYEAR date of birth - year 2-DIGIT NUMERIC
BIRTHCOUNTRY What country were you born in? Drop down menu
HOMELANG What language is mostly spoken at home? TEXT
Maths class
MTEACHER1 Who is your main teacher for maths? TEXT
YEAR_LEVEL What year level are you in at school? 3 = year 3 4 = year 4 5 = year 5 6 = year 6
Maths_mark What grade did you get in your last report for maths? (A,B,C, D, or E)
1 = A 2 = B 3 = C 4 = D

149
5 = E
Mastery classroom environment'
Our maths teacher… really wants us to enjoy learning new things 1 = not at all-->7 = extremely
recognises us for trying hard 1 = not at all-->7 = extremely
wants us to understand our maths, not just memorise it
1 = not at all-->7 = extremely
Performance classroom environment'
tells us how we compare to other students 1 = not at all-->7 = extremely
points out those students who get good grades as an example
1 = not at all-->7 = extremely
lets us know which students get the highest scores
1 = not at all-->7 = extremely
Teacher enthusiasm -
teaches maths with great enthusiasm 1 = not at all-->7 = extremely
really enjoys teaching maths 1 = not at all-->7 = extremely
likes teaching us new things in maths 1 = not at all-->7 = extremely
enjoys talking with us in maths classes 1 = not at all-->7 = extremely
thinks it's fun to teach maths 1 = not at all-->7 = extremely
teaches maths with great enthusiasm 1 = not at all-->7 = extremely
always enjoys teaching us new things in maths.
1 = not at all-->7 = extremely
enjoys interacting with us in maths classes. 1 = not at all-->7 = extremely
finds it a pleasure to teach maths. 1 = not at all-->7 = extremely
School caring environment
These questions are about your school. The teachers here respect me 1 = not at all true -->7 = completely true
Most teachers at this school are interested in me
1 = not at all true -->7 = completely true

150
There's at least one teacher or other adult in this school I can talk to if I have a problem
1 = not at all true -->7 = completely true
NAPLAN Think back to May this year (or last year), when you did the NAPLAN maths tests and answer the following questions.
1. We did a lot of practice maths questions in class before the NAPLAN test.
1 ( strongly disagree) -> 7 (strongly agree).
2. The maths questions covered in the NAPLAN test were different to the work we normally cover in maths classes.
1 ( strongly disagree) -> 7 (strongly agree).
3. Doing the NAPLAN test was quite stressful for me.
1 ( strongly disagree) -> 7 (strongly agree).
4. I was uptight before the NAPLAN test. 1 ( strongly disagree) -> 7 (strongly agree).
How often does your maths teacher assign maths homework?
1 = never-->7 = every class
Homework How many hours do you spend on maths homework? On weekdays 1 = I don't do homework 2 = A few minutes 3 = About half an hour 4 = About an hour 5 = More than one hour
On weekends 1 = I don't do homework 2 = A few minutes 3 = About half an hour 4 = About an hour 5 = More than one hour
Maths motivations & perceptions
*Maths costs Mathematics difficulty Maths is difficult for me. 1 ( strongly disagree) -> 7 (strongly agree).
I find maths more difficult than other people in my year.
1 ( strongly disagree) -> 7 (strongly agree).
Mathematics effort I work hard in maths. 1 ( strongly disagree) -> 7 (strongly agree).

151
I try hard to do maths. 1 ( strongly disagree) -> 7 (strongly agree).
Mathematics talent I think I am gifted in maths compared with my class.
1 ( strongly disagree) -> 7 (strongly agree).
I think I am gifted in maths compared to my friends.
1 ( strongly disagree) -> 7 (strongly agree).
I think I am more gifted in maths than I am at other subjects.
1 ( strongly disagree) -> 7 (strongly agree).
Emotional interest/engagement I like maths more than my other subjects at school,
1 = not at all-->7 = extremely
I find maths interesting. 1 = not at all-->7 = extremely
I enjoy maths. 1 = not at all-->7 = extremely
Cogntive interest/engagement After a maths class, I am curious about what we are going to do in the next lesson
1 = not at all-->7 = extremely
I want to know all about maths. 1 = not at all-->7 = extremely
I would like to find out more about some of the things we deal with maths.
1 = not at all-->7 = extremely
Maths values Behavioural interest/engagement Working hard in maths is worth it because it will help me later on in life.
1 = not at all-->7 = extremely
Learning maths is important because I will need it for later study at school.
1 = not at all-->7 = extremely
I study maths because I know it is useful for
me. 1 = not at all-->7 = extremely
Studying maths is worthwhile because it will help me get a better job.
1 = not at all-->7 = extremely
A lot of the things I learn in maths will help me get a job.
1 = not at all-->7 = extremely
Attainment value Being good at maths is important to me. 1 = not at all-->7 = extremely
Being good at maths is an important part of who I am.
1 = not at all-->7 = extremely
It is important for me to be good at solving mathematical problems.
1 = not at all-->7 = extremely
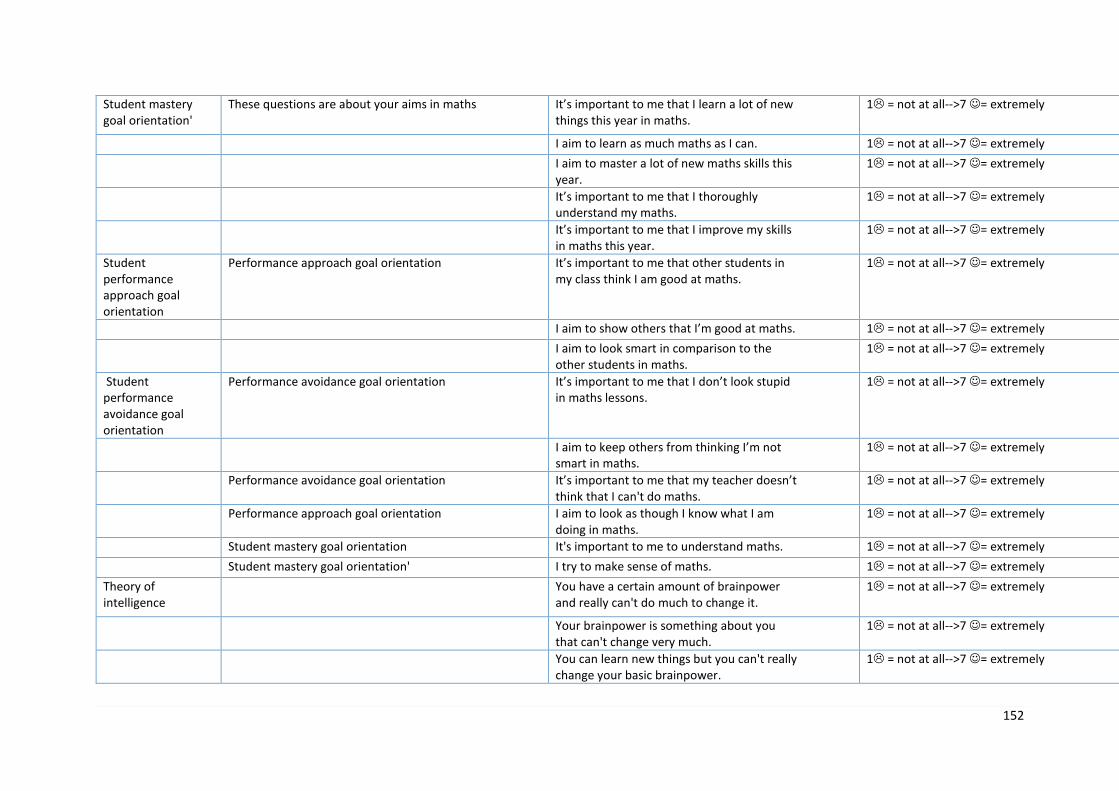
152
Student mastery goal orientation'
These questions are about your aims in maths It’s important to me that I learn a lot of new things this year in maths.
1 = not at all-->7 = extremely
I aim to learn as much maths as I can. 1 = not at all-->7 = extremely
I aim to master a lot of new maths skills this year.
1 = not at all-->7 = extremely
It’s important to me that I thoroughly understand my maths.
1 = not at all-->7 = extremely
It’s important to me that I improve my skills in maths this year.
1 = not at all-->7 = extremely
Student performance approach goal orientation
Performance approach goal orientation It’s important to me that other students in my class think I am good at maths.
1 = not at all-->7 = extremely
I aim to show others that I’m good at maths. 1 = not at all-->7 = extremely
I aim to look smart in comparison to the other students in maths.
1 = not at all-->7 = extremely
Student performance avoidance goal orientation
Performance avoidance goal orientation It’s important to me that I don’t look stupid in maths lessons.
1 = not at all-->7 = extremely
I aim to keep others from thinking I’m not smart in maths.
1 = not at all-->7 = extremely
Performance avoidance goal orientation It’s important to me that my teacher doesn’t think that I can't do maths.
1 = not at all-->7 = extremely
Performance approach goal orientation I aim to look as though I know what I am doing in maths.
1 = not at all-->7 = extremely
Student mastery goal orientation It's important to me to understand maths. 1 = not at all-->7 = extremely
Student mastery goal orientation' I try to make sense of maths. 1 = not at all-->7 = extremely
Theory of intelligence
You have a certain amount of brainpower and really can't do much to change it.
1 = not at all-->7 = extremely
Your brainpower is something about you that can't change very much.
1 = not at all-->7 = extremely
You can learn new things but you can't really change your basic brainpower.
1 = not at all-->7 = extremely

153
Maths sex-typing Are boys better than girls at maths? 1 = boys better --> 4 = equally --> 7 = girls better
Do boys or girls work harder in maths? 1 = boys better --> 4 = equally --> 7 = girls better
How gifted are boys compared with girls at maths?
1 = boys better --> 4 = equally --> 7 = girls better
Do other people think boys are better than girls at maths?
1 = boys better --> 4 = equally --> 7 = girls better

154
A3. Case study instruments

155
Building an Evidence Base for National Best Practice in Mathematics Education
Instructions for Conducting a Case Study for Case Study Researchers (CSR)
Before the school visit Contact your Hub Research Assistant (RA), who will provide you with the scheduled date and time of visit, your school contact person and any information pertinent to your case study school and visit. The school will have been sent an information pack which contains information sheets, consent forms and a school permission form. They will have also been sent out a link to an online survey to complete. When visiting Take with you:
The individual system’s approval letter which will be provided to you by your Hub RA.
Working with children/good character check or equivalent.
This pack which contains spare information and consent forms and information about undertaking the research.
Process:
On arrival, notify school office and meet with contact person (this name will be provided by the Hub RA).
Before commencing interviews, check that participants have signed a consent form. If necessary, use the forms in your pack. Collect signed forms.
Conduct interviews:
Principal (1)
Curriculum leader/mathematics coordinator (1)
Teachers (as organised by the school)
Conduct classroom observation(s) (1–2 classes, as organised by the school)
Facilitate focus groups
Student (1 focus group of 4–6 students)
Parent (1 focus group of 4–6 participants) – Optional.
On leaving: Remind the school representative about the survey link and thank the school for its cooperation and time. For any other questions, refer the school to the Hub RA. Post visit
As soon as possible after the visit, send the completed report and all notes and raw data including audio files to the hub coordinator. This may include:
All participant consent forms
Field Notes
Completed reporting template
All audio tapes and any transcriptions
Hard copies of any other material (if relevant) Use the pre-paid envelope provided to send any hard copy materials to your hub and send electronic copies where relevant.

156
Building an Evidence Base for National Best Practice in Mathematics Education
CASE STUDY REPORT TEMPLATE
School:
Location:
Dates:
Case Study Reporter:
NB: This document should be no more than 5–6 pages in length.
Context/Background School physical environment; general information such as school mission, history; size of school; public statements of curriculum approach; perception of social environment
Policy level (What characterises policy contexts in mathematics in schools with high NAPLAN numeracy results?) Attitudes to achievement/performance (both Naplan and non-Naplan); Direction wrt approaches/practices/pedagogies; degree of school autonomy; perspectives on “latest trends”; broader state/national/international influences; assessment
School level (What characterises schools with high NAPLAN numeracy results?) Nature of school leadership (Whole school, department, other); Structures and organisation including hours of maths; Programs and policy including assessment and reporting, curriculum; Professional learning; Community involvement; influence of scale (size); Staffing, staff turnover, out-of-field teaching; School climate/culture/shared values, collective efficacy; Resourcing; Attendance to health and well-being (also hours worked, weekdays and weekends); Degree of teacher autonomy; homework; assessment
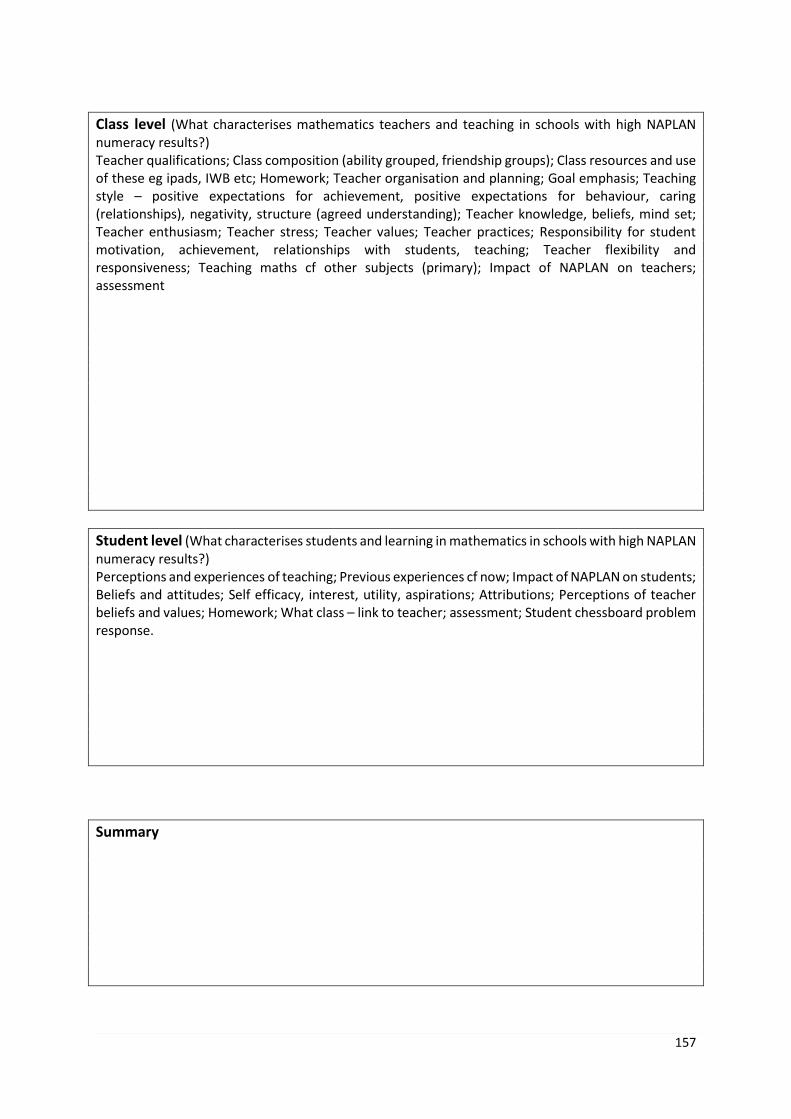
157
Class level (What characterises mathematics teachers and teaching in schools with high NAPLAN numeracy results?) Teacher qualifications; Class composition (ability grouped, friendship groups); Class resources and use of these eg ipads, IWB etc; Homework; Teacher organisation and planning; Goal emphasis; Teaching style – positive expectations for achievement, positive expectations for behaviour, caring (relationships), negativity, structure (agreed understanding); Teacher knowledge, beliefs, mind set; Teacher enthusiasm; Teacher stress; Teacher values; Teacher practices; Responsibility for student motivation, achievement, relationships with students, teaching; Teacher flexibility and responsiveness; Teaching maths cf other subjects (primary); Impact of NAPLAN on teachers; assessment
Student level (What characterises students and learning in mathematics in schools with high NAPLAN numeracy results?) Perceptions and experiences of teaching; Previous experiences cf now; Impact of NAPLAN on students; Beliefs and attitudes; Self efficacy, interest, utility, aspirations; Attributions; Perceptions of teacher beliefs and values; Homework; What class – link to teacher; assessment; Student chessboard problem response.
Summary
158
Who did you work with at this school? Name Role
Cohort (Student year level /parent group) Number

159
Building an Evidence Base for National Best Practice in Mathematics Education
CURRICULUM LEADER/MATHEMATICS COORDINATOR INTERVIEW SCHEDULE
Context & background
1. Tell me about your school.
Does the school have a mission statement that incorporates specific ideas about
mathematics?
If you have a specific curriculum statement for mathematics, what does it look like?
2. What is the level of involvement of the community in your school, regarding mathematics?
How do you inform parents about the mathematical practices in your school?
Prompts: Supporting students’ learning; funding resources; specific events, parent
mathematics evenings, reporting, newsletter, homework
Policy level
3. What do you see as the current broad curriculum agendas about mathematics nationally and
at state level and how do these influence what happens at your school?
Prompts: What directives are you receiving? What trends are you responding to?
School level
4. Your school has been identified as a high gains school in NAPLAN.
How do you manage the NAPLAN process?
What do you attribute your success to?
What expectations do you feel there are around your school’s performance in
NAPLAN?
Can you tell me about your personal perspective on the role of NAPLAN?
How is information around NAPLAN disseminated, discussed and used?
To what extent (and how) do you use the data collected from NAPLAN to inform
mathematics teaching/program in your school
5. What importance do you place on mathematics in your school?
Please expand your answer.
6. How is mathematics organised and managed in your school?
Prompt: streamed classes, textbook program, ICT based program
Who is responsible for it?
What role does the individual teacher have for organising and planning curriculum?
What processes for mentoring, regarding the teaching of mathematics, are in your
school? (e.g, supporting out-of-field teachers)

160
What is the approach for budget allocation for mathematics resources in your
school?
7. What opportunities are there for professional learning about mathematics in your school?
Prompts: access, nature, in/out of school, uptake; new teachers, graduate teachers
8. This set of questions is about the AC in your school.
Has your school adopted the AC: M (or state curriculum) entirely?
Has the AC: M been adapted in any way? If so, how and why?
o Prompts: Whole school approach, numeracy policy; characteristics of
students; socio-economic status.
9. What are the best identifiers of student achievement in mathematics and numeracy?
Describe how they are reflected in the planning and teaching of mathematics at your
school.
10. How is student learning in mathematics assessed at your school?
How feedback provided to students?
How feedback provided to parents?
11. Do you think there is a difference between mathematics and numeracy?
Please expand your answer and give examples.
Class level
12. What characterises an effective mathematics teacher?
Describe some teachers of mathematics who have made a positive difference to
mathematical learning and attainment in your school?
If you are looking at a mathematics classroom form the outside, what might be an
indication that the students are learning
13. What are the characteristics of a successful mathematics lesson?
Prompts include: mastery, performance, understanding, engagement.
14. How do you think students best learn mathematics concepts?
15. How is individual difference catered for in the teaching and learning of mathematics?
What student support structures exist?
Prompt: School based support program; special needs teacher/s; IEPs; open tasks;
collaborative learning; positive classroom environments; homework program

161
Building an Evidence Base for National Best Practice in Mathematics Education
PRINCIPAL INTERVIEW SCHEDULE
Context & background
1. Tell me about your school.
When was it established? How many staff do you have?
o Prompts: Stable staff over past 5 years?
Does the school have a mission statement?
o How is this integrated into the school?
o Prompts: Does it incorporate specific ideas about mathematics? How is this
enacted in the school program?
2. What is the level of involvement of the community in your school, regarding mathematics?
How do you inform parents about the mathematical practices in your school?
Prompts: Supporting students’ learning; funding resources; specific events, parent
mathematics evenings, reporting, newsletter, homework
Policy level
3. What do you see as the current broad curriculum agendas nationally and at state level and
how do these influence what happens at your school?
Prompts: What directives are you receiving? What trends are you responding to?
School level
4. Your school has been identified as a high gains school in NAPLAN.
How do you manage the NAPLAN process?
What do you attribute your success to?
What expectations do you feel there are around your school’s performance in
NAPLAN?
Can you tell me about your personal perspective on the role of NAPLAN?
How is information around NAPLAN disseminated, discussed and used?
To what extent (and how) do you use the data collected from NAPLAN to inform
mathematics teaching/program in your school
5. What importance do you place on mathematics in your school?
Please expand your answer.
6. How is mathematics organised and managed in your school?
Prompt: streamed classes, textbook program, ICT based program
Who is responsible for it?

162
What is the approach for budget allocation for mathematics resources in your
school?
7. What opportunities are there for professional learning about mathematics in your school?
Prompts: access, nature, in/out of school, uptake; new teachers, graduate teachers
What processes for appraisal and mentoring, regarding the teaching of
mathematics, are in your school? (e.g, supporting out-of-field teachers)
8. This set of questions is about the Australian Curriculum at your school.
Has your school adopted the AC: M (or state curriculum) entirely?
Has the AC: M been adapted in any way? If so, how and why?
o Prompts: Whole school approach, numeracy policy; characteristics of
students; socio-economic status
9. What are the best identifiers of student achievement in mathematics and numeracy?
Describe how they are reflected in the planning and teaching of mathematics at your
school.
10. How is student learning in mathematics assessed at your school?
How is feedback provided to students?
How is feedback provided to parents?
11. Do you think there is a difference between mathematics and numeracy?
Please expand your answer and give examples.
Class level
12. What characterises an effective mathematics teacher?
Describe some teachers of mathematics who have made a positive difference to
mathematical learning and attainment in your school?
If you are looking at a mathematics classroom form the outside, what might be an
indication that the students are learning
13. What are the characteristics of a successful mathematics lesson?
Prompts include: mastery, performance, understanding, engagement.
14. How do you think students best learn mathematics concepts?
15. How is individual difference catered for in the teaching and learning of mathematics?
What student support structures exist?
Prompt: School based support program; special needs teacher/s; IEPs; open tasks;
collaborative learning; positive classroom environments; homework program

163
Building an Evidence Base for National Best Practice in Mathematics Education
STUDENT INTERVIEW SCHEDULE
Student level
1. What do you think of when you hear the word mathematics?
Do you like it or not?
Do you like learning about maths
2. Do you think maths is important?
Why?
Do you think it is useful?
When do you use mathematics outside of school?
3. How good do you think you are at mathematics?
What parts of maths are you good at?
4. Describe a typical maths lesson that you had this week
Probes: Do you use open-ended tasks, use of textbook, worksheets, concrete
materials, ICT, calculators, game
What do you mostly do in maths lessons?
5. Tell me about a maths lesson that you really enjoyed.
What made it enjoyable?
Have you had mathematics lessons like that in the past
6. Tell me about a maths lesson where you learnt something new.
What did you learn? What helped you to learn it?
7. Tell me about someone in your class who is good at maths.
What makes them good at maths?
What are they good at doing in maths?
8. Do you think your teacher likes mathematics? Do you think that s/he thinks it is important?
9. What do you do when you don’t know how to work out a maths problem?
What helps you the most?
Probe : How does your teacher help you? Do you work with a friend?
10. Can you remember taking the NAPLAN tests?
Can you tell me about how you felt about taking the tests?
11. How does your teacher find out what you know about maths?

164
Probe: Tests, assignments, problem solving, puzzles
12. Do you do any maths at home?
Do have set maths homework? How long does it take? What sort of maths do you do
for homework?
Do your parents help you with maths at home?
Task:
How many squares on the chessboard?
o Instructions
Look at the problem individually for 2–3 minutes and have a go at solving it
or thinking about how you would solve it.
Then talk about it and work on solving as a group.
Observe how they approached the task, entered the task, solved the task
Use a protocol sheet for student 1, 2, 3, 4 – then overall comment on group outcome
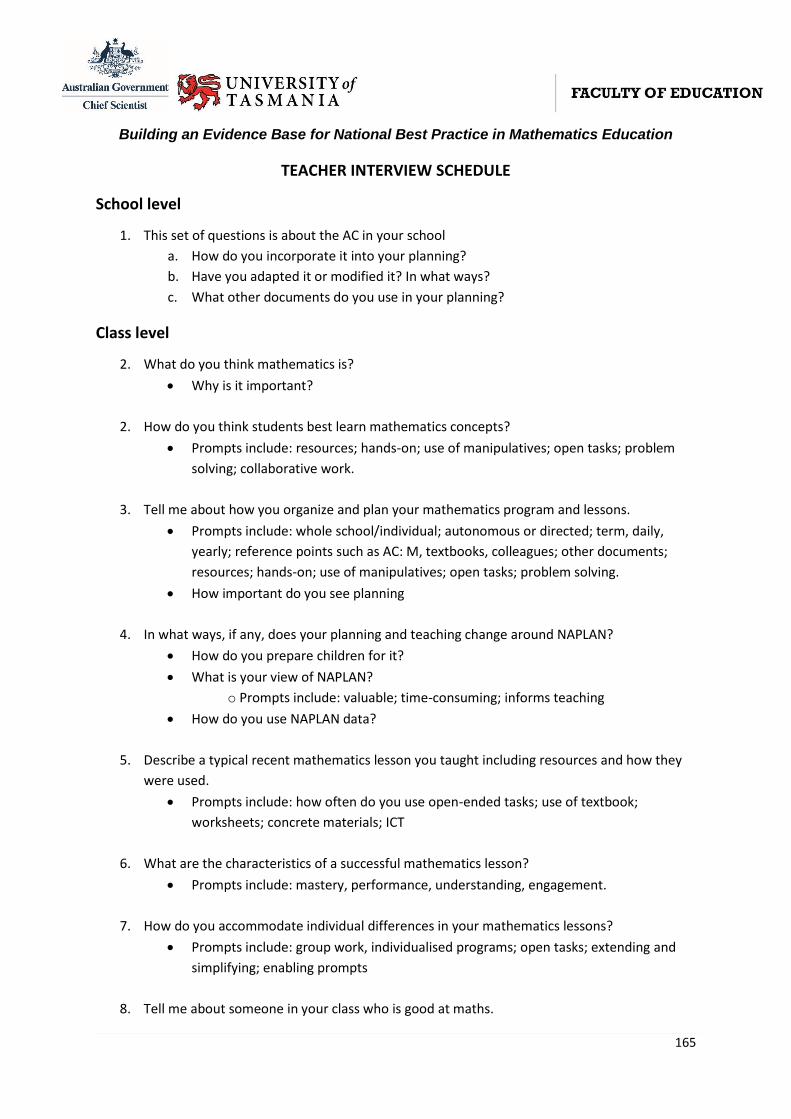
165
Building an Evidence Base for National Best Practice in Mathematics Education
TEACHER INTERVIEW SCHEDULE
School level
1. This set of questions is about the AC in your school
a. How do you incorporate it into your planning?
b. Have you adapted it or modified it? In what ways?
c. What other documents do you use in your planning?
Class level
2. What do you think mathematics is?
Why is it important?
2. How do you think students best learn mathematics concepts?
Prompts include: resources; hands-on; use of manipulatives; open tasks; problem
solving; collaborative work.
3. Tell me about how you organize and plan your mathematics program and lessons.
Prompts include: whole school/individual; autonomous or directed; term, daily,
yearly; reference points such as AC: M, textbooks, colleagues; other documents;
resources; hands-on; use of manipulatives; open tasks; problem solving.
How important do you see planning
4. In what ways, if any, does your planning and teaching change around NAPLAN?
How do you prepare children for it?
What is your view of NAPLAN?
o Prompts include: valuable; time-consuming; informs teaching
How do you use NAPLAN data?
5. Describe a typical recent mathematics lesson you taught including resources and how they
were used.
Prompts include: how often do you use open-ended tasks; use of textbook;
worksheets; concrete materials; ICT
6. What are the characteristics of a successful mathematics lesson?
Prompts include: mastery, performance, understanding, engagement.
7. How do you accommodate individual differences in your mathematics lessons?
Prompts include: group work, individualised programs; open tasks; extending and
simplifying; enabling prompts
8. Tell me about someone in your class who is good at maths.

166
What makes that person good at maths?
What are that person good at doing in maths?
9. How do you assess student learning?
How do you provide feedback to students?
How do you provide feedback to parents?
10. Do you think there is a difference between mathematics and numeracy?
Please expand your answer and give examples.
11. What are the best identifiers of student achievement in mathematics and numeracy?
Describe how they are reflected in your planning and teaching.
12. Describe any recent professional learning in mathematics in which you were involved
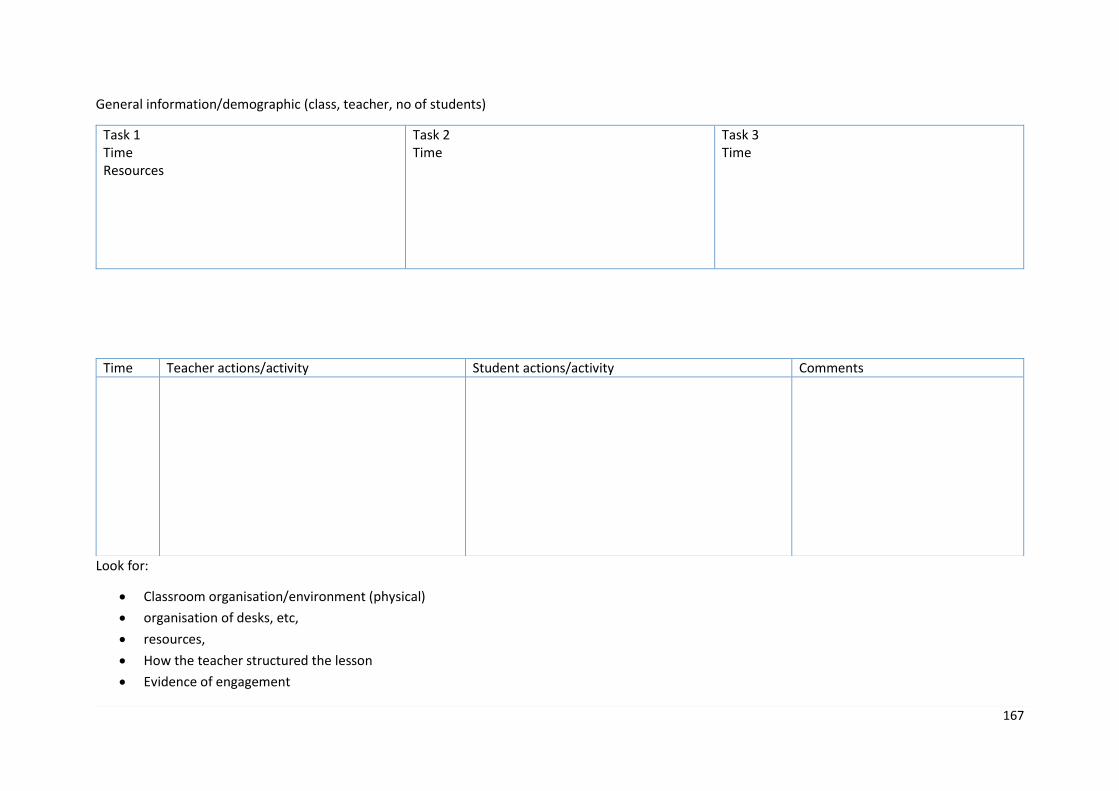
167
General information/demographic (class, teacher, no of students)
Task 1 Time Resources
Task 2 Time
Task 3 Time
Look for:
Classroom organisation/environment (physical)
organisation of desks, etc,
resources,
How the teacher structured the lesson
Evidence of engagement
Time Teacher actions/activity Student actions/activity Comments
168
Degree of student/student; student/teacher interaction; balance of interactions; quality of interactions; types and qualities of questions
Copy of lesson plan
Lesson conclusion/reflection
Nature and quality of feedback
Teachable moments (e.g., contingency)
Use of resources (appropriate, effective)
Task quality (degree of challenge, accessibility, examples selected)

169
Appendix B
Details of the ACARA sample of superior gain schools and the survey
samples of schools

170
Characteristics of the ACARA sample of superior gain schools
Two initial data sets were provided by ACARA as a basis for identifying successful schools. These data
sets identified schools that had gain scores from Year 3 to Year 5 or from Year 7 to Year 9 that were
1 standard deviation (SD) above the average gain for all schools in Australia.
The two sets included gains from 2011–2013 and 2012–2014, the only gain score sets available at
the time of the project. Each set included slightly different data. 2011–2013 (Set A) included start
and end scores (i.e., Year 3 or Year 7 scores 2011 and Year 5 or Year 9 2013), but did not indicate
which aspects of NAPLAN (numeracy or reading) provided the gain. The assumption was made that
these gains were in Numeracy only. The Set A data consisted of 307 different schools, with 10
schools included twice, that is in each of the year ranges Year 3 to Year 5 and Year 7 to Year 9,
providing 317 data points.
2012–2014 (Set B) did not include start and end scores, but did include information about whether
the school had gained in numeracy, reading or both NAPLAN assessed areas. All schools that had
gained only in reading were deleted from the data set. The Numeracy only data set consisted of 204
schools with 1 school included twice—that is in each of the year ranges Year 3 to Year 5 and Year 7
to Year 9, providing 205 data points.
For this school level analysis, Set A and Set B (Numeracy only) were combined to form a single
ACARA data set of 522 schools. Duplicate schools were then removed from the data set, but schools
that included high gain in both year ranges, Year 3 to Year 5 and Year 7 to Year 9, were included for
each year range, that is they appeared twice. The final data set of combined ACARA high gain
schools was 493 schools. The analyses reported here are based on this combined data set.
It should be noted that very limited information about gain from Year 7 to Year 9 was available from
Queensland, South Australia and West Australia because Year 7 was not undertaken in high schools,
although some schools in WA had begun to make this shift. In Queensland and WA this change
occurred in 2015, the year in which the study was conducted. The lack of gain scores in secondary
schools in these three states does skew the distribution of schools. All analyses should be considered
with this caveat in mind.
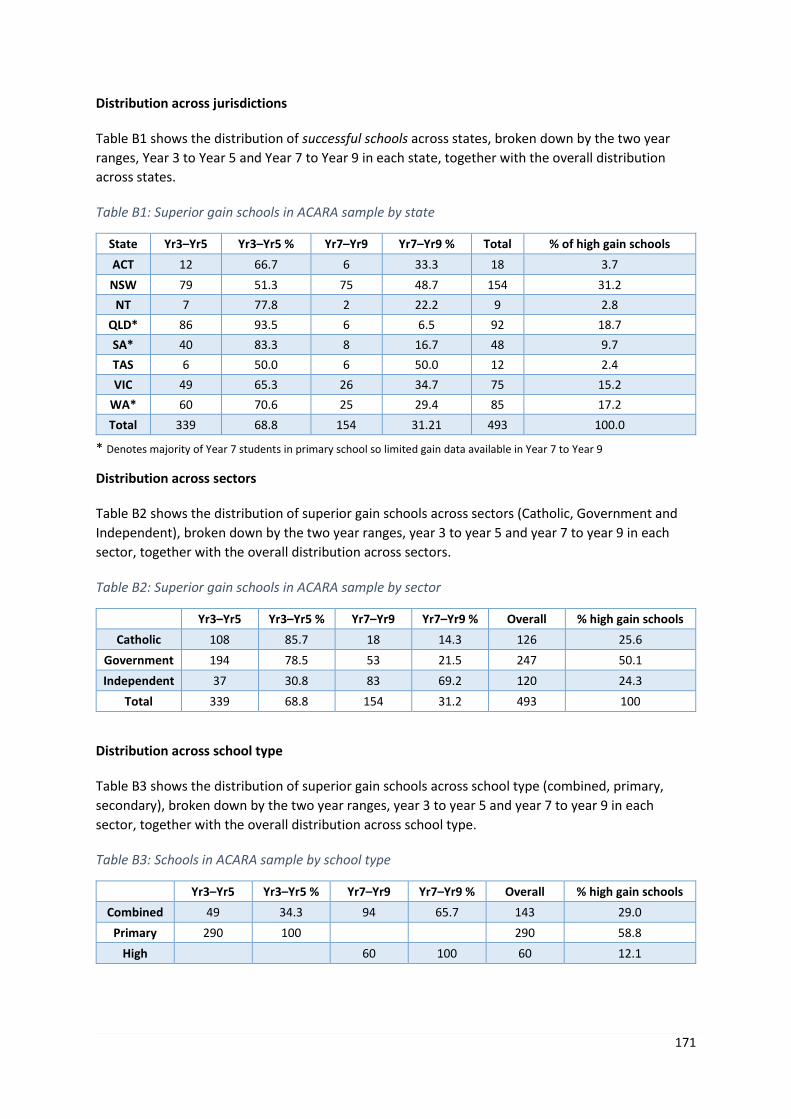
171
Distribution across jurisdictions
Table B1 shows the distribution of successful schools across states, broken down by the two year
ranges, Year 3 to Year 5 and Year 7 to Year 9 in each state, together with the overall distribution
across states.
Table B1: Superior gain schools in ACARA sample by state
State Yr3–Yr5 Yr3–Yr5 % Yr7–Yr9 Yr7–Yr9 % Total % of high gain schools
ACT 12 66.7 6 33.3 18 3.7
NSW 79 51.3 75 48.7 154 31.2
NT 7 77.8 2 22.2 9 2.8
QLD* 86 93.5 6 6.5 92 18.7
SA* 40 83.3 8 16.7 48 9.7
TAS 6 50.0 6 50.0 12 2.4
VIC 49 65.3 26 34.7 75 15.2
WA* 60 70.6 25 29.4 85 17.2
Total 339 68.8 154 31.21 493 100.0
* Denotes majority of Year 7 students in primary school so limited gain data available in Year 7 to Year 9
Distribution across sectors
Table B2 shows the distribution of superior gain schools across sectors (Catholic, Government and
Independent), broken down by the two year ranges, year 3 to year 5 and year 7 to year 9 in each
sector, together with the overall distribution across sectors.
Table B2: Superior gain schools in ACARA sample by sector
Yr3–Yr5 Yr3–Yr5 % Yr7–Yr9 Yr7–Yr9 % Overall % high gain schools
Catholic 108 85.7 18 14.3 126 25.6
Government 194 78.5 53 21.5 247 50.1
Independent 37 30.8 83 69.2 120 24.3
Total 339 68.8 154 31.2 493 100
Distribution across school type
Table B3 shows the distribution of superior gain schools across school type (combined, primary,
secondary), broken down by the two year ranges, year 3 to year 5 and year 7 to year 9 in each
sector, together with the overall distribution across school type.
Table B3: Schools in ACARA sample by school type
Yr3–Yr5 Yr3–Yr5 % Yr7–Yr9 Yr7–Yr9 % Overall % high gain schools
Combined 49 34.3 94 65.7 143 29.0
Primary 290 100 290 58.8
High 60 100 60 12.1
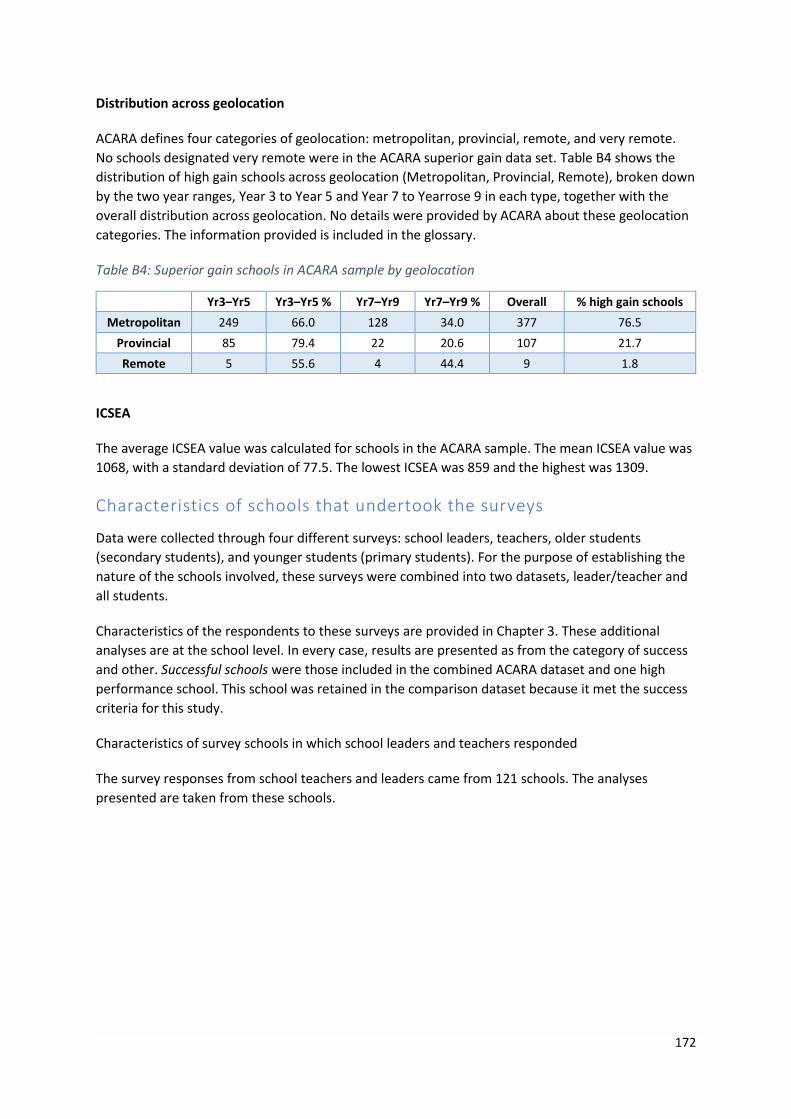
172
Distribution across geolocation
ACARA defines four categories of geolocation: metropolitan, provincial, remote, and very remote.
No schools designated very remote were in the ACARA superior gain data set. Table B4 shows the
distribution of high gain schools across geolocation (Metropolitan, Provincial, Remote), broken down
by the two year ranges, Year 3 to Year 5 and Year 7 to Yearrose 9 in each type, together with the
overall distribution across geolocation. No details were provided by ACARA about these geolocation
categories. The information provided is included in the glossary.
Table B4: Superior gain schools in ACARA sample by geolocation
Yr3–Yr5 Yr3–Yr5 % Yr7–Yr9 Yr7–Yr9 % Overall % high gain schools
Metropolitan 249 66.0 128 34.0 377 76.5
Provincial 85 79.4 22 20.6 107 21.7
Remote 5 55.6 4 44.4 9 1.8
ICSEA
The average ICSEA value was calculated for schools in the ACARA sample. The mean ICSEA value was
1068, with a standard deviation of 77.5. The lowest ICSEA was 859 and the highest was 1309.
Characteristics of schools that undertook the surveys
Data were collected through four different surveys: school leaders, teachers, older students
(secondary students), and younger students (primary students). For the purpose of establishing the
nature of the schools involved, these surveys were combined into two datasets, leader/teacher and
all students.
Characteristics of the respondents to these surveys are provided in Chapter 3. These additional
analyses are at the school level. In every case, results are presented as from the category of success
and other. Successful schools were those included in the combined ACARA dataset and one high
performance school. This school was retained in the comparison dataset because it met the success
criteria for this study.
Characteristics of survey schools in which school leaders and teachers responded
The survey responses from school teachers and leaders came from 121 schools. The analyses
presented are taken from these schools.

173
Distribution across jurisdictions
Table B5 shows the distribution of teacher/leader schools across states, broken down by categories
of success and other in each state, together with the overall distribution across states.
Table B5: Schools in teacher/leader survey sample by jurisdiction
State Success Success % Other Other % Total % of sample
ACT 3 75.0 1 25.0 4 3.3
NSW 4 13.3 26 86.7 30 24.8
NT 3 27.3 8 72.7 11 9.1
QLD 3 16.7 15 83.3 18 14.9
SA 5 23.8 16 76.1 21 17.4
TAS 4 40.0 6 60.0 10 8.3
VIC 6 31.6 13 69.4 19 15.7
WA 4 50.0 4 50.0 8 6.6
Total 32 26.4 89 73.6 121 100
Distribution across sectors
Table B6 shows the distribution of teacher/leader schools across sectors (Catholic, Government and
Independent), broken down by the categories of success and other, in each sector, together with the
overall distribution across sectors.
Table B6: Schools in teacher/leader survey sample by sector
Sector Success Success % of sector Other Other % of sector Total % of sample
Catholic 3 33.3 6 66.7 9 7.4
Government 19 19.1 70 70.7 99 73.6
Independent 10 43.5 13 56.5 23 19.0
Total 32 89 121 100
Distribution across school type
Table B7 shows the distribution of teacher/leader survey schools across school type (Combined,
Primary, Secondary), broken down by the two categories of success and other together with the
overall distribution across school type.
Table B7: Schools in teacher/leader survey sample by school type
Success Success % by school type
Other Other % by school type
Overall % of sample
Combined 13 41.9 18 58.0 31 25.6
Primary 13 20.6 50 79.4 63 52.1
Secondary 6 22.2 21 77.9 27 22.3

174
Distribution across geolocation
ACARA defines four categories of geolocation: metropolitan, provincial, remote, and very remote.
No schools designated very remote were in the student survey data set. Table B8 shows the
distribution of high gain schools across geolocation (metropolitan, provincial, remote), broken down
by the categories of success and other together with the overall distribution across geolocation.
Table B8: Schools in teacher/leader survey sample by geolocation
Success Success %
by geolocation
Other Other % by geolocation
Overall % of sample
Metropolitan 20 26.7 55 73.3 75 62.0
Provincial 10 27.0 27 73.0 37 30.6
Remote 2 66.7 1 33.3 3 2.5
Very Remote 6 100 6 5.0
ICSEA
The average ICSEA value was calculated for successful and other schools from which teachers and
leaders responded. Table B9 shows the results together with the statistics from a t-test of statistical
significance. There was a statistically significant difference between the average ICSEA values of the
two groups, with the other schools group having a lower ICSEA than the successful schools group.
Table B9: Comparison of average ICSEA for schools in teacher/leader survey sample
n Average ICSEA ICSEA SD t p
Success 32 1075 91 3.81 0.00
Other 89 982 126

175
Comparison between the ACARA superior gain sample and successful
schools from which leaders and teachers responded
A series of comparisons was carried out to establish the similarity between the successful schools in
which leaders and teachers responded to the survey and the ACARA superior gain data set. It should
be noted that the successful schools in the survey sample included one high performance school
where gain scores were not available.
In all of the following sections, results are shown as percentages of schools from the ACARA sample
of Superior Gain Schools and of successful schools in which Leader and Teacher survey respondents
were located.
Distribution across states and territories
Figure B1 shows a comparison between the distribution by state and territory of ACARA superior
gain schools and the sample of identified successful schools that had responses from leaders and
teachers. Among the survey schools, New South Wales and Queensland were underrepresented,
whereas the Australian Capital Territory, South Australia, Tasmania and the Northern Territory were
overrepresented. Because these states are the smallest jurisdictions, the actual number of schools
involved was small. The variation was caused more by the relative lack of participation by schools in
New South Wales and Queensland.
Figure B1: Comparison of the distribution of schools across states
Distribution across sectors
When considered across sectors, there was a relative lack of participation by Catholic sector schools.
Results are summarised in Figure B2. The relatively low participation by Catholic schools may have
been due to the time of year. Surveys were sent out as soon as possible after permission was
received by the various jurisdictions. One Catholic diocese declined to participate. By the time

176
permissions were received and surveys sent out, it was Term 4 and many schools, especially Catholic
schools, had increased commitments leading up to Christmas. These commitments may have
affected the response rates from schools.
Figure B2: Comparison of schools by sector
Distribution across school type
The distribution across school type showed a lower participation from primary schools, as shown in
Figure B3. It is possible that primary teachers were involved in more extra-curricular activities
towards Christmas, affecting the participation rate.
Figure B3: Comparison of schools by school type

177
Distribution across geolocation
The comparison by geolocation showed a similar pattern in both ACARA and survey sample schools.
Metropolitan schools predominated with few remote schools. The findings are summarised in Figure
B4.
Figure B4: Comparison of schools by geolocation
ICSEA
The ACARA dataset had a mean ICSEA value of 1068, with a standard deviation of 77.5. The mean
ICSEA from the successful survey schools was 1075, with a standard deviation of 91. There was no
statistically significant difference between the two groups.
Given that the survey was delivered online, and participants self-selected to take part, as is the
situation with all online surveys, the survey schools were reasonably representative of the ACARA
high gain schools. The relatively low participation of New South Wales and Queensland, and of
Catholic schools was also reflected in the case study sample, indicating that the issue may had had
more to do with local events than the study. ICSEA is generally identified as the factor that makes
the most difference to educational outcomes (OECD, 2012), and on this measure there was no
significant difference.
Characteristics of survey schools from which students responded
The survey responses from primary and secondary students came from 35 schools, of which two
combined schools appeared twice because they provided responses from both primary and
secondary students. The duplications were removed leave a dataset of 33 schools. No student
responses were received from any schools in the Australian Capital Territory. The analyses presented
are taken from the 33 schools providing student respondents.
0
10
20
30
40
50
60
70
80
Metropolitan Provincial Remote
% o
f Sc
ho
ols
ACARA Superior Gain Successful Schools

178
Distribution across jurisdictions
Table B10 shows the distribution of student sample schools across jurisdictions, broken down by
categories of successful schools and other schools, together with the overall distribution.
Table B10: Schools in student survey sample by jurisdiction
State Success Success % Other Other % Total % of sample
ACT
NSW 6 85.7 1 14.3 7 21.2
NT 0 0 1 100 1 3.0
QLD 2 50.0 2 50.0 4 12.1
SA 4 50.0 4 50.0 8 24.2
TAS 2 33.3 2 66.7 4 12.1
VIC 1 20.0 4 80.0 5 15.2
WA 3 75.0 1 25.0 4 12.1
Total 18 51.4 17 48.6 33 100.0
Distribution across sectors
Table B11 shows the distribution of student sample schools across sectors (Catholic, Government
and Independent), broken down by the categories of successful schools and other schools, in each
sector, together with the overall distribution across sectors.
Table B11: Schools in student survey sample by sector
Sector Success Success % of sector
Other Other % of
sector Total
% of sample
Catholic 1 25.0 3 75.0 4 12.1
Government 8 42.9 12 57.1 20 60.6
Independent 6 70.0 3 30.0 10 27.3
Total 15 18 35 100
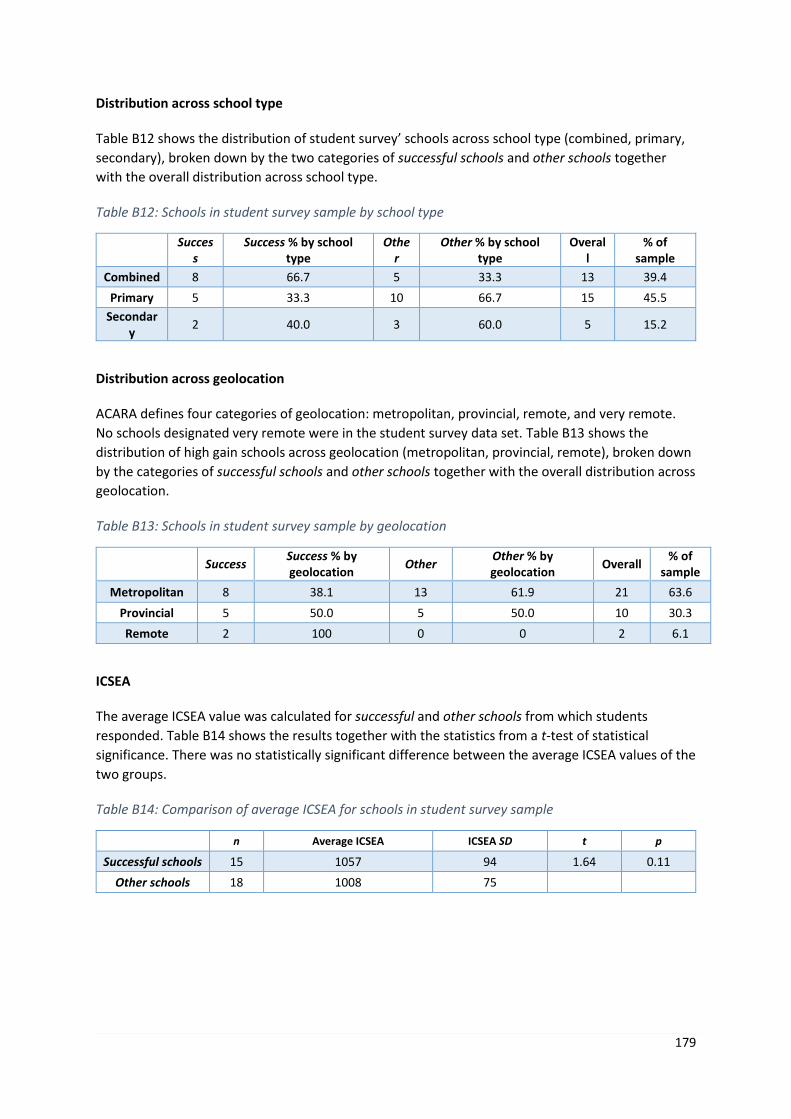
179
Distribution across school type
Table B12 shows the distribution of student survey’ schools across school type (combined, primary,
secondary), broken down by the two categories of successful schools and other schools together
with the overall distribution across school type.
Table B12: Schools in student survey sample by school type
Success
Success % by school type
Other
Other % by school type
Overall
% of sample
Combined 8 66.7 5 33.3 13 39.4
Primary 5 33.3 10 66.7 15 45.5
Secondary
2 40.0 3 60.0 5 15.2
Distribution across geolocation
ACARA defines four categories of geolocation: metropolitan, provincial, remote, and very remote.
No schools designated very remote were in the student survey data set. Table B13 shows the
distribution of high gain schools across geolocation (metropolitan, provincial, remote), broken down
by the categories of successful schools and other schools together with the overall distribution across
geolocation.
Table B13: Schools in student survey sample by geolocation
Success Success % by geolocation
Other Other % by geolocation
Overall % of
sample
Metropolitan 8 38.1 13 61.9 21 63.6
Provincial 5 50.0 5 50.0 10 30.3
Remote 2 100 0 0 2 6.1
ICSEA
The average ICSEA value was calculated for successful and other schools from which students
responded. Table B14 shows the results together with the statistics from a t-test of statistical
significance. There was no statistically significant difference between the average ICSEA values of the
two groups.
Table B14: Comparison of average ICSEA for schools in student survey sample
n Average ICSEA ICSEA SD t p
Successful schools 15 1057 94 1.64 0.11
Other schools 18 1008 75

180
Appendix C
Professional learning (professional development) and commercial
programs and resources that influence teaching in successful schools

181
C1. Professional learning (professional development) focus
Content focus Number of mentions
Mathematics (unspecified content) 12
New year 11/12 curriculum 8
Problem solving 2
Mathematical investigations and applications 2
Data analysis (using data) 3
General pedagogy 1
Peer Observation 1
Dyscalculia 1
School based program 1
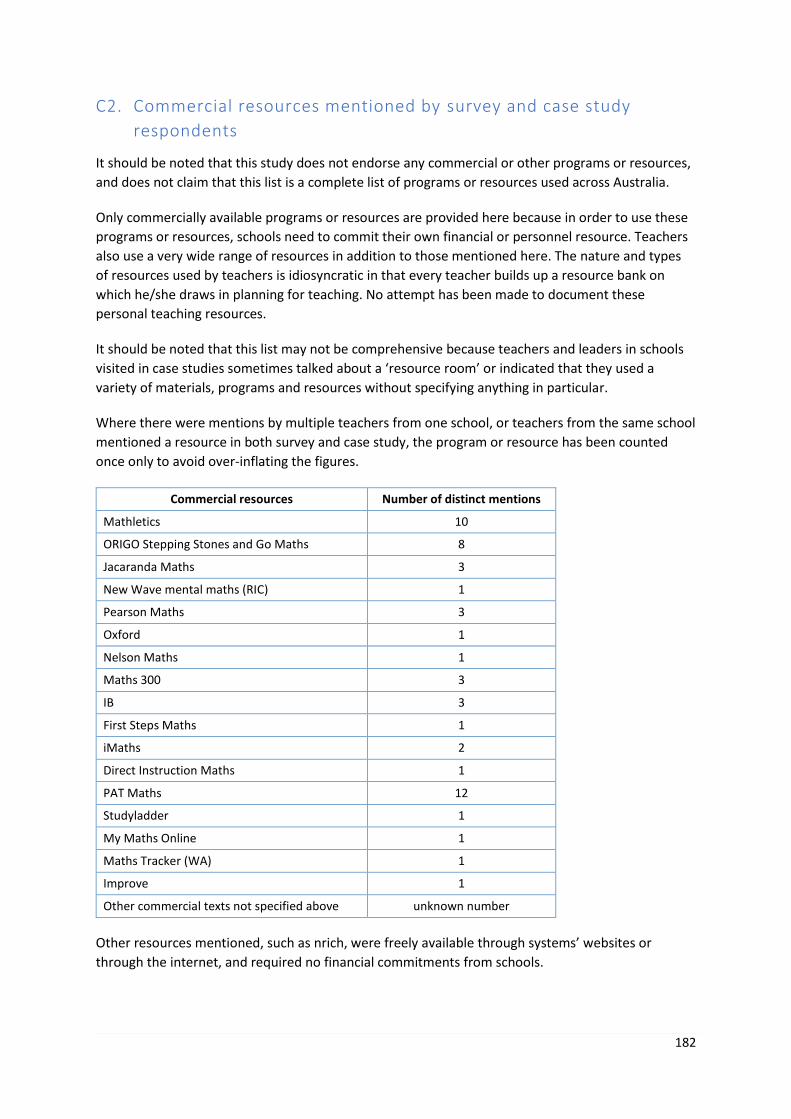
182
C2. Commercial resources mentioned by survey and case study
respondents
It should be noted that this study does not endorse any commercial or other programs or resources,
and does not claim that this list is a complete list of programs or resources used across Australia.
Only commercially available programs or resources are provided here because in order to use these
programs or resources, schools need to commit their own financial or personnel resource. Teachers
also use a very wide range of resources in addition to those mentioned here. The nature and types
of resources used by teachers is idiosyncratic in that every teacher builds up a resource bank on
which he/she draws in planning for teaching. No attempt has been made to document these
personal teaching resources.
It should be noted that this list may not be comprehensive because teachers and leaders in schools
visited in case studies sometimes talked about a ‘resource room’ or indicated that they used a
variety of materials, programs and resources without specifying anything in particular.
Where there were mentions by multiple teachers from one school, or teachers from the same school
mentioned a resource in both survey and case study, the program or resource has been counted
once only to avoid over-inflating the figures.
Commercial resources Number of distinct mentions
Mathletics 10
ORIGO Stepping Stones and Go Maths 8
Jacaranda Maths 3
New Wave mental maths (RIC) 1
Pearson Maths 3
Oxford 1
Nelson Maths 1
Maths 300 3
IB 3
First Steps Maths 1
iMaths 2
Direct Instruction Maths 1
PAT Maths 12
Studyladder 1
My Maths Online 1
Maths Tracker (WA) 1
Improve 1
Other commercial texts not specified above unknown number
Other resources mentioned, such as nrich, were freely available through systems’ websites or
through the internet, and required no financial commitments from schools.

183
Appendix D
Technical details of survey analyses
This appendix provides details on the analyses used in sections 5.1.1, 5.1.2, 5.1.3, 5.1.4 and 5.5 of
the report.
Standard analysis techniques such as those used to compare two groups with continuous (t-test) and
discrete (X2) are commonly used techniques. This appendix is limited to Structural Equation
Modelling and Latent Class Analysis.

184
Exploratory factor analysis (section 5.1.1 and section 5.1.2)
Exploratory factor analysis was undertaken to identify underlying factors for both attitudes to
NAPLAN and to teachers’ perceptions of teaching approaches that would lead to student
achievement and student engagement. The analyses were completed using IBM SPSS 22. The
identified factors were interpreted by considering the items that loaded onto each factor, paying
particular attention to those items contributing highly to each factor.
NAPLAN (section 5.1.1)
Principal Components Analysis (PCA) with varimax rotation identified two NAPLAN factors, together
explaining 66.0% of the variance. Factor 1 explained 37.8% and Factor 2 explained 28.2% of the
variance. The rotated factor loadings are shown in Table D1.
Table D1: Rotated factor loadings
Factor 1 Factor 2
NAPLAN has-improved whole school coordination in numeracy. .832
NAPLAN has-led to increased opportunities for collaboration and sharing of resources .880
NAPLAN has-supported teacher and school assessments. .841
NAPLAN has-helped students get better at test-taking practices. .762
NAPLAN has-helped promote desirable student attributes such as planning, goal set .832
NAPLAN has-for better monitoring of student progress over time. .757
NAPLAN has-had a negative impact on learning through a narrow focus. .788
NAPLAN has-negatively impacted student learning through lack of relevance. .766
NAPLAN has-been disconnected from the mathematics that students do in my class. -.458 .317
NAPLAN has-increased the stress and pressure on students. .839
NAPLAN has-increased the stress and pressure on teachers. .883
NAPLAN has-led to a greater prevalence of 'teaching to the test'. .793
NAPLAN has-interfered with a balanced and effective curriculum. .839
Achievement and engagement factors (section 5.1.2)
Principal Components Analysis (PCA) with varimax rotation identified four achievement factors,
together explaining 60.3% of the variance. Factor 1 explained 34.3% of the variance, with the
remaining three factors explaining 11.0%, 8.5% and 6.5% respectively. The rotated factor loadings
are shown in Table D2.
Table D2: Rotated factor loadings for teaching approaches leading to student achievement
Factor 1 Factor 2 Factor 3 Factor 4
Playing maths games (including computer games)
.692 .397
Teacher giving clear explanations .428
.573
Students explaining their own thinking (either verbally or written)
.837
Students listening to and questioning other students’ thinking .853
Students have opportunities to work in groups .630 .361 .390
Positive reinforcement (smiles, encouraging words) .408
.517
Opportunity for students to work by themselves .318
.701

185
Working on tasks students see as challenging .601
.447
Using concrete materials and manipulatives .368 .687
Practising skills they have already been taught.
.559
.615
Extrinsic rewards (lollies, less homework)
.780
Students working with others of different levels of achievement
.627
Students working with others of similar levels of achievement
.464 .352
Students working with digital technologies (e.g. computer, tablets, internet IWB)
.548 .540
Students using calculators
.679
Students knowing the purpose and intent of the lesson .600 .425
Students choosing their own strategy for solving the task .594 .486
Having tasks that are set in contexts relevant to students' lives .624 .486
Students learning rules and procedures
.717
Principal Components Analysis (PCA) with varimax rotation identified four Engagement factors,
together explaining 61.5% of the variance. Factor 1 explained 37.7% of the variance, with the
remaining three factors explaining 11.0%, 7.2% and 5.5% respectively. The rotated factor loadings
are shown in Table D3.
Table D3: Rotated factor loadings for teaching approaches leading to student engagement
Factor 1 Factor 2 Factor 3 Factor 4
Playing maths games (including computer games) .738 .318
Teacher giving clear explanations .343 .699
Students explaining their own thinking (either verbally or written)
.716 .345
Students listening to and questioning other students’ thinking .759
Students have opportunities to work in groups .518 .450
Positive reinforcement (smiles, encouraging words) .698 .347
Opportunity for students to work by themselves .616 .368
Working on tasks students see as challenging .625 .305
Using concrete materials and manipulatives .705
Practising skills they have already been taught. .742
Extrinsic rewards (lollies, less homework) .712
Students working with others of different levels of achievement .698 .316
Students working with others of similar levels of achievement .624
Students working with digital technologies (e.g. computer, tablets, internet IWB)
.662 .495
Students using calculators .346 .462
Students knowing the purpose and intent of the lesson .331 .637 .333
Students choosing their own strategy for solving the task .398 .438 .605
Having tasks that are set in contexts relevant to students' lives .313 .691
Students learning rules and procedures .575 .482

186

187
Structural equation model (section 5.1.4)
The analysis first investigated the factor structure of the interest dimensions; confirmatory factor
analyses examined whether a two-dimensional structure of interest—Students’ Emotional Interest
(SEI) and Students’ Cognitive Interest (SCI)—was superior to a single interest factor. Associations
between key variables and constructs were then examined, commencing with student-level and
then teacher-level variables. Then the associations among teacher-level and student-level variables
were examined. This latter analysis, based on calculated factor scores, involved the calculation of
Pearson correlation coefficients and then for significant associations, the use of linear multi-level
regression models to control for key demographic factors, such as ICSEA.
An hypothesised model was tested using multilevel structural equation models (Muthén &
Asparouhov, 2010) to accommodate the nested nature of these data. Because of the lack of
statistical power, teacher variables were not included into a teacher-level model in this analysis. The
models were estimated using the option “type = MULTILEVEL” of MPlus version 7 (Muthén &
Muthén 2012). Missing data at the student level were imputed using Bayesian analysis as described
in the MPlus manual (Muthén & Muthén 2012). Evaluation of the model was based on the
comparative fit index (CFI, Bentler 1990), the root mean square error of approximation (RMSEA, Hu
& Bentler 1999) and the standardised root mean square residual at both the within (SRMRw) and
between (SRMRb) levels. Acceptable fit is demonstrated when the CFI > 0.9 and the remaining
indices are less than 0.05 (Byrne, 2012).
Latent class analysis (section 5.1.4)
Scores for each dimension of engagement—behavioural, emotional, and cognitive—were calculated
from nine engagement items that were similar or identical on the two versions of the student
survey. Where the wording was slightly different, the changes had been made to improve readability
and understanding for younger students. The items were judged to address the same underlying
ideas in both surveys. Items that did not have an equivalent in both surveys were not used in this
analysis. The items used are shown in Table D4.
Table D4: Items used to create factor scores for latent class analysis.
Construct Secondary Survey Primary Survey
Emotional interest/engagement I like maths more than other subjects.
I like maths more than my other subjects at school.
I find maths interesting. I find maths interesting.
I find maths enjoyable. I enjoy maths.
Cognitive interest/engagement
After a math class, I am often curious about what we are going to do in the next lesson.
After a maths class, I am curious about what we are going to do in the next lesson
I want to know all about maths. I want to know all about maths.
I would like to find out more about some of the things we deal with in our maths class.
I would like to find out more about some of the things we deal with maths.
Behavioural interest/engagement
Making an effort in maths is worth it because this will help me in the work I want to do later on.
Working hard in maths is worth it because it will help me later on in life.
What I learn in maths is important for me because I need this for what I want to study later on.
Learning maths is important because I will need it for later study at school.
I study maths because I know it is useful for me.
I study maths because I know it is useful for me.

188
Based on the dimension scores for each of three engagement dimensions (emotional, cognitive, and
behavioural), multilevel latent class analysis (LCA) identified distinct profiles of students:
Disengaged, Compliant and Engaged. LCA assumes that rather than being selected from one
population, students have in fact been drawn from a number of hidden (latent) classes. Mean
environmental scores for each of the profiles were then compared. The non-independence of these
data, reflecting students within mathematics classrooms, was modelled using the option "type =
COMPLEX MIXTURE" of Mplus as described in Muthén and Muthén (2012). This option generates
estimates corrected for nested data that are robust to violations in normality, and utilises all data
during model estimation with full information maximum likelihood (FIML).
The Mplus code used is shown below:
TITLE: This model conducts an LCA of engagement dimensions;
DATA:
FILE IS ClusterData.dat;
VARIABLE:
NAMES = ID SID TID Eff Int Cog CME CPE TE SC Age Male Grade;
USEVARIABLES = Eff Int Cog; ! Engagement dimension variables.
IDVARIABLE = ID;
AUXILIARY = (e) CME CPE TE SC Age Male Grade;
MISSING = ALL (999);
CLUSTER = TID; ! class identifier.
CLASSES = C(3);
ANALYSIS: TYPE = MIXTURE COMPLEX;
STARTS = 1000 250;
STITERATIONS=20;
!LRTBOOTSTRAP=200; !For calculating BLRT with type=Mixture
!LRTSTARTS=20 5 200 50;! For calculating BLRT with type=Mixture
!OPTSEED = 939709; !For calculating BLRT with type=Mixture
MODEL:
%OVERALL%
%C#1%
%C#2%
%C#3%
OUTPUT: SAMP TECH11;!TECH14;! for BLRT calculation

189
Appendix D References
Bentler, P. M. (1990). Comparative fit indexes in structural models. Psychological Bulletin, 107(2), 238–246.
Byrne, B. M. (2012). Structural Equation Modeling with Mplus. New York, NY: Routledge.
Hu, L., & Bentler, P. M. (1999). Cut-off criteria for fit indexes in covariance structure analysis: Conventional criteria versus new alternatives. Structural Equation Modeling, 6, 1–55.
Muthén, B., & Asparouhov, T. (2010). Beyond multilevel regression modeling: Multilevel analysis in a general latent variable framework. In J. Hox & J. K. Roberts (Eds.), The Handbook of Advanced Multilevel Analysis (pp. 15–40). New York: Taylor and Francis.
Muthén, L. K., & Muthén, B. (2012). Mplus User's Guide (Seventh ed.). Los Angeles, CA: Muthén & Muthén.
Recommended