1
Notes on
The Chinn-Ito Financial Openness Index
2018 Update
July 12, 2020
Hiro Ito ([email protected])
Portland State University
Menzie Chinn ([email protected])
University of Wisconsin, Madison and NBER
The Chinn-Ito index (KAOPEN) is an index measuring a country’s degree of capital account
openness. The index was initially introduced in Chinn and Ito (Journal of Development
Economics, 2006). KAOPEN is based on the binary dummy variables that codify the tabulation
of restrictions on cross-border financial transactions reported in the IMF’s Annual Report on
Exchange Arrangements and Exchange Restrictions (AREAER). This update is based on
AREAER 2018, which contains the information on regulatory restrictions on cross-border
financial transactions as of the end of 2018.1
More information on how the index is constructed and how it compares with other measures of
cross-border financial flows can be found in:
“A New Measure of Financial Openness”, Journal of Comparative Policy Analysis,
Volume 10, Issue 3 September 2008, p. 309 - 322. Note that this paper uses the 2007
version of the dataset (containing data up to only 2005), which will differ from the current
version of the dataset.
When you use the index, please acknowledge the following paper as the data source:
Chinn, Menzie D. and Hiro Ito. 2006.”What Matters for Financial Development? Capital
Controls, Institutions, and Interactions,” Journal of Development Economics, Volume 81,
Issue 1, Pages 163-192 (October).
The dataset is available at http://web.pdx.edu/~ito/Chinn-Ito_website.htm .
kaopen_2018.xls (Excel format) or kaopen_2018.dta (STATA 15 dataset format) is a data file
that contains the updated version of the Chinn and Ito index series. The dataset encompasses the
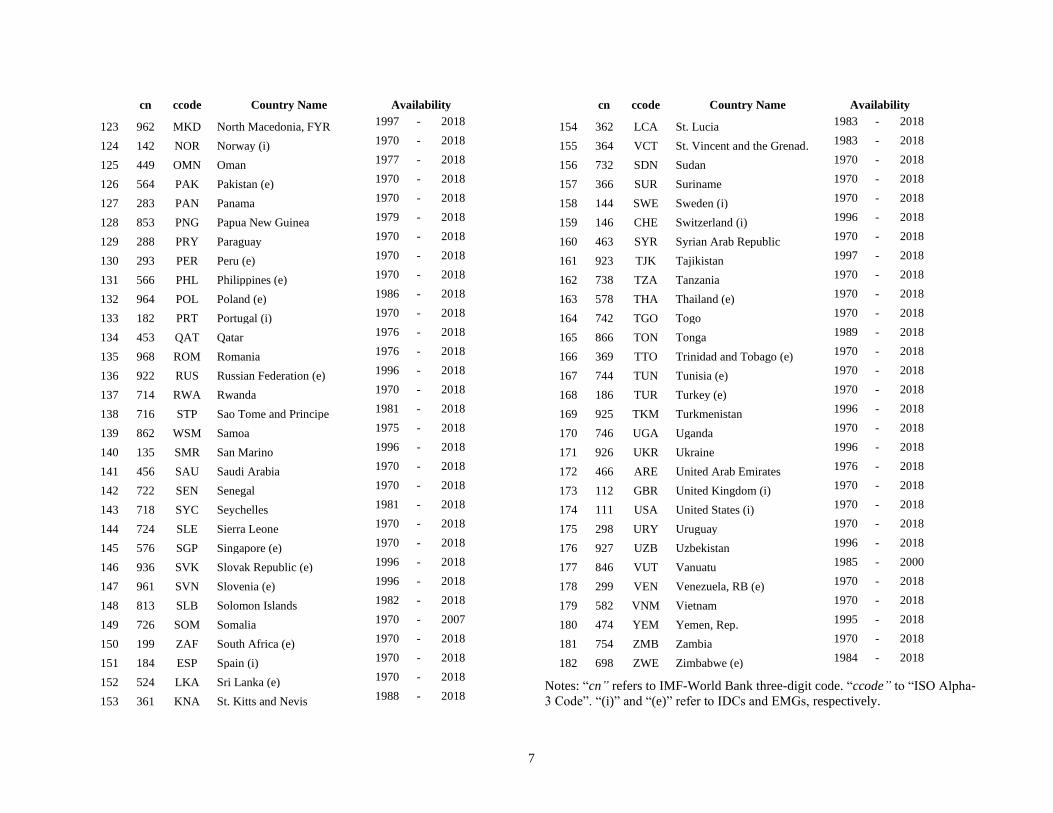
time period of 1970-2018 for 182 countries. In the dataset, cn refers to IMF-World Bank three-
1 Not all the countries report their regulatory controls as of the end of the year of concern. For each country, the
report stipulates the date as of which the data are based.
2
digit code; ccode to “ISO Alpha-3 Code”; kaopen to the Chinn-Ito index; and ka_open to the
Chinn-Ito index normalized to range between zero and one. A complete list of the countries and
their data availability are presented in the Country List shown below.
Regarding KAOPEN
As is explained with details in Chinn and Ito (2006, 2008), KAOPEN is the first principal
component of the original variables pertaining to regulatory controls over current or capital
account transactions, the existence of multiple exchange rates, and the requirements of
surrendering export proceeds. For more details, refer to Chinn and Ito (2006, 2008).
Principal component analysis (PCA) is a statistical tool that extracts principal components (PCs),
which are orthogonal linear combinations of a set of variables based on their ability to capture
the variations of these variables. The first PC covers the greatest variance of the original
variables: (i.e., k1, k2, Share_k3, and k4). In the process of constructing PCs, the original
variables are standardized, which makes the mean of the PC zero, i.e., make the PC range
between negative and positive territories. See Anderson (2003) and other standard statistics
textbooks for additional discussions of PCA.
By the nature of the principal component, every time the data are updated to include the most
recent year’s data, the index is recalculated using the entire sample of the original variables,
including corrected/fixed data. Because of this procedure, the data for the older years are
recalculated, and the KAOPEN index becomes incompatible across different versions. Hence, the
summary statistics change across different versions of the index.
What’s new?
– KAOPEN is updated for 2018 using the data from AREAER 2019.
– It appears that the international sanctions against terrorist states have made some countries,
especially industrialized countries, start reporting implementations of capital controls from
2005 on. Hence, in the AREAER, the following countries appear as though they “imposed”
capital controls since 2005. However, given the nature of the “capital controls” and also
given the lack of perception or evidence that these countries did actually implement capital
controls in economically meaningful ways, we decided to consider that these countries did
not impose capital controls from 2005 on. Specifically, the original k3 is given the value of
zero for the following countries, except for France and Japan which appear to have imposed
“international sanctions” through k2 restrictions from 2006 on.
The countries of our concern here are:2
2 The figure in parentheses denotes the IMF-World Bank three-digit code. The same is true for the remainder of the
3
United States (111), Austria (122), Belgium (124), France (132), Germany (134), Sweden
(144), Switzerland (146), Japan (158), Finland (172), Greece (174), Portugal (182), Spain
(184), Czech Rep. (935), and Hungary (944).
– The variables of KAOPEN, k1, k2, k3, and k4 are replaced with missing variables for the
following countries and years because of the lack of functioning governments and financial
markets.
Afghanistan in 2001 to present
Iraq in 2003 to present
Somalia in 2008 to present
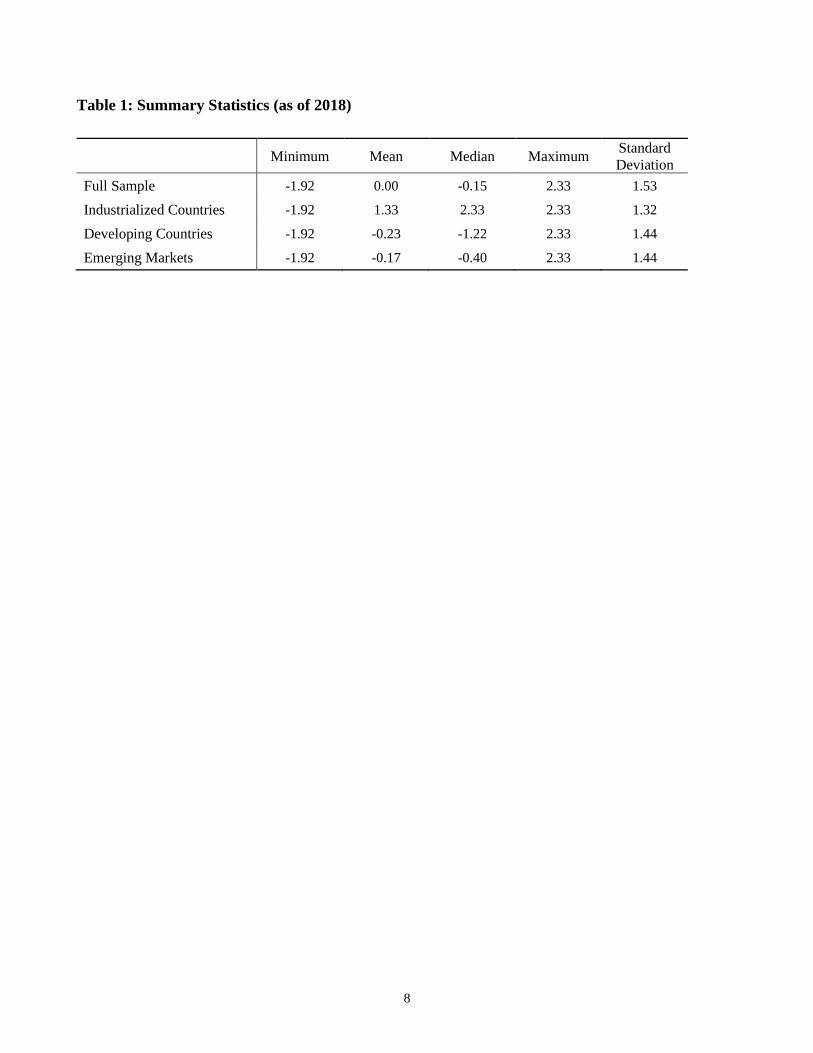
Summary Statistics of KAOPEN
The summary statistics of KAOPEN for different income groups are shown in Table 1.
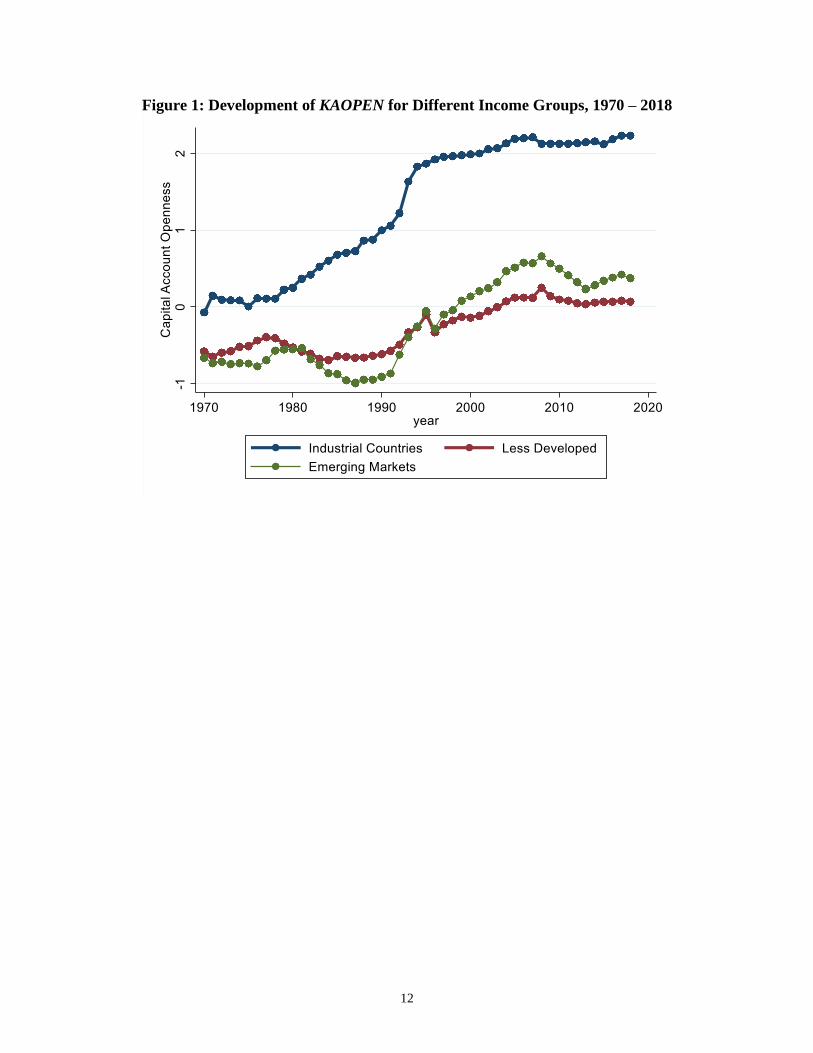
Figure 1 compares the subsample averages of KAOPEN for different income groups of
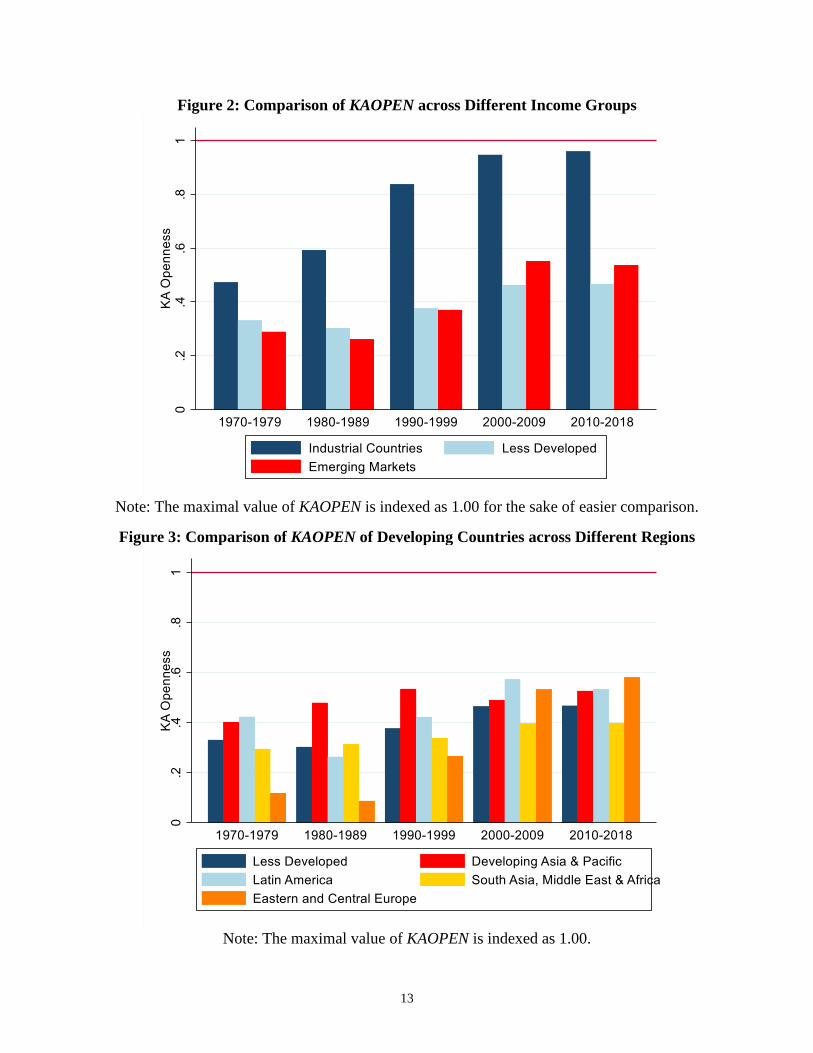
countries.3 Figure 2 does the same thing, but in terms of ratios with the maximal value
normalized as 1.00 (i.e., ka_open) for different income groups and decades. Figure 3 compares
the ratios of KAOPEN for developing countries across different geographical regions.
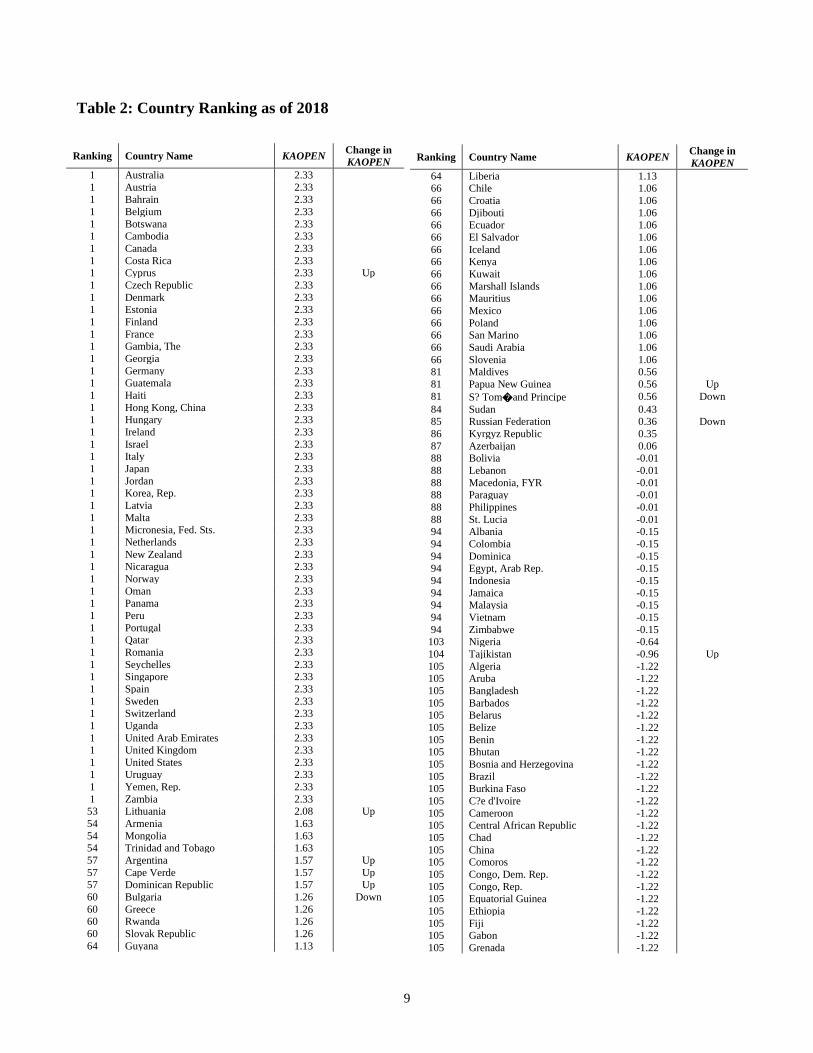
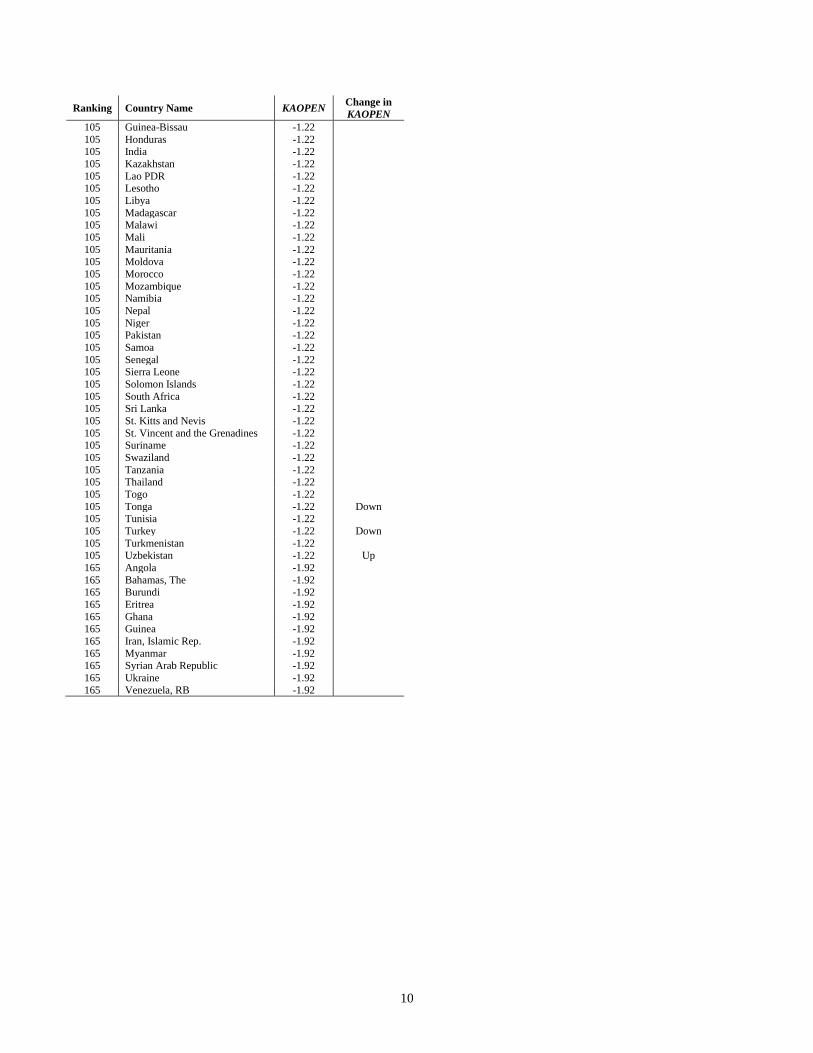
Table 2 ranks countries based on the level of KAOPEN as of 2018. The furthest right column
indicates whether a country of concern increased (“Up”) or decreased (“Down”) the level of
KAOPEN compared to that as of 2017. There are 52 countries that score the “most financially
open” value of 2.33 as of 2018 whereas there are 11 countries with the “least financial open”
score of -1.92.
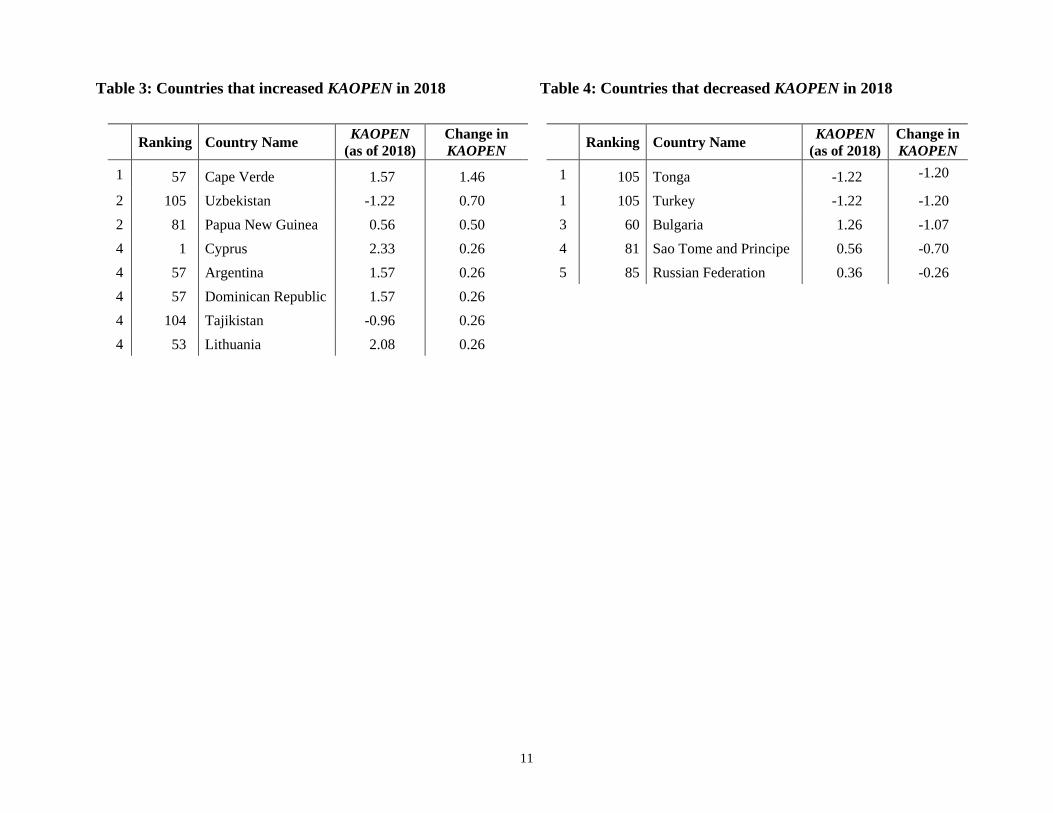
Table 3 reports that 8 countries increased the level of KAOPEN in 2018 while 5 countries
decreased the level of KAOPEN the same year.
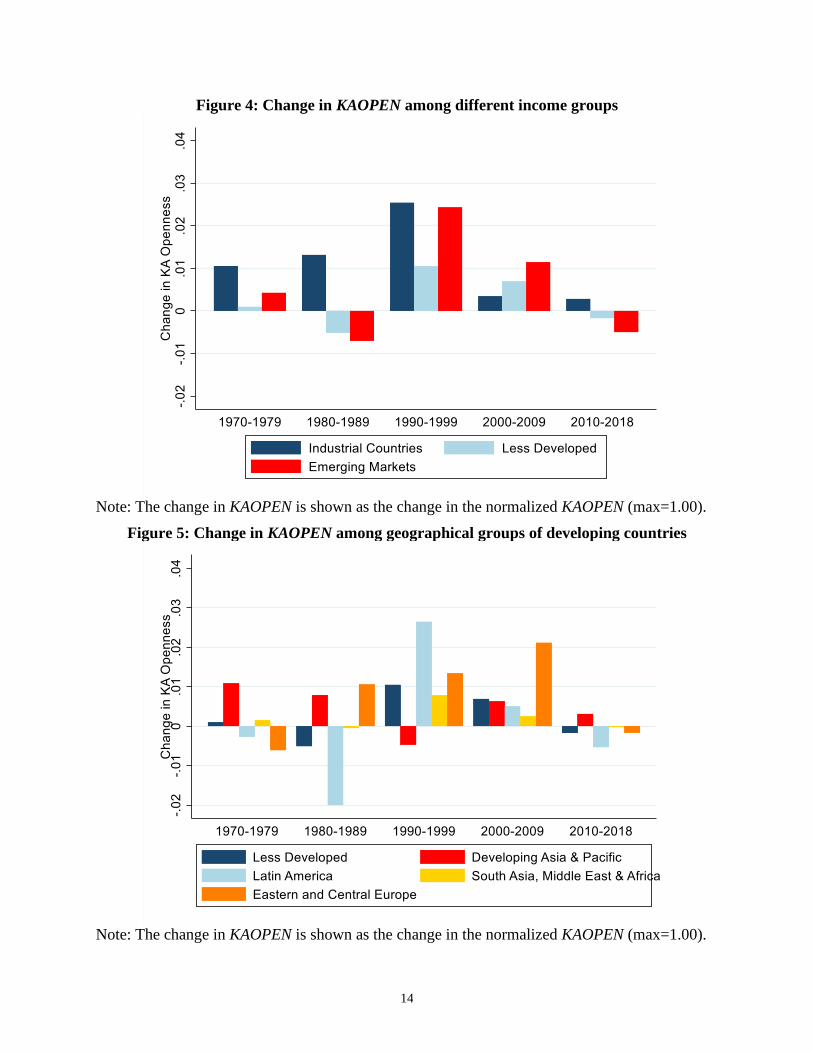
Figure 4 compares the averages of annual changes in KAOPEN (i.e., the first-differenced change
in the normalized KAOPEN) for different time periods and different income groups. Figure 5
does the same thing for different geographical groups of developing countries.
paper. 3 The industrialized countries (IDC) refer to traditional OECD countries, leaving the other countries as the
developing countries (LDC). The emerging market countries (EMGs), a subgroup of LDC, are defined as the
countries classified as either emerging or frontier during the period of 1980-1997 by the International Financial
Corporation plus Hong Kong and Singapore. In the country list shown in Appendix I, IDCs and EMGs are denoted
by “i” and “e”, respectively.
4
Notes
The dataset is available at http://web.pdx.edu/~ito/Chinn-Ito_website.htm .
The document “A New Measure of Financial Openness” details the construction of the index and
other relevant information. Please consult with that document before sending inquiries to
The IMF’s Annual Report on Exchange Arrangements and Exchange Restrictions (AREAER) of
2010 has a survey of the literature on various measures of capital account restrictiveness in
Appendix to Introduction (p. 48–53).
Next Update: The index might be updated in the spring or summer of 2021, following the
publication of the IMF’s AREAER 2020 (probably in the winter of 2020-21) which will contain
information on capital controls policies as of 2019. The release of the update may change due to
a variety of reasons. Please check http://web.pdx.edu/~ito/Chinn-Ito_website.htm before sending
us inquiries.
Disclaimer: When you use the index, please acknowledge our JDE paper (see below) as the
data source. We are not responsible for the results of the estimations that use the index.
Although the index is based on the information released by the International Monetary Fund,
the index is not associated with the Fund. All the errors of the index are the authors’ own. All
rights reserved.
References
Anderson, T. W. 2003. An Introduction to Multivariate Statistical Analysis, 3rd Edition, Wiley
Series in Probability and Statistics, New York: Wiley.
Chinn, Menzie D. and Hiro Ito (2008). “A New Measure of Financial Openness”. Journal of
Comparative Policy Analysis, Volume 10, Issue 3, p. 309 – 322 (September).
Chinn, Menzie D. and Hiro Ito (2006). “What Matters for Financial Development? Capital
Controls, Institutions, and Interactions,” Journal of Development Economics, Volume 81,
Issue 1, Pages 163-192 (October). The longer version is available as NBER Working
Paper No. 11370 (May 2005).
International Monetary Fund (2010, various years). Annual Report on Exchange Arrangements
and Exchange Restrictions (AREAER), Washington, D.C.: International Monetary Fund.
5
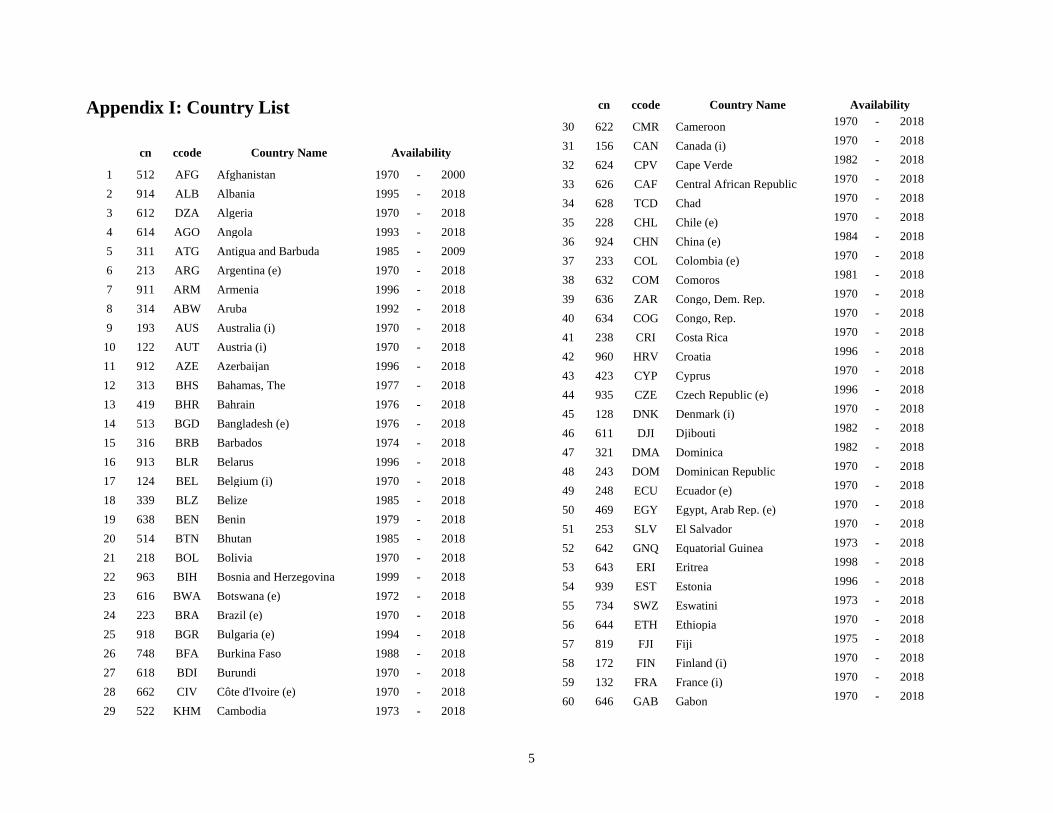
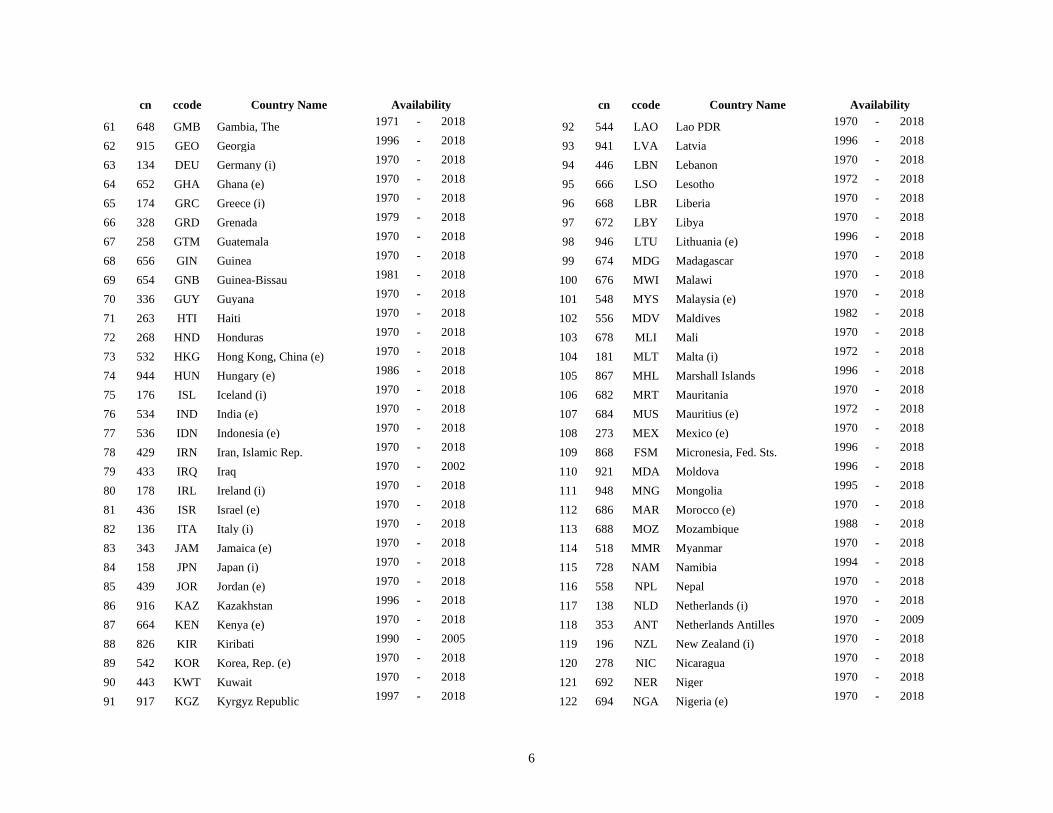
Appendix I: Country List
cn ccode Country Name Availability
1 512 AFG Afghanistan 1970 - 2000
2 914 ALB Albania 1995 - 2018
3 612 DZA Algeria 1970 - 2018
4 614 AGO Angola 1993 - 2018
5 311 ATG Antigua and Barbuda 1985 - 2009
6 213 ARG Argentina (e) 1970 - 2018
7 911 ARM Armenia 1996 - 2018
8 314 ABW Aruba 1992 - 2018
9 193 AUS Australia (i) 1970 - 2018
10 122 AUT Austria (i) 1970 - 2018
11 912 AZE Azerbaijan 1996 - 2018
12 313 BHS Bahamas, The 1977 - 2018
13 419 BHR Bahrain 1976 - 2018
14 513 BGD Bangladesh (e) 1976 - 2018
15 316 BRB Barbados 1974 - 2018
16 913 BLR Belarus 1996 - 2018
17 124 BEL Belgium (i) 1970 - 2018
18 339 BLZ Belize 1985 - 2018
19 638 BEN Benin 1979 - 2018
20 514 BTN Bhutan 1985 - 2018
21 218 BOL Bolivia 1970 - 2018
22 963 BIH Bosnia and Herzegovina 1999 - 2018
23 616 BWA Botswana (e) 1972 - 2018
24 223 BRA Brazil (e) 1970 - 2018
25 918 BGR Bulgaria (e) 1994 - 2018
26 748 BFA Burkina Faso 1988 - 2018
27 618 BDI Burundi 1970 - 2018
28 662 CIV Côte d'Ivoire (e) 1970 - 2018
29 522 KHM Cambodia 1973 - 2018
cn ccode Country Name Availability
30 622 CMR Cameroon 1970 - 2018
31 156 CAN Canada (i) 1970 - 2018
32 624 CPV Cape Verde 1982 - 2018
33 626 CAF Central African Republic 1970 - 2018
34 628 TCD Chad 1970 - 2018
35 228 CHL Chile (e) 1970 - 2018
36 924 CHN China (e) 1984 - 2018
37 233 COL Colombia (e) 1970 - 2018
38 632 COM Comoros 1981 - 2018
39 636 ZAR Congo, Dem. Rep. 1970 - 2018
40 634 COG Congo, Rep. 1970 - 2018
41 238 CRI Costa Rica 1970 - 2018
42 960 HRV Croatia 1996 - 2018
43 423 CYP Cyprus 1970 - 2018
44 935 CZE Czech Republic (e) 1996 - 2018
45 128 DNK Denmark (i) 1970 - 2018
46 611 DJI Djibouti 1982 - 2018
47 321 DMA Dominica 1982 - 2018
48 243 DOM Dominican Republic 1970 - 2018
49 248 ECU Ecuador (e) 1970 - 2018
50 469 EGY Egypt, Arab Rep. (e) 1970 - 2018
51 253 SLV El Salvador 1970 - 2018
52 642 GNQ Equatorial Guinea 1973 - 2018
53 643 ERI Eritrea 1998 - 2018
54 939 EST Estonia 1996 - 2018
55 734 SWZ Eswatini 1973 - 2018
56 644 ETH Ethiopia 1970 - 2018
57 819 FJI Fiji 1975 - 2018
58 172 FIN Finland (i) 1970 - 2018
59 132 FRA France (i) 1970 - 2018
60 646 GAB Gabon 1970 - 2018
6
cn ccode Country Name Availability
61 648 GMB Gambia, The 1971 - 2018
62 915 GEO Georgia 1996 - 2018
63 134 DEU Germany (i) 1970 - 2018
64 652 GHA Ghana (e) 1970 - 2018
65 174 GRC Greece (i) 1970 - 2018
66 328 GRD Grenada 1979 - 2018
67 258 GTM Guatemala 1970 - 2018
68 656 GIN Guinea 1970 - 2018
69 654 GNB Guinea-Bissau 1981 - 2018
70 336 GUY Guyana 1970 - 2018
71 263 HTI Haiti 1970 - 2018
72 268 HND Honduras 1970 - 2018
73 532 HKG Hong Kong, China (e) 1970 - 2018
74 944 HUN Hungary (e) 1986 - 2018
75 176 ISL Iceland (i) 1970 - 2018
76 534 IND India (e) 1970 - 2018
77 536 IDN Indonesia (e) 1970 - 2018
78 429 IRN Iran, Islamic Rep. 1970 - 2018
79 433 IRQ Iraq 1970 - 2002
80 178 IRL Ireland (i) 1970 - 2018
81 436 ISR Israel (e) 1970 - 2018
82 136 ITA Italy (i) 1970 - 2018
83 343 JAM Jamaica (e) 1970 - 2018
84 158 JPN Japan (i) 1970 - 2018
85 439 JOR Jordan (e) 1970 - 2018
86 916 KAZ Kazakhstan 1996 - 2018
87 664 KEN Kenya (e) 1970 - 2018
88 826 KIR Kiribati 1990 - 2005
89 542 KOR Korea, Rep. (e) 1970 - 2018
90 443 KWT Kuwait 1970 - 2018
91 917 KGZ Kyrgyz Republic 1997 - 2018
cn ccode Country Name Availability
92 544 LAO Lao PDR 1970 - 2018
93 941 LVA Latvia 1996 - 2018
94 446 LBN Lebanon 1970 - 2018
95 666 LSO Lesotho 1972 - 2018
96 668 LBR Liberia 1970 - 2018
97 672 LBY Libya 1970 - 2018
98 946 LTU Lithuania (e) 1996 - 2018
99 674 MDG Madagascar 1970 - 2018
100 676 MWI Malawi 1970 - 2018
101 548 MYS Malaysia (e) 1970 - 2018
102 556 MDV Maldives 1982 - 2018
103 678 MLI Mali 1970 - 2018
104 181 MLT Malta (i) 1972 - 2018
105 867 MHL Marshall Islands 1996 - 2018
106 682 MRT Mauritania 1970 - 2018
107 684 MUS Mauritius (e) 1972 - 2018
108 273 MEX Mexico (e) 1970 - 2018
109 868 FSM Micronesia, Fed. Sts. 1996 - 2018
110 921 MDA Moldova 1996 - 2018
111 948 MNG Mongolia 1995 - 2018
112 686 MAR Morocco (e) 1970 - 2018
113 688 MOZ Mozambique 1988 - 2018
114 518 MMR Myanmar 1970 - 2018
115 728 NAM Namibia 1994 - 2018
116 558 NPL Nepal 1970 - 2018
117 138 NLD Netherlands (i) 1970 - 2018
118 353 ANT Netherlands Antilles 1970 - 2009
119 196 NZL New Zealand (i) 1970 - 2018
120 278 NIC Nicaragua 1970 - 2018
121 692 NER Niger 1970 - 2018
122 694 NGA Nigeria (e) 1970 - 2018
7
cn ccode Country Name Availability
123 962 MKD North Macedonia, FYR 1997 - 2018
124 142 NOR Norway (i) 1970 - 2018
125 449 OMN Oman 1977 - 2018
126 564 PAK Pakistan (e) 1970 - 2018
127 283 PAN Panama 1970 - 2018
128 853 PNG Papua New Guinea 1979 - 2018
129 288 PRY Paraguay 1970 - 2018
130 293 PER Peru (e) 1970 - 2018
131 566 PHL Philippines (e) 1970 - 2018
132 964 POL Poland (e) 1986 - 2018
133 182 PRT Portugal (i) 1970 - 2018
134 453 QAT Qatar 1976 - 2018
135 968 ROM Romania 1976 - 2018
136 922 RUS Russian Federation (e) 1996 - 2018
137 714 RWA Rwanda 1970 - 2018
138 716 STP Sao Tome and Principe 1981 - 2018
139 862 WSM Samoa 1975 - 2018
140 135 SMR San Marino 1996 - 2018
141 456 SAU Saudi Arabia 1970 - 2018
142 722 SEN Senegal 1970 - 2018
143 718 SYC Seychelles 1981 - 2018
144 724 SLE Sierra Leone 1970 - 2018
145 576 SGP Singapore (e) 1970 - 2018
146 936 SVK Slovak Republic (e) 1996 - 2018
147 961 SVN Slovenia (e) 1996 - 2018
148 813 SLB Solomon Islands 1982 - 2018
149 726 SOM Somalia 1970 - 2007
150 199 ZAF South Africa (e) 1970 - 2018
151 184 ESP Spain (i) 1970 - 2018
152 524 LKA Sri Lanka (e) 1970 - 2018
153 361 KNA St. Kitts and Nevis 1988 - 2018
cn ccode Country Name Availability
154 362 LCA St. Lucia 1983 - 2018
155 364 VCT St. Vincent and the Grenad. 1983 - 2018
156 732 SDN Sudan 1970 - 2018
157 366 SUR Suriname 1970 - 2018
158 144 SWE Sweden (i) 1970 - 2018
159 146 CHE Switzerland (i) 1996 - 2018
160 463 SYR Syrian Arab Republic 1970 - 2018
161 923 TJK Tajikistan 1997 - 2018
162 738 TZA Tanzania 1970 - 2018
163 578 THA Thailand (e) 1970 - 2018
164 742 TGO Togo 1970 - 2018
165 866 TON Tonga 1989 - 2018
166 369 TTO Trinidad and Tobago (e) 1970 - 2018
167 744 TUN Tunisia (e) 1970 - 2018
168 186 TUR Turkey (e) 1970 - 2018
169 925 TKM Turkmenistan 1996 - 2018
170 746 UGA Uganda 1970 - 2018
171 926 UKR Ukraine 1996 - 2018
172 466 ARE United Arab Emirates 1976 - 2018
173 112 GBR United Kingdom (i) 1970 - 2018
174 111 USA United States (i) 1970 - 2018
175 298 URY Uruguay 1970 - 2018
176 927 UZB Uzbekistan 1996 - 2018
177 846 VUT Vanuatu 1985 - 2000
178 299 VEN Venezuela, RB (e) 1970 - 2018
179 582 VNM Vietnam 1970 - 2018
180 474 YEM Yemen, Rep. 1995 - 2018
181 754 ZMB Zambia 1970 - 2018
182 698 ZWE Zimbabwe (e) 1984 - 2018
Notes: “cn” refers to IMF-World Bank three-digit code. “ccode” to “ISO Alpha-
3 Code”. “(i)” and “(e)” refer to IDCs and EMGs, respectively.
8
Table 1: Summary Statistics (as of 2018)
Minimum Mean Median Maximum
Standard
Deviation
Full Sample -1.92 0.00 -0.15 2.33 1.53
Industrialized Countries -1.92 1.33 2.33 2.33 1.32
Developing Countries -1.92 -0.23 -1.22 2.33 1.44
Emerging Markets -1.92 -0.17 -0.40 2.33 1.44
9
Table 2: Country Ranking as of 2018
Ranking Country Name KAOPEN Change in
KAOPEN
1 Australia 2.33
1 Austria 2.33 1 Bahrain 2.33
1 Belgium 2.33
1 Botswana 2.33 1 Cambodia 2.33
1 Canada 2.33
1 Costa Rica 2.33 1 Cyprus 2.33 Up
1 Czech Republic 2.33
1 Denmark 2.33 1 Estonia 2.33
1 Finland 2.33
1 France 2.33 1 Gambia, The 2.33
1 Georgia 2.33
1 Germany 2.33 1 Guatemala 2.33
1 Haiti 2.33
1 Hong Kong, China 2.33 1 Hungary 2.33
1 Ireland 2.33
1 Israel 2.33 1 Italy 2.33
1 Japan 2.33
1 Jordan 2.33 1 Korea, Rep. 2.33
1 Latvia 2.33
1 Malta 2.33 1 Micronesia, Fed. Sts. 2.33
1 Netherlands 2.33
1 New Zealand 2.33 1 Nicaragua 2.33
1 Norway 2.33
1 Oman 2.33 1 Panama 2.33
1 Peru 2.33
1 Portugal 2.33 1 Qatar 2.33
1 Romania 2.33
1 Seychelles 2.33 1 Singapore 2.33
1 Spain 2.33
1 Sweden 2.33 1 Switzerland 2.33
1 Uganda 2.33
1 United Arab Emirates 2.33 1 United Kingdom 2.33
1 United States 2.33 1 Uruguay 2.33
1 Yemen, Rep. 2.33
1 Zambia 2.33 53 Lithuania 2.08 Up
54 Armenia 1.63
54 Mongolia 1.63 54 Trinidad and Tobago 1.63
57 Argentina 1.57 Up
57 Cape Verde 1.57 Up 57 Dominican Republic 1.57 Up
60 Bulgaria 1.26 Down
60 Greece 1.26 60 Rwanda 1.26
60 Slovak Republic 1.26
64 Guyana 1.13
Ranking Country Name KAOPEN Change in
KAOPEN
64 Liberia 1.13 66 Chile 1.06
66 Croatia 1.06
66 Djibouti 1.06 66 Ecuador 1.06
66 El Salvador 1.06
66 Iceland 1.06 66 Kenya 1.06
66 Kuwait 1.06
66 Marshall Islands 1.06 66 Mauritius 1.06
66 Mexico 1.06
66 Poland 1.06
66 San Marino 1.06
66 Saudi Arabia 1.06
66 Slovenia 1.06 81 Maldives 0.56
81 Papua New Guinea 0.56 Up
81 S? Tom�and Principe 0.56 Down
84 Sudan 0.43 85 Russian Federation 0.36 Down
86 Kyrgyz Republic 0.35
87 Azerbaijan 0.06 88 Bolivia -0.01
88 Lebanon -0.01
88 Macedonia, FYR -0.01 88 Paraguay -0.01
88 Philippines -0.01
88 St. Lucia -0.01 94 Albania -0.15
94 Colombia -0.15
94 Dominica -0.15 94 Egypt, Arab Rep. -0.15
94 Indonesia -0.15
94 Jamaica -0.15 94 Malaysia -0.15
94 Vietnam -0.15
94 Zimbabwe -0.15 103 Nigeria -0.64
104 Tajikistan -0.96 Up
105 Algeria -1.22 105 Aruba -1.22
105 Bangladesh -1.22
105 Barbados -1.22 105 Belarus -1.22
105 Belize -1.22
105 Benin -1.22 105 Bhutan -1.22
105 Bosnia and Herzegovina -1.22
105 Brazil -1.22 105 Burkina Faso -1.22
105 C?e d'Ivoire -1.22
105 Cameroon -1.22 105 Central African Republic -1.22
105 Chad -1.22
105 China -1.22 105 Comoros -1.22
105 Congo, Dem. Rep. -1.22
105 Congo, Rep. -1.22 105 Equatorial Guinea -1.22
105 Ethiopia -1.22
105 Fiji -1.22 105 Gabon -1.22
105 Grenada -1.22
10
Ranking Country Name KAOPEN Change in
KAOPEN
105 Guinea-Bissau -1.22
105 Honduras -1.22 105 India -1.22
105 Kazakhstan -1.22
105 Lao PDR -1.22 105 Lesotho -1.22
105 Libya -1.22
105 Madagascar -1.22 105 Malawi -1.22
105 Mali -1.22
105 Mauritania -1.22 105 Moldova -1.22
105 Morocco -1.22
105 Mozambique -1.22 105 Namibia -1.22
105 Nepal -1.22
105 Niger -1.22
105 Pakistan -1.22
105 Samoa -1.22
105 Senegal -1.22 105 Sierra Leone -1.22
105 Solomon Islands -1.22
105 South Africa -1.22 105 Sri Lanka -1.22
105 St. Kitts and Nevis -1.22
105 St. Vincent and the Grenadines -1.22 105 Suriname -1.22
105 Swaziland -1.22
105 Tanzania -1.22 105 Thailand -1.22
105 Togo -1.22
105 Tonga -1.22 Down 105 Tunisia -1.22
105 Turkey -1.22 Down
105 Turkmenistan -1.22
105 Uzbekistan -1.22 Up
165 Angola -1.92
165 Bahamas, The -1.92 165 Burundi -1.92
165 Eritrea -1.92
165 Ghana -1.92 165 Guinea -1.92
165 Iran, Islamic Rep. -1.92
165 Myanmar -1.92 165 Syrian Arab Republic -1.92
165 Ukraine -1.92
165 Venezuela, RB -1.92
11
Table 3: Countries that increased KAOPEN in 2018
Ranking Country Name
KAOPEN
(as of 2018)
Change in
KAOPEN
1 57 Cape Verde 1.57 1.46
2 105 Uzbekistan -1.22 0.70
2 81 Papua New Guinea 0.56 0.50
4 1 Cyprus 2.33 0.26
4 57 Argentina 1.57 0.26
4 57 Dominican Republic 1.57 0.26
4 104 Tajikistan -0.96 0.26
4 53 Lithuania 2.08 0.26
Table 4: Countries that decreased KAOPEN in 2018
Ranking Country Name
KAOPEN
(as of 2018)
Change in
KAOPEN
1 105 Tonga -1.22 -1.20
1 105 Turkey -1.22 -1.20
3 60 Bulgaria 1.26 -1.07
4 81 Sao Tome and Principe 0.56 -0.70
5 85 Russian Federation 0.36 -0.26
12
Figure 1: Development of KAOPEN for Different Income Groups, 1970 – 2018
13
Figure 2: Comparison of KAOPEN across Different Income Groups
Note: The maximal value of KAOPEN is indexed as 1.00 for the sake of easier comparison.
Figure 3: Comparison of KAOPEN of Developing Countries across Different Regions
Note: The maximal value of KAOPEN is indexed as 1.00.
14
Figure 4: Change in KAOPEN among different income groups
Note: The change in KAOPEN is shown as the change in the normalized KAOPEN (max=1.00).
Figure 5: Change in KAOPEN among geographical groups of developing countries
Note: The change in KAOPEN is shown as the change in the normalized KAOPEN (max=1.00).
Recommended