The WorkSite Company
NorthWrite - MBCx Quick Start Training Guide
1300 Godward St. NE Suite 6800 Minneapolis, MN 55413 877.743.4232
The following pages are intended to guide new users to the WorkSite and provide the simple steps required to begin adding users, setting up notifications, viewing energy use and engaging in the Energy Savings Measure (ESM) implementation process. For a more complete training or explanation of specific functionality, please contact NorthWrite Customer Support.

Getting Started To login to the WorkSite, go to www.myworksite.com and enter your user name and password.
Dashboard View
To open a live chat with NorthWrite Customer Support, click on the Live Support button
To add new users and set up notifications, go
to Manage WorkSite
The energy applications are found
under the Tools menu
The Dashboard can be customized by clicking on the customize link at the bottom of the screen

Add a New User
1. Select Manage WorkSite from the Administration menu 2. Select the Users tab 3. Choose the Add New Account button 4. Fill in the form (We suggest using email addresses for user names as each user name in our
system must be unique. This also allows the system to send a “Welcome to MyWorkSite” email with login instructions to the new user. Make sure that the time zone is correct.)
5. Click Submit
1
3
2
4
5
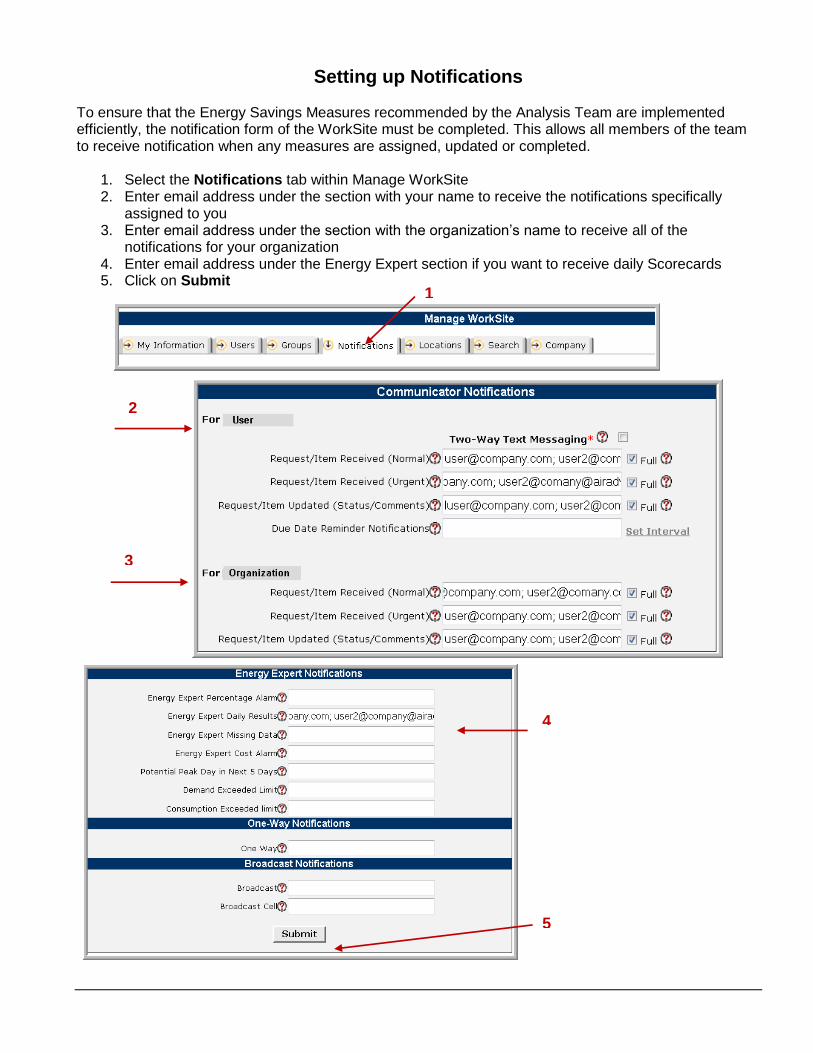
Setting up Notifications
To ensure that the Energy Savings Measures recommended by the Analysis Team are implemented efficiently, the notification form of the WorkSite must be completed. This allows all members of the team to receive notification when any measures are assigned, updated or completed.
1. Select the Notifications tab within Manage WorkSite 2. Enter email address under the section with your name to receive the notifications specifically
assigned to you 3. Enter email address under the section with the organization’s name to receive all of the
notifications for your organization 4. Enter email address under the Energy Expert section if you want to receive daily Scorecards 5. Click on Submit
1
2
3
4
5

Viewing and Working with Energy Savings Measures
Once the Energy Monitoring baseline period, environmental monitoring and all surveys have been completed, a set of Energy Savings Measures will be entered into Communicator to track their progress. If notifications are properly configured, an email notification is delivered to inform the user the ESMs are available.
1. Select Communicator from the Tools menu 2. Click on the Item#, time or task type links to open the request
1
2

Opening the work order item allows the user to update the Request Status and Percent Done fields, as well as attach files and/or add comments. Every time a change is made, it is time/date stamped by the user that made the change.

Meter Monitoring
1. Select Meter Monitoring from the tools menu 2. If monitoring multiple points, select the desired meter from the dropdown menu 3. Click directly on the graphs and an expanded version of the graph with more detail is displayed 4. To change the period for comparison, click on the calendar icons to change the dates and click on
Submit
4
1
3 2

1. Click on the meter name to establish alarm thresholds 2. Enter the high or low values in the Monitor Edit box and click Update 3. Click on the History icon to access your interval data, create basic charts of usage and export this
data to Excel.
1 3
2

Energy Expert
1. Select Energy Expert from the Tools menu 2. Expand the tree diagram in the left panel to reveal all Experts 3. Click on the Expert’s name next to the spyglass icon to see the Scorecard
1
2
3

Scorecard Tab
Calculated energy
savings/costs for the day and cumulative days
Timeline at the top of the screen indicates when high/low temps occurred and when the peak electric demand occurred
Actual and expected consumption values with corresponding color-coded box indicating high, low, or within expected range of energy consumption
Comments box for recording explanation of data
Graph of energy demand over time with shaded area representing building occupancy
Five day forecast predicting potential for peak consumption days
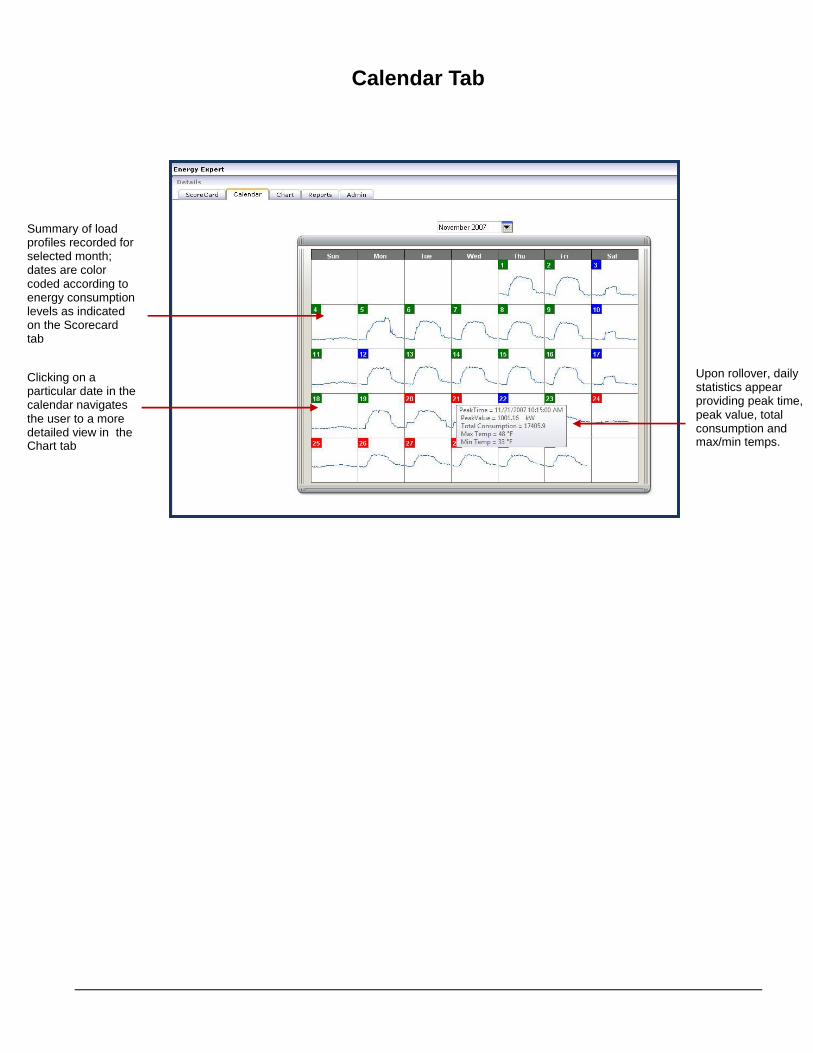
Calendar Tab
Summary of load profiles recorded for selected month; dates are color coded according to energy consumption levels as indicated on the Scorecard tab
Upon rollover, daily statistics appear providing peak time, peak value, total consumption and max/min temps.
Clicking on a particular date in the calendar navigates the user to a more detailed view in the Chart tab
Recommended