Northwest Power and ConservationCouncil
Model Conservation Model Conservation StandardsStandards
Economic AnalysisEconomic Analysis
for for
New Single Family and New Single Family and Manufactured Home ConstructionManufactured Home Construction
June 9, 2009June 9, 2009
slide 2
Northwest Power and ConservationCouncil
slide 4
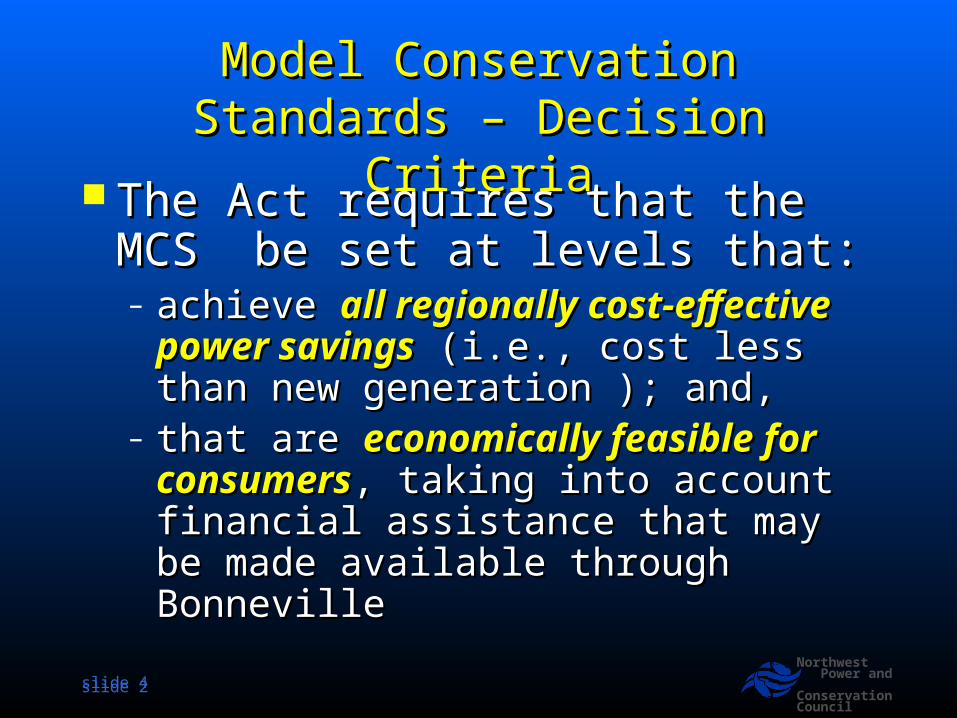
Model Conservation Standards – Model Conservation Standards – Decision CriteriaDecision Criteria
The Act requires that the MCS be set The Act requires that the MCS be set at levels that:at levels that:– achieve achieve all regionally cost-effective power all regionally cost-effective power
savingssavings (i.e., cost less than new generation ); (i.e., cost less than new generation ); and,and,
– that are that are economically feasible for economically feasible for consumersconsumers, taking into account financial , taking into account financial assistance that may be made available assistance that may be made available through Bonnevillethrough Bonneville

slide 3
Northwest Power and ConservationCouncil
slide 8
Cost-Effectiveness ReviewCost-Effectiveness Review
Issues:Issues:– Are there additional “cost-effective” and Are there additional “cost-effective” and
“economically feasible” thermal shell “economically feasible” thermal shell measures? (5measures? (5thth Plan did not identify any) Plan did not identify any)
– Are there non-thermal shell measures (e.g. Are there non-thermal shell measures (e.g. HVAC equipment, lighting, water heating, HVAC equipment, lighting, water heating, appliances) that should be considered for appliances) that should be considered for inclusion in the MCS?inclusion in the MCS?

slide 4
Northwest Power and ConservationCouncil
Where Are We?Where Are We?(Thermal Shell Only)(Thermal Shell Only)
0%10%20%30%40%50%60%70%80%90%
100%
Use
Rela
tive T
o 1
983
Codes
Zone 1 Zone 2 Zone 3
1983 1986 1989 1992 2009 5th Plan MCS

slide 5
Northwest Power and ConservationCouncil
Where Are We?Where Are We?Other MeasuresOther Measures
Oregon CodeOregon Code– Requires ~50% of lamps be “CFL” equivalentRequires ~50% of lamps be “CFL” equivalent– Requires use of PTCS duct sealing Requires use of PTCS duct sealing oror higher efficiency Heat Pump higher efficiency Heat Pump
(HSPF 8.5)(HSPF 8.5) Washington Code (July 2010)Washington Code (July 2010)
– Requires ~50% of lamps be “CFL” equivalentRequires ~50% of lamps be “CFL” equivalent– Requires “duct sealing” or interior ductsRequires “duct sealing” or interior ducts
Montana & IdahoMontana & Idaho– ““Scheduled” to adopt 2009 International Energy Conservation Scheduled” to adopt 2009 International Energy Conservation
Code (IECC)Code (IECC)– 2009 IECC requires2009 IECC requires
» Requires better insulated above grade and below grade wallsRequires better insulated above grade and below grade walls» Requires “duct sealing”Requires “duct sealing”» Requires ~50% of lamps be “CFL” equivalentRequires ~50% of lamps be “CFL” equivalent
slide 6
Northwest Power and ConservationCouncil
slide 9
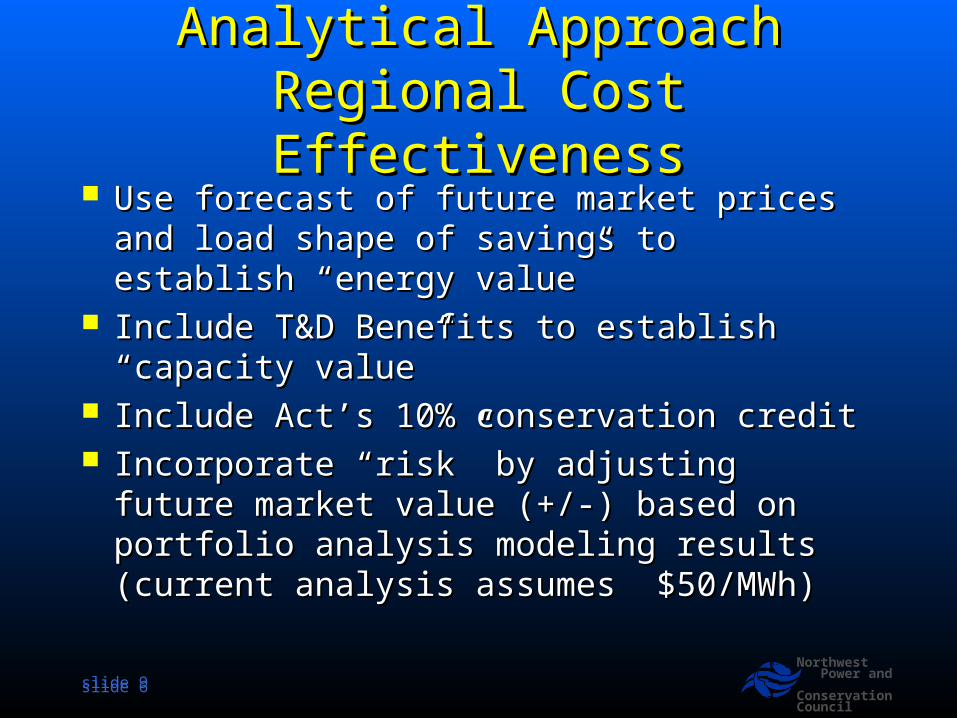
Analytical ApproachAnalytical ApproachRegional Cost EffectivenessRegional Cost Effectiveness
Use forecast of future market prices and load Use forecast of future market prices and load shape of savings to establish “energy value”shape of savings to establish “energy value”
Include T&D Benefits to establish “capacity Include T&D Benefits to establish “capacity value”value”
Include Act’s 10% conservation creditInclude Act’s 10% conservation credit Incorporate “risk” by adjusting future market Incorporate “risk” by adjusting future market
value (+/-) based on portfolio analysis modeling value (+/-) based on portfolio analysis modeling results (current analysis assumes $50/MWh)results (current analysis assumes $50/MWh)

slide 7
Northwest Power and ConservationCouncil
Analytical ApproachAnalytical ApproachEconomic FeasibilityEconomic Feasibility
Compares “Life Cycle Cost” of home ownership Compares “Life Cycle Cost” of home ownership of dwelling meeting current codes to one built to of dwelling meeting current codes to one built to higher levels of efficiencyhigher levels of efficiency
Includes Present Value of:Includes Present Value of:– DownpaymentDownpayment– Mortgage Principal & Interest (including private Mortgage Principal & Interest (including private
mortgage insurance when downpayment less than 20%)mortgage insurance when downpayment less than 20%)– Property TaxesProperty Taxes– Homeowner’s InsuranceHomeowner’s Insurance– Energy CostEnergy Cost
Taxes and Interest Payments Adjusted for Income Taxes and Interest Payments Adjusted for Income Tax EffectsTax Effects

slide 8
Northwest Power and ConservationCouncil
Economic Feasibility = Economic Feasibility = Lowest Life Cycle Cost Lowest Life Cycle Cost
Step 1 – Identify the “lowest life cycle cost” code compliant home for Step 1 – Identify the “lowest life cycle cost” code compliant home for each heating zone as “base case,” each heating zone as “base case,” independent of space conditioning independent of space conditioning system type and including lighting and water heatingsystem type and including lighting and water heating..
Step 2 – Identify the “lowest life cycle cost” package of energy Step 2 – Identify the “lowest life cycle cost” package of energy efficiency improvements to the code home for each heating zone efficiency improvements to the code home for each heating zone independent of space conditioning system type and including lighting independent of space conditioning system type and including lighting and water heatingand water heating..
Methodology: Use a “Monte Carlo” model to identify lowest average Methodology: Use a “Monte Carlo” model to identify lowest average “life-cycle” cost package for each climate zone by testing multiple “life-cycle” cost package for each climate zone by testing multiple (1500+) combinations of values for major financial input assumptions, (1500+) combinations of values for major financial input assumptions, e.g. mortgage rates, retail electric rates, marginal tax rates and e.g. mortgage rates, retail electric rates, marginal tax rates and alternative packages of thermal shell efficiency, HVAC equipment alternative packages of thermal shell efficiency, HVAC equipment efficiency, lighting efficiency, etc.efficiency, lighting efficiency, etc.

slide 9
Northwest Power and ConservationCouncil
slide 10
Life Cycle Cost Life Cycle Cost Input AssumptionsInput Assumptions
Mortgage Rate and Term (Based on 1985 – 2007 data)Mortgage Rate and Term (Based on 1985 – 2007 data) Consumer Discount RateConsumer Discount Rate Downpayment (Based on 1985 -2005 data)Downpayment (Based on 1985 -2005 data) Private Mortgage Insurance (for less than 20% down)Private Mortgage Insurance (for less than 20% down) Retail Electricity Price (2007 utility specific average Retail Electricity Price (2007 utility specific average
revenue/kWh)revenue/kWh) Retail Electricity Escalation Rate (6Retail Electricity Escalation Rate (6 thth Plan/Global Insights) Plan/Global Insights) State and Federal Income Tax Rate (2009 Rates)State and Federal Income Tax Rate (2009 Rates) State Property Tax Rate (2008-09 rates)State Property Tax Rate (2008-09 rates) Homeowner’s Insurance RateHomeowner’s Insurance Rate Measure Incremental CostMeasure Incremental Cost Measure Incremental SavingsMeasure Incremental Savings

slide 10
Northwest Power and ConservationCouncil
Illustrative Annual “Cash Flow”Illustrative Annual “Cash Flow”
$0
$200
$400
$600
$800
$1,000
$1,200
$1,400
$1,600
1 25 49 73 97 121 145 169
Payment Number
Month
ly P
ITI+
E
Space Conditioning &Water Heating EnergyCostLighting Energy Cost
Insurance Cost
Property Tax Deduction
Property Tax
Interest Deduction
Interest
Principal

slide 11
Northwest Power and ConservationCouncil
Consumer Life Cycle Cost Model Considers Consumer Life Cycle Cost Model Considers UncertaintyUncertainty
05
1015
2025
3035
4045
50
0.7%
1.0%
1.2%
1.5%
1.8%
2.1%
2.4%
2.6%
2.9%
3.2%
3.5%
3.8%
4.0%
4.3%
4.6%
4.9%
5.1%
Retai Electricity Price Escalation Rate
Frequency
0%
2%
4%
6%
8%
10%
12%
14%
16%
5.0% 6.0% 7.0% 8.0% 9.0%
Nominal Morgage Rate (% APR)
Prob
ab
ilit
y (
%)
0%
2%
4%
6%
8%
10%
12%
14%
16%
18%
Downpayment (% )
Pro
babil
ity (
%)
0%
5%
10%
15%
20%
25%
30%
35%
40%
45%
Retail Rate (2000$/ kWh)
Sh
are
of
Hom
eb
uyers
(%
)0%
5%
10%
15%
20%
25%
30%
35%
10% 21% 27% 31% 39%
Marginal Federal Income Tax Rate
Sh
are
of
Hom
ebu
yers
(%
)
0%
10%
20%
30%
40%
50%
60%
70%
0.0% 5.1% 7.0% 7.1% 7.8% 9.0%
Marginal State Income Tax Rate
Sh
are
of
Hom
ebu
yers
(%
)
0%
10%
20%
30%
40%
50%
60%
Sh
are
of
Ho
meb
uyers
1.14% 1.23% 1.49%
Frequency Chart
Dollars
Mean = $689.000
.011
.022
.032
.043
0
10.75
21.5
32.25
43
($3,509) ($1,131) $1,247 $3,625 $6,003
1,000 Trials 1,000 Displayed
Forecast: WALL R21 STD+R5
Slab R0 - R10 Full Slab w/R5 TB
Infiltration 0.35 ach - 0.20 ach w/Heat Recovery Ventilation
Floor R30 - R38 w/12" Truss
Below Grade Wall R21 Std to R21 w/R5
Heat Pump HSPF 9.0/SEER 14Attic R49 Adv - R60 Adv
Heat Pump HSPF 8.5/SEER 14Attic R38 - R49 Advanced
EF 2.20.6NoneHeat Pump HSPF 7.7/SEER 13Above Grade Wall R30 SSP - R33 (DBL)
EF 0.940.8InteriorElectric FAF w/ Central ACAbove Grade Wall R21 Std w/R5 - R30 (SSP)
EF 0.921.1YesPTCSElectric FAF w/o ACAbove Grade Wall R21 Std - R21 Std w/R5
EF 0.901.75NoStandardZonalAbove Grade Wall R19 Std - R21 Adv
DHW System Option
Lighting Power Density (W) Option
HVAC Commissioning Option
Duct System OptionHVAC System OptionThermal Shell Option
0
10
20
30
40
50
60
$1,223 $1,401 $1,579 $1,758 $1,936
Installed Cost EF 2.2 Water Heater
Frequency
slide 12
Northwest Power and ConservationCouncil
slide 11
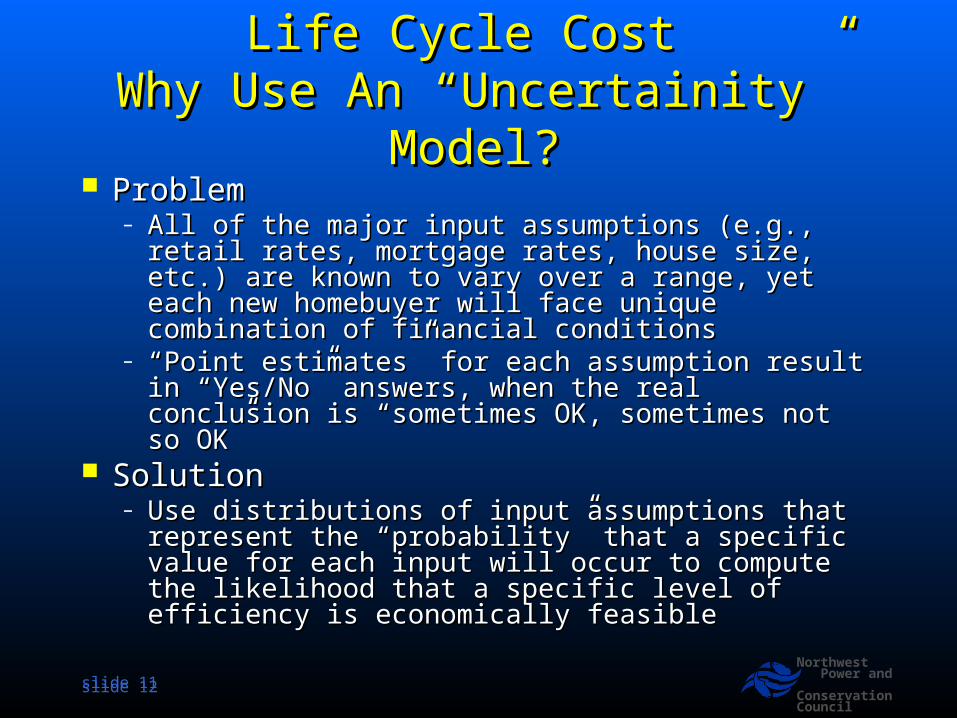
Life Cycle Cost Life Cycle Cost Why Use An “Uncertainity” Model?Why Use An “Uncertainity” Model? ProblemProblem
– All of the major input assumptions (e.g., retail rates, All of the major input assumptions (e.g., retail rates, mortgage rates, house size, etc.) are known to vary over mortgage rates, house size, etc.) are known to vary over a range, yet each new homebuyer will face unique a range, yet each new homebuyer will face unique combination of financial conditions combination of financial conditions
– ““Point estimates” for each assumption result in Point estimates” for each assumption result in “Yes/No” answers, when the real conclusion is “Yes/No” answers, when the real conclusion is “sometimes OK, sometimes not so OK”“sometimes OK, sometimes not so OK”
Solution Solution – Use distributions of input assumptions that represent Use distributions of input assumptions that represent
the “probability” that a specific value for each input the “probability” that a specific value for each input will occur to compute the likelihood that a specific will occur to compute the likelihood that a specific level of efficiency is economically feasiblelevel of efficiency is economically feasible

slide 13
Northwest Power and ConservationCouncil
Sample Distribution of Life Cycle Sample Distribution of Life Cycle Cost for Heating Zone 1 Base CaseCost for Heating Zone 1 Base Case
0
5
10
15
20
25
30
$64,000 $164,000 $264,000 $364,000 $464,000
Life Cycle Cost (2006$)
Frequency

slide 14
Northwest Power and ConservationCouncil
Scope of AnalysisScope of Analysis
New Site Built Family and Manufactured Home Construction New Site Built Family and Manufactured Home Construction Analysis covers thermal shell, HVAC, Hot Water Heating & Lighting Analysis covers thermal shell, HVAC, Hot Water Heating & Lighting
improvements to homes with:improvements to homes with:– Zonal Electric HeatZonal Electric Heat– Air Source heat pumps Air Source heat pumps – Electric Force-air furnaces with and without central air conditioningElectric Force-air furnaces with and without central air conditioning
Tested:Tested:– Eleven shell efficiency levels for site built homes and ten shell efficiency Eleven shell efficiency levels for site built homes and ten shell efficiency
levels for manufactured homes levels for manufactured homes – Three HVAC equipment efficiency levelsThree HVAC equipment efficiency levels– Three HVAC duct efficiency levelsThree HVAC duct efficiency levels– Four Water Heating Efficiency LevelsFour Water Heating Efficiency Levels– Four lighting efficiency improvement levelsFour lighting efficiency improvement levels

Efficiency PackagesEfficiency PackagesSite Built HomesSite Built Homes
Thermal Shell OptionThermal Shell Option HVAC System OptionHVAC System Option Duct Duct SystemSystem
OptionOption
HVAC HVAC CommissioningCommissioning
OptionOption
Lighting Lighting Power Power Density (W) Density (W) OptionOption
DHW DHW SystemSystem
OptionOption
Above Grade Wall R19 Std - R21 Above Grade Wall R19 Std - R21 AdvAdv
ZonalZonal StandardStandard NoNo 1.751.75 EF 0.90EF 0.90
Above Grade Wall R21 Std - R21 Above Grade Wall R21 Std - R21 Std w/R5 Std w/R5
Electric FAF w/o ACElectric FAF w/o AC PTCSPTCS YesYes 1.11.1 EF 0.92EF 0.92
Above Grade Wall R21 Std w/R5 Above Grade Wall R21 Std w/R5 - R30 (SSP)- R30 (SSP)
Electric FAF w/ Central ACElectric FAF w/ Central AC InteriorInterior 0.80.8 EF 0.94EF 0.94
Above Grade Wall R30 SSP - Above Grade Wall R30 SSP - R33 (DBL)R33 (DBL)
Heat Pump HSPF 7.7/SEER 13Heat Pump HSPF 7.7/SEER 13 NoneNone 0.60.6 EF 2.2 EF 2.2
Attic R38 - R49 AdvancedAttic R38 - R49 Advanced Heat Pump HSPF 8.5/SEER 14Heat Pump HSPF 8.5/SEER 14
Attic R49 Advanced - R60 Attic R49 Advanced - R60 AdvancedAdvanced
Heat Pump HSPF 9.0/SEER 14Heat Pump HSPF 9.0/SEER 14
Below Grade Wall R21 Std to Below Grade Wall R21 Std to R21 w/R5R21 w/R5
Floor R30 - R38 w/12" TrussFloor R30 - R38 w/12" Truss
Infiltration 0.35 ach - 0.20 ach Infiltration 0.35 ach - 0.20 ach w/Heat Recovery Ventilationw/Heat Recovery Ventilation
Slab R0 - R10 Full Slab w/R5 TBSlab R0 - R10 Full Slab w/R5 TB

slide 16
Northwest Power and ConservationCouncil
Efficiency PackagesEfficiency PackagesManufactured HomesManufactured Homes
Thermal Shell OptionThermal Shell Option HVAC System OptionHVAC System Option Duct Duct SystemSystem
OptionOption
HVAC HVAC CommissioningCommissioning
OptionOption
Lighting Lighting Power Density Power Density (W) Option(W) Option
DHW DHW SystemSystem
OptionOption
Attic R19 - R25Attic R19 - R25 ZonalZonal StandardStandard NoNo 1.751.75 EF 0.90EF 0.90
Attic R25 - R30 Attic R25 - R30 Electric FAF w/o ACElectric FAF w/o AC PTCSPTCS YesYes 1.11.1 EF 0.92EF 0.92
Attic R30 - R38Attic R30 - R38 Electric FAF w/ Central ACElectric FAF w/ Central AC InteriorInterior 0.80.8 EF 0.94EF 0.94
Attic R38 - R49Attic R38 - R49 Heat Pump HSPF 7.7/SEER 13Heat Pump HSPF 7.7/SEER 13 NoneNone 0.60.6 EF 2.2EF 2.2
Floor R22 - R33Floor R22 - R33 Heat Pump HSPF 8.5/SEER 14Heat Pump HSPF 8.5/SEER 14
Floor R33 - R44Floor R33 - R44 Heat Pump HSPF 9.0/SEER 14Heat Pump HSPF 9.0/SEER 14
Wall R21 AdvWall R21 Adv
Window Class 30 - Window Class 30 - Class 25Class 25
slide 17
Northwest Power and ConservationCouncil
Analytical ProcessAnalytical Process
Tested nearly 8000 unique packages for site Tested nearly 8000 unique packages for site built and 6,000 unique packages for built and 6,000 unique packages for manufactured homes against 1500 “futures”manufactured homes against 1500 “futures”
Best performing packages (i.e., lowest Best performing packages (i.e., lowest average life cycle cost packages with the average life cycle cost packages with the lowest average annual use) were selectedlowest average annual use) were selected
These were then compared to each zones These were then compared to each zones package with “all cost-effective” measures package with “all cost-effective” measures

slide 18
Northwest Power and ConservationCouncil
Heating Zone 1 - Site Built Homes Heating Zone 1 - Site Built Homes Energy Use vs Life Cycle CostEnergy Use vs Life Cycle Cost
$307,000
$308,000
$309,000
$310,000
$311,000
$312,000
$313,000
$314,000
$315,000
0 5,000 10,000 15,000 20,000
Mean Energy Use (kWh/yr)
Mean
LC
C o
ver
15
00
Fu
ture
s (2
00
6$
)
Current Code
All Cost-Effective Package
Lowest LCC Packages

slide 19
Northwest Power and ConservationCouncil
Heating Zone 2 - Site Built Homes Heating Zone 2 - Site Built Homes Energy Use vs Life Cycle CostEnergy Use vs Life Cycle Cost
$314,000
$316,000
$318,000
$320,000
$322,000
$324,000
$326,000
$328,000
0 5,000 10,000 15,000 20,000 25,000
Mean Energy Use (kWh/yr)
Mean
LC
C o
ver
15
00
Fu
ture
s (2
00
6$
)
Current Code
All Cost-Effective Package
Lowest LCC Packages

slide 20
Northwest Power and ConservationCouncil
Heating Zone 3 - Site Built Homes Heating Zone 3 - Site Built Homes Energy Use vs Life Cycle CostEnergy Use vs Life Cycle Cost
$240,000
$242,000
$244,000
$246,000
$248,000
$250,000
$252,000
$254,000
$256,000
$258,000
0 5,000 10,000 15,000 20,000 25,000 30,000
Mean Energy Use (kWh/yr)
Mean
LC
C o
ver
15
00
Fu
ture
s (2
00
6$
)
Current Code
All Cost-Effective Package
Lowest LCC Packages
slide 21
Northwest Power and ConservationCouncil
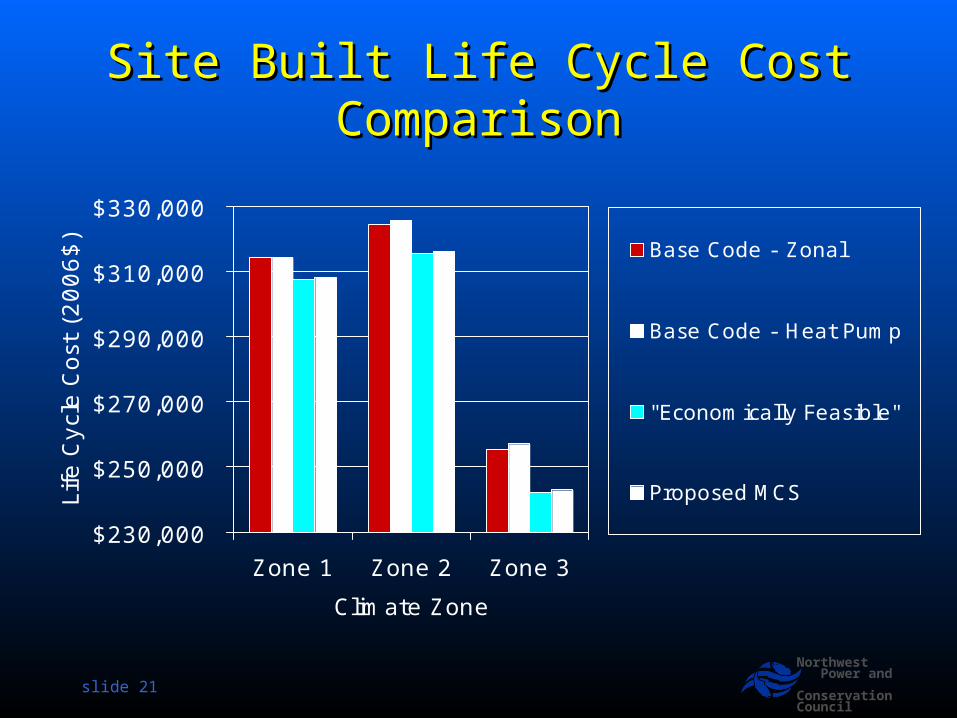
Site Built Life Cycle Cost Site Built Life Cycle Cost ComparisonComparison
$230,000
$250,000
$270,000
$290,000
$310,000
$330,000
Zone 1 Zone 2 Zone 3
Climate Zone
Life
Cycl
e C
ost
(2
00
6$
)
Base Code - Zonal
Base Code - Heat Pump
"Economically Feasible"
Proposed MCS

slide 22
Northwest Power and ConservationCouncil
Single Family – Zone 1Single Family – Zone 1Energy UseEnergy Use
0
2,000
4,000
6,000
8,000
10,000
12,000
14,000
16,000
18,000
20,000
Base-Zonal Base-HP Lowest LCC All Cost-Effective
Tota
l A
nnual U
se (
kWh/y
r)
Lighting
Water Heating
Space Conditioning

slide 23
Northwest Power and ConservationCouncil
Single Family – Zone 2Single Family – Zone 2Energy UseEnergy Use
0
5,000
10,000
15,000
20,000
25,000
Base-Zonal Base-HP* Lowest LCC All Cost-Effective
Tota
l A
nnual U
se (
kWh/y
r) Lighting
Water Heating
Space Conditioning
*Zone 2 HP higher than zonal due to addition of air conditioning

slide 24
Northwest Power and ConservationCouncil
Single Family – Zone 3Single Family – Zone 3Energy UseEnergy Use
0
5,000
10,000
15,000
20,000
25,000
30,000
Base-Zonal Base-HP Lowest LCC All Cost-Effective
Tota
l A
nnual U
se (
kWh/y
r)
Lighting
Water Heating
Space Conditioning
slide 25
Northwest Power and ConservationCouncil
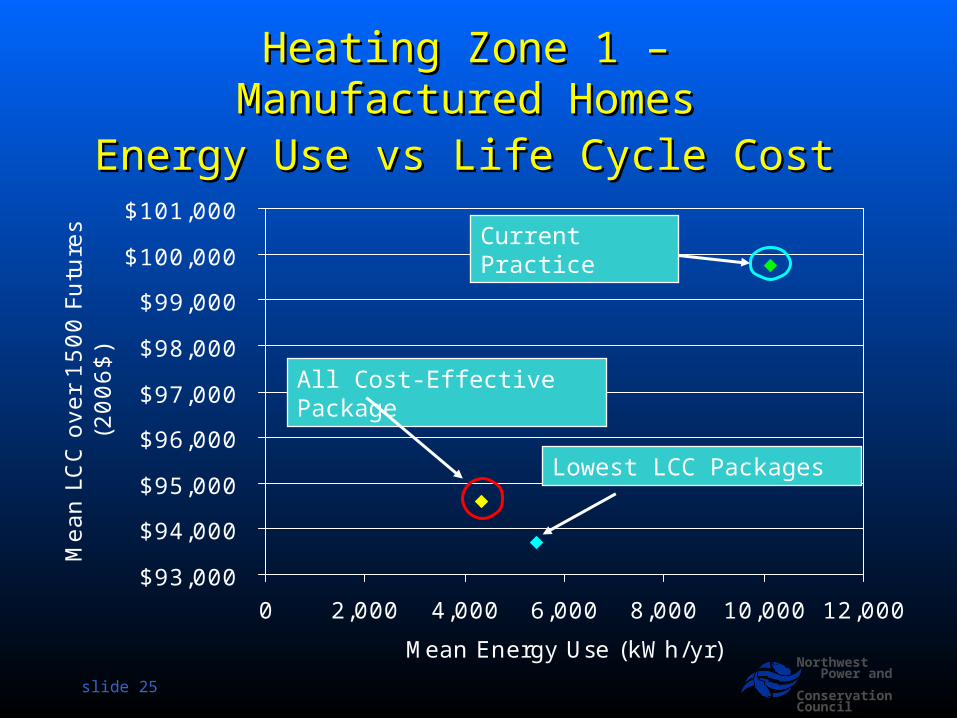
Heating Zone 1 – Heating Zone 1 – Manufactured Homes Manufactured Homes
Energy Use vs Life Cycle CostEnergy Use vs Life Cycle Cost
$93,000
$94,000
$95,000
$96,000
$97,000
$98,000
$99,000
$100,000
$101,000
0 2,000 4,000 6,000 8,000 10,000 12,000
Mean Energy Use (kWh/yr)
Mean
LC
C o
ver
15
00
Fu
ture
s (2
00
6$
)
Current Practice
All Cost-Effective Package
Lowest LCC Packages
slide 26
Northwest Power and ConservationCouncil
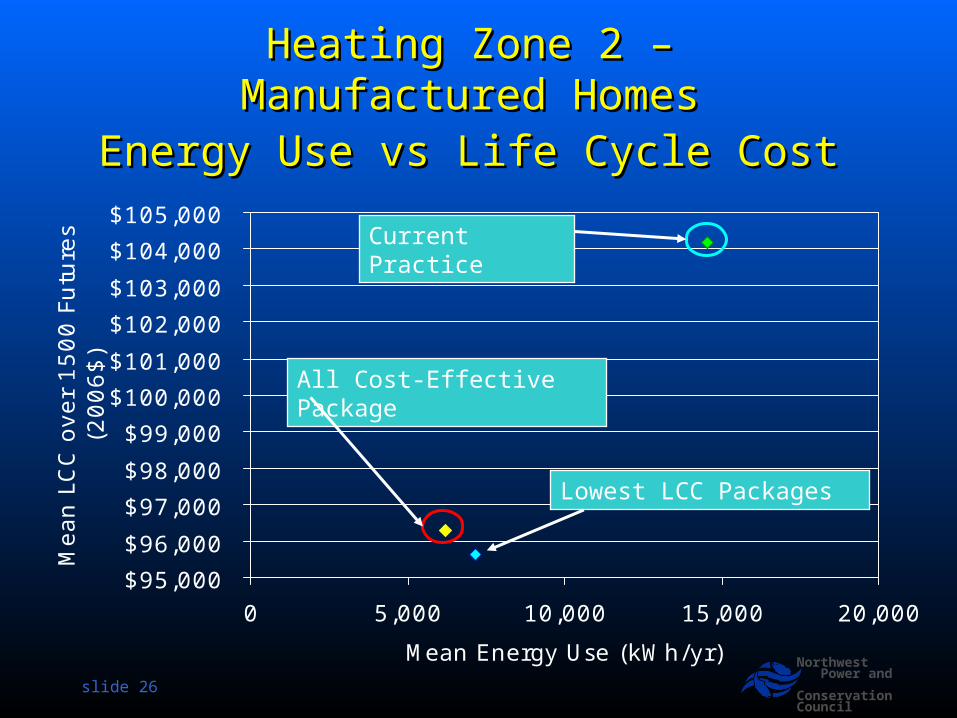
Heating Zone 2 – Heating Zone 2 – Manufactured Homes Manufactured Homes
Energy Use vs Life Cycle CostEnergy Use vs Life Cycle Cost
$95,000
$96,000
$97,000
$98,000
$99,000
$100,000
$101,000
$102,000
$103,000
$104,000
$105,000
0 5,000 10,000 15,000 20,000
Mean Energy Use (kWh/yr)
Mean
LC
C o
ver
15
00
Fu
ture
s (2
00
6$
)
Current Practice
All Cost-Effective Package
Lowest LCC Packages

slide 27
Northwest Power and ConservationCouncil
Heating Zone 3 – Heating Zone 3 – Manufactured Homes Manufactured Homes
Energy Use vs Life Cycle CostEnergy Use vs Life Cycle Cost
$90,000
$92,000
$94,000
$96,000
$98,000
$100,000
$102,000
$104,000
0 5,000 10,000 15,000 20,000
Mean Energy Use (kWh/yr)
Mean
LC
C o
ver
15
00
Fu
ture
s (2
00
6$
)
Current Practice
All Cost-Effective Package
Lowest LCC Packages

slide 28
Northwest Power and ConservationCouncil
Manufactured Home Life Cycle Manufactured Home Life Cycle Cost ComparisonCost Comparison
$80,000
$85,000
$90,000
$95,000
$100,000
$105,000
Zone 1 Zone 2 Zone 3
Climate Zone
Life
Cycl
e C
ost
(2006$)
Base/Current HUD Code
"Economically Feasible"
Proposed MCS

slide 29
Northwest Power and ConservationCouncil
Manufactured Home – Zone 1Manufactured Home – Zone 1Energy UseEnergy Use
0
2,000
4,000
6,000
8,000
10,000
12,000
Base Lowest LCC All Cost-Effective
Tota
l A
nnual U
se (
kWh/y
r) Lighting
Water Heating
Space Conditioning

slide 30
Northwest Power and ConservationCouncil
Manufactured Home – Zone 2Manufactured Home – Zone 2Energy UseEnergy Use
0
2,000
4,000
6,000
8,000
10,000
12,000
14,000
16,000
Base Code Lowest LCC All Cost-Effective
Tota
l A
nnual U
se (
kWh/y
r) Lighting
Water Heating
Space Conditioning

slide 31
Northwest Power and ConservationCouncil
Manufactured Home – Zone 3Manufactured Home – Zone 3Energy UseEnergy Use
0
2,000
4,000
6,000
8,000
10,000
12,000
14,000
16,000
18,000
20,000
Base Lowest LCC All Cost-Effective
Tota
l A
nnual U
se (
kWh/y
r) Lighting
Water Heating
Space Conditioning

slide 32
Northwest Power and ConservationCouncil
First Cost Impacts of Alternative First Cost Impacts of Alternative Packages: Single FamilyPackages: Single Family
$0
$2,000
$4,000
$6,000
$8,000
$10,000
$12,000
$14,000
Zone 1 Zone 2 Zone 3
Heating Climate Zone
Fir
st C
ost
(20
06$)
Base Code - Zonal
Base Code - Heat Pump
Min LCC
Min LCC
All Cost-Effective

slide 33
Northwest Power and ConservationCouncil
First Cost Impacts of Alternative First Cost Impacts of Alternative Packages: Manufactured HomePackages: Manufactured Home
$0
$2,000
$4,000
$6,000
$8,000
$10,000
$12,000
Zone 1 Zone 2 Zone 3Heating Climate Zone
Fir
st C
ost
(20
06$)
BaseLowest LCCAll Cost-Effective

Zone 1: Life Cycle Cost Minimum & Regional Zone 1: Life Cycle Cost Minimum & Regional Cost-Effective Thermal Shell PackagesCost-Effective Thermal Shell Packages
ComponentComponent Regionally Cost-Regionally Cost-EffectiveEffective
Minimum Life Minimum Life Cycle CostCycle Cost
Wall –Above GradeWall –Above Grade R21 Advanced FramingR21 Advanced Framing R21 Advanced FramingR21 Advanced Framing
Wall –Below GradeWall –Below Grade R19R19 R19R19
AtticAttic R38 STDR38 STD R38 STDR38 STD
VaultVault R30R30 R30R30
FloorFloor R30R30 R30R30
WindowWindow Class 25Class 25 Class 25Class 25
DoorDoor R5R5 R5R5
SlabSlab R10 Full Under SlabR10 Full Under Slab R10 Full Under SlabR10 Full Under Slab
Wall – Ext. Below grade Wall – Ext. Below grade R10R10 R10R10
Infiltration Infiltration Air Sealing w/HRVAir Sealing w/HRV Current PracticeCurrent Practice

Zone 2: Life Cycle Cost Minimum & Regional Zone 2: Life Cycle Cost Minimum & Regional Cost-Effective Thermal Shell PackagesCost-Effective Thermal Shell Packages
ComponentComponent Regionally Cost-Regionally Cost-EffectiveEffective
Minimum Life Minimum Life Cycle CostCycle Cost
Wall –Above GradeWall –Above Grade R21 Advanced FramingR21 Advanced Framing R21 Advanced FramingR21 Advanced Framing
Wall –Below GradeWall –Below Grade R19R19 R19R19
AtticAttic R49 AdvancedR49 Advanced R38 STDR38 STD
VaultVault R30R30 R30R30
FloorFloor R30R30 R30R30
WindowWindow Class 25Class 25 Class 25Class 25
DoorDoor R5R5 R5R5
SlabSlab R10 Full Under SlabR10 Full Under Slab R10 Full Under SlabR10 Full Under Slab
Wall – Ext. Below grade Wall – Ext. Below grade R10R10 R10R10
Infiltration Infiltration Air Sealing w/HRVAir Sealing w/HRV Current PracticeCurrent Practice

Zone 3: Life Cycle Cost Minimum & Regional Zone 3: Life Cycle Cost Minimum & Regional Cost-Effective Thermal Shell PackagesCost-Effective Thermal Shell Packages
ComponentComponent Regionally Cost-Regionally Cost-EffectiveEffective
Minimum Life Minimum Life Cycle CostCycle Cost
Wall –Above GradeWall –Above Grade R21 Advanced FramingR21 Advanced Framing R21 Advanced FramingR21 Advanced Framing
Wall –Below GradeWall –Below Grade R19R19 R19R19
AtticAttic R49 AdvancedR49 Advanced R38 STDR38 STD
VaultVault R30R30 R30R30
FloorFloor R30R30 R30R30
WindowWindow Class 25Class 25 Class 25Class 25
DoorDoor R5R5 R5R5
SlabSlab R10 Full Under SlabR10 Full Under Slab R10 Full Under SlabR10 Full Under Slab
Wall – Ext. Below grade Wall – Ext. Below grade R10R10 R10R10
Infiltration Infiltration Air Sealing w/HRVAir Sealing w/HRV Current PracticeCurrent Practice
slide 37
Northwest Power and ConservationCouncil
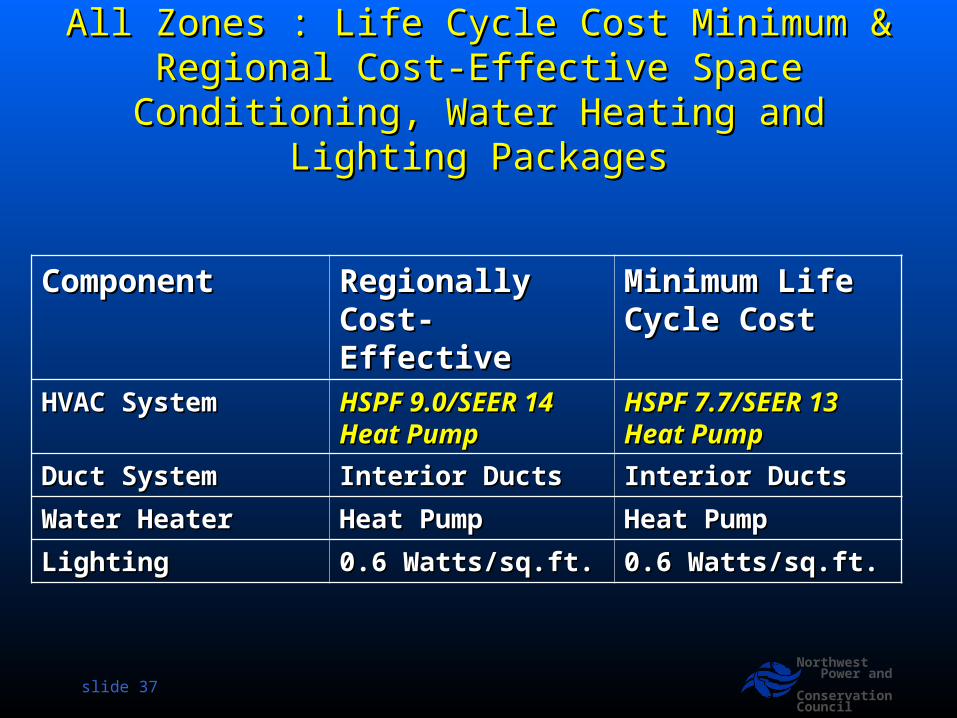
All Zones : Life Cycle Cost Minimum & All Zones : Life Cycle Cost Minimum & Regional Cost-Effective Space Conditioning, Regional Cost-Effective Space Conditioning,
Water Heating and Lighting PackagesWater Heating and Lighting Packages
ComponentComponent Regionally Cost-Regionally Cost-EffectiveEffective
Minimum Life Minimum Life Cycle CostCycle Cost
HVAC SystemHVAC System HSPF 9.0/SEER 14 HSPF 9.0/SEER 14 Heat PumpHeat Pump
HSPF 7.7/SEER 13 HSPF 7.7/SEER 13 Heat PumpHeat Pump
Duct SystemDuct System Interior DuctsInterior Ducts Interior DuctsInterior Ducts
Water HeaterWater Heater Heat PumpHeat Pump Heat PumpHeat Pump
LightingLighting 0.6 Watts/sq.ft.0.6 Watts/sq.ft. 0.6 Watts/sq.ft.0.6 Watts/sq.ft.

slide 38
Northwest Power and ConservationCouncil
Background SlidesBackground Slides

slide 39
Northwest Power and ConservationCouncil
Zone 1: Life Cycle Cost MinimumZone 1: Life Cycle Cost MinimumHVAC, Lighting & DHWHVAC, Lighting & DHW
HSPF 7.7 /SEER 13 Heat Pump w/ Interior Ducts HSPF 7.7 /SEER 13 Heat Pump w/ Interior Ducts & PTCS System Commissioning & Controls& PTCS System Commissioning & Controls
Lighting Power Density = 0.6 Watts/sq.ft.Lighting Power Density = 0.6 Watts/sq.ft. Heat Pump Water HeaterHeat Pump Water Heater Average Use = 7,600 kWh/yrAverage Use = 7,600 kWh/yr LCC = $307,500LCC = $307,500 LCC Savings = $6,748 ($6870 over HP Base)LCC Savings = $6,748 ($6870 over HP Base) First Cost Increase = $8,602 ($3,655 over HP First Cost Increase = $8,602 ($3,655 over HP
Base)Base) Energy Savings = 8,310 kWh/yr (4,120 kWh/yr Energy Savings = 8,310 kWh/yr (4,120 kWh/yr
over HP Base)over HP Base)

slide 40
Northwest Power and ConservationCouncil
Zone 2: Life Cycle Cost MinimumZone 2: Life Cycle Cost MinimumHVAC, Lighting & DHWHVAC, Lighting & DHW
HSPF 7.7 /SEER 13 Heat Pump w/ Interior Ducts HSPF 7.7 /SEER 13 Heat Pump w/ Interior Ducts & PTCS System Commissioning & Controls& PTCS System Commissioning & Controls
Lighting Power Density = 0.6 Watts/sq.ft.Lighting Power Density = 0.6 Watts/sq.ft. Heat Pump Water HeaterHeat Pump Water Heater Average Use = 10,460 kWh/yrAverage Use = 10,460 kWh/yr LCC = $315,460LCC = $315,460 LCC Savings = $9,150 ($10,380 over HP Base)LCC Savings = $9,150 ($10,380 over HP Base) First Cost Increase = $8,600 ($3,655 over HP First Cost Increase = $8,600 ($3,655 over HP
Base)Base) Energy Savings = 9,090 kWh/yr (10,040 over HP Energy Savings = 9,090 kWh/yr (10,040 over HP
Base)Base)

slide 41
Northwest Power and ConservationCouncil
Zone 3: Life Cycle Cost MinimumZone 3: Life Cycle Cost MinimumHVAC, Lighting & DHWHVAC, Lighting & DHW
HSPF 7.7 /SEER 13 Heat Pump w/ Interior Ducts HSPF 7.7 /SEER 13 Heat Pump w/ Interior Ducts & PTCS System Commissioning & Controls& PTCS System Commissioning & Controls
Lighting Power Density = 0.6 Watts/sq.ft.Lighting Power Density = 0.6 Watts/sq.ft. Heat Pump Water HeaterHeat Pump Water Heater Average Use = 12,455 kWh/yrAverage Use = 12,455 kWh/yr LCC = $242,300LCC = $242,300 LCC Savings = $13,070 ($14,640 over HP Base)LCC Savings = $13,070 ($14,640 over HP Base) First Cost Increase = $8,600 ($3655 over HP First Cost Increase = $8,600 ($3655 over HP
Base)Base) Energy Savings = 12,300 kWh/yr (12,425 kWh/yr Energy Savings = 12,300 kWh/yr (12,425 kWh/yr
over HP Base)over HP Base)

slide 42
Northwest Power and ConservationCouncil
Zone 1 – Manufactured Home Base CaseZone 1 – Manufactured Home Base CaseLowest Life Cycle Cost Code Compliant Lowest Life Cycle Cost Code Compliant
PackagePackage
ComponentComponent Base CaseBase Case
WallWall R19R19
AtticAttic R25R25
Vault - JoistedVault - Joisted R25R25
Vault - TrussedVault - Trussed R25R25
FloorFloor R30R30
WindowWindow Class 35Class 35
DoorDoor R5R5
HVAC System – Heat HVAC System – Heat Pump HSPF 7.7/SEER Pump HSPF 7.7/SEER 1313
DHW – EF90DHW – EF90 Average Use (kWh) = Average Use (kWh) =
10,13010,130 First Cost = $8,730First Cost = $8,730 Minimum LCC = Minimum LCC =
$99,750$99,750

slide 43
Northwest Power and ConservationCouncil
Zone 1: Life Cycle Cost Minimum & Regional Zone 1: Life Cycle Cost Minimum & Regional Cost-Effective Thermal Shell PackagesCost-Effective Thermal Shell Packages
ComponentComponent Regionally Cost-Regionally Cost-EffectiveEffective
Minimum Life Cycle Minimum Life Cycle CostCost
Wall –Above GradeWall –Above Grade R21 AdvancedR21 Advanced R21 AdvancedR21 Advanced
AtticAttic R38R38 R38R38
VaultVault R30R30 R30R30
FloorFloor R33R33 R33R33
WindowWindow Class 30Class 30 Class 30Class 30
DoorDoor R5R5 R5R5

slide 44
Northwest Power and ConservationCouncil
Zone 1: Manufactured Home Zone 1: Manufactured Home Life Cycle Cost MinimumLife Cycle Cost MinimumHVAC, Lighting & DHWHVAC, Lighting & DHW
HSPF 7.7 /SEER 13 Heat Pump w/ Interior Ducts HSPF 7.7 /SEER 13 Heat Pump w/ Interior Ducts & PTCS System Commissioning & Controls& PTCS System Commissioning & Controls
Lighting Power Density = 0.6 Watts/sq.ft.Lighting Power Density = 0.6 Watts/sq.ft. Heat Pump Water HeaterHeat Pump Water Heater Average Use = 5,430 kWh/yrAverage Use = 5,430 kWh/yr LCC = $93,705LCC = $93,705 LCC Savings = $6,045LCC Savings = $6,045 First Cost Increase = $2,175First Cost Increase = $2,175 Energy Savings = 4,700 kWh/yrEnergy Savings = 4,700 kWh/yr

slide 45
Northwest Power and ConservationCouncil
Zone 2 – Manufactured Home Base CaseZone 2 – Manufactured Home Base CaseLowest Life Cycle Cost Code Compliant Lowest Life Cycle Cost Code Compliant
PackagePackage
ComponentComponent Base CaseBase Case
WallWall R19R19
AtticAttic R25R25
Vault - JoistedVault - Joisted R25R25
Vault - TrussedVault - Trussed R25R25
FloorFloor R30R30
WindowWindow Class 35Class 35
DoorDoor R5R5
HVAC System – Heat HVAC System – Heat Pump HSPF 7.7/SEER Pump HSPF 7.7/SEER 1313
DHW – EF90DHW – EF90 Average Use (kWh) = Average Use (kWh) =
14,53014,530 First Cost = $8,730First Cost = $8,730 Minimum LCC = Minimum LCC =
$104,170$104,170

slide 46
Northwest Power and ConservationCouncil
Zone 2: Life Cycle Cost Minimum & Zone 2: Life Cycle Cost Minimum & Regional Cost-Effective Thermal Shell Regional Cost-Effective Thermal Shell
PackagesPackages
ComponentComponent Regionally Cost-Regionally Cost-EffectiveEffective
Minimum Life Cycle Minimum Life Cycle CostCost
Wall –Above GradeWall –Above Grade R21 AdvancedR21 Advanced R21 AdvancedR21 Advanced
AtticAttic R38R38 R38R38
VaultVault R30R30 R30R30
FloorFloor R33R33 R33R33
WindowWindow Class 30Class 30 Class 30Class 30
DoorDoor R5R5 R5R5

slide 47
Northwest Power and ConservationCouncil
Zone 2: Manufactured Home Zone 2: Manufactured Home Life Cycle Cost MinimumLife Cycle Cost MinimumHVAC, Lighting & DHWHVAC, Lighting & DHW
HSPF 7.7 /SEER 13 Heat Pump w/ Interior Ducts HSPF 7.7 /SEER 13 Heat Pump w/ Interior Ducts & PTCS System Commissioning & Controls& PTCS System Commissioning & Controls
Lighting Power Density = 0.6 Watts/sq.ft.Lighting Power Density = 0.6 Watts/sq.ft. Heat Pump Water HeaterHeat Pump Water Heater Average Use = 7,165 kWh/yrAverage Use = 7,165 kWh/yr LCC = $95,625LCC = $95,625 LCC Savings = $8,545LCC Savings = $8,545 First Cost Increase = $2,175First Cost Increase = $2,175 Energy Savings = 7,360 kWh/yrEnergy Savings = 7,360 kWh/yr
slide 48
Northwest Power and ConservationCouncil
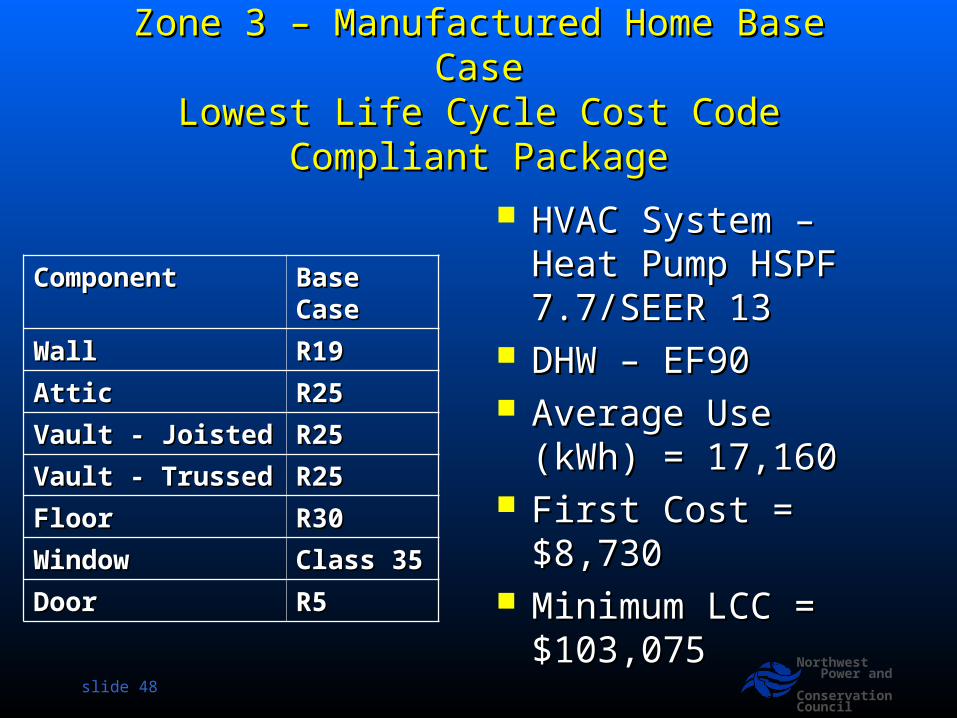
Zone 3 – Manufactured Home Base CaseZone 3 – Manufactured Home Base CaseLowest Life Cycle Cost Code Compliant Lowest Life Cycle Cost Code Compliant
PackagePackage
ComponentComponent Base CaseBase Case
WallWall R19R19
AtticAttic R25R25
Vault - JoistedVault - Joisted R25R25
Vault - TrussedVault - Trussed R25R25
FloorFloor R30R30
WindowWindow Class 35Class 35
DoorDoor R5R5
HVAC System – Heat HVAC System – Heat Pump HSPF 7.7/SEER Pump HSPF 7.7/SEER 1313
DHW – EF90DHW – EF90 Average Use (kWh) = Average Use (kWh) =
17,16017,160 First Cost = $8,730First Cost = $8,730 Minimum LCC = Minimum LCC =
$103,075$103,075

slide 49
Northwest Power and ConservationCouncil
Zone 3: Life Cycle Cost Minimum & Regional Zone 3: Life Cycle Cost Minimum & Regional Cost-Effective Thermal Shell PackagesCost-Effective Thermal Shell Packages
ComponentComponent Regionally Cost-Regionally Cost-EffectiveEffective
Minimum Life Minimum Life Cycle CostCycle Cost
Wall –Above GradeWall –Above Grade R21 AdvancedR21 Advanced R21 AdvancedR21 Advanced
AtticAttic R49R49 R49R49
VaultVault R30R30 R30R30
FloorFloor R44R44 R44R44
WindowWindow Class 30Class 30 Class 30Class 30
DoorDoor R5R5 R5R5
slide 50
Northwest Power and ConservationCouncil
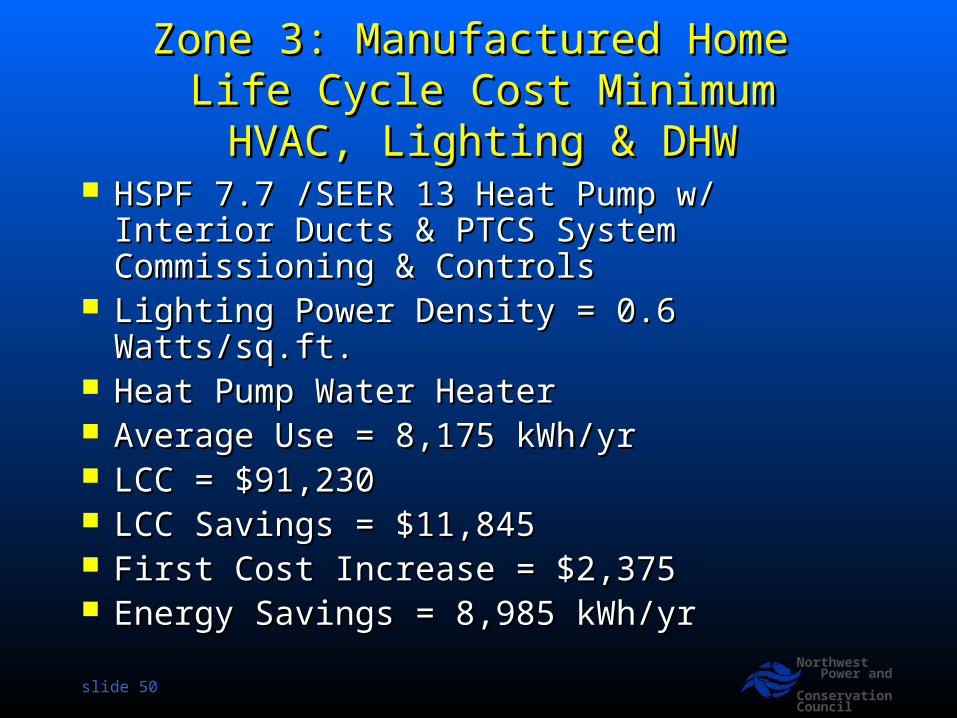
Zone 3: Manufactured Home Zone 3: Manufactured Home Life Cycle Cost MinimumLife Cycle Cost MinimumHVAC, Lighting & DHWHVAC, Lighting & DHW
HSPF 7.7 /SEER 13 Heat Pump w/ Interior Ducts HSPF 7.7 /SEER 13 Heat Pump w/ Interior Ducts & PTCS System Commissioning & Controls& PTCS System Commissioning & Controls
Lighting Power Density = 0.6 Watts/sq.ft.Lighting Power Density = 0.6 Watts/sq.ft. Heat Pump Water HeaterHeat Pump Water Heater Average Use = 8,175 kWh/yrAverage Use = 8,175 kWh/yr LCC = $91,230LCC = $91,230 LCC Savings = $11,845LCC Savings = $11,845 First Cost Increase = $2,375First Cost Increase = $2,375 Energy Savings = 8,985 kWh/yrEnergy Savings = 8,985 kWh/yr
slide 51
Northwest Power and ConservationCouncil
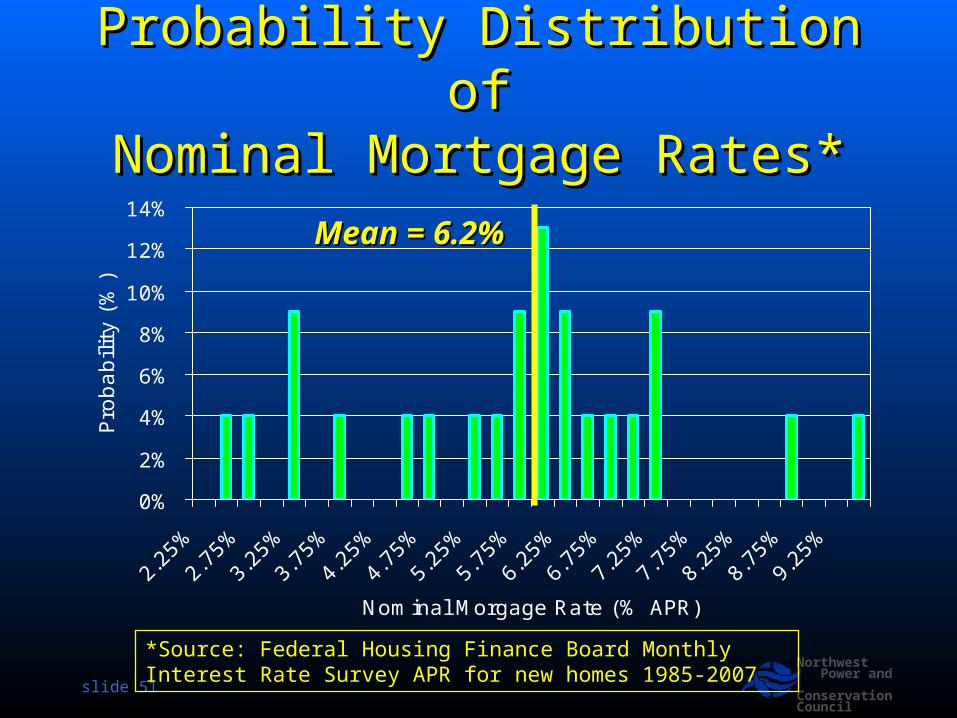
Probability Distribution ofProbability Distribution ofNominal Mortgage Rates*Nominal Mortgage Rates*
0%
2%
4%
6%
8%
10%
12%
14%
Nominal Morgage Rate (% APR)
Pro
babili
ty (
%)
*Source: Federal Housing Finance Board Monthly Interest Rate Survey APR for new homes 1985-2007
Mean = 6.2%Mean = 6.2%

slide 52
Northwest Power and ConservationCouncil
Probability Distribution of Probability Distribution of Downpayment Amount*Downpayment Amount*
0%
1%
1%
2%
2%
3%
3%
4%
0% 20% 40% 60% 80% 100%
Downpayment (%)
Pro
babili
ty (
%)
Mean = 27%Mean = 27%
*Source: Federal Housing Finance Board Monthly Interest Rate Survey for Oregon

slide 53
Northwest Power and ConservationCouncil
Probability Distribution of Electricity Probability Distribution of Electricity Price Escalation Rates – Zone 1Price Escalation Rates – Zone 1
0.0%0.5%1.0%1.5%2.0%2.5%3.0%3.5%4.0%4.5%5.0%
0.69
%
0.97
%
1.24
%
1.52
%
1.80
%
2.08
%
2.36
%
2.64
%
2.91
%
3.19
%
3.47
%
3.75
%
4.03
%
4.30
%
4.58
%
4.86
%
5.14
%
Nominal Annual Electricity Price Escalation Rate
Pro
babili
ty (
%)
Source: Northwest Power and ConservationCouncil Draft 6th Power Plan

slide 54
Northwest Power and ConservationCouncil
Probability Distribution of Electricity Probability Distribution of Electricity Price Escalation Rates – Zone 2Price Escalation Rates – Zone 2
0.0%0.5%1.0%1.5%2.0%2.5%3.0%3.5%4.0%4.5%5.0%
0.87
%
1.13
%
1.40
%
1.66
%
1.93
%
2.19
%
2.46
%
2.72
%
2.99
%
3.25
%
3.52
%
3.78
%
4.05
%
4.31
%
4.58
%
4.84
%
5.11
%
Nominal Annual Electricity Price Escalation Rate
Pro
babili
ty (
%)
Source: Northwest Power and ConservationCouncil Draft 6th Power Plan

slide 55
Northwest Power and ConservationCouncil
Probability Distribution of Electricity Probability Distribution of Electricity Price Escalation Rates – Zone 3Price Escalation Rates – Zone 3
0.0%0.5%1.0%1.5%2.0%2.5%3.0%3.5%4.0%4.5%5.0%
0.46
%
0.72
%
0.98
%
1.24
%
1.50
%
1.76
%
2.02
%
2.28
%
2.54
%
2.79
%
3.05
%
3.31
%
3.57
%
3.83
%
4.09
%
4.35
%
4.61
%
Nominal Annual Electricity Price Escalation Rate
Pro
babili
ty (
%)
Source: Northwest Power and ConservationCouncil Draft 6th Power Plan

slide 56
Northwest Power and ConservationCouncil
Probability Distribution of Base Year Probability Distribution of Base Year Electricity Prices – Zone 1Electricity Prices – Zone 1
0%
5%
10%
15%
20%
25%
30%
$0.0
22
$0.0
35
$0.0
41
$0.0
42
$0.0
44
$0.0
47
$0.0
48
$0.0
49
$0.0
51
$0.0
52
$0.0
53
$0.0
54
$0.0
55
$0.0
56
$0.0
58
$0.0
63
$0.0
73
Retail Rate (2006$/ kWh)
Share
of
Hom
ebuye
rs (
%)
Source: Energy Information Administration residential retail revenue and customer count data for 2007. Shares based on share of new residential customers added between 2000 and 2007.

slide 57
Northwest Power and ConservationCouncil
Probability Distribution of Base Year Probability Distribution of Base Year Electricity Prices Zone 2Electricity Prices Zone 2
0%5%
10%15%20%25%30%35%40%45%50%
$0.0
29
$0.0
31
$0.0
42
$0.0
45
$0.0
48
$0.0
49
$0.0
50
$0.0
52
$0.0
53
$0.0
56
$0.0
56
$0.0
57
$0.0
59
$0.0
64
$0.0
68
$0.0
77
Retail Rate (2006$/ kWh)
Share
of
Hom
ebuye
rs (
%)
Source: Energy Information Administration residential retail revenue and customer count data for 2007. Shares based on share of new residential customers added between 2000 and 2007.
slide 58
Northwest Power and ConservationCouncil
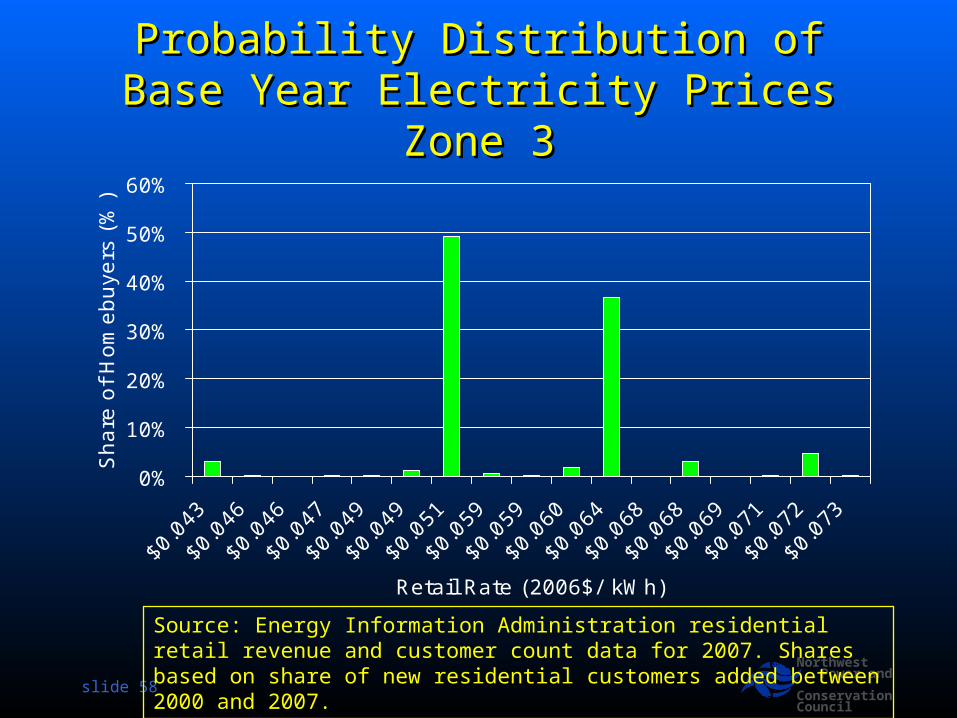
Probability Distribution of Base Year Probability Distribution of Base Year Electricity Prices Zone 3Electricity Prices Zone 3
0%
10%
20%
30%
40%
50%
60%
$0.0
43
$0.0
46
$0.0
46
$0.0
47
$0.0
49
$0.0
49
$0.0
51
$0.0
59
$0.0
59
$0.0
60
$0.0
64
$0.0
68
$0.0
68
$0.0
69
$0.0
71
$0.0
72
$0.0
73
Retail Rate (2006$/ kWh)
Share
of
Hom
ebuye
rs (
%)
Source: Energy Information Administration residential retail revenue and customer count data for 2007. Shares based on share of new residential customers added between 2000 and 2007.
slide 59
Northwest Power and ConservationCouncil
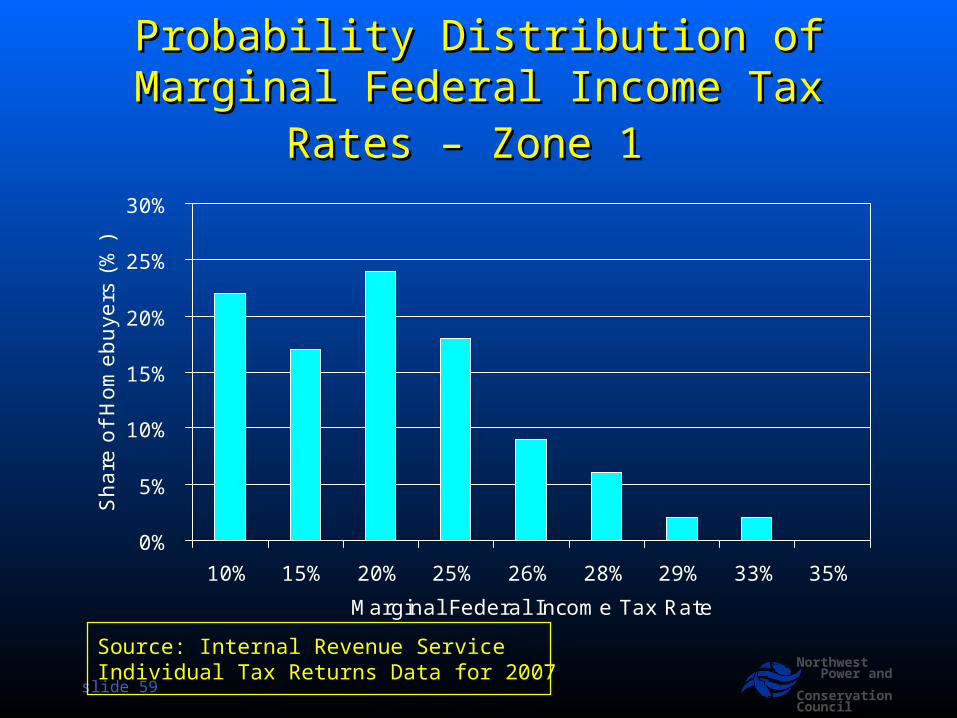
Probability Distribution of Marginal Probability Distribution of Marginal Federal Income Tax Rates – Zone 1Federal Income Tax Rates – Zone 1
0%
5%
10%
15%
20%
25%
30%
10% 15% 20% 25% 26% 28% 29% 33% 35%
Marginal Federal Income Tax Rate
Share
of
Hom
ebuye
rs (
%)
Source: Internal Revenue ServiceIndividual Tax Returns Data for 2007

slide 60
Northwest Power and ConservationCouncil
Probability Distribution of Marginal Probability Distribution of Marginal Federal Income Tax Rates – Zone 2Federal Income Tax Rates – Zone 2
0%
5%
10%
15%
20%
25%
30%
10% 15% 20% 25% 26% 28% 29% 33% 35%
Marginal Federal Income Tax Rate
Share
of
Hom
ebuye
rs (
%)
Source: Internal Revenue ServiceIndividual Tax Returns Data for 2007
slide 61
Northwest Power and ConservationCouncil
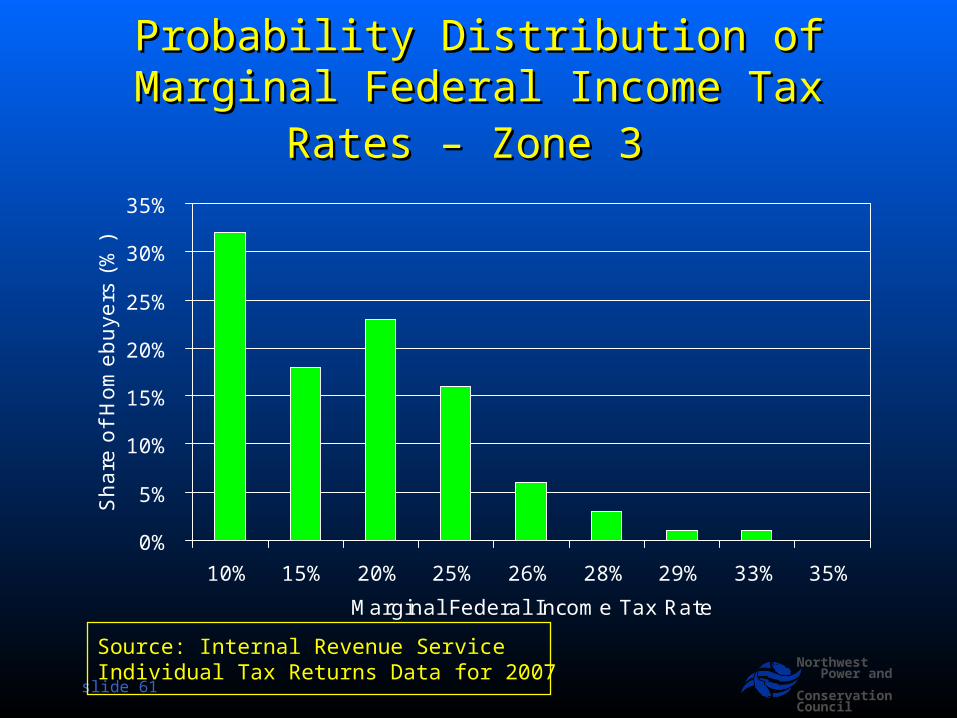
Probability Distribution of Marginal Probability Distribution of Marginal Federal Income Tax Rates – Zone 3Federal Income Tax Rates – Zone 3
0%
5%
10%
15%
20%
25%
30%
35%
10% 15% 20% 25% 26% 28% 29% 33% 35%
Marginal Federal Income Tax Rate
Share
of
Hom
ebuye
rs (
%)
Source: Internal Revenue ServiceIndividual Tax Returns Data for 2007

slide 62
Northwest Power and ConservationCouncil
Probability Distribution of Marginal Probability Distribution of Marginal State Income Tax Rates - IdahoState Income Tax Rates - Idaho
0%
10%
20%
30%
40%
50%
60%
70%
5.1% 7.1% 7.8%
Marginal State Income Tax Rate
Share
of
Hom
ebuye
rs (
%)
Source: Based on Internal Revenue Service for Idaho Individual Tax Returns Data for 2007

slide 63
Northwest Power and ConservationCouncil
Probability Distribution of Marginal Probability Distribution of Marginal State Income Tax Rates - MontanaState Income Tax Rates - Montana
0%
5%
10%
15%
20%
25%
30%
3.0% 5.0% 6.0% 8.0% 9.0% 10.0% 11.0%
Marginal State Income Tax Rate
Share
of
Hom
ebuye
rs (
%)
Source: Based on Internal Revenue Service for Montana Individual Tax Returns Data for 2007
slide 64
Northwest Power and ConservationCouncil
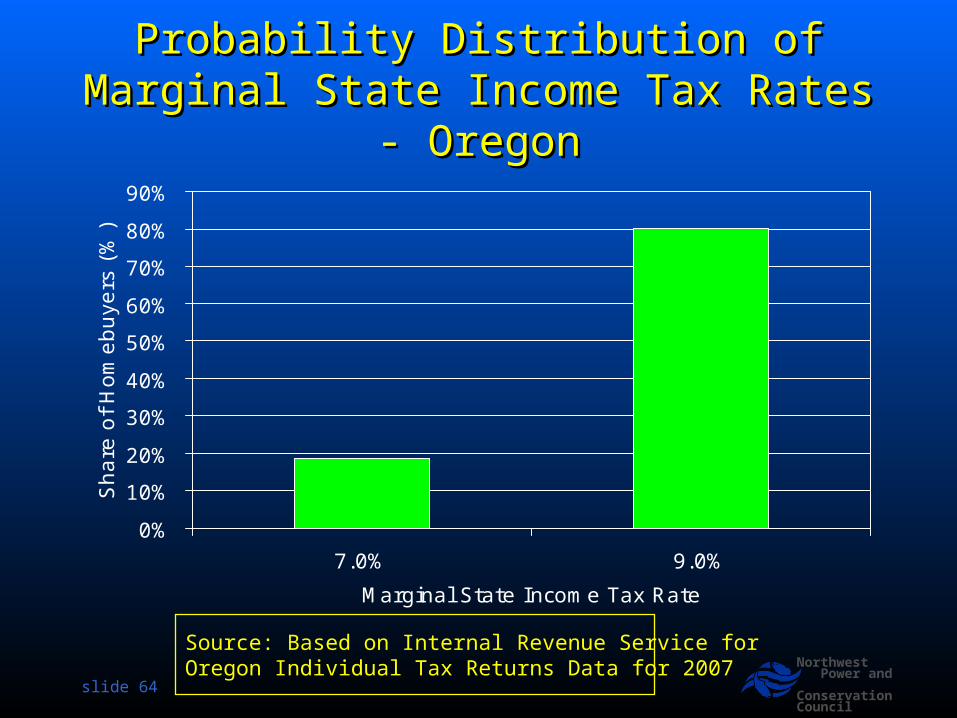
Probability Distribution of Marginal Probability Distribution of Marginal State Income Tax Rates - OregonState Income Tax Rates - Oregon
0%
10%
20%
30%
40%
50%
60%
70%
80%
90%
7.0% 9.0%
Marginal State Income Tax Rate
Share
of
Hom
ebuye
rs (
%)
Source: Based on Internal Revenue Service for Oregon Individual Tax Returns Data for 2007

slide 65
Northwest Power and ConservationCouncil
Probability Distribution ofProbability Distribution ofProperty Tax RatesProperty Tax Rates
0%
10%
20%
30%
40%
50%
60%
70%
80%
90%
100%
Zone 1 Zone 2 Zone 3
Sh
are
of
Ho
me
bu
ye
rs
0.00%
0.10%
0.20%
0.30%
0.40%
0.50%
0.60%
0.70%
0.80%
0.90%
1.00%
Pro
pe
rty
Ta
x R
ateShare
Rate
Source: Idaho, Montana, Oregon and Washington Departments of Revenue Property Tax Statistics Fiscal Year 2008-2009

slide 66
Northwest Power and ConservationCouncil
Private Mortgage Insurance Private Mortgage Insurance AssumptionsAssumptions
0.0%
0.2%
0.4%
0.6%
0.8%
1.0%
1.2%
1.4%
1.6%
0% 5% 10% 15% 20%
Downpayment Amount
PM
I (S
hare
of
Loan
Am
ou
nt)
http://www.westga.edu/~bquest/1997/costof.html

slide 67
Northwest Power and ConservationCouncil
Probability Distribution of Incremental Probability Distribution of Incremental Cost for HSPF 7.7/SEER 13 Heat PumpCost for HSPF 7.7/SEER 13 Heat Pump
0.0%
0.5%
1.0%
1.5%
2.0%
2.5%
3.0%
3.5%
4.0%
4.5%
$3,015 $3,387 $3,759 $4,131 $4,502
Cost to Consumer (2006$)
Pro
babili
ty
Mean = $3884Mean = $3884
Source: Regional Technical Forum

slide 68
Northwest Power and ConservationCouncil
Probability Distribution of HSPF 8.5/ SEER Probability Distribution of HSPF 8.5/ SEER 14 Air Source Heat Pump Cost14 Air Source Heat Pump Cost
0.0%
0.5%
1.0%
1.5%
2.0%
2.5%
3.0%
3.5%
4.0%
4.5%
5.0%
$5,208 $5,726 $6,244 $6,762 $7,280
Cost to Consumer (2006$)
Pro
bab
ility
Mean = $5290Mean = $5290
Source: Regional Technical Forum

slide 69
Northwest Power and ConservationCouncil
Probability Distribution of HSPF 9.0/ SEER Probability Distribution of HSPF 9.0/ SEER 14 Air Source Heat Pump Cost14 Air Source Heat Pump Cost
0.0%
0.5%
1.0%
1.5%
2.0%
2.5%
3.0%
3.5%
4.0%
4.5%
5.0%
$5,464 $6,085 $6,707 $7,328 $7,949
Cost to Consumer (2006$)
Pro
bab
ility
Mean = $5580Mean = $5580
Source: Regional Technical Forum

slide 70
Northwest Power and ConservationCouncil
Probability Distribution ofProbability Distribution ofDuct Sealing CostDuct Sealing Cost
0.0%
0.5%
1.0%
1.5%
2.0%
2.5%
$226 $246 $266 $286 $306 $326 $346 $366 $386 $406
Cost to Consumer
Pro
babili
ty
Mean = $325Mean = $325
Source: Regional Technical Forum
slide 71
Northwest Power and ConservationCouncil
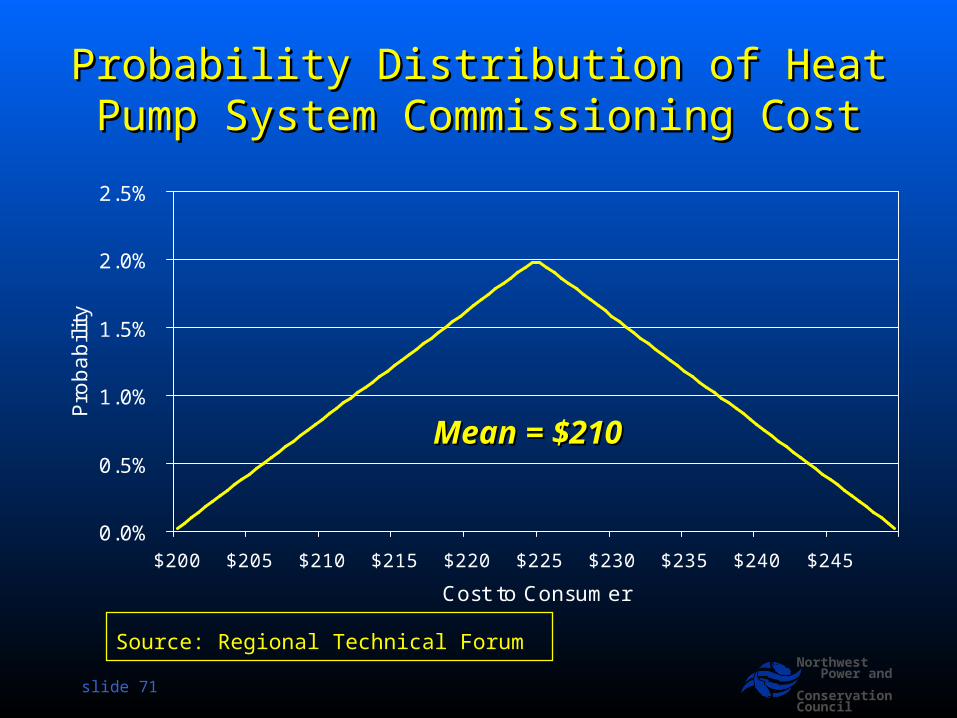
Probability Distribution of Heat Pump Probability Distribution of Heat Pump System Commissioning CostSystem Commissioning Cost
0.0%
0.5%
1.0%
1.5%
2.0%
2.5%
$200 $205 $210 $215 $220 $225 $230 $235 $240 $245
Cost to Consumer
Pro
babili
ty
Mean = $210Mean = $210
Source: Regional Technical Forum

Heat Pump Water Heater Heat Pump Water Heater Installed CostInstalled Cost
0
10
20
30
40
50
60
$1,223 $1,401 $1,579 $1,758 $1,936
Installed Cost EF 2.2 Water Heater
Frequency
Mean = $1506Mean = $1506
Source: US Department of Energy, Technical Support DocumentOn Direct Heating Equipment and Water Heating
slide 73
Northwest Power and ConservationCouncil
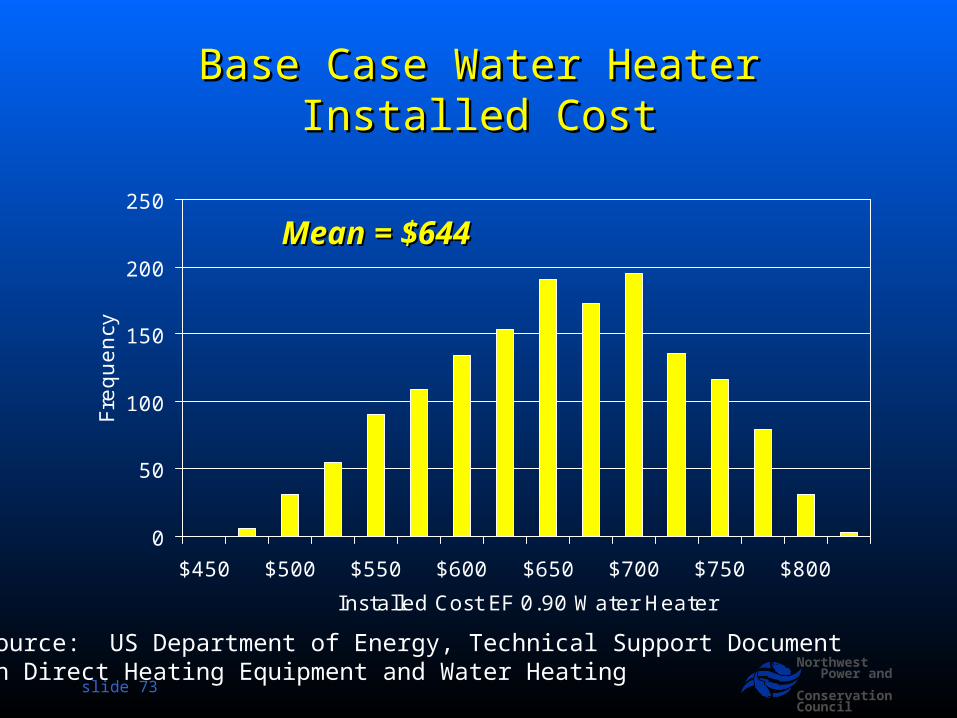
Base Case Water HeaterBase Case Water HeaterInstalled CostInstalled Cost
0
50
100
150
200
250
$450 $500 $550 $600 $650 $700 $750 $800
Installed Cost EF 0.90 Water Heater
Frequency
Mean = $644Mean = $644
Source: US Department of Energy, Technical Support DocumentOn Direct Heating Equipment and Water Heating

slide 74
Northwest Power and ConservationCouncil
Zone 1 - Base CaseZone 1 - Base CaseLowest Life Cycle Cost Code Lowest Life Cycle Cost Code
Compliant PackageCompliant Package
ComponentComponent Base CaseBase Case
Wall –Above GradeWall –Above Grade R21 STDR21 STD
Wall –Below GradeWall –Below Grade R19R19
AtticAttic R38 STDR38 STD
Vault - JoistedVault - Joisted R30R30
Vault - TrussedVault - Trussed R38R38
FloorFloor R30R30
WindowWindow Class 35Class 35
DoorDoor R5R5
SlabSlab R10R10
Wall – Ext. Below Wall – Ext. Below grade grade
R10R10
HVAC System – ZonalHVAC System – Zonal DHW – EF90DHW – EF90 Average Use (kWh) = Average Use (kWh) =
17,575 17,575 First Cost = $2,333First Cost = $2,333 Minimum LCC = Minimum LCC =
$314,247$314,247

slide 75
Northwest Power and ConservationCouncil
Zone 2 - Base CaseZone 2 - Base CaseLowest Life Cycle Cost Code Lowest Life Cycle Cost Code
Compliant PackageCompliant PackageComponentComponent Base CaseBase Case
Wall –Above GradeWall –Above Grade R21 STDR21 STD
Wall –Below GradeWall –Below Grade R19R19
AtticAttic R38 STDR38 STD
Vault - JoistedVault - Joisted R30R30
Vault - TrussedVault - Trussed R38R38
FloorFloor R30R30
WindowWindow Class 35Class 35
DoorDoor R5R5
SlabSlab R10R10
Wall – Ext. Below Wall – Ext. Below grade grade
R10R10
HVAC System – ZonalHVAC System – Zonal DHW – EF90DHW – EF90 Average Use (kWh) – Average Use (kWh) –
19,55019,550 First Cost = $2,300First Cost = $2,300 Minimum LCC = Minimum LCC =
$324,610$324,610

slide 76
Northwest Power and ConservationCouncil
Zone 3 - Base CaseZone 3 - Base CaseLowest Life Cycle Cost Code Lowest Life Cycle Cost Code
Compliant PackageCompliant PackageComponentComponent Base CaseBase Case
Wall –Above GradeWall –Above Grade R21 STDR21 STD
Wall –Below GradeWall –Below Grade R19R19
AtticAttic R38 STDR38 STD
Vault - JoistedVault - Joisted R30R30
Vault - TrussedVault - Trussed R38R38
FloorFloor R30R30
WindowWindow Class 35Class 35
DoorDoor R5R5
SlabSlab R10R10
Wall – Ext. Below Wall – Ext. Below grade grade
R10R10
HVAC System – ZonalHVAC System – Zonal DHW – EF90DHW – EF90 Average Use (kWh) – Average Use (kWh) –
26,750 kWh/yr26,750 kWh/yr First Cost - $2,300First Cost - $2,300 Minimum LCC = Minimum LCC =
$255,370$255,370
slide 77
Northwest Power and ConservationCouncil
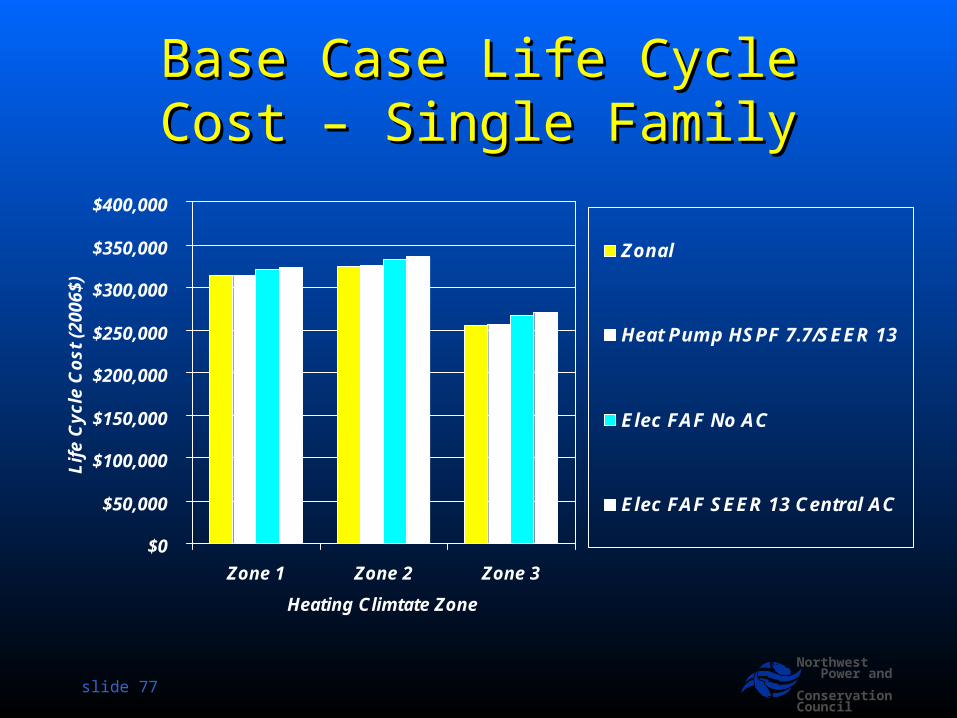
Base Case Life Cycle Cost – Base Case Life Cycle Cost – Single FamilySingle Family
$0
$50,000
$100,000
$150,000
$200,000
$250,000
$300,000
$350,000
$400,000
Zone 1 Zone 2 Zone 3
Heating Climtate Zone
Lif
e C
ycle
Co
st (
2006
$)
Zonal
Heat Pump HSPF 7.7/SEER 13
Elec FAF No AC
Elec FAF SEER 13 Central AC

slide 78
Northwest Power and ConservationCouncil
Base Case Life Cycle Cost – Base Case Life Cycle Cost – Manufactured HomeManufactured Home
$94,000
$96,000
$98,000
$100,000
$102,000
$104,000
$106,000
$108,000
$110,000
$112,000
Zone 1 Zone 2 Zone 3
Heating Climtate Zone
Lif
e C
ycle
Co
st (
2006
$)
Heat Pump HSPF 7.7/SEER 13
Elec FAF No AC
Elec FAF SEER 13 Central AC

slide 79
Northwest Power and ConservationCouncil
Base Case Annual Energy Base Case Annual Energy Use* – Single FamilyUse* – Single Family
0
5,000
10,000
15,000
20,000
25,000
30,000
35,000
40,000
Zone 1 Zone 2 Zone 3
Heating Climate Zone
En
erg
y U
se (
kWh
/yr)
Zonal
Heat Pump HSPF 7.7/SEER 13
Elec FAF No AC
Elec FAF SEER 13 Central AC
*Includes space conditioning, water heating & lighting

slide 80
Northwest Power and ConservationCouncil
Base Case Energy Use* – Base Case Energy Use* – Manufactured HomeManufactured Home
0
5,000
10,000
15,000
20,000
25,000
30,000
35,000
Zone 1 Zone 2 Zone 3
Heating Climate Zone
En
erg
y U
se
(k
Wh
/yr)
Heat Pump HSPF 7.7/SEER 13
Elec FAF No AC
Elec FAF SEER 13 Central AC
*Includes space conditioning, water heating & lighting

slide 81
Northwest Power and ConservationCouncil
Base vs Lowest Life Cycle Base vs Lowest Life Cycle Cost – Single FamilyCost – Single Family
$0
$50,000
$100,000
$150,000
$200,000
$250,000
$300,000
$350,000
Zone 1 Zone 2 Zone 3
Heating Climate Zone
Lif
e C
ycle
Co
st (
2006
$)
Base-Zonal
Base-HP
Lowest LCC
slide 82
Northwest Power and ConservationCouncil
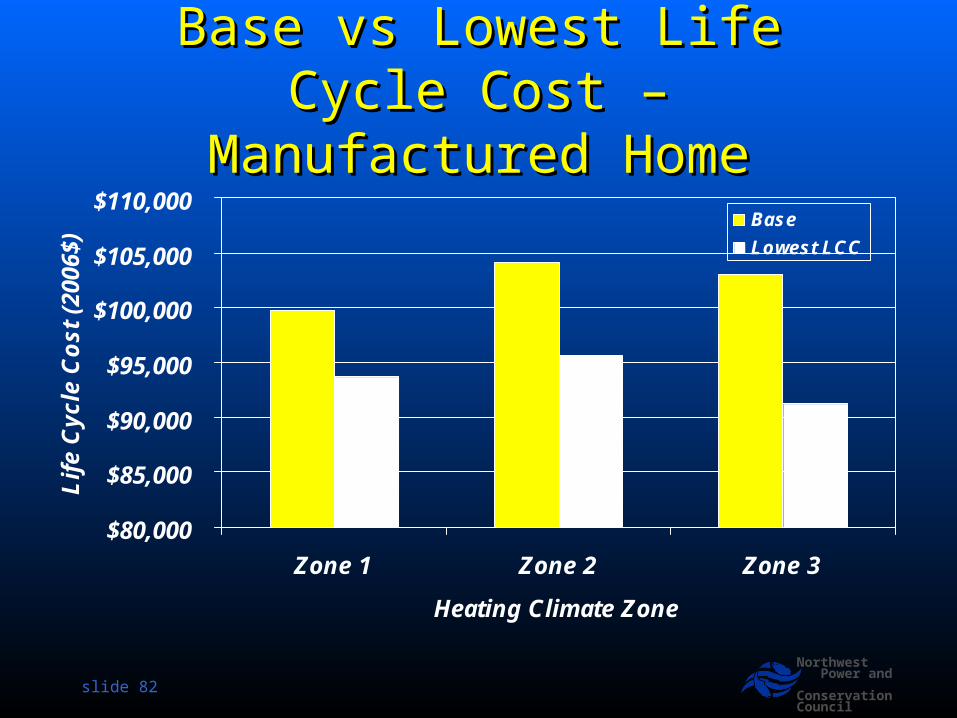
Base vs Lowest Life Cycle Base vs Lowest Life Cycle Cost – Manufactured HomeCost – Manufactured Home
$80,000
$85,000
$90,000
$95,000
$100,000
$105,000
$110,000
Zone 1 Zone 2 Zone 3
Heating Climate Zone
Lif
e C
ycle
Co
st (
2006
$)
Base
Lowest LCC
Recommended