
Program Evaluation Division North Carolina General Assembly
A presentation to the Joint LegislativeProgram Evaluation Oversight Committee
May 20, 2019
Jeff Grimes, Principal Program Evaluator
North Carolina Should Focus on Early Childhood Learning in Order to Raise
Achievement in Predominantly Disadvantaged School Districts

Program Evaluation Division North Carolina General Assembly 2
Presentation Materials
Full Report Slides

Program Evaluation Division North Carolina General Assembly3
• Identify at least 10 high-performing American school systems with predominantly economically disadvantaged student populations
• Explore reasons for the better outcomes of these systems
Report p. 2
Our Charge

Program Evaluation Division North Carolina General Assembly
Overview: Findings
1. Economically disadvantaged districts that demonstrate average or better performance are uncommon
2. Predominantly disadvantaged districts with average or above performance are already demonstrating high achievement in third grade
4

Program Evaluation Division North Carolina General Assembly
Overview: Findings
3. Economically disadvantaged districts that perform well share common characteristics
4. In North Carolina, opportunities exist to improve achievement among predominantly disadvantaged districts through state funding and other forms of support
5

Program Evaluation Division North Carolina General Assembly
Overview: RecommendationsThe General Assembly should 1. Require low-performing school districts to
include an early childhood improvement plan as a component of their required plans for improvement
2. Require an assessment of early childhood learning as part of the Department of Public Instruction’s comprehensive needs assessment process for districts
6

Program Evaluation Division North Carolina General Assembly
Student Achievement Is Influenced by Family, Community, and School Factors
7
Report pp. 3-4

Program Evaluation Division North Carolina General Assembly
Data Source
Stanford Education Data Archive (SEDA)–National dataset of US school districts–2009-2015 test score data–Contains math and English/Language Arts
scores for grades 3-8–Data is on a common scale
8
Report pp. 6-8

9Report p. 3Report p. 3

Program Evaluation Division North Carolina General Assembly10
Findings

Program Evaluation Division North Carolina General Assembly
Finding 1
Economically disadvantaged districts that demonstrate average or better performance are uncommon
11
Report p. 9
Program Evaluation Division North Carolina General Assembly
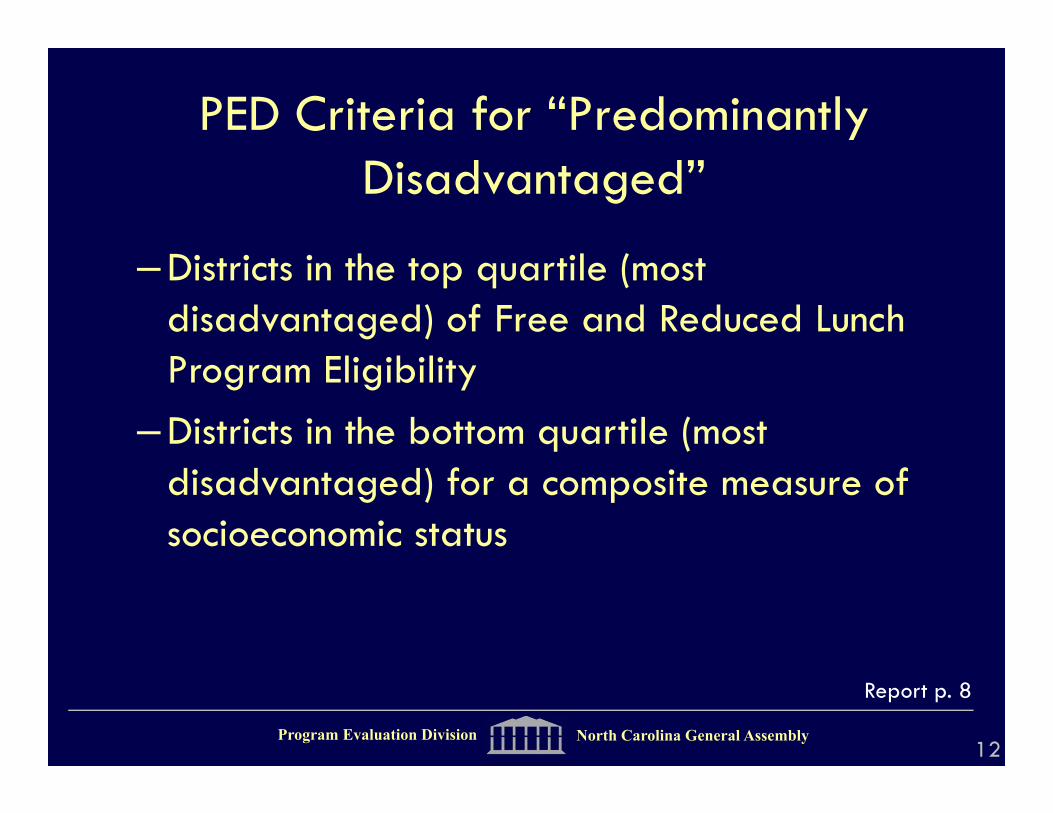
PED Criteria for “Predominantly Disadvantaged”
–Districts in the top quartile (most disadvantaged) of Free and Reduced Lunch Program Eligibility
–Districts in the bottom quartile (most disadvantaged) for a composite measure of socioeconomic status
12
Report p. 8

Few Predominantly Disadvantaged Districts Have High Achievement
13
More Advantaged Districts
Predominantly Disadvantaged
18%
Those with average or better achievement in yellow are <5% of all disadvantaged districts

Program Evaluation Division North Carolina General Assembly
Percentage of Predominantly Disadvantaged Districts that Perform at Grade Level or Above is Small
14
Report p. 11
National North Carolina
Total Districts in Dataset 11,054 115
Total Predominantly Disadvantaged Districts
1,988 45
Percentage of Districts that are Disadvantaged
18% 39%
Total Disadvantaged Districts Performing at Grade Level or Better
94 7
Percentage of Disadvantaged Districts Performing at Grade Level or Better
5% 16%

Program Evaluation Division North Carolina General Assembly
Finding 2
Predominantly disadvantaged districts with average or above performance are already demonstrating high achievement in third grade
15
Report p. 11

16
3.7
8.4
2.3
6.7
1
2
3
4
5
6
7
8
9
3 4 5 6 7 8
Aver
age
Ach
ieve
men
t (G
rade
Lev
el)
Actual Student Grade
Most of the Gap in Achievement Between Predominantly Disadvantaged Districts and More
Advantaged Districts is Present at Third Grade
Report p. 12

Student Growth Rates are Not Strongly Correlated with Economic Disadvantage
17Report p. 13

18
3.6
8.0
2.3
6.7
1
2
3
4
5
6
7
8
9
3 4 5 6 7 8
Aver
age
Ach
ieve
men
t (G
rade
Lev
el)
Actual Student Grade
Higher Performing Disadvantaged Districts Succeed by Starting at a High Level
Report p. 14

What Happens in Early Childhood Largely Explains How a School District Performs in 8th Grade
19Report p. 15

Program Evaluation Division North Carolina General Assembly
Finding 3
Economically disadvantaged districts that perform well share common characteristics
20
Report p. 16

Program Evaluation Division North Carolina General Assembly
12 Case Study Districts
21
Report p. 8
• Alleghany County School District• Hickory Public Schools • Jones County Public Schools• Wilkes County Schools• Whiteville City Schools
• Casey County School District, Kentucky• Durant Independent School District, Oklahoma• Fayette County School Corporation, Indiana• Henderson County School District, Tennessee• Johnson County Schools, Kentucky• Steubenville City Schools, Ohio• Whitley County School District, Kentucky
North Carolina:
Other States:
Program Evaluation Division North Carolina General Assembly
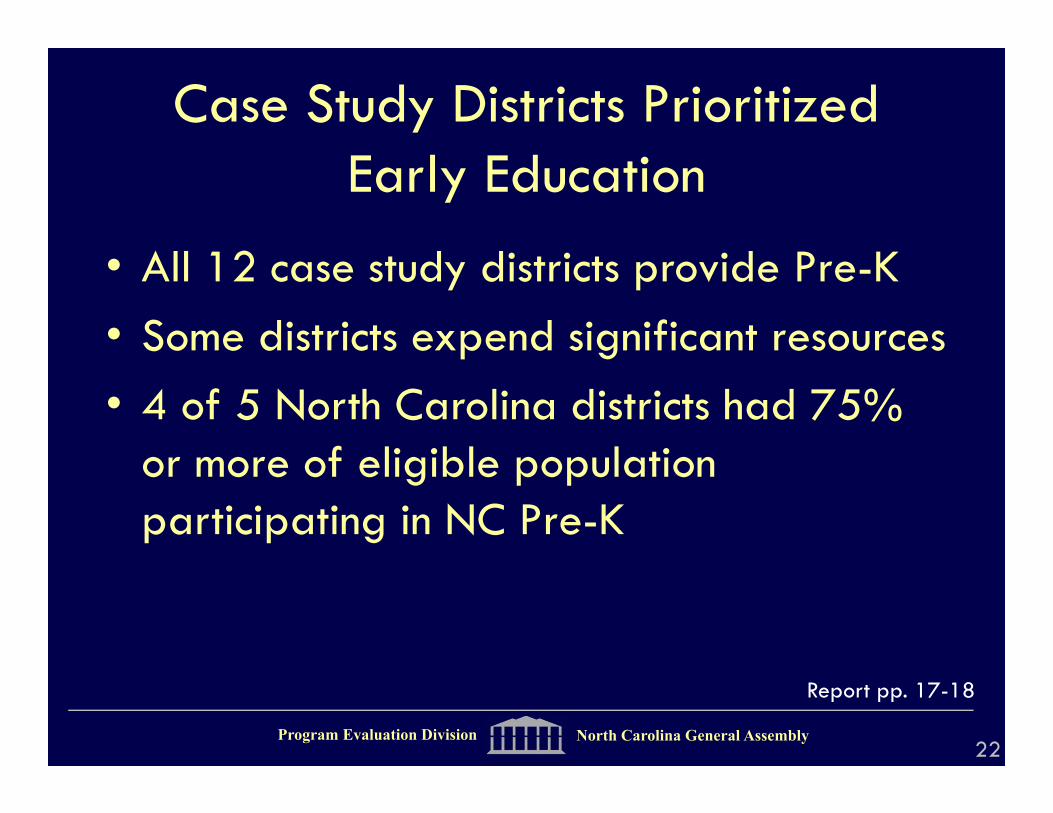
Case Study Districts Prioritized Early Education
• All 12 case study districts provide Pre-K• Some districts expend significant resources• 4 of 5 North Carolina districts had 75%
or more of eligible population participating in NC Pre-K
22
Report pp. 17-18

Program Evaluation Division North Carolina General Assembly
Case Study Districts – Other Characteristics
• Maximized learning time • Obtained additional resources• Had local school boards that focus on
policy and academic achievement
23
Report pp. 18-23

Program Evaluation Division North Carolina General Assembly
Case Study Districts – Other Characteristics
• Attract, develop, and retain high-quality teachers– Principals given autonomy to lead– Positive district culture– Teacher onboarding and development
• Used data and coaching to improve instruction
24
Report pp. 19-22

Program Evaluation Division North Carolina General Assembly
Finding 4
Opportunities exist to improve achievement among predominantly disadvantaged districts through state funding and technical assistance
25
Report p. 24

Program Evaluation Division North Carolina General Assembly
DPI Provides Support to Districts
• In 2019 DPI launched redesigned structure for supporting schools and districts
• Provides more intensive support for low-performing schools and districts
26
Report pp. 24-25

Program Evaluation Division North Carolina General Assembly
NC Pre-K
• Targets children from families with incomes at or below 75% of state median income
• General Assembly has been increasing the number of children enrolled
• Estimated serving roughly 47% of eligible children, 24% of all four year-olds in state
27
Report p. 25

Program Evaluation Division North Carolina General Assembly
B-3 Interagency Council
• Created by General Assembly in 2017• Charged with establishing a vision and
accountability for a birth through third grade system of early education
28

Program Evaluation Division North Carolina General Assembly
Recommendation 1
General Assembly should require low-performing school districts to include an early childhood improvement plan as a component of their required plans for improvement
29
Report p. 26

Program Evaluation Division North Carolina General Assembly
Recommendation 2
General Assembly should require an assessment of early childhood learning as part of the Department of Public Instruction’s comprehensive needs assessment process for districts
30
Report p. 27

Program Evaluation Division North Carolina General Assembly
Summary• Relatively few predominantly disadvantaged
districts perform at grade-level or above; those that do are usually demonstrating high achievement in third grade
• General Assembly should require early childhood improvement plans for low-performing districts and assessments of early childhood learning as part of comprehensive needs assessments
31

Program Evaluation Division North Carolina General Assembly
Report available online atwww.ncleg.net/PED/Reports/reports.html
32
Recommended


![Presentation1.pptx [repaired]](https://img.pdfslide.us/doc/110x75/58a9e64c1a28ab36018b4839/presentation1pptx-repaired-58ac0f71a4da9.jpg)