North Carolina Legislative Services CommissionPublic School Construction Needs Survey and Recommendations for Funding Options For Selected Districts
MGT of America Consulting, LLCApril 2017
1

Agenda
Background and Project Goals
Project Schedule
Methodology
Facility Evaluations Facility Condition based on national standards
Educational Suitability based on NC standards
Financial Review
Summary
Questions / Discussion2

Project Goals:
“Perform an independent evaluation of school construction needs and determine which of the local school administrative units have the highest facility needs in relation to their capacity to raise revenue to meet those needs.”
33

Project Scope LEAs Evaluated
LEA NAME DEPT. OF PUBLIC INSTRUCTION
REGIONCOUNT OF SCHOOLS
NUMBER OF STUDENTS
AREA INSQUARE MILES
Anson 6 11 2,653 538
Bertie 1 8 2,398 741
Clay 8 3 1,259 221
Davie 5 12 6,257 261
Greene 2 6 2,977 266
Harnett 3 28 19,931 601
Jones 2 6 1,108 473
Scotland 4 11 5,624 320
Yancey 7 7 2,653 313
44

YANCEYDPI REGION 7
ANSONDPI REGION6
SCOTLANDDPI REGION4
BERTIEDPI REGION 1
JONESDPI REGION 2
DAVIEDPI REGION 5
CLAYDPI REGION 8
HARNETTDPI REGION3
GREENEDPI REGION 2
Project Scope LEAs Evaluated
55

Project Schedule and Methodology
TASKS NOV DEC JAN FEB MAR APR MAY JUN
1.0 PROJECT INITATION & MANAGEMENT November ‐ June
2.A STATE & PILOT DISTRICT CONFERENCES
First week of November
2.B LOCAL LEA CONFERENCES First week of Dec. and first 2 weeks of Jan.
3.0 EVALUATIONS FOR HARNETT November 14th –December 16th
4.0 EVALUATIONS FOR OTHER LEAS
Mid‐December – mid‐February
5.0 CAPACITY CALCULATIONS Mid‐January – end of February
6.0 TABULATION COMPARING NEEDS Last week of February
7.0 REPORT WRITING First week of Feb. –first week of Mar.
8.0 DELIVERY TO LEGISLATIVE COMMITTEES March 6th ‐15th
9.0 FOLLOW‐ON CONSULTATIONS
March 20th – June 30th
66

Evaluation Methodology

8
Capacity and Utilization Process
MGT uses a program‐based capacity model to determine building capacity and utilization.– Developed student loading factors based on DPI Guidelines
– Calculated capacity using MGT program‐based model
– Used several schools across a number of counties as examples of under / over utilization
8

Capacity & Utilization
UTILIZATION DESCRIPTION
> 110% Inadequate space
95 – 110% Approaching Inadequate space
80 – 95% Adequate space
70 – 80% Approaching Inefficient use of space
< 69.99% Inefficient use of space
99

10
North Carolina Program Space Guidelines
ROOM TYPE NUMBER OF CLASSROOMS X
STUDENTS/ CLASSROOM = CAPACITY
HS General Classroom 35 22 770Science MS/HS 7 18 126Vocational MS/HS 15 15 225Music MS/HS 2 22 44P.E. MS/HS 4 50 200Art MS/HS 1 22 22Computer Lab 4 22 88Secondary Special Education self‐contained 2 10 20
Secondary Resource (pull‐out) 3 0 0Total Capacity (w/o scheduling factor) =1,495
x High School scheduling factor of 75%
Sample Harnett County High School Capacity =1,121
10

11
Program Based Space Analysis Model
INSTRUCTIONAL SPACE MODEL GUIDELINES
ROOM TYPE LOADING FACTOR (STUDENTS/ROOM)
Pre‐Kindergarten 0Kindergarten 18ES General Classroom (1‐3) 17ES General Classroom (4‐6) 26MS General Classroom 26HS General Classroom 22Science MS/HS 26/18Vocational MS/HS 0/15Music MS/HS 0/22P.E. MS/HS 0/50Art MS/HS 0/22Computer Lab 0/22ES Special Education self‐contained 10MS Special Education self‐contained 10Elementary Resource (pull‐out) 0Secondary Resource (pull‐out) 0 11
SCHEDULING FACTOR
Elementary 95%Middle 85%High 75%

12
Sample Use of Space
School GRADE
K‐12 ADM (2015‐16)
ISM Capacity Excluding
PK
UTILIZ
BERTIE MIDDLE 06‐08 555 649 85%
BERTIE EARLY COLLEGE HIGH 09‐12 169 397 43%
BERTIE HIGH SCHOOL 09‐12 473 746 63%
GREENE COUNTY INTERMEDIATE 04‐05 467 488 96%
SNOW HILL PRIMARY PK‐01 464 422 110%
WEST GREENE ELEMENTARY 02‐03 501 349 144%
GREENE COUNTY MIDDLE 06‐08 679 627 108%
GREENE CENTRAL HIGH 09‐12 877 746 118%
ANDERSON CREEK PRIMARY 09‐12 553 508 109%
ANGIER ELEMENTARY 03‐05 453 660 69%
UTILIZATION
> 110%
95 – 110%
80 – 95%
70 – 80%
< 69.99%
12

13
Suitability Evaluation Methodology
Development of Educational Suitability and Technology Readiness criteria – based on DPI Guidelines
ENVIRONMENT The overall environment of the schools with respect to creating a safe and positive learning environment.
CIRCULATION Pedestrian/vehicular circulation and the appropriateness of site facilities and signage.
ENVIRONMENT BY ROOM TYPE
The existence and quality of facilities and spaces to support the educational program being offered. These include general classrooms, special learning spaces (e.g. music rooms, libraries, science labs), and support spaces (e.g. administrative offices, counseling offices, reception areas, kitchens, health clinics).
SIZE The adequacy of the size of the program spaces.
LOCATION The appropriateness of adjacencies (e.g., physical education space separated from quiet spaces).
STORAGE & FIXED EQUIPMENT
The appropriateness of fixed equipment, storage, and room surfaces (e.g., flooring, ceiling materials, and wall coverings) and specialized safety or program equipment (e.g., safety shower and eyewash in science labs, kiln and clay traps in art rooms). 13

14
Suitability Evaluation Methodology
Use DPI Guidelines to create Suitability Guide
Meet with district staff for intake and schedule review
Walk each school– Condition assessors – with facility staff– Suitability assessors – with principal/designee
Score spaces based on program needs and Guide to create BASYS Suitability Reports
Count spaces to determine CAPACITY of each school
14

Facility EvaluationEducational Suitability
90+Excellent: The facility is designed to provide for and support the educational program offered. It may have a minor suitability issues but overall it meets the needs of the educational program.
80‐89Good: The facility is designed to provide for and support a majority of the educational program offered. It may have minor suitability issues but generally meets the needs of the educational program.
70‐79 Fair: The facility has some problems meeting the needs of the educational program and will require remodeling/renovation.
60‐69Poor: The facility has numerous problems meeting the needs of the educational program and needs significant remodeling, additions, or replacement.
BELOW 60
Unsatisfactory: The facility is unsuitable in support of the educational program.
1515

Facility EvaluationTechnology Readiness
90+ Excellent: The facility has excellent infrastructure to support information technology.
80‐89 Good: The facility has the infrastructure to support information technology.
70‐79 Fair: The facility is lacking in some infrastructure to support information technology.
60‐69 Poor: The facility is lacking significant infrastructure to support information technology.
BELOW 60
Unsatisfactory: The facility has little or no infrastructure to support information technology.
1616

17
BASYS Report Sample
17

18
Condition Evaluation Methodology
Rigorous, consistent, thorough surveys
ASTM E2018‐08 Standard Guide for Property Condition Evaluations
Life‐cycle analysis – remaining service life
Goal: cost to achieve No Expired Systems
Deficiencies based on Expired Service Life
ASTM UNIFORMAT II Classification for All Building Elements
RSMeans building construction cost data
Cost models for each facility type
Capital renewal projections – 5‐yr. needs18

Facility EvaluationsBuilding and Site Condition
90+
New or Like New: The building and/or a majority of its systems are in very good condition and only require preventive maintenance; only a few, if any, systems have reached their expected life‐cycle age. The total replacement cost of any “expired” systems is less than 10% of the current replacement value of the facility.
80‐89
Good: The building and/or a majority of its systems are in good condition and only require routine maintenance; the total replacement cost of systems that have reached or exceed their expected service life (life‐cycle age) is between 10 and 20% of the current replacement cost of the facility.
70‐79
Fair: The building and/or some of its systems are in fair condition based on age and operations; the total replacement cost of systems that have reached or exceed their expected service life (life‐cycle age) is between 20 and 30% of the current replacement cost of the facility.
60‐69
Poor: The building and/or a significant number of its systems are in poor condition and require major repair, renovation, or replacement; the total replacement cost of systems that have reached or exceed their expected service life (life‐cycle age) is between 30 and 40% of the current replacement cost of the facility.
BELOW 60
Unsatisfactory: The building and/or a majority of its systems should be replaced due to risk of system failure, inefficient operation and increased maintenance requirements; the total replacement cost of systems that have reached or exceed their expected service life (life‐cycle age) is greater than 40% of the current replacement cost of the facility.
1919

LEA Self Survey / MGT –Parsons Assessments

21
DPI Facility Needs Assessment Tool
G. S. 115C‐521(a) requires LEA’s to submit 5‐year long‐range capital plans; 2015/16 latest version.
The Department of Public Instruction (DPI), School Planning Division developed a uniform reporting system:– Subjective Condition rating scale
– Capacity focus to support additions and new schools
– Renovation/Repair module for capital equipment and systems replacement; selectively used by districts
DPI Condition rating scale is not at system level and does not generate “needs”.

22
MGT / Parsons Facility Evaluation Outcomes
Facility/Cost Model Analysis
Capital Renewal Forecast
Catalogue Current Deficiencies
Quantify Corrections and Cost Budgets
Prioritize Facility Needs22

Difference in 2017 Evaluation Estimates From LEA Self-Estimates
Differences in Process: Parsons applies Life‐Cycle analysis uniformly and rigorously
to all systems in all buildings
– Goal is to bring all systems to “not expired” status
MGT estimates costs to fill suitability gaps Capacity calculations based on program delivery
Differences in Outcomes: DPI approach captures only what districts choose to submit Some districts feel there is little incentive to complete the
survey23

24
Difference in 2017 Evaluation Estimates From LEA Self-EstimatesSmaller Difference – Anson County
24
SITE NAME
2017 MGT / PARSONS TOTAL
BUDGET ESTIMATE
0 TO 5 YEARS2015‐16 FACILITY NEEDS SURVEY
TOTAL
DIFFERENCE
Elementary Schools
ANSONVILLE ELEMENTARY $ 2,475,083 $717,675 $1,757,408
LILESVILLE ELEMENTARY $6,674,606 $964,653 $5,709,953
MORVEN ELEMENTARY $6,446,039 $950,068 $5,495,971
PEACHLAND‐POLKTON ELEMENTARY $7,788,442 $973,231 $6,815,211
WADESBORO ELEMENTARY $15,395,928 $1,130,927 $14,265,001
WADESBORO PRIMARY $5,408,109 $ ‐ $5,408,109
ELEMENTARY SCHOOL TOTAL $44,188,206 $4,736,554 $39,451,652

25
Difference in 2017 Evaluation Estimates From LEA Self-EstimatesSmaller Difference – Anson County (Continued)
25
SITE NAME
2017 MGT / PARSONS TOTAL
BUDGET ESTIMATE
0 TO 5 YEARS2015‐16 FACILITY NEEDS SURVEY
TOTAL
DIFFERENCE
Middle Schools
ANSON MIDDLE $31,340,207 $24,532,338 $6,807,869
MIDDLE SCHOOL TOTAL $31,340,207 $24,532,338 $6,807,869
High SchoolsANSON ACADEMY $207,200 $186,819 $20,381 ANSON CO. EARLY COLLEGE HIGH $1,186,566 $8,463 $1,178,103
ANSON HIGH SCHOOL $22,845,705 $56,041,612 $(33,195,907)ANSON NEW TECH HIGH $286,200 $16,500 $269,700
HIGH SCHOOL TOTAL/AVERAGE $24,525,671 $56,253,394 $(31,727,723)
DISTRICT TOTAL $100,054,084 $85,522,286 $14,531,798

26
Difference in 2017 Evaluation Estimates From LEA Self-EstimatesLarger Difference – Bertie County
26
SITE NAME
2017 MGT / PARSONS TOTAL
BUDGET ESTIMATE
0 TO 5 YEARS2015‐16 FACILITY NEEDS SURVEY
TOTAL
DIFFERENCE
Elementary Schools
AULANDER ELEMENTARY $8,023,594 $597,450 $7,426,144
COLERAIN ELEMENTARY $2,458,028 $255,858 $2,202,170
WEST BERTIE ELEMENTARY $11,354,088 $ ‐ $11,354,088
WINDSOR ELEMENTARY $4,761,526 $1,087,491 $3,674,035
ELEMENTARY SCHOOL TOTAL $26,597,235 $1,940,799 $24,656,436
Other Educational
SKEWVILLE PRESCHOOL $4,007,266 $ ‐ $4,007,266
OTHER EDUCATIONAL TOTAL $4,007,266 $ ‐ $ 4,007,266

27
Difference in 2017 Evaluation Estimates From LEA Self-EstimatesLarger Difference – Bertie County (Continued)
27
SITE NAME
2017 MGT / PARSONS TOTAL
BUDGET ESTIMATE
0 TO 5 YEARS2015‐16 FACILITY NEEDS SURVEY
TOTAL
DIFFERENCE
Middle Schools
BERTIE MIDDLE $1,362,445 $ ‐ $1,362,445
MIDDLE SCHOOL TOTAL $1,362,445 $ ‐ $1,362,445
High Schools
BERTIE EARLY COLLEGE HIGH $13,426,305 $945,060 $12,481,245
BERTIE HIGH SCHOOL $8,508,919 $ ‐ $8,508,919
HIGH SCHOOL TOTAL/AVERAGE $21,935,224 $945,060 $20,990,164
DISTRICT TOTAL $53,902,170 $2,885,859 $51,016,311

Total Need by District

29
Combined Scores - Weighting Methodology
The overall condition score* for a school is based on square footage of all the permanent buildings. The condition score is weighted as 50% of the combined score calculation.
The site score* includes the driveways and walkways, the parking lots, the playfields, the utilities, fencing, etc. The site score is weighted as 10% of the combined score calculation.
The overall suitability score** applies to all the buildings at the school. The suitability score is weighted as 30% of the combined score calculation.
The technology readiness score** is based on infrastructure issues, such as having sufficient cooling and power outlets for computers. The technology score is weighted as 10% of the combined score calculation.
*Both Condition and Site were scored using eCOMET®. ** Both Suitability and Technology were scored using BASYS. 29

Facility Needs Summary
Site Name
Combined Score (50/10/30/10)
2015‐16 Current
Utilization
2017 MGT / Parsons Total
Budget Estimate
0 to 5 Years2015‐16
Facility Needs Survey Total
Difference
Anson County
Anson County Total/Average 66 89% $100,054,084 $85,522,286 $14,531,798
Bertie County
Bertie County Total/Average 70 70% $53,902,170 $2,885,859 $51,016,311
Clay County
Clay County Total/Average 83 101% $16,494,879 $0 $16,494,879
Davie County
Davie County Total/Average 83 96% $54,211,832 $2,566,120 $51,645,712
Greene County
Greene County Total/Average 83 109% $34,849,896 $9,098,980 $25,750,916
3030

Facility Needs Summary
Site Name
Combined Score (50/10/30/10)
2015‐16 Current
Utilization
2017 MGT / Parsons Total
Budget Estimate
0 to 5 Years2015‐16 Facility Needs Survey
Total
Difference
Harnett CountyHarnett County Total/Average 81 112% $239,201,908 $148,691,065 $90,510,843
Jones County
Jones County Total/Average 68 63% $38,530,225 $31,384,794 $7,145,431
ScotlandScotland County Total/Average 79 92% $59,532,489 $4,080,630 $55,451,859
Yancey County
Yancey County Total/Average 71 87% $33,424,596 $3,591,677 $29,832,919
All District
All District Total/Average 76 99% $630,202,078 $287,821,411 $342,380,667
3131

Financial Capacity

Financial Review
Interviews with district and county staff
Data collected – examples on the following pages
3333

Financial ReviewData Example, Jones County
District Budget Information Example
3434
District Budget FY2015‐2016 JonesDept. of Public Instruction Region 2Count of Schools 6Number of Students 1108Area in Square Miles 473CIP 5‐year Plan Need $0Lottery 2015‐16 $169,367Article 40 Revenue $173,163Article 42 Revenue $125,140Property Tax Revenue $0Taxes Fines / Forfeitures $105,496Proceeds of Capital Assets $104,642Donations / Grants $674,665Total Capital Budget $1,352,473Capital Revenue as Percent of Budget 10.56%District Budget $12,811,778County Budget Allocation to District $1,740,900% County Allocation / Budget 13.6%

Financial ReviewData Example, Jones County
District Assessed Value and Property Tax Information Example
3535
Assessed Valuation and Property Tax Information JonesMaximum Property Tax Rate $1.50Assessed Valuation $813,248,643Maximum Allowable Debt Service Amount $65,059,891Current Property Tax Revenue (assessed value x current tax rate) $6,424,664
Maximum Property Tax Revenue (assessed value x maximum tax rate) $12,198,730
Percentage of Property Tax Revenue 52.67%GO Bond Debt $0.00Installment Debt $2,029,071Maximum Unused $2,029,071

Financial ReviewData Example, Jones County
District Capital Requirements Example
3636
Capital Requirements as Determined by MGT ParsonsFuture Facility Need $38,530,225
Financing Option 20‐year Revenue from 40 & 42 Sales Tax Funds $5,720,600Bond Revenue Needed $32,809,625Percentage of Capital Need Provided by 40 & 42 Sales Tax Funds 14.8%
Projected 20 ‐year Debt Service Annual Payment to cover School Facility Capital Need $2,160,201
Property Tax Rate $0.7900Property Rate Increase to cover debt $0.2660Projected Annual Tax Rate Increase $1.0560

Jones County 2008 2009 2010 2011 2012 2013 2014 2015
County Revenue $13,070,081 $12,467,213 $12,316,883 $13,292,238 $12,995,361 $13,819,984 $12,997,163 $12,811,778
Debt Capacity $55,809,550 $56,214,325 $57,323,119 $57,986,473 $58,793,276 $61,470,453 $62,986,817 $64,605,235
Debt Service $2,303,056 $2,207,734 $2,319,882 $2,247,468 $2,052,160 $1,854,559 $2,072,162 $1,829,044
Financial ReviewData Example, Jones County
Historical County Revenue and Debt Capacity Information
3737
$169,367, 12%
$173,163, 13%
$125,140, 9%
$0, 0%
$105,496, 8%$104,642, 8%
$674,665, 50%
FY 2015‐16 Capital Program Revenue
Lottery 2015‐16 Article 40 Revenue Article 42 RevenueProperty Tax Revenue Taxes Fines / Forfeitures Proceeds of Capital AssetsDonations / Grants

Financial ReviewData Example, Jones County
3838
$5,720,600, 15%
$32,809,625, 85%
Bond Revenue Need vs Local Sales Tax Revenue for future Capital Facility Need
20 year Revenue 40&42 Funds Bond Revenue Needed

Financial ReviewData Example, Jones County
3939
0.770.80.7560.7560.7560.7560.7560.7460.66
0.79
00.10.20.30.40.50.60.70.80.9
2015201420132012201120102009200820072006
Tax Rate (County)
$12.8$12.9$13.8$12.9$13.2$12.3$12.4$13.0
$10.9$10.3
$‐
$5
$10
$15
2015201420132012201120102009200820072006
Millions
Jones County Revenue

Summary, Conclusions and Recommendations

Summary Findings
Total facility needs 9 Districts: $630,202,078 Largest total dollar ‐ Harnett County: $239,201,908
Districts with the largest dollar need per student:
Anson County: $37,714
Jones County: $34,775
Average need/student 9 districts: $18,180
Districts requiring highest tax rate to meet the facility needs: Anson, Bertie, Jones, and Scotland: tax rate over $1.05
Statewide average tax rate: $0.66
9 district average tax rate: $0.90 4141

42
Per Student Need by District
District Per Student Capital Need*
Anson $37,714
Bertie $22,478
Clay $13,102
Davie $8,664
Greene $11,706
Harnett $12,002
Jones $34,775
Scotland $10,585
Yancey $12,599
*based on total capital facility need
42
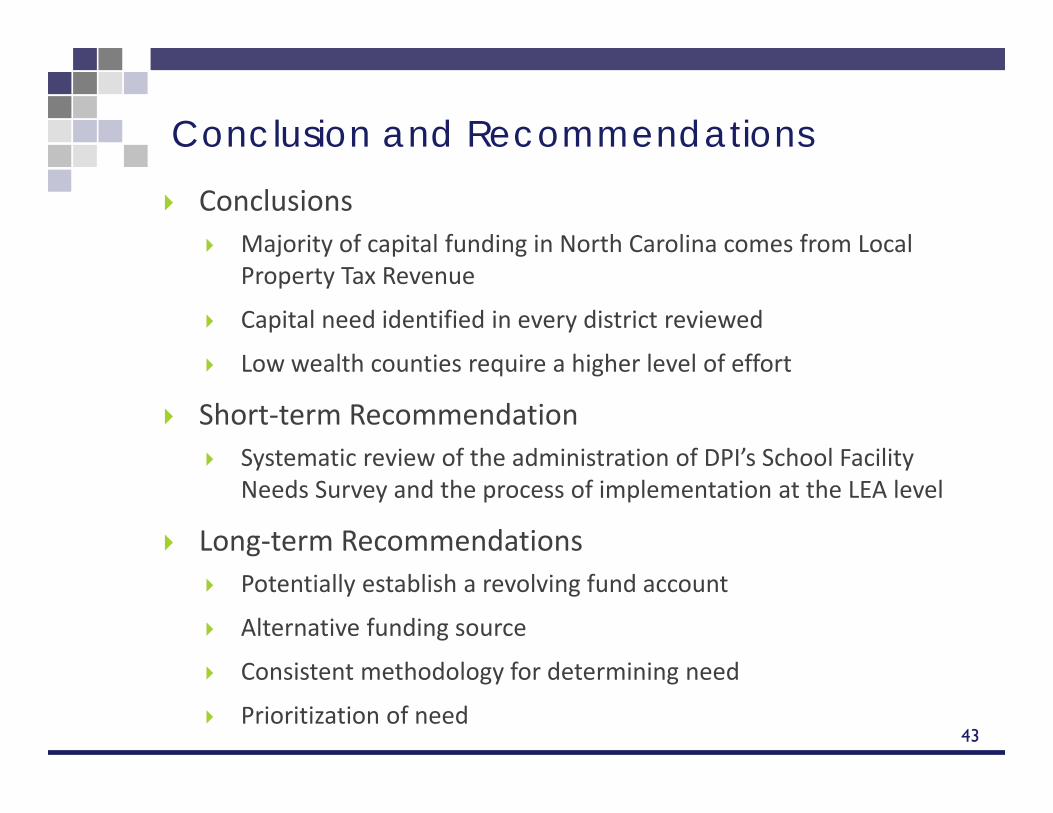
Conclusion and Recommendations
Conclusions Majority of capital funding in North Carolina comes from Local
Property Tax Revenue
Capital need identified in every district reviewed
Low wealth counties require a higher level of effort
Short‐term Recommendation Systematic review of the administration of DPI’s School Facility
Needs Survey and the process of implementation at the LEA level
Long‐term Recommendations Potentially establish a revolving fund account
Alternative funding source
Consistent methodology for determining need
Prioritization of need4343

44
School-Level Data Available
Individual school survey reports Combined capital renewal and FCI
tabulations, ratings, rankings Suitability and Technology ratings and
rankings Capacity and Utilization Reports Data comparisons Hundreds of photos for each facility Deficiencies with costs, photos, & remedies Metrics and Indices – FCI, RSL, CRV, etc.
44

Questions / Discussion
Recommended