NONPHOSPHORUS LIPIDS IN PERIPHYTON REFLECT AVAILABLE NUTRIENTSIN THE FLORIDA EVERGLADES, USA1
Brent J. Bellinger 2,3
Soil and Water Science Department, University of Florida, West Palm Beach, Florida 33417, USA
and Benjamin A. S. Van Mooy
Department of Marine Chemistry and Geochemistry, Woods Hole Oceanographic Institution, MS#4, Woods Hole,
Massachusetts 02543, USA
Algal and plant production of nonphosphorus lip-ids in place of phospholipids is a physiologicalresponse to low phosphorus (P) availability. Thisresponse has been shown in culture and in marineplankton studies, but examples from freshwateralgae remain minimal. Herein, we analyzed thenutrient contents and lipid composition of periphy-ton communities across the Florida Everglades eco-system. We hypothesized that in phosphate-poorareas, periphyton in high- and low-sulfate waterswould vary the proportion of sulfolipids (SLs) andbetaine lipids (BLs), respectively. In phosphate-enriched areas, periphyton would produce morephospholipids (PLs). We observed that at low-Psites, PLs were a minor lipid component. In cyano-bacteria-dominated periphyton where sulfate wasabundant, BLs were only slightly more abundantthan SLs. However, in the low-P, low-sulfate area,periphyton were comprised to a greater degreegreen algae and diatoms, and BLs represented themajority of the total lipids. Even in a P-rich area,PLs were a small component of periphyton lipidprofiles. Despite the phosphorus limitations of theEverglades, periphyton can develop tremendous bio-mass. Our results suggest a physiological responseby periphyton to oligotrophic conditions wherebyperiphyton increase abundances of nonphosphoruslipids and have reduced proportions of PLs.
Key index words: betaine lipid; everglades; oligo-trophic; periphyton; phospholipid; sulfolipid
Abbreviations: BL, betaine lipid; DGCC, diacylgly-ceryl carboxyhydroxymethylcholine; DGDG, diga-lactosyldiacylglycerol; DGTA, diacylglycerylhydroxymethyl-trimethyl-b-alanine; DGTS, diacyl-glyceryl trimethylhomoserine; ENP, EvergladesNational Park; GL, glycolipid; IP-DAG, intact polardiacylglycerolipid; MGDG, monogalactosyldiacylglycerol;
PC, phosphatidylcholine; PE, phosphatidylethanolamine;PG, phosphatidylglycerol; PL, phospholipid; SL, sulfoli-pid; SQDG, sulfoquinovosyldiacylglycerol; WCA, waterconservation area
P availability is a determinant of algal productionand growth rate in freshwater and marine ecosys-tems (Sterner and Elser 2002, Hill and Fanta 2008).However, in wetlands, greater algal biomass andareal production may be observed under low nutri-ent (oligotrophic) conditions as a result of complexfeedback mechanisms between biotic and abioticfactors (e.g., emergent macrophyte shading, matdissolution, species shifts) (Grimshaw et al. 1997,Gaiser et al. 2011, Hagerthey et al. 2011). Algaecope with low total P (TP) concentrations by utiliza-tion of organic phosphorus via enzymatic processes(Newman et al. 2003), rapid uptake rates (Scintoand Reddy 2003), and stoichiometrically imbalancedgrowth (Sterner and Elser 2002).
A physiological modification that algae use isreduced production of PLs, in favor of nonphospho-rus lipids (Frentzen 2004, Sato 2004, Van Mooyet al. 2009). Nonphosphorus lipids can compensatefor reduced PL contents during low P availability,which in principle ensures a greater P supply forcontinued cell growth (Benning et al. 1993, Yu andBenning 2003, Van Mooy et al. 2009). This physio-logical plasticity has been documented in monocul-tures of higher plants (Essigmann et al. 1998,Hartel and Benning 2000), green algae (Sato et al.2000a, b), cyanobacteria (Awai et al. 2007, VanMooy et al. 2009), and anoxygenic photosyntheticbacteria (Benning et al. 1995, Benning 1998, VanMooy et al. 2009). Observation of nonphosphoruslipid production in natural environments has beenlimited to marine (Van Mooy et al. 2006, 2009, Schu-botz et al. 2009) and freshwater (Ertefai et al. 2008)phytoplankton, and marine algal mats (Buhringet al. 2009). The type and abundance of alternative
1Received 25 May 2011. Accepted 12 September 2011.2Present address: Mid-Continent Ecology Division, US Environ-
mental Protection Agency, Duluth, Minnesota 55804, USA.3Author for correspondence: e-mail [email protected].
J. Phycol. 48, 303–311 (2012)� 2012 Phycological Society of AmericaDOI: 10.1111/j.1529-8817.2012.01125.x
303
lipids produced may differ for eukaryotic algae andcyanobacteria (Van Mooy et al. 2009).
Sulfur (S) is an essential plant macronutrient(e.g., for amino acids, lipids, vitamins), but S limita-tion is rarely observed in aquatic environments(Dahl et al. 2008). SLs are a natural component ofcyanobacterial, algal, and plant chloroplast, and thy-lakoid membranes and envelopes along with glycoli-pids (GLs) and PLs (Benson et al. 1959, Sato 2004).The SL’s anionic charge enables it to be substitutedfor the chloroplast PL phosphatidylglycerol (PG),sparing P for cell growth (Sato et al. 1995, Yu andBenning 2003). An additional lipid class, the zwitter-ionic nitrogen-containing BLs, can be produced inexcess relative to phosphatidylcholine (PC) underP-limiting conditions (Benning et al. 1995, VanMooy et al. 2009). Betaine lipids appear to be widelydistributed in higher algae and lower plants (Ei-chenberger 1993, Kunzler and Eichenberger 1997,Rozentsvet et al. 2000), but so far observations havebeen limited in photosynthetic bacteria (Benninget al. 1995) and cyanobacteria (Rezanka et al.2003).
This study documents in situ SL and BL contentsin intact periphyton assemblages in an oligotrophicwetland ecosystem, the Florida Everglades, USA(Fig. 1). The Everglades provides a variety of P andsulfate gradients for quantifying alternative lipidabundances in response to nutrient availability. Wehypothesized that in P-limited areas of the Ever-glades, PLs would constitute a small component ofthe total lipid pool, and nonphosphorus lipidswould be prominent. The abundance of SLsand BLs would be dependent on sulfate availabilityand the relative proportions of cyanobacterial andeukaryotic algal groups in periphyton. Cyanobacte-ria-dominated periphyton in sulfate-rich areas wouldhave greater proportions of SLs relative to PLs andBLs. Conversely, at an area where the periphytonhad a greater eukaryotic algal component (e.g., dia-toms and green algae), and both P and sulfate werelimited in availability, periphyton would havegreater proportions of BLs relative to both PLs andSLs. At a site that had increased P concentrations,periphyton would have greater PL content, reducingthe relative abundance and proportion of alternativelipids compared to oligotrophic areas.
MATERIALS AND METHODS
Study sites. The Everglades is an oligotrophic (TotalP < 0.01 mg Æ L)1) ecosystem that nonetheless supports sub-stantial (more than 1 kg ash-free dry weight [AFDW] •m)2
common) periphyton biomass (Gaiser et al. 2011, Hagertheyet al. 2011). Due to compartmentalization and water manage-ment, water chemistry varies significantly across the Everglades(Table 1), with an effect on periphyton assemblage structure(Gaiser et al. 2011, Hagerthey et al. 2011). From the SouthFlorida Water Management District’s DBHydro database(http://www.sfwmd.gov/portal/page/portal/xweb%20environmental%20monitoring/dbhydro%20application), we down-loaded water-quality data collected for long-term monitoringand assessment of the ecosystem (e.g., Newman and Hagerthey2011) or associated with an active management and monitor-ing project (Cattail Habitat Improvement Project [CHIP], Sklaret al. 2009).
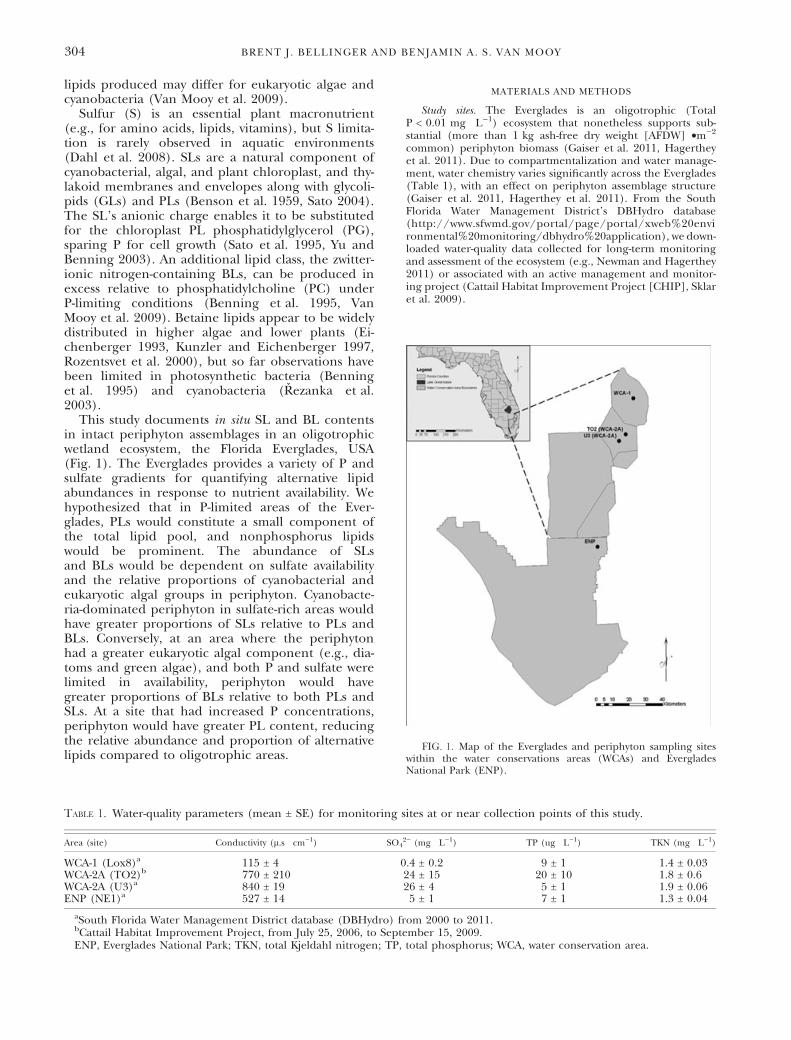
FIG. 1. Map of the Everglades and periphyton sampling siteswithin the water conservations areas (WCAs) and EvergladesNational Park (ENP).
Table 1. Water-quality parameters (mean ± SE) for monitoring sites at or near collection points of this study.
Area (site) Conductivity (l.s Æ cm)1) SO42) (mg Æ L)1) TP (ug Æ L)1) TKN (mg Æ L)1)
WCA-1 (Lox8)a 115 ± 4 0.4 ± 0.2 9 ± 1 1.4 ± 0.03WCA-2A (TO2)b 770 ± 210 24 ± 15 20 ± 10 1.8 ± 0.6WCA-2A (U3)a 840 ± 19 26 ± 4 5 ± 1 1.9 ± 0.06ENP (NE1)a 527 ± 14 5 ± 1 7 ± 1 1.3 ± 0.04
aSouth Florida Water Management District database (DBHydro) from 2000 to 2011.bCattail Habitat Improvement Project, from July 25, 2006, to September 15, 2009.ENP, Everglades National Park; TKN, total Kjeldahl nitrogen; TP, total phosphorus; WCA, water conservation area.
304 BRENT J. BELLINGER AND BENJAMIN A. S. VAN MOOY
To examine lipid differences, we collected epiphytic periph-yton within 1 m2 quadrats from four study sites (n = 3 plots persite) in three regions of the Everglades with contrasting P andsulfate concentrations (Fig. 1, Table 1). The first site sampledwas in the interior of WCA-1 (Fig. 1), the last remnantombrotrophic region, containing trace amounts of P andsulfate (0.009 mg Æ L)1 and <0.4 mg Æ L)1 [detection limits],respectively) (Table 1). Periphyton was a loosely consolidatedmatrix comprised of desmids, diatoms, filamentous greenalgae, and cyanobacteria associated with Utricularia purpureawith a species composition distinctive within the Everglades(Gaiser et al. 2011, Hagerthey et al. 2011).
The next two sites sampled were in WCA-2A, a minerotrophic,sulfate-rich (26 mg Æ L)1) area that suffers P enrichmentdownstream from discharge structures, but P concentrationsdecline along a gradient moving toward to the interior(McCormick et al. 1996) (Fig. 1). The second site was Pimpacted (TO2-WCA-2A) with TP concentrations up to0.05 mg Æ L)1 (mean 0.02 mg Æ L)1); the third site is oligo-trophic (U3-WCA-2A), with average TP of 0.005 mg Æ L)1
(Table 1). The fourth site sampled was in Everglades NationalPark (ENP) (Fig. 1), a minerotrophic low TP (0.007 mg Æ L)1)and sulfate (5 mg Æ L)1) area. Dissolved N is typically plentifulacross all study sites (total Kjeldahl nitrogen [TKN]> 1 mg Æ L)1) (Table 1). Thick calcareous periphyton of similarspecies compositions growing as epiphytic ‘‘sweaters’’ on thestems of Eleocharis and Cladium was collected at U3 and theENP. Periphyton collected from the P-impacted TO2 was agelatinous matrix associated with Chara, the algal speciesassemblage reflective of eutrophication (Gaiser et al. 2011).
Subsamples (20–40 g wet weight) of periphyton were driedat 60�C for dry weights (DW) and ashed for 1 h at 350�C forAFDW. Remaining periphyton (0.5–1 kg) was frozen at )80�Cand lyophilized to dryness in a FreeZone 6 L console freeze drysystem (Labconco, Kansas City, MO, USA). Subsamples (1–10 gDW) were shipped to the University of Florida for nutrientanalysis, Florida Atlantic University for pigment analysis, andWoods Hole Oceanographic Institution for lipid compositiondetermination. Data were expressed as content (mass Æ g)1 DW)or concentration (mass Æ m)2).
Nutrient analysis. Periphyton samples were analyzed fortotal nutrient contents of: carbon (TC), organic carbon (TOC),nitrogen (TN), phosphorus (TP), and sulfur (TS). Totalcarbon and TN were determined using a Carlo-Erba NA 1500CNS analyzer (Haak-Buchler Instruments, Saddlebrook, NJ,USA). TP was determined after the procedure of Anderson(1976) followed by automated colorimetric determination(Method 365.1, U.S. Environmental Protection Agency 1993).Total sulfur was determined using a Costech 4112 elementalanalyzer (Costech Analytical Technologies, Valencia, CA, USA)by combustion at 1,000�C in the presence of reduced copperand vanadium pentoxide catalysts with oxygen and heliumcarrier gases.
Pigment analysis. Periphyton total chl a content was deter-mined using the method of Hagerthey et al. (2006). Briefly,�100 mg of freeze-dried periphyton material was extracted inmethanol ⁄ acetone ⁄ N,N-dimethylformamide ⁄ water (30:30:30:1 byvol.). After centrifugation and filtration of the extract, chl aand its derivatives were separated using two-dimensionalreverse phase HPLC (RP-HPLC) using either: (i) a ThermoSeparation Products (San Jose, CA, USA) Spectra-SystemAS3000 HPLC equipped with a P4000 quaternary pump anda UV1000 detector or (ii) a Thermo Separation Productsmodel 4100 quaternary pump and a Waters 990 dual photo-diode array detector (330–800 nm) (Waters Corp. Milford, MA,USA). Data acquisition employed Windows Peak SimpleTM
(SRI Instruments, Torrance, CA, USA) or Waters-990 software,respectively. Both systems were equipped with a RheodyneModel 7120 injector (Rheodyne, Rohnert Park, CA, USA) with
a 100 lL loop, and a 3.9–150 mm Waters Nova-Pak C18 RPcolumn. Chromatograms were developed using a ternarygradient ([1] 0.5 M ammonium acetate in methanol ⁄ water,85:15; [2] 90% acetonitrile; [3] 90% acetonitrile ⁄ ethyl acetate,30:70) in linear changes. The injectate was prepared using1.0 mL of filtered extract plus 0.125 mL of ion-pairingsolution. Approximately 250 pmol Æ mL)1 of Cu-mesoporphy-rin-IX dimethylester was used as an internal standard fordevelopment of a procedural correction factor (Hagertheyet al. 2006, J. W. Louda pers. comm.). Pigment quantificationwas based on the Beer–Lambert relationship where peaks wereintegrated (mV Æ min)1) and converted to quantities (�pig-ment response factors).
Contribution of different phototroph groups to the total chla content was determined using a linear regression of pigmentsrepresentative of cyanobacteria (zea and echinenone), greenalgae (chl b), diatoms (fucoxanthin), dinoflagellates (peridi-nin), and cryptophytes (alloxanthin) (Hagerthey et al. 2006and references therein), with a modification to the chl bmultiplier from 3.2 to 2.5 (J. W. Louda pers. comm.).
Lipid analysis. Lipids were extracted from dry samplesusing a modified Bligh and Dyer (1959) method, and the intactpolar diacylglycerolipid (IP-DAG) composition of the extractwas analyzed by using HPLC-mass spectrometry (MS) asdescribed by Van Mooy et al. (2009). Briefly, �100 mgsubsamples were placed in 15 mL glass centrifuge tubes. Next,2 mL methanol (MeOH), 1 mL of dichloromethane (DCM),and 0.8 mL of PBS were added to the tubes, with 1.15 lg of therecovery standard 2,4 dinitrophenyl-phosphatidylethanolamine(DNP-PE). Tubes were capped with argon, vortexed rigorouslyfor 1 min, sonicated for 15 min, and allowed to stand overnightat )20�C. Next, 1 mL of DCM and 1 mL of PBS were addedand the tubes centrifuged for 10 min at 500g. The lower(DCM) phase, composed of the total lipid extract (TLE), wasrecovered and transferred to a 2 mL HPLC vial. All glasswarewere combusted at 450�C prior to use.
IP-DAGs in the TLEs were separated using normal phasesolvents and a LiChrospher diol column (4 · 150 mm; 5 lmsize) (Grace, Deerfield, IL, USA), and analyzed on a triplequadrupole mass spectrometer via an electrospray ionizationsource. Specific HPLC and MS conditions are described bySturt et al. (2004) and Popendorf et al. (2011), respectively.External standard curves were constructed as described by VanMooy and Fredricks (2010) using triplicate analyses of 20 lLaliquots of the mixed standards at five concentrations. TheIP-DAGs in the sample TLEs were quantified against thesestandard curves, and then normalized to the recovery of DNP-PE. Phosphatidylglycerol (PG), phosphatidylethanolamine(PE), monogalactosyldiacylglycerol (MGDG), digalactosyldia-cylglycerol (DGDG), and sulfoquinovosyldiacylglycerol(SQDG) were identified and quantified based on theirdiagnostic retention times and ‘‘neutral fragments’’ detectedby MS. Phosphatidylcholine (PC), diacylglyceryl trimethylho-moserine (DGTS), diacylglyceryl hydroxymethyl-trimethyl-b-alanine (DGTA), and diacylglyceryl carboxyhydroxymethylch-oline (DGCC) were identified and quantified based on theirdiagnostic retention time and product ions detected by MS.Reported BL content is based on DGTS only, as DGTA andDGCC were absent or were a small component of the samples.
Statistical analysis. To relate biochemical data to theorganic components of periphyton, periphyton nutrients (TP,TS, and TN), chl a, and lipid contents were normalized toorganic carbon (OC) content. This was especially important forperiphyton from U3 and ENP where inorganic C can representupwards of 50% of the total carbon content (as CaCO3)(Hagerthey et al. 2011). Although phosphorus may be boundinorganically to CaCO3 within periphyton, the relative propor-tion is generally small (<15%) in comparison to organicallybound P (Noe et al. 2003, Scinto and Reddy 2003). Data were
EVERGLADES’ PERIPHYTON LIPIDS 305
Log10(n + 1) transformed to normalize where appropriate, andanalyzed using one-way analysis of variance (ANOVA)(a = 0.05). If significant, Tukey’s HSD was applied to deter-mine pair-wise differences between sites. Linear and nonlinearregression were used to assess the relationships among chl a,lipid, and nutrient contents. Data were analyzed with JMP v. 9(SAS Corp., Cary, NC, USA) and Systat v. 11 (Chicago, IL,USA).
RESULTS
Periphyton biomass. Periphyton was abundant at allsites, but standing stocks differed across the system(Table 2). Biomass was greatest at TO2 (36.5 ± 7.7 gOC Æ m)2) (mean ± SE), whereas WCA-1 had thelowest periphyton biomass (10.1 ± 1.6 g Æ OC m)2)(Table 2). Chl a content at TO2 (7,622.9 ± 745.5 lg Æg)1 OC) was more than double compared to all othersites (P < 0.05) (Table 2). Based on the pigment anal-ysis, cyanobacteria dominated all periphyton types,but abundances relative to green algae and diatomsdiffered among WCA-1 (cyanobacteria 55%, greenalgae 29%, and diatoms 15%), TO2 (cyanobacteria98%, green algae 2%), U3 (cyanobacteria 86%, dia-toms 14%), and ENP (cyanobacteria 95%, greenalgae <1%, and diatoms 4%).
Periphyton nutrient content. Nutrient content andstoichiometric ratios of periphyton reflected both Sand P availability. Corresponding with the highestwater column P concentrations, TP content inperiphyton from TO2 (2.3 ± 0.3 g Æ kg)1 OC) wassignificantly greater than that in other sites(Table 2). TP content in periphyton from WCA-1(1.5 ± 0.1 g Æ kg)1 OC) was significantly greater thanthat of oligotrophic sites U3 and ENP. TS contentof periphyton at U3 (50.4 ± 0.9 g Æ kg)1 OC), thesite with the highest water column sulfate, was sig-nificantly greater than that in other sites (Table 2).Lowest TS content was observed in WCA-1(14.9 ± 0.4 g Æ kg)1 OC) where water column sulfateconcentrations were lowest. Periphyton TS content
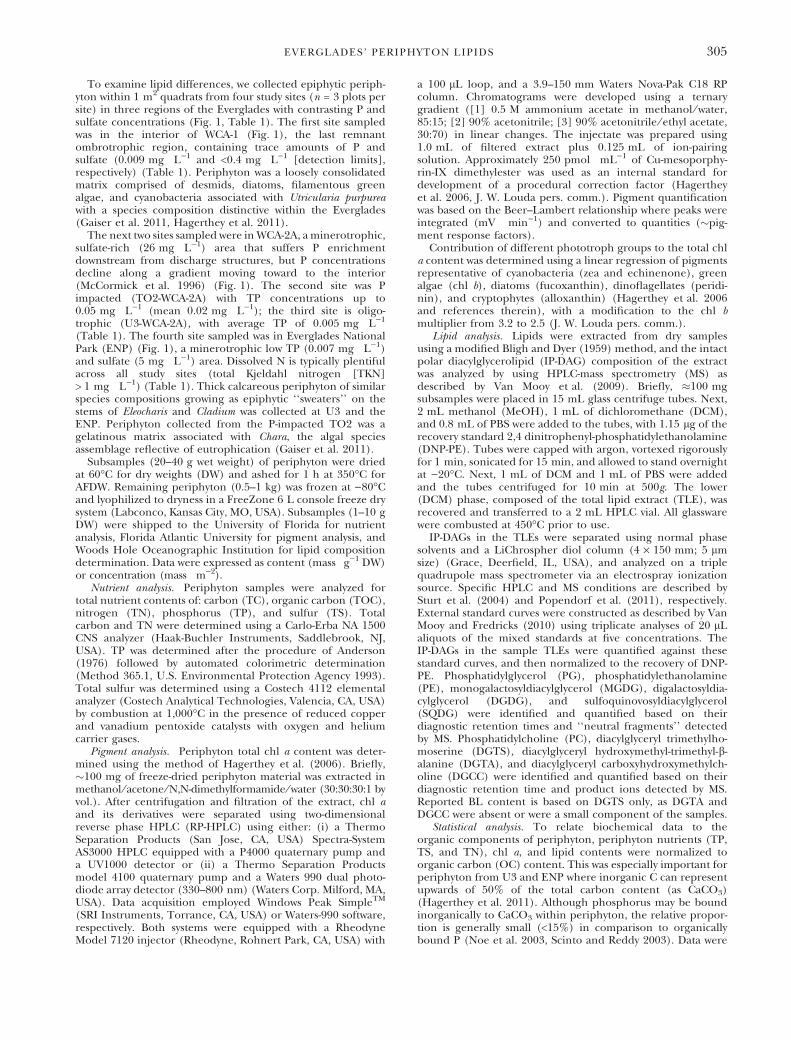
declined exponentially relative to TP content(r2 = 0.25) (Fig. 2A).
The molar ratio of OC:P of all periphyton rangedfrom 1,100:1 to 4,500:1, while OC:N ratios weremore constrained (7–12:1) (Table 2). The OC:Sratio was significantly lower in periphyton from U3(53:1), followed by the ENP and TO2 (109:1), whileWCA-1 (180:1) had a significantly higher ratio(Table 2). The S:P ratios were significantly lower forperiphyton in WCA-1 and at TO2; U3 (83:1) hadthe largest ratio among periphyton.
Membrane lipid composition. Among periphytonanalyzed, total detected IP-DAGs did not signifi-cantly differ, but the distribution of lipid classesbetween sites significantly varied (Table 3). Totalphospholipid contents were significantly greater atnutrient-impacted TO2 (3.2 ± 1.3 lmols Æ g)1 OC)relative to U3 and WCA-1 (Table 3). Total PL con-tents were similar between periphyton at the threeother oligotrophic sites (P > 0.05). PLs were anoverall small component of the membrane lipidsmeasured, representing between 1 and 4 mol% ofthe total detected lipids. At all sites, PC was themost abundant PL, followed by PG and PE(Table 3). Total PL content increased with periphy-ton TP content (r2 = 0.46, P < 0.05) (Fig. 2B).
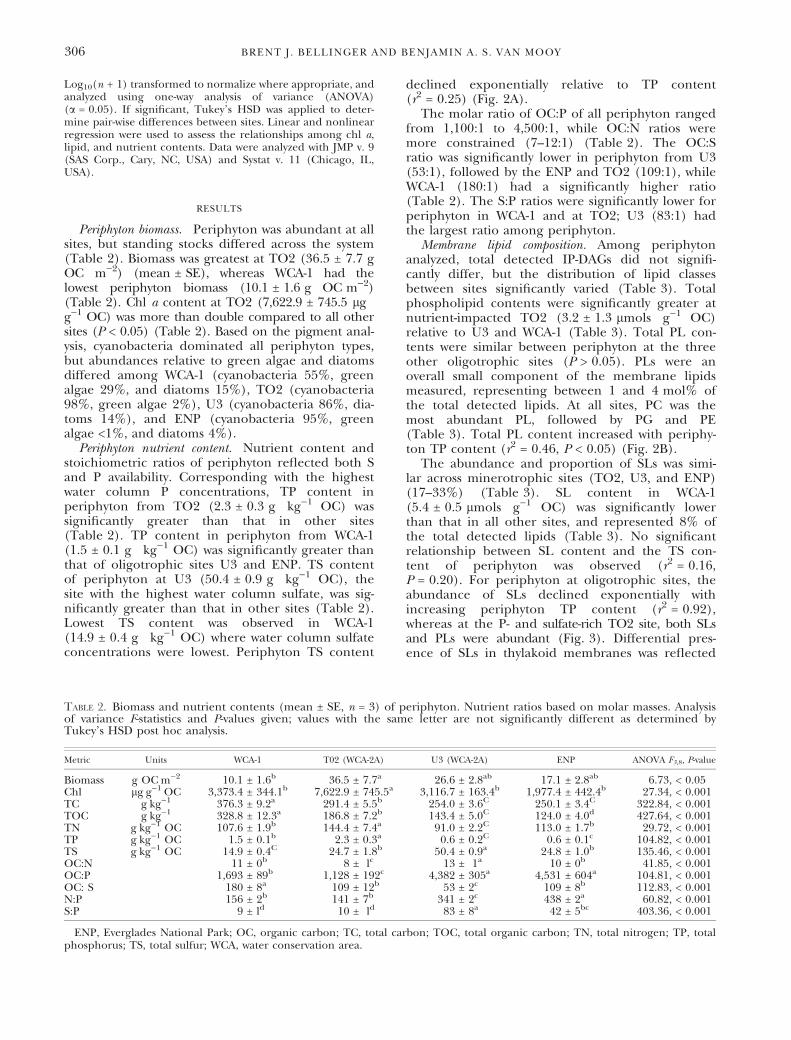
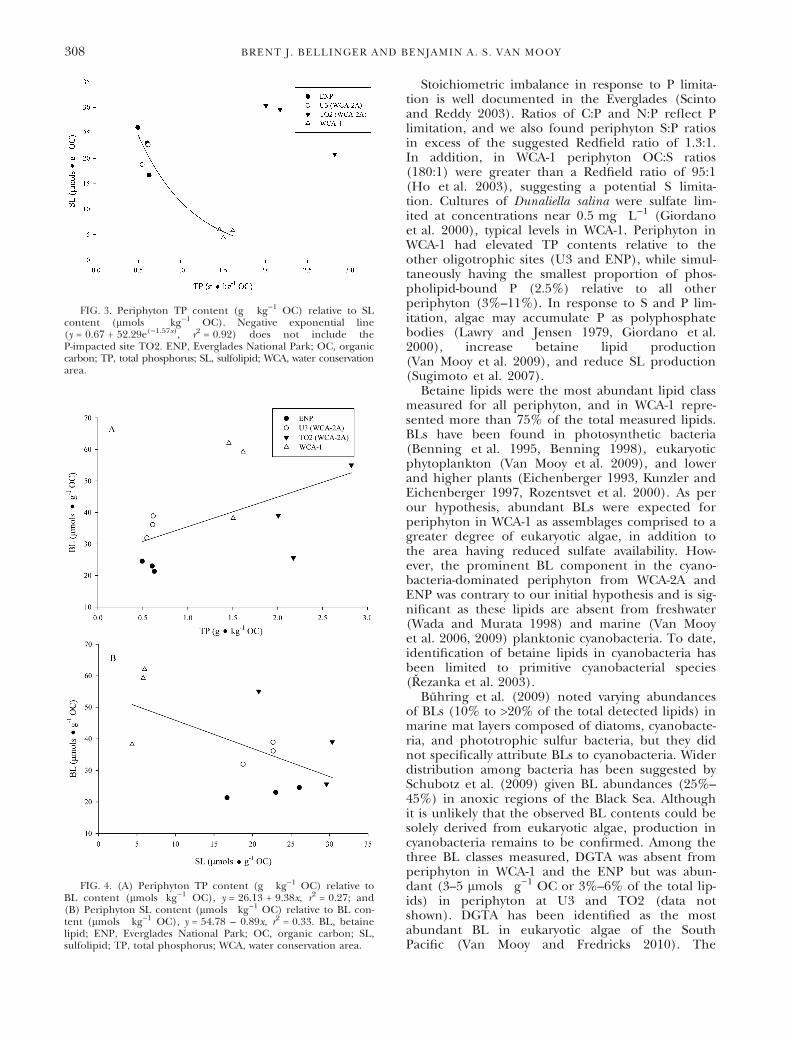
The abundance and proportion of SLs was simi-lar across minerotrophic sites (TO2, U3, and ENP)(17–33%) (Table 3). SL content in WCA-1(5.4 ± 0.5 lmols Æ g)1 OC) was significantly lowerthan that in all other sites, and represented 8% ofthe total detected lipids (Table 3). No significantrelationship between SL content and the TS con-tent of periphyton was observed (r2 = 0.16,P = 0.20). For periphyton at oligotrophic sites, theabundance of SLs declined exponentially withincreasing periphyton TP content (r2 = 0.92),whereas at the P- and sulfate-rich TO2 site, both SLsand PLs were abundant (Fig. 3). Differential pres-ence of SLs in thylakoid membranes was reflected
Table 2. Biomass and nutrient contents (mean ± SE, n = 3) of periphyton. Nutrient ratios based on molar masses. Analysisof variance F-statistics and P-values given; values with the same letter are not significantly different as determined byTukey’s HSD post hoc analysis.
Metric Units WCA-1 T02 (WCA-2A) U3 (WCA-2A) ENP ANOVA F3,8, P-value
Biomass g OCÆm)2 10.1 ± 1.6b 36.5 ± 7.7a 26.6 ± 2.8ab 17.1 ± 2.8ab 6.73, < 0.05Chl lgÆg)1ÆOC 3,373.4 ± 344.1b 7,622.9 ± 745.5a 3,116.7 ± 163.4b 1,977.4 ± 442.4b 27.34, < 0.001TC gÆkg)1 376.3 ± 9.2a 291.4 ± 5.5b 254.0 ± 3.6C 250.1 ± 3.4C 322.84, < 0.001TOC gÆkg)1 328.8 ± 12.3a 186.8 ± 7.2b 143.4 ± 5.0C 124.0 ± 4.0d 427.64, < 0.001TN gÆkg)1 OC 107.6 ± 1.9b 144.4 ± 7.4a 91.0 ± 2.2C 113.0 ± 1.7b 29.72, < 0.001TP gÆkg)1 OC 1.5 ± 0.1b 2.3 ± 0.3a 0.6 ± 0.2C 0.6 ± 0.1c 104.82, < 0.001TS gÆkg)1 OC 14.9 ± 0.4C 24.7 ± 1.8b 50.4 ± 0.9a 24.8 ± 1.0b 135.46, < 0.001OC:N 11 ± 0b 8 ± lc 13 ± 1a 10 ± 0b 41.85, < 0.001OC:P 1,693 ± 89b 1,128 ± 192c 4,382 ± 305a 4,531 ± 604a 104.81, < 0.001OC: S 180 ± 8a 109 ± 12b 53 ± 2c 109 ± 8b 112.83, < 0.001N:P 156 ± 2b 141 ± 7b 341 ± 2c 438 ± 2a 60.82, < 0.001S:P 9 ± ld 10 ± ld 83 ± 8a 42 ± 5bc 403.36, < 0.001
ENP, Everglades National Park; OC, organic carbon; TC, total carbon; TOC, total organic carbon; TN, total nitrogen; TP, totalphosphorus; TS, total sulfur; WCA, water conservation area.
306 BRENT J. BELLINGER AND BENJAMIN A. S. VAN MOOY
in the SL:chl a ratios. The lowest ratio of SL:chl a(16 · 10)4 ± 2 · 10)4) was observed in WCA-1(Table 3), the site with lowest water column sulfate.
The SL:chl a ratio was significantly greater forepiphyton at ENP (128 · 10)4 ± 41 · 10)4)(Table 3). Neither SL (r2 = 0.19, P = 0.16) nor PL(r2 = 0.28, P = 0.08) content was significantlyrelated to chl a content.
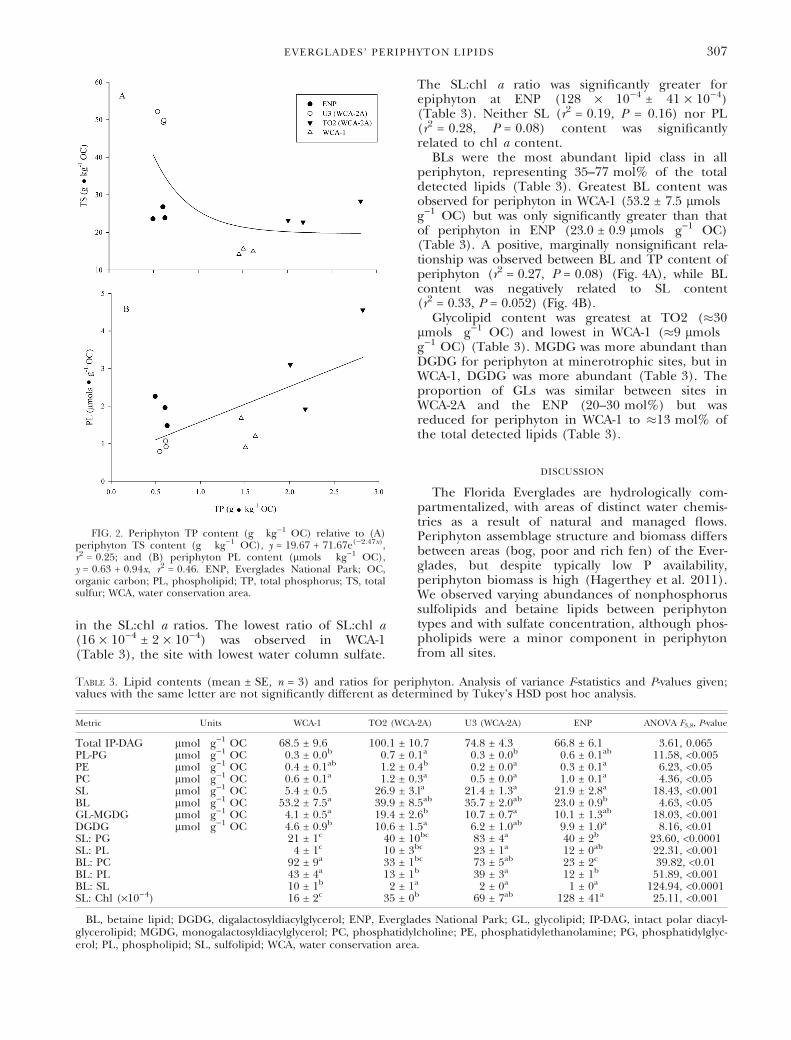
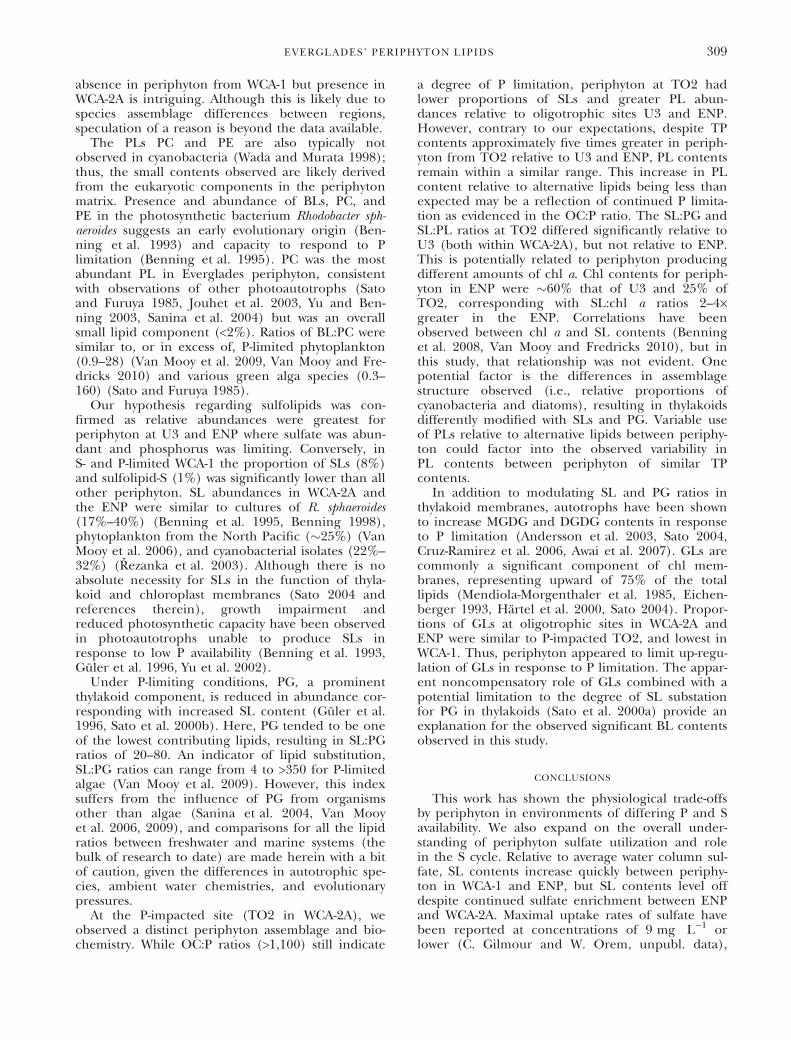
BLs were the most abundant lipid class in allperiphyton, representing 35–77 mol% of the totaldetected lipids (Table 3). Greatest BL content wasobserved for periphyton in WCA-1 (53.2 ± 7.5 lmols Æg)1 OC) but was only significantly greater than thatof periphyton in ENP (23.0 ± 0.9 lmols Æ g)1 OC)(Table 3). A positive, marginally nonsignificant rela-tionship was observed between BL and TP content ofperiphyton (r2 = 0.27, P = 0.08) (Fig. 4A), while BLcontent was negatively related to SL content(r2 = 0.33, P = 0.052) (Fig. 4B).
Glycolipid content was greatest at TO2 (�30lmols Æ g)1 OC) and lowest in WCA-1 (�9 lmols Æg)1 OC) (Table 3). MGDG was more abundant thanDGDG for periphyton at minerotrophic sites, but inWCA-1, DGDG was more abundant (Table 3). Theproportion of GLs was similar between sites inWCA-2A and the ENP (20–30 mol%) but wasreduced for periphyton in WCA-1 to �13 mol% ofthe total detected lipids (Table 3).
DISCUSSION
The Florida Everglades are hydrologically com-partmentalized, with areas of distinct water chemis-tries as a result of natural and managed flows.Periphyton assemblage structure and biomass differsbetween areas (bog, poor and rich fen) of the Ever-glades, but despite typically low P availability,periphyton biomass is high (Hagerthey et al. 2011).We observed varying abundances of nonphosphorussulfolipids and betaine lipids between periphytontypes and with sulfate concentration, although phos-pholipids were a minor component in periphytonfrom all sites.
FIG. 2. Periphyton TP content (g Æ kg)1 OC) relative to (A)periphyton TS content (g Æ kg)1 OC), y = 19.67 + 71.67e()2.47x),r2 = 0.25; and (B) periphyton PL content (lmols Æ kg)1 OC),y = 0.63 + 0.94x, r2 = 0.46. ENP, Everglades National Park; OC,organic carbon; PL, phospholipid; TP, total phosphorus; TS, totalsulfur; WCA, water conservation area.
Table 3. Lipid contents (mean ± SE, n = 3) and ratios for periphyton. Analysis of variance F-statistics and P-values given;values with the same letter are not significantly different as determined by Tukey’s HSD post hoc analysis.
Metric Units WCA-1 TO2 (WCA-2A) U3 (WCA-2A) ENP ANOVA F3,8, P-value
Total IP-DAG lmol Æ g)1 OC 68.5 ± 9.6 100.1 ± 10.7 74.8 ± 4.3 66.8 ± 6.1 3.61, 0.065PL-PG lmol Æ g)1 OC 0.3 ± 0.0b 0.7 ± 0.1a 0.3 ± 0.0b 0.6 ± 0.1ab 11.58, <0.005PE lmol Æ g)1 OC 0.4 ± 0.1ab 1.2 ± 0.4b 0.2 ± 0.0a 0.3 ± 0.1a 6.23, <0.05PC lmol Æ g)1 OC 0.6 ± 0.1a 1.2 ± 0.3a 0.5 ± 0.0a 1.0 ± 0.1a 4.36, <0.05SL lmol Æ g)1 OC 5.4 ± 0.5 26.9 ± 3.la 21.4 ± 1.3a 21.9 ± 2.8a 18.43, <0.001BL lmol Æ g)1 OC 53.2 ± 7.5a 39.9 ± 8.5ab 35.7 ± 2.0ab 23.0 ± 0.9b 4.63, <0.05GL-MGDG lmol Æ g)1 OC 4.1 ± 0.5a 19.4 ± 2.6b 10.7 ± 0.7a 10.1 ± 1.3ab 18.03, <0.001DGDG lmol Æ g)1 OC 4.6 ± 0.9b 10.6 ± 1.5a 6.2 ± 1.0ab 9.9 ± 1.0a 8.16, <0.01SL: PG 21 ± 1c 40 ± 10bc 83 ± 4a 40 ± 2b 23.60, <0.0001SL: PL 4 ± 1c 10 ± 3bc 23 ± 1a 12 ± 0ab 22.31, <0.001BL: PC 92 ± 9a 33 ± 1bc 73 ± 5ab 23 ± 2c 39.82, <0.01BL: PL 43 ± 4a 13 ± 1b 39 ± 3a 12 ± 1b 51.89, <0.001BL: SL 10 ± 1b 2 ± 1a 2 ± 0a 1 ± 0a 124.94, <0.0001SL: Chl (·10)4) 16 ± 2c 35 ± 0b 69 ± 7ab 128 ± 41a 25.11, <0.001
BL, betaine lipid; DGDG, digalactosyldiacylglycerol; ENP, Everglades National Park; GL, glycolipid; IP-DAG, intact polar diacyl-glycerolipid; MGDG, monogalactosyldiacylglycerol; PC, phosphatidylcholine; PE, phosphatidylethanolamine; PG, phosphatidylglyc-erol; PL, phospholipid; SL, sulfolipid; WCA, water conservation area.
EVERGLADES’ PERIPHYTON LIPIDS 307
Stoichiometric imbalance in response to P limita-tion is well documented in the Everglades (Scintoand Reddy 2003). Ratios of C:P and N:P reflect Plimitation, and we also found periphyton S:P ratiosin excess of the suggested Redfield ratio of 1.3:1.In addition, in WCA-1 periphyton OC:S ratios(180:1) were greater than a Redfield ratio of 95:1(Ho et al. 2003), suggesting a potential S limita-tion. Cultures of Dunaliella salina were sulfate lim-ited at concentrations near 0.5 mg Æ L)1 (Giordanoet al. 2000), typical levels in WCA-1. Periphyton inWCA-1 had elevated TP contents relative to theother oligotrophic sites (U3 and ENP), while simul-taneously having the smallest proportion of phos-pholipid-bound P (2.5%) relative to all otherperiphyton (3%–11%). In response to S and P lim-itation, algae may accumulate P as polyphosphatebodies (Lawry and Jensen 1979, Giordano et al.2000), increase betaine lipid production(Van Mooy et al. 2009), and reduce SL production(Sugimoto et al. 2007).
Betaine lipids were the most abundant lipid classmeasured for all periphyton, and in WCA-1 repre-sented more than 75% of the total measured lipids.BLs have been found in photosynthetic bacteria(Benning et al. 1995, Benning 1998), eukaryoticphytoplankton (Van Mooy et al. 2009), and lowerand higher plants (Eichenberger 1993, Kunzler andEichenberger 1997, Rozentsvet et al. 2000). As perour hypothesis, abundant BLs were expected forperiphyton in WCA-1 as assemblages comprised to agreater degree of eukaryotic algae, in addition tothe area having reduced sulfate availability. How-ever, the prominent BL component in the cyano-bacteria-dominated periphyton from WCA-2A andENP was contrary to our initial hypothesis and is sig-nificant as these lipids are absent from freshwater(Wada and Murata 1998) and marine (Van Mooyet al. 2006, 2009) planktonic cyanobacteria. To date,identification of betaine lipids in cyanobacteria hasbeen limited to primitive cyanobacterial species(Rezanka et al. 2003).
Buhring et al. (2009) noted varying abundancesof BLs (10% to >20% of the total detected lipids) inmarine mat layers composed of diatoms, cyanobacte-ria, and phototrophic sulfur bacteria, but they didnot specifically attribute BLs to cyanobacteria. Widerdistribution among bacteria has been suggested bySchubotz et al. (2009) given BL abundances (25%–45%) in anoxic regions of the Black Sea. Althoughit is unlikely that the observed BL contents could besolely derived from eukaryotic algae, production incyanobacteria remains to be confirmed. Among thethree BL classes measured, DGTA was absent fromperiphyton in WCA-1 and the ENP but was abun-dant (3–5 lmols Æ g)1 OC or 3%–6% of the total lip-ids) in periphyton at U3 and TO2 (data notshown). DGTA has been identified as the mostabundant BL in eukaryotic algae of the SouthPacific (Van Mooy and Fredricks 2010). The
FIG. 3. Periphyton TP content (g Æ kg)1 OC) relative to SLcontent (lmols Æ kg)1 OC). Negative exponential line(y = 0.67 + 52.29e()1.57x), r2 = 0.92) does not include theP-impacted site TO2. ENP, Everglades National Park; OC, organiccarbon; TP, total phosphorus; SL, sulfolipid; WCA, water conservationarea.
FIG. 4. (A) Periphyton TP content (g Æ kg)1 OC) relative toBL content (lmols Ækg)1 OC), y = 26.13 + 9.38x, r2 = 0.27; and(B) Periphyton SL content (lmols Æ kg)1 OC) relative to BL con-tent (lmols Æ kg)1 OC), y = 54.78 – 0.89x, r2 = 0.33. BL, betainelipid; ENP, Everglades National Park; OC, organic carbon; SL,sulfolipid; TP, total phosphorus; WCA, water conservation area.
308 BRENT J. BELLINGER AND BENJAMIN A. S. VAN MOOY
absence in periphyton from WCA-1 but presence inWCA-2A is intriguing. Although this is likely due tospecies assemblage differences between regions,speculation of a reason is beyond the data available.
The PLs PC and PE are also typically notobserved in cyanobacteria (Wada and Murata 1998);thus, the small contents observed are likely derivedfrom the eukaryotic components in the periphytonmatrix. Presence and abundance of BLs, PC, andPE in the photosynthetic bacterium Rhodobacter sph-aeroides suggests an early evolutionary origin (Ben-ning et al. 1993) and capacity to respond to Plimitation (Benning et al. 1995). PC was the mostabundant PL in Everglades periphyton, consistentwith observations of other photoautotrophs (Satoand Furuya 1985, Jouhet et al. 2003, Yu and Ben-ning 2003, Sanina et al. 2004) but was an overallsmall lipid component (<2%). Ratios of BL:PC weresimilar to, or in excess of, P-limited phytoplankton(0.9–28) (Van Mooy et al. 2009, Van Mooy and Fre-dricks 2010) and various green alga species (0.3–160) (Sato and Furuya 1985).
Our hypothesis regarding sulfolipids was con-firmed as relative abundances were greatest forperiphyton at U3 and ENP where sulfate was abun-dant and phosphorus was limiting. Conversely, inS- and P-limited WCA-1 the proportion of SLs (8%)and sulfolipid-S (1%) was significantly lower than allother periphyton. SL abundances in WCA-2A andthe ENP were similar to cultures of R. sphaeroides(17%–40%) (Benning et al. 1995, Benning 1998),phytoplankton from the North Pacific (�25%) (VanMooy et al. 2006), and cyanobacterial isolates (22%–32%) (Rezanka et al. 2003). Although there is noabsolute necessity for SLs in the function of thyla-koid and chloroplast membranes (Sato 2004 andreferences therein), growth impairment andreduced photosynthetic capacity have been observedin photoautotrophs unable to produce SLs inresponse to low P availability (Benning et al. 1993,Guler et al. 1996, Yu et al. 2002).
Under P-limiting conditions, PG, a prominentthylakoid component, is reduced in abundance cor-responding with increased SL content (Guler et al.1996, Sato et al. 2000b). Here, PG tended to be oneof the lowest contributing lipids, resulting in SL:PGratios of 20–80. An indicator of lipid substitution,SL:PG ratios can range from 4 to >350 for P-limitedalgae (Van Mooy et al. 2009). However, this indexsuffers from the influence of PG from organismsother than algae (Sanina et al. 2004, Van Mooyet al. 2006, 2009), and comparisons for all the lipidratios between freshwater and marine systems (thebulk of research to date) are made herein with a bitof caution, given the differences in autotrophic spe-cies, ambient water chemistries, and evolutionarypressures.
At the P-impacted site (TO2 in WCA-2A), weobserved a distinct periphyton assemblage and bio-chemistry. While OC:P ratios (>1,100) still indicate
a degree of P limitation, periphyton at TO2 hadlower proportions of SLs and greater PL abun-dances relative to oligotrophic sites U3 and ENP.However, contrary to our expectations, despite TPcontents approximately five times greater in periph-yton from TO2 relative to U3 and ENP, PL contentsremain within a similar range. This increase in PLcontent relative to alternative lipids being less thanexpected may be a reflection of continued P limita-tion as evidenced in the OC:P ratio. The SL:PG andSL:PL ratios at TO2 differed significantly relative toU3 (both within WCA-2A), but not relative to ENP.This is potentially related to periphyton producingdifferent amounts of chl a. Chl contents for periph-yton in ENP were �60% that of U3 and 25% ofTO2, corresponding with SL:chl a ratios 2–4·greater in the ENP. Correlations have beenobserved between chl a and SL contents (Benninget al. 2008, Van Mooy and Fredricks 2010), but inthis study, that relationship was not evident. Onepotential factor is the differences in assemblagestructure observed (i.e., relative proportions ofcyanobacteria and diatoms), resulting in thylakoidsdifferently modified with SLs and PG. Variable useof PLs relative to alternative lipids between periphy-ton could factor into the observed variability inPL contents between periphyton of similar TPcontents.
In addition to modulating SL and PG ratios inthylakoid membranes, autotrophs have been shownto increase MGDG and DGDG contents in responseto P limitation (Andersson et al. 2003, Sato 2004,Cruz-Ramirez et al. 2006, Awai et al. 2007). GLs arecommonly a significant component of chl mem-branes, representing upward of 75% of the totallipids (Mendiola-Morgenthaler et al. 1985, Eichen-berger 1993, Hartel et al. 2000, Sato 2004). Propor-tions of GLs at oligotrophic sites in WCA-2A andENP were similar to P-impacted TO2, and lowest inWCA-1. Thus, periphyton appeared to limit up-regu-lation of GLs in response to P limitation. The appar-ent noncompensatory role of GLs combined with apotential limitation to the degree of SL substationfor PG in thylakoids (Sato et al. 2000a) provide anexplanation for the observed significant BL contentsobserved in this study.
CONCLUSIONS
This work has shown the physiological trade-offsby periphyton in environments of differing P and Savailability. We also expand on the overall under-standing of periphyton sulfate utilization and rolein the S cycle. Relative to average water column sul-fate, SL contents increase quickly between periphy-ton in WCA-1 and ENP, but SL contents level offdespite continued sulfate enrichment between ENPand WCA-2A. Maximal uptake rates of sulfate havebeen reported at concentrations of 9 mg Æ L)1 orlower (C. Gilmour and W. Orem, unpubl. data),
EVERGLADES’ PERIPHYTON LIPIDS 309
levels experienced in ENP and exceeded in WCA-2A. Cultures of Chlamydomonas reinhardtii were con-sidered S-replete in medium containing>40 mg Æ L)1 sulfate (Sato et al. 2000b). In the inte-rior of WCA-1, average sulfate concentrationsremain well below 9 mg Æ L)1 as inputs are primarilythrough rainfall, thus likely contributing to thereduced SL and TS contents (Giordano et al. 2000,Sugimoto et al. 2007). Due to potential limitationsin compensatory SL production, we found betainelipids to be abundant and widespread in periphytonacross the Everglades. Expanding research in mar-ine systems is finding significant BL abundanceswithin complex and diverse algal and microbialcommunities where P is limiting (e.g., Buhring et al.2009, Van Mooy et al. 2009). The inverse relation-ship between two nonphosphorus lipids indicatesdifferential utilization as an adaptive strategy, butadditional research into their distribution androle(s) in freshwater autotrophs is needed.
The authors would like to thank Dr. Scot Hagerthey for hisinsightful discussions about the experimental design, implica-tions of the findings, and technical aspects of this project. Wethank the labs of Dr. Todd Osborne (University of Florida) andDr. J. William Louda (Florida Atlantic University) for sampleanalyses. We also thank Mr. Justin Ossolinksi and Dr. HelenFredricks for assistance with lipid analyses, and Mr. JamesBeerens for providing the site map. B. A. S. V. M. wasadditionally supported by the NSF (OCE-1031143).
Anderson, J. M. 1976. An ignition method for determination oftotal phosphorus in lake sediments. Water Res. 10:329–31.
Andersson, M. X., Stridh, M. H., Larsson, K. E., Liljenberg, C. &Sandelius, A. S. 2003. Phosphate-deficient oat replaces amajor portion of the plasma membrane phospholipids withthe galactolipid digalactosyldiacylglycerol. FEBS Lett. 537:128–32.
Awai, K., Watanabe, H., Benning, C. & Nishida, I. 2007. Digalac-tosyldiacylglycerol is required for better photosynthetic growthof Synechocystis sp. PCC6803 under phosphate limitation. PlantCell Physiol. 48:1517–23.
Benning, C. 1998. Biosynthesis and function of the sulfolipid sul-foquinovosyldiacylglycerol. Annu. Rev. Plant Physiol. Plant Mol.Biol. 49:53–75.
Benning, C., Beatty, J. T., Prince, R. C. & Somerville, C. R. 1993.The sulfolipid sulfoquinovosyldiacylglycerol is not required forphotosynthetic electron transport in Rhodobacter sphaeroides butenhances growth under phosphate limitation. Proc. Natl. Acad.Sci. U. S. A. 90:1561–5.
Benning, C., Garavito, R. M. & Shimojia, M. 2008. Sulfolipid bio-synthesis and function in plants. In Hell, R., Dahl, C., Knaff, D.B. & Leustek, T. [Eds] Sulfur Metabolism in Phototrophic Organ-isms. Springer, Dordrecht, the Netherlands, pp. 185–200.
Benning, C., Huang, Z.-H. & Gage, D. A. 1995. Accumulation of anovel glycolipid and a betaine lipid in cells of Rhodobactersphaeroides grown under phosphate limitation. Arch. Biochem.Biophys. 317:103–11.
Benson, A. A., Daniel, H. & Wiser, R. 1959. A sulfolipid in plants.Proc. Natl. Acad. Sci. U. S. A. 45:1582–7.
Bligh, E. G. & Dyer, W. J. 1959. A rapid method of total lipidextraction and purification. Can. J. Biochem. Physiol. 37:911–7.
Buhring, S. I., Smittenberg, R. H., Sachse, D., Lipp, J. S., Golubic,S., Sachs, J. P., Hinrichs, K.-U. & Summons, R. E. 2009.A hypersaline microbial mat from the Pacific Atoll Kiritimati:insights into composition and carbon fixation using biomarkeranalyses and a 13C-labeling approach. Geobiology 7:308–23.
Cruz-Ramirez, A., Oropeza-Aburto, A., Razo-Hernandez, F.,Ramirez-Chavez, E. & Herrera-Estrella, L. 2006. PhospholipaseDZ2 plays an important role in extraplastidic galactolipidbiosynthesis and phosphate recycling in Arabidopsis roots. Proc.Natl. Acad. Sci. U. S. A. 103:6765–70.
Dahl, C., Hell, R., Knaff, D. & Leustek, Th. 2008. Introduction tosulfur metabolism in phototrophic organisms. In Hell, R.,Dahl, C., Knaff, D. B. & Leustek, T. [Eds] Sulfur Metabolism inPhototrophic Organisms. Springer, Dordrecht, the Netherlands,pp. 1–14.
Eichenberger, W. 1993. Betaine lipids in lower plants. Distributionsof DGTS, DGTA and phospholipids, and the intracellularlocalization and site of biosynthesis of DGTS. Plant Physiol.Biochem. 31:213–21.
Ertefai, T. F., Fisher, M. C., Fredricks, H. F., Lipp, J. S., Pearson, A.,Birgel, D., Udert, K. M., Cavanaugh, C. M., Gschwend, P. M. &Hinrichs, K.-U. 2008. Vertical distribution of microbial lipidsand functional genes in chemically distinct layers of a highlypolluted meromictic lake. Org. Geochem. 39:1572–88.
Essigmann, B., Guler, S., Narang, R. A., Linke, D. & Benning, C.1998. Phosphate availability affects the thylakoid lipid com-position and the expression of SQD1, a gene required forsulfolipid biosynthesis in Arabidopsis thaliana. Proc. Natl. Acad.Sci. U. S. A. 95:1950–5.
Frentzen, M. 2004. Phosphatidylglycerol and sulfoquinovosyldia-cylglycerol: anionic membrane lipids and phosphate regula-tion. Curr. Opin. Plant Biol. 7:270–6.
Gaiser, E. E., McCormick, P. V., Hagerthey, S. E. & Gottlieb, A. D.2011. Landscape patterns of periphyton in the Florida Ever-glades. Crit. Rev. Environ. Sci. Technol. 41(Suppl. 1):92–120.
Giordano, M., Pezzoni, V. & Hell, R. 2000. Strategies for the allo-cation of resources under sulfur limitation in the green algaDunaliella salina. Plant Physiol. 124:857–64.
Grimshaw, H. J., Wetzel, R. G., Brandenbrug, M., Segerblom, K.,Wenkert, L. J., Marsh, G. A., Charnetzky, W., Haky, J. E. &Carraher, C. 1997. Shading of periphyton communities bywetland emergent macrophytes: decoupling of algal photo-synthesis from microbial nutrient retention. Arch. Hydrobiol.139:17–27.
Guler, S., Seeliger, A., Hartel, H., Renger, G. & Benning, C. 1996.A null mutant of Synechococcus sp. PCC7942 deficient in thesulfolipid sulfoquinovosyl diacylglycerol. J. Biol. Chem. 271:7501–7.
Hagerthey, S. E., Bellinger, B. J., Wheeler, K., Gantar, M. & Gaiser,E. 2011. Everglades periphyton: a biogeochemical perspective.Crit. Rev. Environ. Sci. Technol. 41(Suppl. 1):309–43.
Hagerthey, S. E., Louda, J. W. & Mongkronsri, P. 2006. Evaluationof pigment extraction methods and a recommended protocolfor periphyton chlorophyll a determination and chemotaxo-nomic assessment. J. Phycol. 42:1125–6.
Hartel, H. & Benning, C. 2000. Complex lipid biosynthesis: glyco-sylglycerides. Biochem. Soc. Trans. 28:729–32.
Hartel, H., Dormann, P. & Benning, C. 2000. DGD1-independentbiosynthesis of extraplastidic galactolipids after phosphatedeprivation in Arabidopsis. Proc. Natl. Acad. Sci. U. S. A. 97:10649–54.
Hill, W. R. & Fanta, S. E. 2008. Phosphorus and light colimitperiphyton growth at subsaturating irradiances. Freshw. Biol.53:215–25.
Ho, T.-Y., Quigg, A., Finkel, Z. V., Milligan, A. J., Wyman, K.,Falkowski, P. G. & Morel, F. M. M. 2003. The elemental com-position of some marine phytoplankton. J. Phycol. 39:1145–59.
Jouhet, J., Marechal, E., Bligny, R., Joyard, J. & Block, M. A. 2003.Transient increase of phosphatidylcholine in plant cells inresponse to phosphate deprivation. FEBS Lett. 544:63–8.
Kunzler, K. & Eichenberger, W. 1997. Betaine lipids and zwitter-ionic phospholipids in plants and fungi. Phytochemistry 46:883–92.
Lawry, N. H. & Jensen, T. E. 1979. Deposition of condensedphosphate as an effect of varying sulfur deficiency in the cya-nobacterium Synechococcus sp. (Anacystis nidulans). Arch.Microbiol. 120:1–7.
310 BRENT J. BELLINGER AND BENJAMIN A. S. VAN MOOY
McCormick, P. V., Rawlik, P. S., Lurding, K., Smith, E. P. & Sklar, F.H. 1996. Periphyton-water quality relationships along a nutri-ent gradient in the northern Florida Everglades. J. North Am.Benthol. Soc. 15:433–49.
Mendiola-Morgenthaler, L., Eichenberger, W. & Boshetti, A. 1985.Isolation of chloroplast envelopes from Chlamydomonas. Lipidand polypeptide composition. Plant Sci. 41:97–104.
Newman, S. & Hagerthey, S. E. 2011. Water conservation area 1: acase study of hydrology, nutrient, and mineral influences onbiogeochemical processes. Crit. Rev. Environ. Sci. Technol.41(Suppl. 1):702–22.
Newman, S., McCormick, P. V. & Backus, J. G. 2003. Phosphataseactivity as an early indicator of wetland eutrophication: prob-lems and prospects. J. Appl. Phycol. 15:45–59.
Noe, G. B., Scinto, L. J., Taylor, J., Childer, D. L. & Jones, R. D.2003. Phosphorus cycling and partitioning in an oligotrophicEverglades wetland ecosystem: a radioisotope tracing study.Freshw. Biol. 48:1993–2008.
Popendorf, K. J., Lomas, M. W. & Van Mooy, B. A. S. 2011.Microbial sources of intact polar diacylglycerolipids in theWestern North Atlantic Ocean. Org. Geochem. 42:803–11.
Rezanka, T., Viden, I., Go, J. V., Dor, I. & Dembitsky, V. M. 2003.Polar lipids and fatty acids of three wild cyanobacterial strainsof the genus Chroococcidiopsis. Folia Microbiol. 48:781–6.
Rozentsvet, O. A., Dembitsky, V. M. & Saksonov, S. V. 2000.Occurrence of diacylglyceryltrimethylhomoserines and majorphospholipids in some plants. Phytochemistry 54:401–7.
Sanina, N. M., Goncharova, S. N. & Kostetsky, E. Y. 2004. Fatty acidcomposition of individual polar lipid classes from marinemacrophytes. Phytochemistry 65:721–30.
Sato, N. 2004. Roles of the acidic lipids sulfoquinovosyl diacylglyc-erol and phosphatidylglycerol in photosynthesis: their speci-ficity and evolution. J. Plant. Res. 117:495–505.
Sato, N. & Furuya, M. 1985. Distribution of diacylglyceryltrimeth-ylhomoserine and phosphatidylcholine in non-vascular greenplants. Plant Sci. 38:81–5.
Sato, N., Hagio, M., Wada, H. & Tsuzuki, M. 2000b. Environmentaleffects on acidic lipids of thylakoid membranes. Biochem. Soc.Trans. 28:912–4.
Sato, N., Hagio, M., Wade, H. & Tsuzuki, M. 2000a. Requirement ofphosphatidylglycerol for photosynthetic function in thylakoidmembranes. Proc. Natl. Acad. Sci. U. S. A. 97:10655–60.
Sato, N., Sonoike, K., Tsuzuki, M. & Kawaguchi, A. 1995. Impairedphotosystem II in a mutant of Chlamydomonas reinhardtiidefective in sulfoquinovosyl diacylglycerol. Eur. J. Biochem.234:16–23.
Schubotz, F., Wakeham, S. G., Lipp, J. S., Fredricks, H. F. & Hin-richs, K.-U. 2009. Detection of microbial biomass by intact
polar membrane lipid analysis in the water column and sur-face sediments of the Black Sea. Environ. Microbiol. 11:2720–34.
Scinto, L. J. & Reddy, K. R. 2003. Biotic and abiotic uptake ofphosphorus by periphyton in a subtropical freshwater wetland.Aquat. Biol. 77:203–22.
Sklar, F., Dreschel, T. & Warren, K. [Eds.] 2009. Ecology of theEverglades Protection Area, 2009. South Florida EnvironmentalReport Volume I, chapter 6. South Florida Water ManagementDistrict, West Palm Beach, Florida.
Sterner, R. W. & Elser, J. J. 2002. Ecological Stoichiometry: The Biology ofElements from Molecules to the Biosphere. Princeton UniversityPress, Princeton, New Jersey, 439 pp.
Sturt, H. F., Summons, R. E., Smith, K., Elvert, M. & Hinrichs, K. U.2004. Intact polar membrane lipids in prokaryotes and sedi-ments deciphered by high-performance liquid chromatogra-phy ⁄ electrospray ionization multistage mass spectrometry –new biomarkers for biogeochemistry and microbial ecology.Rapid Commun. Mass Spectrom. 18:617–28.
Sugimoto, K., Sato, N. & Tsuzuki, M. 2007. Utilization of a chlo-roplast membrane sulfolipid as a major internal sulfur sourcefor protein synthesis in the early phase of sulfur starvation inChlamydomonas reinhardtii. FEBS Lett. 581:4519–22.
U.S. Environmental Protection Agency. 1993. Methods for theDetermination of Inorganic Substances in Environmental Samples.Environmental Monitoring Systems Lab, Cincinnati, Ohio,172 pp.
Van Mooy, B. A. S. & Fredricks, H. F. 2010. Bacterial and eukaryoticintact polar lipids in the eastern subtopical South Pacific:water-column distribution, planktonic sources, and fatty acidcomposition. Geochim. Cosmochim. Acta 74:6499–516.
Van Mooy, B. A. S., Fredricks, H. F., Pedler, B. E., Dyhrman, S. T.,Karl, D. M., Koblızek, M., Lomas, M. W., et al. 2009. Phyto-plankton in the ocean use non-phosphorus lipids in responseto phosphorus scarcity. Nature 458:69–72.
Van Mooy, B. A. S., Rocap, G., Fredricks, H. F., Evans, C. T. &Devol, A. H. 2006. Sulfolipids dramatically decrease phos-phorus demand by picocyanobacteria in oligotrophic marineenvironments. Proc. Natl. Acad. Sci. U. S. A. 103:8607–12.
Wada, H. & Murata, N. 1998. Membrane lipids in cyanobacteria. InSiegenthaler, P. & Murata, N. [Eds] Lipids in Photosynthesis:Structure, Function and Genetics. Kluwer Academic Publishers,Dordrecht, the Netherlands, pp. 65–81.
Yu, B. & Benning, C. 2003. Anionic lipids are required for chlo-roplast structure and function in Arabidopsis. Plant J. 36:762–70.
Yu, B., Xu, C. & Benning, C. 2002. Arabidopsis disrupted in SQD2encoding sulfolipid synthase is impaired in phosphate-limitedgrowth. Proc. Natl. Acad. Sci. U. S. A. 99:5732–7.
EVERGLADES’ PERIPHYTON LIPIDS 311
Recommended