Non-life insurance mathematics
Nils F. Haavardsson, University of Oslo and DNB
Skadeforsikring

About the lecturer• PhD in risk analysis, Institute for Mathematics, University of
Oslo
• 12 years experience from insurance• Senior Actuary in DNB Skadeforsikring (current position)
• Actuary in Gjensidige
• Actuary in KLP
• Actuarial consultant in Avenir
• 5 years experience from other sectors (energy, research)• Quantitative economic risk assessments (consulting,
research)
• 2 years pre-graduate experience (teamleader/instructor in military, transport)
• Member of Norwegian Actuarial Association
2

Overview of this session
3
General insurance: an
opening look
How Monte Carlo simulation
is put to work
Some important concepts of
real life (if time)
Basic concepts •Intro
•Pricing
•Portfolio and solvency
•Risk ceding and
reinsurance
•Result elements with risk
drivers
•Risk selection and pricing
Module Contents
•1.2.1
•1.2.2
•1.2.3
•1.2.4
Part in EB*
EB*=Computation and modeling in insurance
and finance by Erik Bølviken
•Intro
•Enter contracts and their
clauses
•Stochasitc modelling
•Risk diversification
•3.2.1
•3.2.2
•3.2.3
•3.2.4
•How are random variables
sampled?
•Inversion
•Introduction
•Computing the reserve
•When responsibility is
limited
•Dealing with reinsurance
•2.3.1
•2.3.2
•3.3.1
•3.3.4
•3.3.5
•3.3.6
•Loss ratio
•Costs
•Combined ratio

Non-life insurance from a financial perspective:
for a premium an insurance company commits itself to pay a sum if an event has occured
Overview
4
Contract period, a year in property insurance
Policy holder
signs up for an
insurance
Policy holder
pays premium.
Insurance company
starts to earn
premium
During the duration of the policy, some of
the premium is earned, some is unearned
• How much premium is earned?
• How much premium is unearned?
• Is the premium sufficient to cover incurred (retrospective) and
future losses (prospective)?
prospectiveretrospective
The balance sheet
Premium Income
Losses
Loss ratio
Costs
Result elements

Why does it work??
5
Client 1
Insurance
company
Client 2
Client n-1 Client n
•Economic risk is transferred from the policyholder to the insurer
•Due to the law of large numbers (many almost independent clients),
the loss of the insurance company is much more predictable than that
of an individual
•Therefore the premium should be based on the expected loss that
is transferred from the policyholder to the insurer
Much of the course is about computing this expected loss
...but first some insurance economics
The balance sheet
Premium Income
Losses
Loss ratio
Costs
Result elements

How can the result of an insurance company be
decomposed?
6
Result elements:
+ Insurance premium paid by the clients
+ financial income generated by the premium from the clients
- claims paid to the clients
- operational costs of the Insurance company
= result to be distributed among the owners and the authorities
Insurance economics in its most basic form:
The balance sheet
Premium Income
Losses
Loss ratio
Costs
Result elements

Insurance mathematics is fundamental in
insurance economics
7
The result drivers of insurance economics:
Result elements: Result drivers:
+ Insurance premium
Risk based pricing,
reinsurance
+ financial income
International economy for example interest rate level,
risk profile for example stocks/no stocks
- claims
risk reducing measures (for example installing burglar alarm),
risk selection (client behaviour),
change in legislation,
weather phenomenons,
demographic factors,
reinsurance
- operational costs
measures to increase operational efficiency,
IT-systems,
wage development
= result to be distributed among the owners and the authoritiesTax politics
The balance sheet
Premium Income
Losses
Loss ratio
Costs
Result elements

Insurance economics• Risk selection: Object risk
……which house is most likely to burn down??
The balance sheet
Premium Income
Losses
Loss ratio
Costs
Result elements

Insurance economics• Risk selection: subject risk
………..”sloppy” client who is always unlucky….
The balance sheet
Premium Income
Losses
Loss ratio
Costs
Result elements

Different price elements have
different risk driversObject Geography Subject
• Standard
• Electrical system
• Pipes
• Roof
• Construction material
• The number of wet rooms and
the number of kitchens
• Building year
• Maintenance level in general
• Electrical system reviewed?
• Weather
• Climate
• Population density
• Infrastructure complexity
• Natural catastrophies
• Demography
• Policy holder
• Age
• Profession
• Risk aversion
• Personality – structured
or carefree?
• The number of inhabitants in
building
• Use
• Inhabited by owner
• Rental
• Vacation use
(inherited?)

Find riskodrivers for every price element
Objekt
Insurance object
Element • Fire • Water
• Flood risk
• Pipe quality
• Weather
• Cumule
• Elektrical system
• Construction material
A B
C
Risk driver

Loss ratio
• Shows how much of the premium income is spent to cover losses
• What does the difference in loss ratio gross and net tell us?
Gross Net
Incurred losses 1070 (-870-200) 850
Earned premium 1340 (1450-110) 1095
Loss ratio 79.9% 77.6%
Amounts in 1 000 000 NOK 2012
Written gross premium 1 450
- ceded reinsurance premium -270
Change in reserve for unearned gross premium -110
-change in reinsurance share of unearned premium 25
Net premium income 1 095
Amounts in 1 000 000 NOK 2012
Paid claims gross -870
- Reinsurance share of paid claims gross 120
change in gross claims reserve -200
-change in reinsurance part of gross claims reserve 100
Net claims costs -850
The balance sheet
Premium Income
Losses
Loss ratio
Costs
Result elements
•
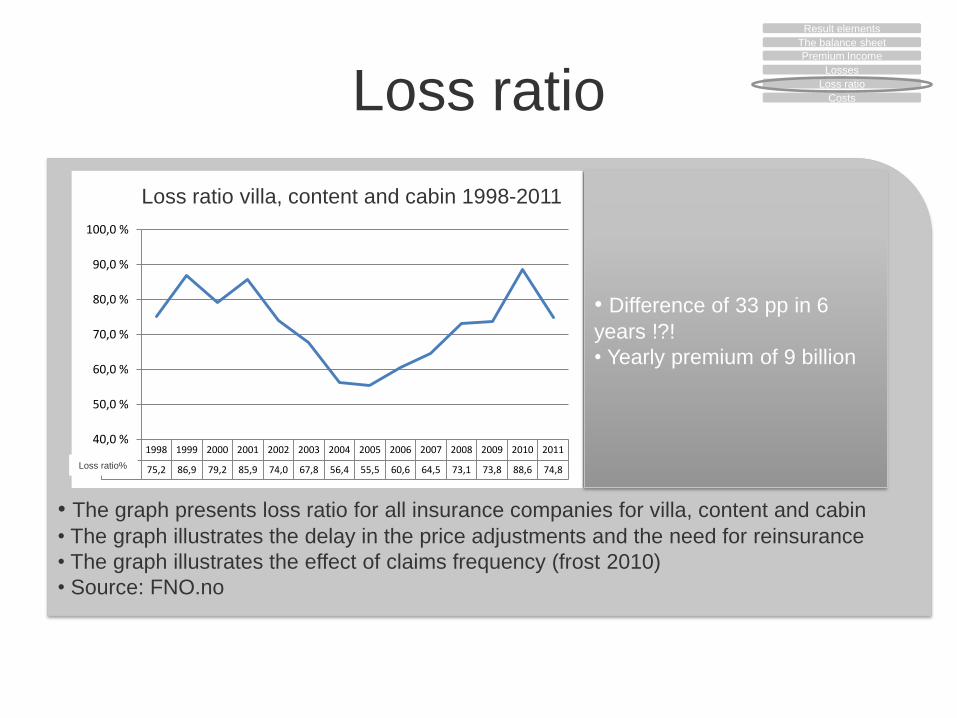
• The graph presents loss ratio for all insurance companies for villa, content and cabin
• The graph illustrates the delay in the price adjustments and the need for reinsurance
• The graph illustrates the effect of claims frequency (frost 2010)
• Source: FNO.no
Loss ratio
1998 1999 2000 2001 2002 2003 2004 2005 2006 2007 2008 2009 2010 2011
Skade% 75,2 86,9 79,2 85,9 74,0 67,8 56,4 55,5 60,6 64,5 73,1 73,8 88,6 74,8
40,0 %
50,0 %
60,0 %
70,0 %
80,0 %
90,0 %
100,0 %
Skadeprosent B/K 1998-2011
• Difference of 33 pp in 6
years !?!
• Yearly premium of 9 billion
Loss ratio villa, content and cabin 1998-2011
Loss ratio%
The balance sheet
Premium Income
Losses
Loss ratio
Costs
Result elements

Costs
• Sales costs: Provisions, sales offices, marketing, back-office sale
• Insurance related operation costs: management, accounting, actuary, house rent, HR,
IT etc.Up to 2012 also claims settling costs – NB:these were transferred to claims in
2012
• Received provision reinsurance:
- Normally it constitutes 20% to 25% of ceded premium..
- NB: ”Cost income” in the table – why?
- Why do the companies receive this provision?
Amounts in 1 000 000 NOK 2012
Sales costs -85
Insurance related operational costs -200
received provision for ceded reinsurance 45
Insurance related operational costs -240
The balance sheet
Premium Income
Losses
Loss ratio
Costs
Result elements

Cost ratio (percent)
• Shows how much of the premium income is spent to cover operational costs
• What does the difference in cost ratio gross and net tell?
Amounts in 1 000 000 NOK 2012
Written gross premium 1 450
- ceded reinsurance premium -270
Change in reserve for unearned gross premium -110
-change in reinsurance share of unearned premium 25
Net premium income 1 095
Amounts in 1 000 000 NOK 2012
Sales costs -85
Insurance related operational costs -200
received provision for ceded reinsurance 45
Insurance related operational costs -240
Gross Net
Operational costs 285 (-85-200) 240
Earned premium 1340 (1450-110) 1095
Cost ratio (percent) 21.3% 21.9%
The balance sheet
Premium Income
Losses
Loss ratio
Costs
Result elements

Cost ratio (percent)
• What is causing the reduction in cost ratio to 20%?Where are the companies heading?
• Source: fno.no – Results in non-life insurance: includes all non-life insurance
companies in Norway
Cost ratio
The balance sheet
Premium Income
Losses
Loss ratio
Costs
Result elements

Combined ratio• Shows how much of the premium income that is spent to cover claims and operational
costs
• Combined ratio above 100 % implies that the insurance operations are not profitable
• What do the combined ratio gross and net express for the example company?
• Long term CR for insurance companies in Norway are between 90% and 95%
• What key ratio is most problematic for the example company?
Gross Net
Loss ratio 79.9% 77.6%
Cost ratio 21.3% 21.9%
Combined ratio 101.1% 99.5%
The balance sheet
Premium Income
Losses
Loss ratio
Costs
Result elements

Key parameters for non-life
insurance in Norway
18
•The graph shows loss ratio (left axis), result degree (total revenue minus total costs, right axis), cost ratio (right
axis) andincome from investments in percent of premium (right axis) for the period 1998-2011
•The result degree and the loss ratio vary a lot.
•The loss ratio seems to be the most important driver for profitability in non-life insurance
•The cost ratio and income from investments in percent of premium are decreasing during the period.
Loss ratio
Result degree
Cost ratio
Income from investments as
percent of premium
The balance sheet
Premium Income
Losses
Loss ratio
Costs
Result elements

Outline of the course
19
| Models treated Curriculum
Duration in
lectures
Basic concepts and introduction EB 1.2, 2.3.1, 2.3.2, 3.2, 3.3 1
How is claim frequency modelled?
Poisson, Compound Poisson,
Poisson regression, negative
binomial model EB 8.2, 8.3, 8.4 2-3
How is claim reserving modelled? Delay modelling, chain ladder EB 8.5, Note 1-2
How is claim size modelled?
Gamma distribution, log-normal
distribution, Pareto distribution,
Weibull distribution EB 9 2-3
How is pricing done? EB 10 1
Solvency EB 10, Note 1-2
Credibility theory Buhlmann Straub EB 10 1
Reinsurance EB 10 1
Repetition 1

Course literature
20
Curriculum:
Chapter 1.2, 2.3.1, 2.3.2, 2.5, 3.2, 3.3 in EB
Chapter 8,9,10 in EB
Note on Chain Ladder
Lecture notes by NFH
The following book will be used (EB):
Computation and Modelling in Insurance and Finance, Erik
Bølviken, Cambridge University Press (2013)
•Additions to the list above may occur during the course
•Final curriculum will be posted on the course web site in due time
Recommended

![arXiv:1701.03787v1 [math.NA] 13 Jan 2017 · PDF filearXiv:1701.03787v1 [math.NA] 13 Jan 2017 ... Email address: mikaem@math.uio.no (Mikael Mortensen) Preprint submitted to Elsevier](https://img.pdfslide.us/doc/110x75/5a7a2c357f8b9a4b198df20f/arxiv170103787v1-mathna-13-jan-2017-170103787v1-mathna-13-jan-2017-.jpg)