• NOAA Fisheries (NMFS) mandate is to act as a steward of living marine resources, which involves ecosystem and habitat characterization and stock assessment (i.e. NMFS does not help fishers find fish).
• Better characterization of the coastal zone is of interest to NMFS since many commercial and recreational fisheries are focused in the coastal zone.
• Altimetry data is commonly used in the open ocean to provide an environmental context to tracked animals, in particular how animals interact with mesoscale features.
• Coastal measurements of velocity and transport would be useful to NMFS. The west coast node of CoastWatch is planning to implement a near shore transport product to better engage coastal resource managers.
NOAA Fisheries & Satellite Altimetry DataAn Overview
NOAA Fisheries & Satellite Altimetry DataAn Overview
NOAA Fisheries & Coastal Altimetry Data
NOAA Fisheries & Coastal Altimetry Data
Cara Wilson NOAA/NMFS/SWFSC
Environmental Research Division (ERD) 1352 Lighthouse Ave., PG, CA
Cara Wilson NOAA/NMFS/SWFSC
Environmental Research Division (ERD) 1352 Lighthouse Ave., PG, CA
Coastal Altimetry Workshop, Silver Spring, MD Feb 5-7 2008
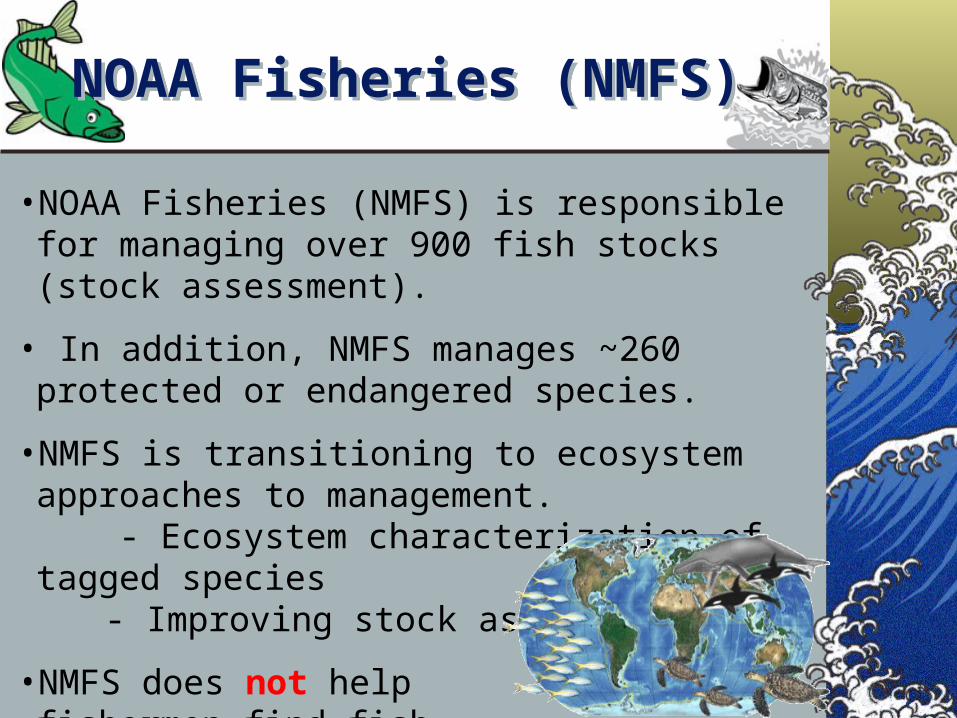
• NOAA Fisheries (NMFS) is responsible for managing over 900 fish stocks (stock assessment).
• In addition, NMFS manages ~260 protected or endangered species.
• NMFS is transitioning to ecosystem approaches to management. - Ecosystem characterization of tagged species
- Improving stock assessments
• NMFS does not help fishermen find fish
NOAA Fisheries (NMFS) NOAA Fisheries (NMFS)
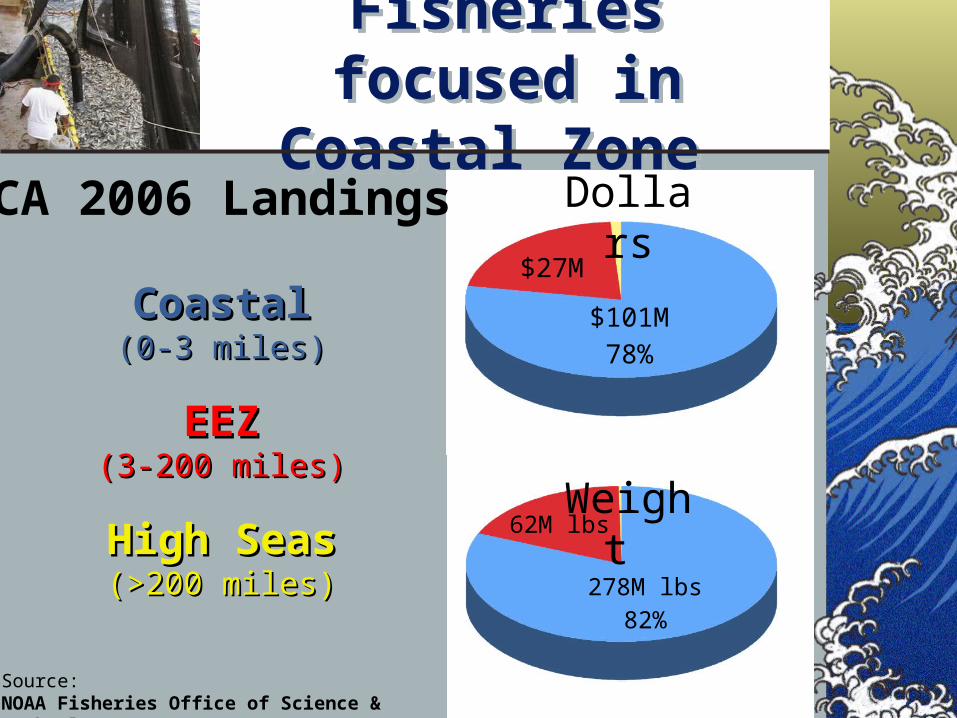
Fisheries focused in Coastal Zone
Fisheries focused in Coastal Zone
CA 2006 Landings
CoastalCoastal(0-3 miles)(0-3 miles)
EEZEEZ(3-200 miles)(3-200 miles)
High SeasHigh Seas(>200 miles)(>200 miles)
Dollars
Weight
$101M78%
$27M
278M lbs82%
62M lbs
Source: NOAA Fisheries Office of Science & Technology
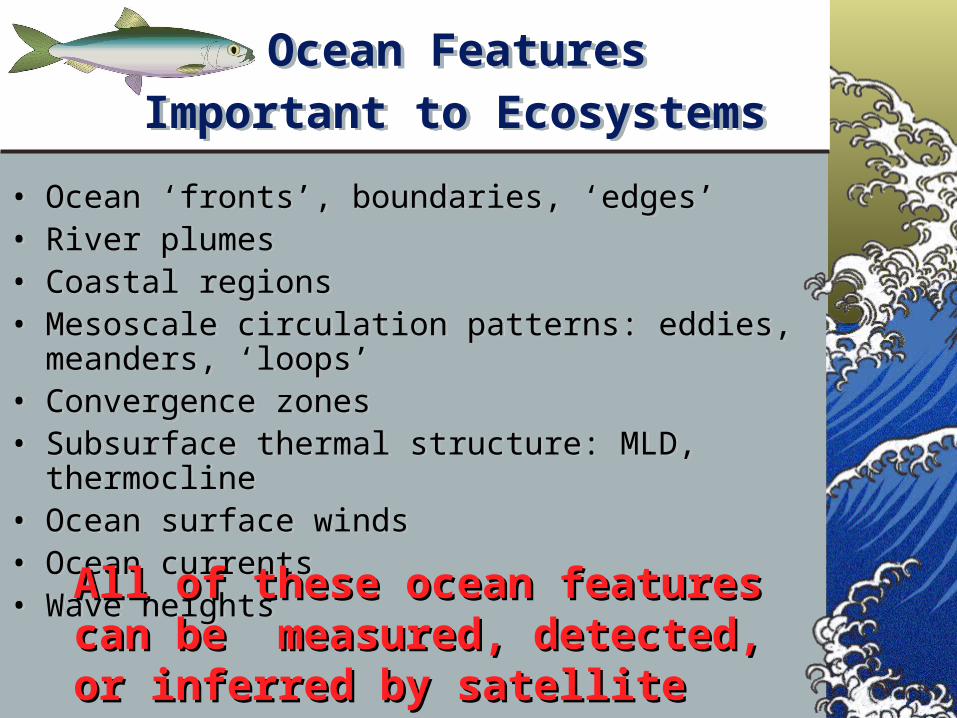
• Ocean ‘fronts’, boundaries, ‘edges’• River plumes• Coastal regions• Mesoscale circulation patterns: eddies, meanders, ‘loops’• Convergence zones• Subsurface thermal structure: MLD, thermocline• Ocean surface winds• Ocean currents• Wave heights
• Ocean ‘fronts’, boundaries, ‘edges’• River plumes• Coastal regions• Mesoscale circulation patterns: eddies, meanders, ‘loops’• Convergence zones• Subsurface thermal structure: MLD, thermocline• Ocean surface winds• Ocean currents• Wave heights
Ocean Features Important to Ecosystems
Ocean Features Important to Ecosystems
All of these ocean features can be All of these ocean features can be measured, detected, or inferred measured, detected, or inferred by satellite databy satellite data
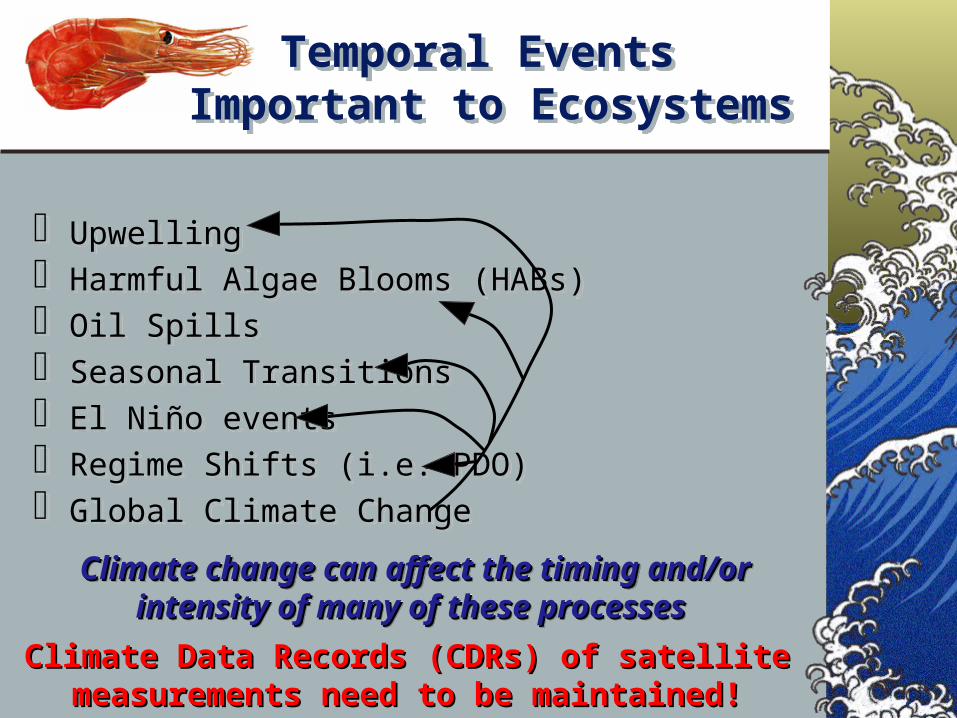
Upwelling Harmful Algae Blooms (HABs) Oil Spills Seasonal Transitions El Niño events Regime Shifts (i.e. PDO) Global Climate Change
Upwelling Harmful Algae Blooms (HABs) Oil Spills Seasonal Transitions El Niño events Regime Shifts (i.e. PDO) Global Climate Change
Climate Data Records (CDRs) of satellite Climate Data Records (CDRs) of satellite measurements need to be maintained!measurements need to be maintained!
Climate change can affect the timing and/or Climate change can affect the timing and/or intensity of many of these processes intensity of many of these processes
Climate change can affect the timing and/or Climate change can affect the timing and/or intensity of many of these processes intensity of many of these processes
Temporal Events Important to Ecosystems
Temporal Events Important to Ecosystems
Some ExampleApplications Some ExampleApplications
Coastal Altimetry Workshop, Silver Spring, MD Feb 5-7 2008
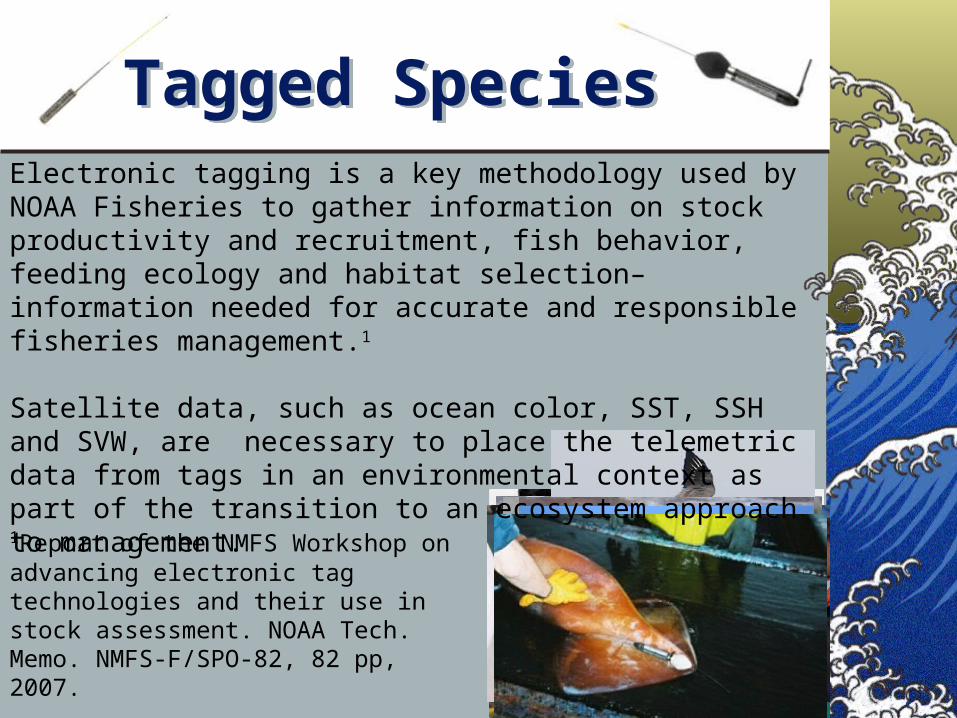
Tagged SpeciesTagged SpeciesElectronic tagging is a key methodology used by NOAA Fisheries to gather information on stock productivity and recruitment, fish behavior, feeding ecology and habitat selection– information needed for accurate and responsible fisheries management.1
Satellite data, such as ocean color, SST, SSH and SVW, are necessary to place the telemetric data from tags in an environmental context as part of the transition to an ecosystem approach to management.
1Report of the NMFS Workshop on advancing electronic tag technologies and their use in stock assessment. NOAA Tech. Memo. NMFS-F/SPO-82, 82 pp, 2007.
http://spo.nmfs.noaa.gov/tm
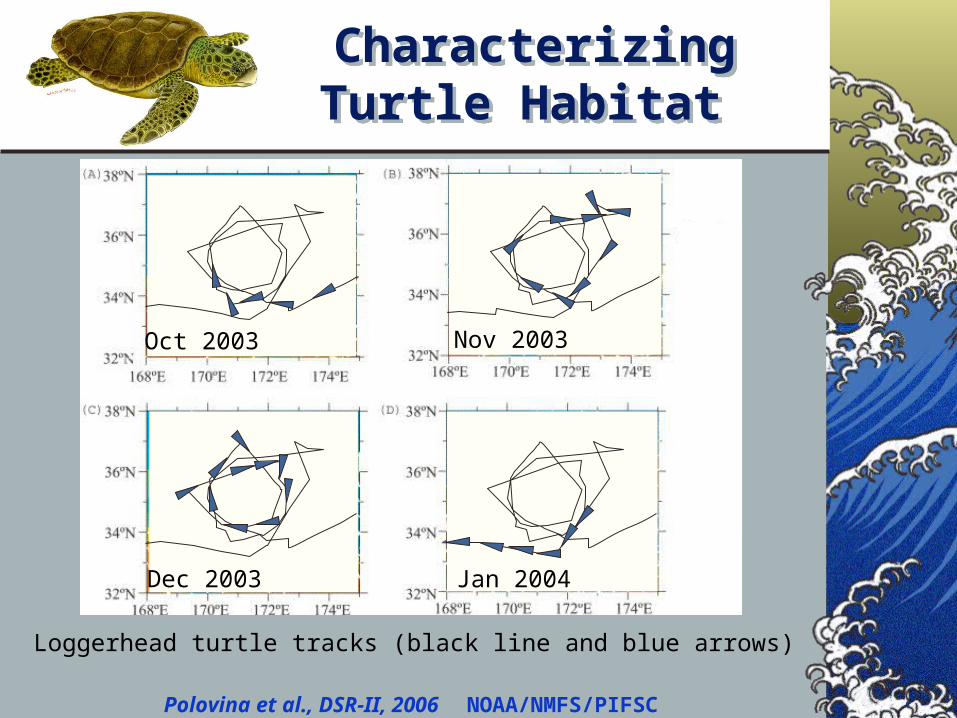
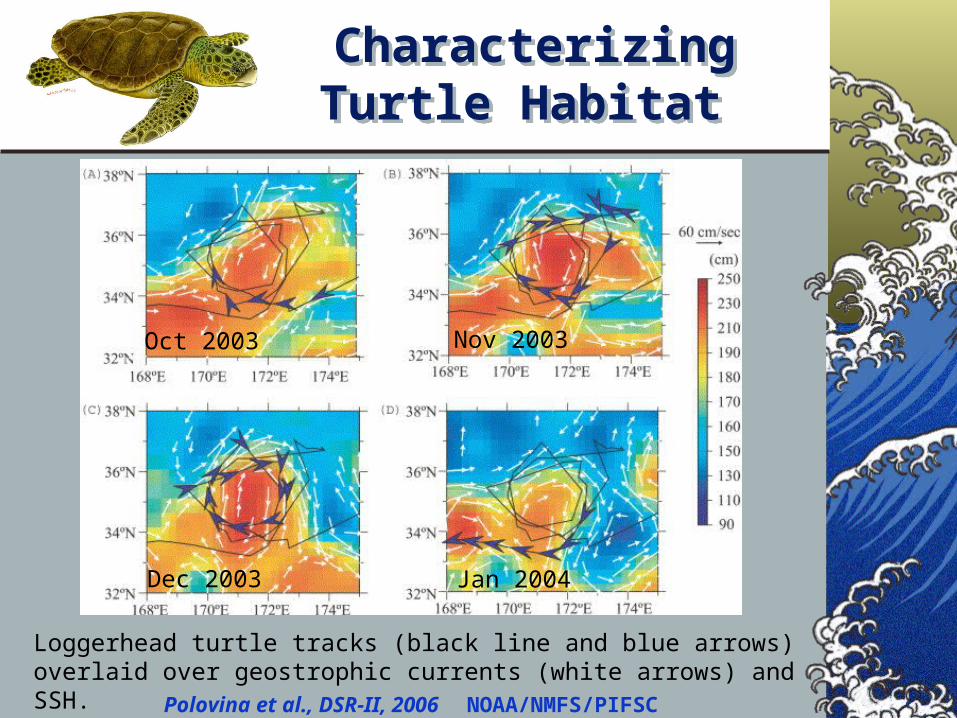
Characterizing Turtle Habitat
Characterizing Turtle Habitat
NOAA/NMFS/SWFSC PFEL Loggerhead turtle tracks (black line and blue arrows)
Polovina et al., DSR-II, 2006 NOAA/NMFS/PIFSC
Oct 2003 Nov 2003
Dec 2003 Jan 2004
Characterizing Turtle Habitat
Characterizing Turtle Habitat
NOAA/NMFS/SWFSC PFEL Loggerhead turtle tracks (black line and blue arrows) overlaid over geostrophic currents (white arrows) and SSH.
Polovina et al., DSR-II, 2006 NOAA/NMFS/PIFSC
Oct 2003 Nov 2003
Dec 2003 Jan 2004
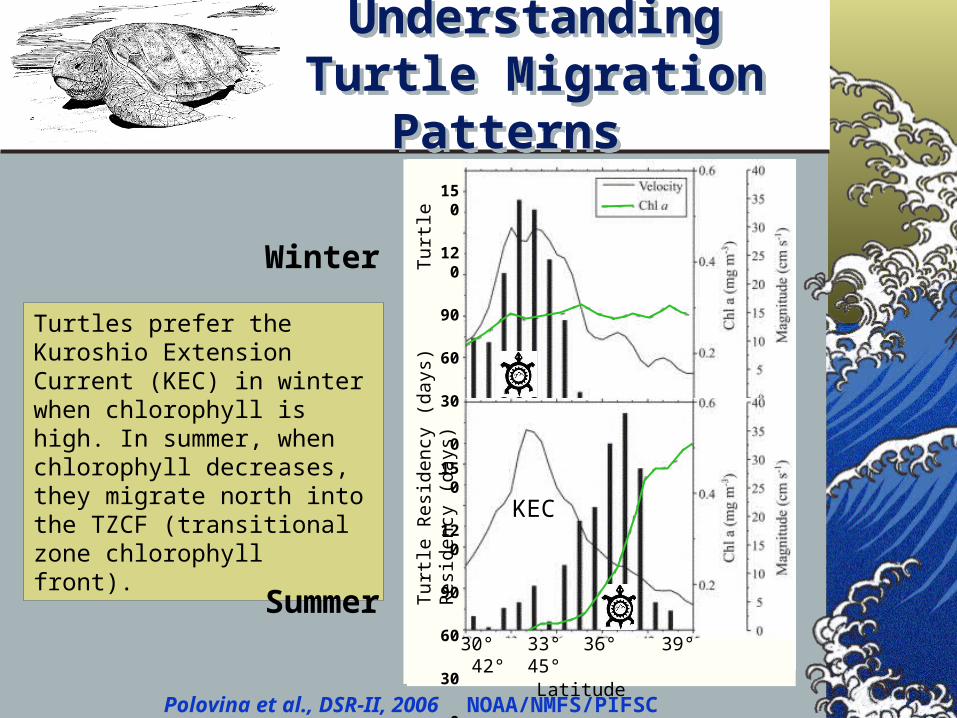
Understanding Turtle Migration Patterns
Understanding Turtle Migration Patterns
Turtles prefer the Kuroshio Extension Current (KEC) in winter when chlorophyll is high. In summer, when chlorophyll decreases, they migrate north into the TZCF (transitional zone chlorophyll front).
Polovina et al., DSR-II, 2006 NOAA/NMFS/PIFSC
Winter
Summer
KEC
30° 33° 36° 39° 42° 45°Latitude
150
120
90
60
30
0
150
120
90
60
30
0
Tur
tle R
esid
ency
(da
ys)
T
urt
le R
esid
ency
(da
ys)
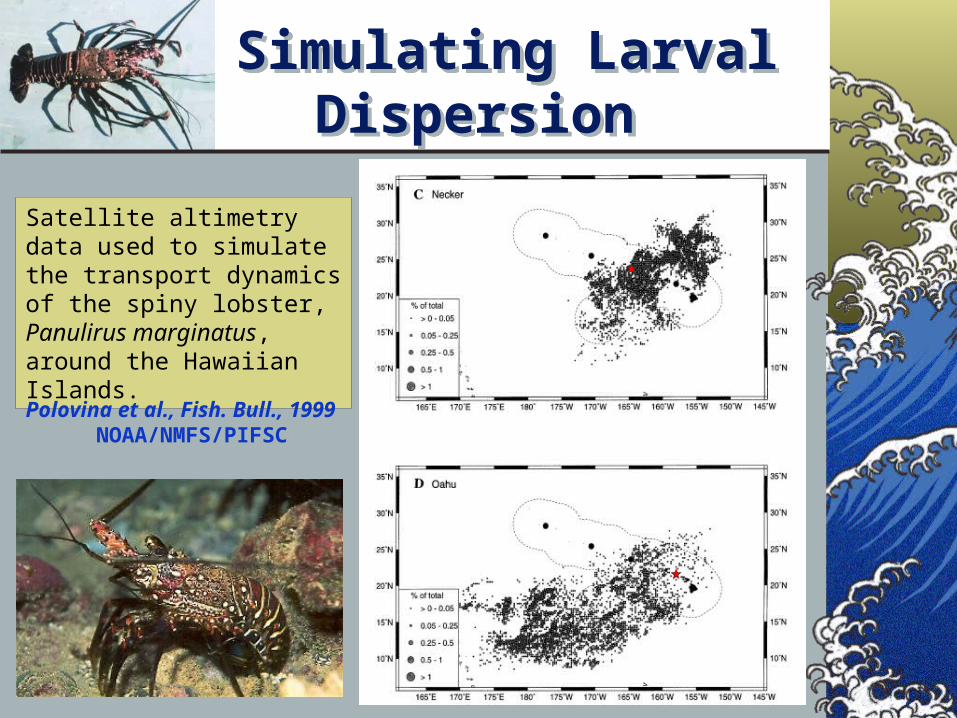
Simulating Larval Dispersion
Simulating Larval Dispersion
Satellite altimetry data used to simulate the transport dynamics of the spiny lobster, Panulirus marginatus, around the Hawaiian Islands.
Polovina et al., Fish. Bull., 1999 NOAA/NMFS/PIFSC
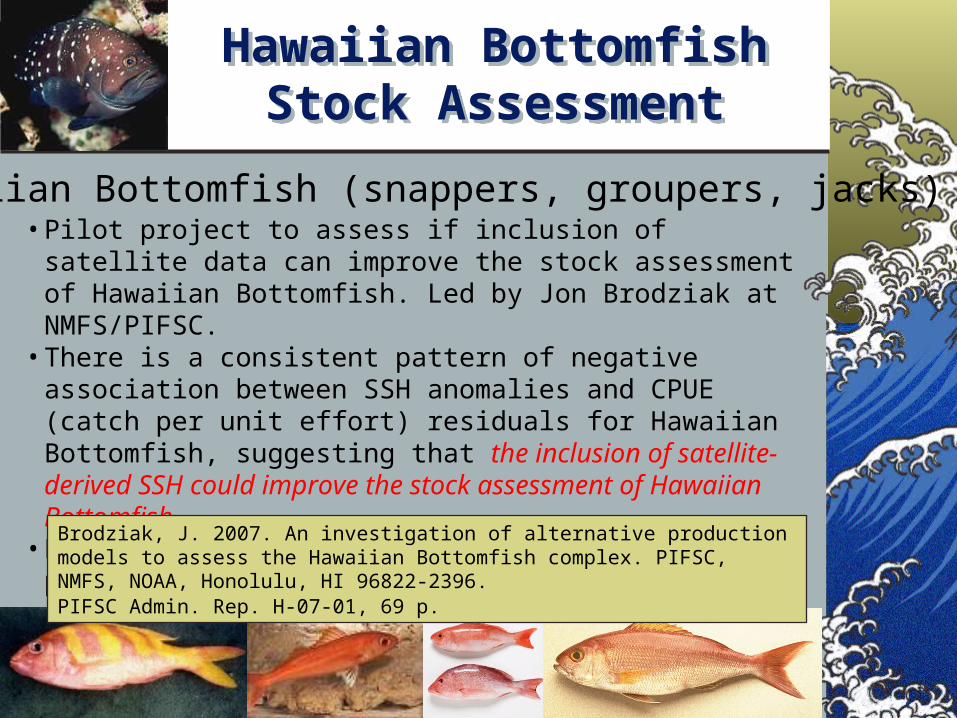
Hawaiian Bottomfish Stock Assessment
Hawaiian Bottomfish Stock Assessment
• Pilot project to assess if inclusion of satellite data can improve the stock assessment of Hawaiian Bottomfish. Led by Jon Brodziak at NMFS/PIFSC.
• There is a consistent pattern of negative association between SSH anomalies and CPUE (catch per unit effort) residuals for Hawaiian Bottomfish, suggesting that the inclusion of satellite-derived SSH could improve the stock assessment of Hawaiian Bottomfish.
• Funded in part by NASA and by NOAA’s R&O project
Hawaiian Bottomfish (snappers, groupers, jacks)
Brodziak, J. 2007. An investigation of alternative production models to assess the Hawaiian Bottomfish complex. PIFSC, NMFS, NOAA, Honolulu, HI 96822-2396. PIFSC Admin. Rep. H-07-01, 69 p.
Alaskan Sablefish ProjectAlaskan Sablefish ProjectS. Kalei Shotwell & Dana H. Hanselman, NMFS/AFSCS. Kalei Shotwell & Dana H. Hanselman, NMFS/AFSC
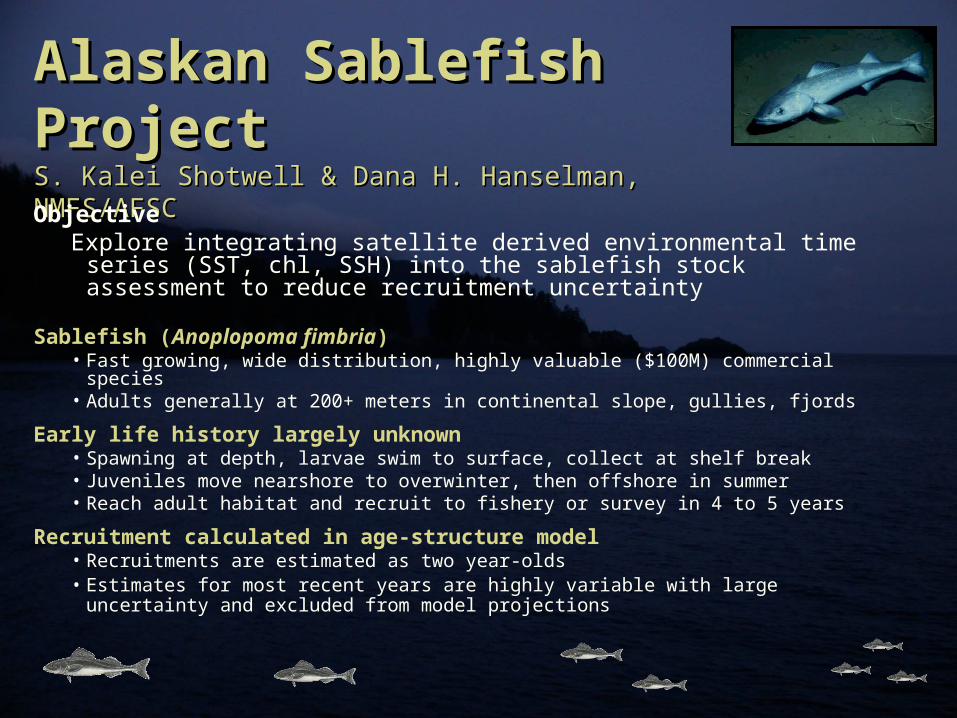
ObjectiveExplore integrating satellite derived environmental time series (SST,
chl, SSH) into the sablefish stock assessment to reduce recruitment uncertainty
Sablefish (Anoplopoma fimbria)• Fast growing, wide distribution, highly valuable ($100M) commercial species• Adults generally at 200+ meters in continental slope, gullies, fjords
Early life history largely unknown• Spawning at depth, larvae swim to surface, collect at shelf break• Juveniles move nearshore to overwinter, then offshore in summer• Reach adult habitat and recruit to fishery or survey in 4 to 5 years
Recruitment calculated in age-structure model• Recruitments are estimated as two year-olds• Estimates for most recent years are highly variable with large uncertainty and
excluded from model projections
Questions…Questions…
• The high temporal and spatial resolution of satellite data, and its continuity, make satellite data an important tool for monitoring and characterizing marine ecosystems.
• Satellite data will become increasingly more important as NOAA implements ecosystem approaches to management.
• Currently, however, the full potential of satellite data has not been realized within NMFS, or within fisheries science more generally.
Why is satellite data underutilized within NMFS? Why is satellite data underutilized within NMFS?
What can be done to take advantage of the What can be done to take advantage of the wealth of information this data can provide?wealth of information this data can provide?
Why is satellite data underutilized within NMFS? Why is satellite data underutilized within NMFS?
What can be done to take advantage of the What can be done to take advantage of the wealth of information this data can provide?wealth of information this data can provide?
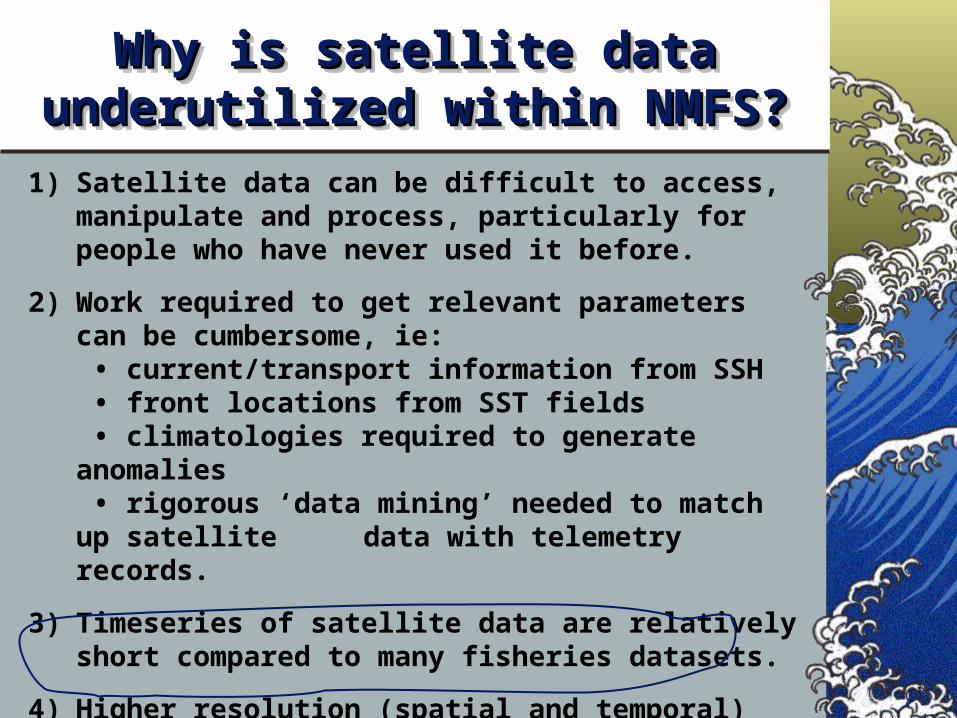
Why is satellite data underutilized Why is satellite data underutilized within NMFS?within NMFS?
Why is satellite data underutilized Why is satellite data underutilized within NMFS?within NMFS?
1) Satellite data can be difficult to access, manipulate and process, particularly for people who have never used it before.
2) Work required to get relevant parameters can be cumbersome, ie: • current/transport information from SSH • front locations from SST fields • climatologies required to generate anomalies • rigorous ‘data mining’ needed to match up satellite
data with telemetry records.
3) Timeseries of satellite data are relatively short compared to many fisheries datasets.
4) Higher resolution (spatial and temporal) datasets needed for coastal areas.
Length of Time Series Length of Time Series
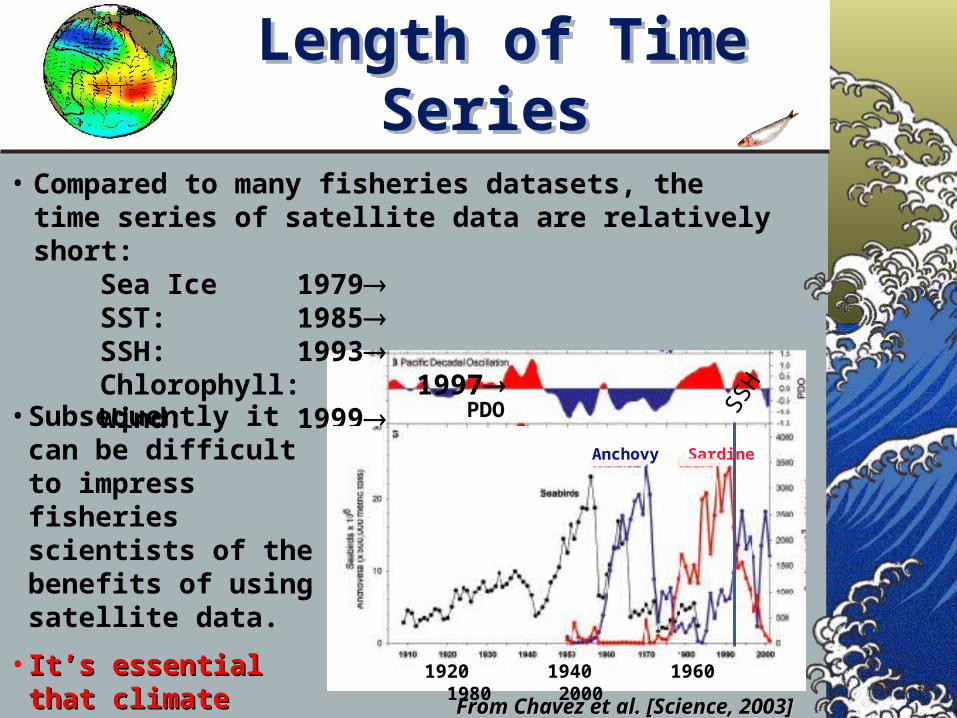
• Compared to many fisheries datasets, the time series of satellite data are relatively short:
Sea Ice 1979SST: 1985 SSH: 1993Chlorophyll: 1997Wind: 1999
SardineAnchovy
1920 1940 1960 1980 2000
• Subsequently it can be difficult to impress fisheries scientists of the benefits of using satellite data.
• It’s essential that It’s essential that climate quality records climate quality records of satellite data be of satellite data be maintained!maintained! From Chavez et al. [Science, 2003]From Chavez et al. [Science, 2003]
SSH
PDO

The IssuesThe Issues
1) Satellite data can be difficult to access, manipulate and process, particularly for people who have never used it before.
2) Work required to get relevant parameters can be cumbersome, ie: • current/transport information from SSH • front locations from SST fields • climatologies required to generate anomalies • rigorous ‘data mining’ needed to match up satellite
data with telemetry records.
What can be done to address these issues?
NOAA Satellite Data Training Course
NOAA Satellite Data Training Course
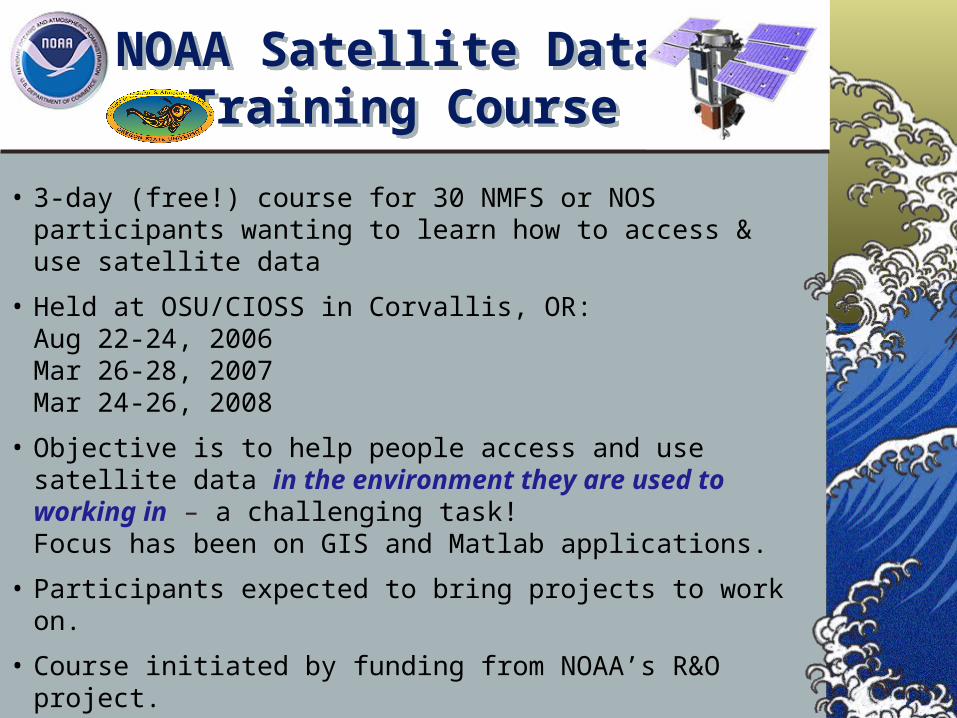
• 3-day (free!) course for 30 NMFS or NOS participants wanting to learn how to access & use satellite data
• Held at OSU/CIOSS in Corvallis, OR: Aug 22-24, 2006Mar 26-28, 2007Mar 24-26, 2008
• Objective is to help people access and use satellite data in the environment they are used to working in – a challenging task!Focus has been on GIS and Matlab applications.
• Participants expected to bring projects to work on.
• Course initiated by funding from NOAA’s R&O project.
• The learning experience goes two ways. From conducting these courses we get a better idea of users’ needs and wants, and are subsequentially better able to address those needs.
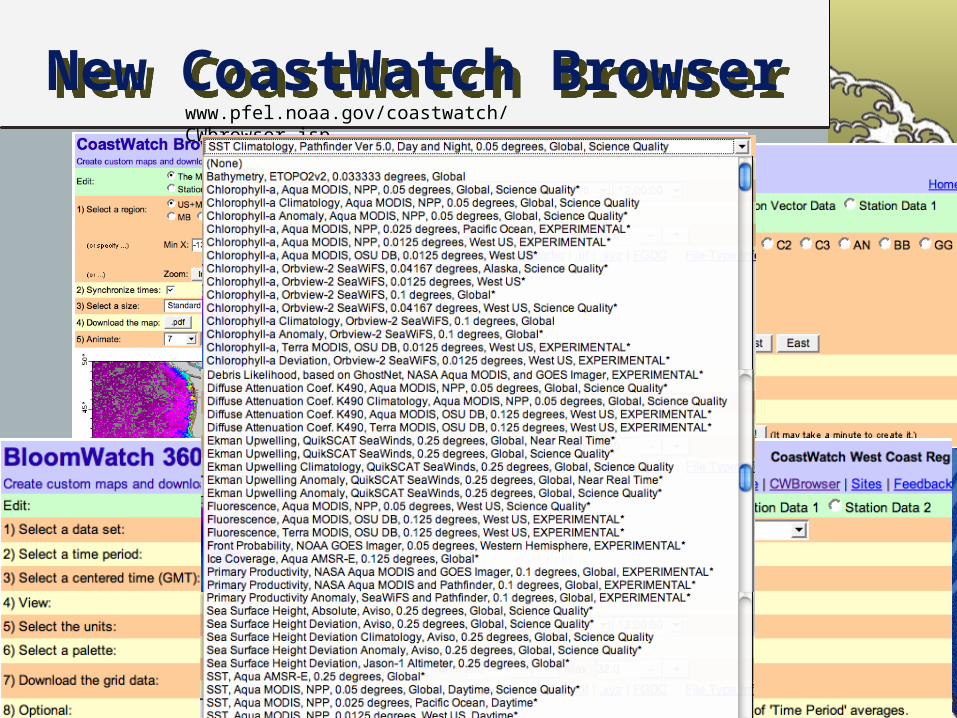
New CoastWatch BrowserNew CoastWatch Browserwww.pfel.noaa.gov/coastwatch/CWbrowser.jsp
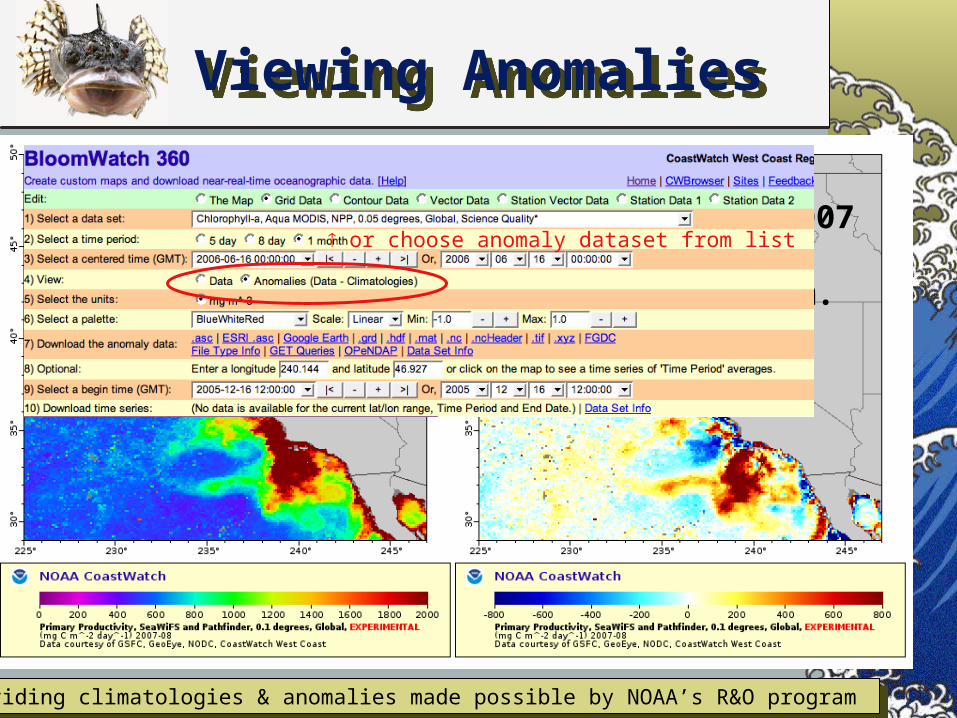
Viewing AnomaliesViewing Anomalies
Providing climatologies & anomalies made possible by NOAA’s R&O program Providing climatologies & anomalies made possible by NOAA’s R&O program
Aug 2007
Prim. Prod.
Aug 2007
Prim. Prod.
or choose anomaly dataset from list
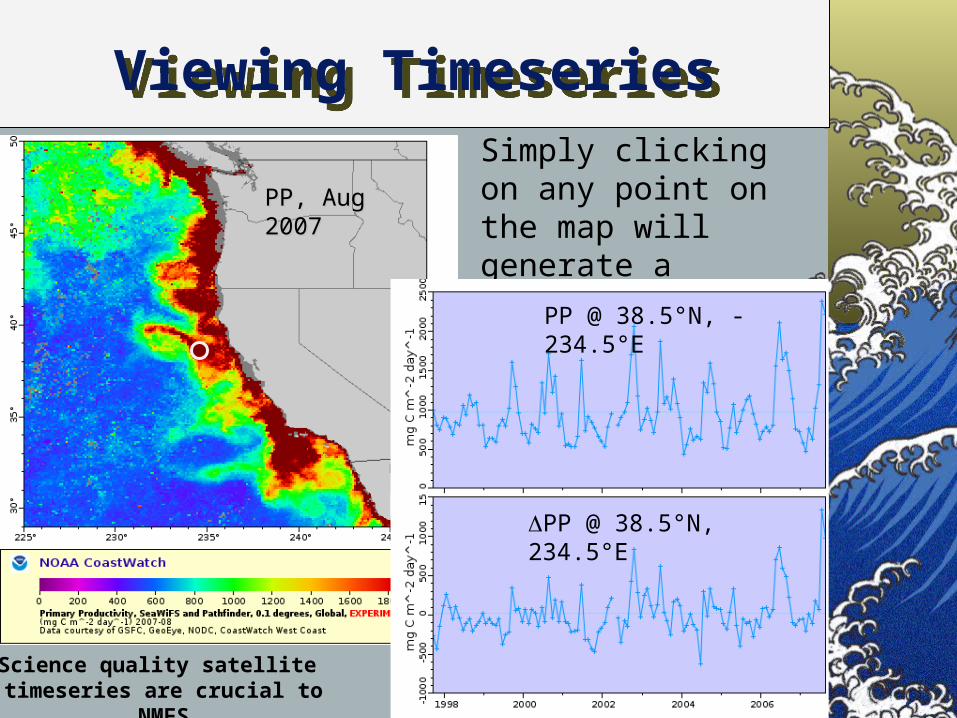
Viewing TimeseriesViewing TimeseriesSimply clicking on any point on the map will generate a timeseries at that location.
Science quality satellite timeseries are crucial to NMFS
PP, Aug 2007PP, Aug 2007
PP @ 38.5°N, -234.5°E
PP @ 38.5°N, 234.5°E
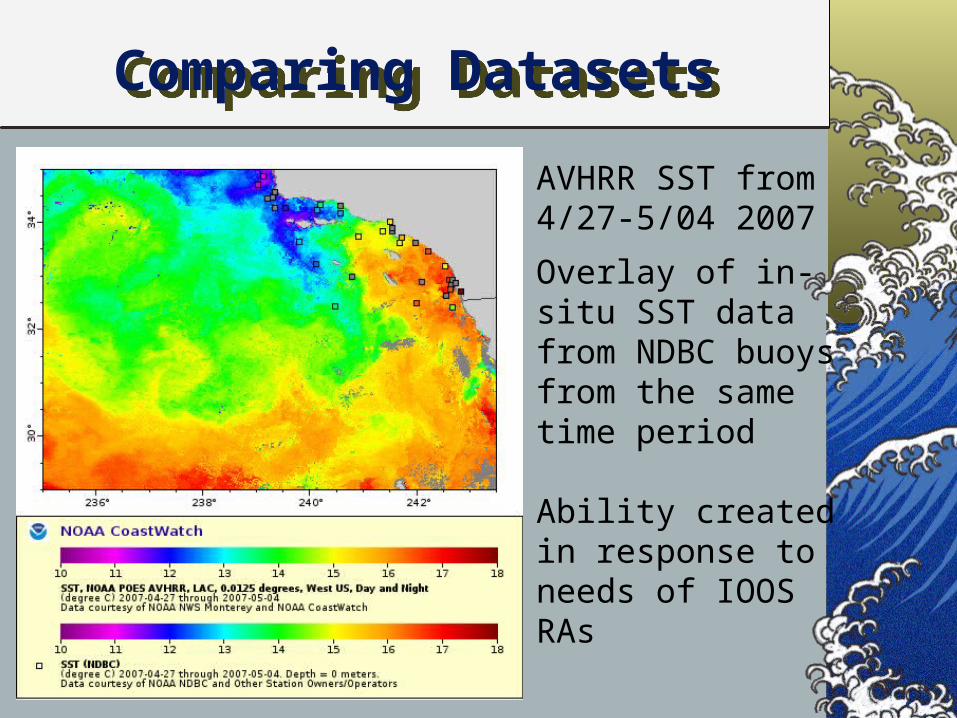
Comparing DatasetsComparing Datasets
AVHRR SST from 4/27-5/04 2007
Overlay of in-situ SST data from NDBC buoys from the same time period
Ability created in response to needs of IOOS RAs
• Timescales relevant to understanding population variability are interannual and decadal.
• NMFS is transitioning to ecosystem approaches to management. - Ecosystem characterization of tagged species
- Improving stock assessments
• Many fisheries scientists are not familiar with satellite data.
Summary Summary
Recommended