No Double Standards: Quantifying the Impact of
Standard Harmonization on International Trade
Julia Schmidt1 Walter Steingress2
1Banque de France
2Banque du Canada
CEPR Research Network on GVCs, Trade and Development / Oct 29, 2020
The views expressed in this paper are those of the authors and do not reflect those of theBanque de France or the Bank of Canada.
Motivation
Standards are everywhere...
• Health, safety, environmental standards:• Safety specifications for children’s toys
• Pesticide levels for agricultural products
• Mechanical filter specifications for FFP2/N95 face masks
• Quality standards:• Composition of dental implants, production of organic food, ISO 9000
quality management
• Compatibility standards:• Classic examples: electricity plugs, railway gauges, A4/letter paper formats
• Internet protocols, 4G mobile telecommunications standards, door frames
• Conformity assessment standards:• Car safety crash tests, fire resistance of building materials, guidelines for
personal data protection
• Technical standards:• QWERTY keyboard, archiving systems, statistical reporting, file format
used for 3D printing, cybersecurity tools and safeguards
1/30
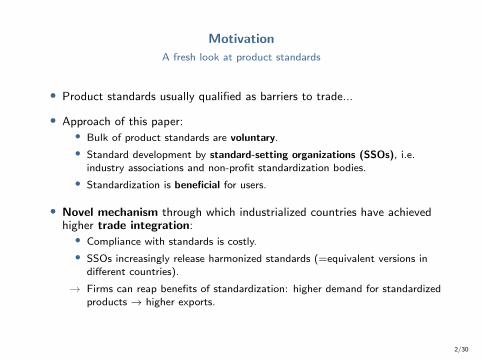
Motivation
A fresh look at product standards
• Product standards usually qualified as barriers to trade...
• Approach of this paper:• Bulk of product standards are voluntary.
• Standard development by standard-setting organizations (SSOs), i.e.industry associations and non-profit standardization bodies.
• Standardization is beneficial for users.
• Novel mechanism through which industrialized countries have achievedhigher trade integration:• Compliance with standards is costly.
• SSOs increasingly release harmonized standards (=equivalent versions indifferent countries).
→ Firms can reap benefits of standardization: higher demand for standardizedproducts → higher exports.
2/30
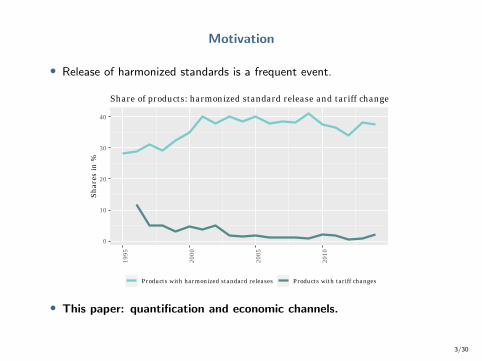
Motivation
• Release of harmonized standards is a frequent event.
0
10
20
30
4019
95
2000
2005
2010
Sh
ares
in %
Products with harmonized standard releases Products with tariff changes
Share of products: harmonized standard release and tariff change
• This paper: quantification and economic channels.
3/30
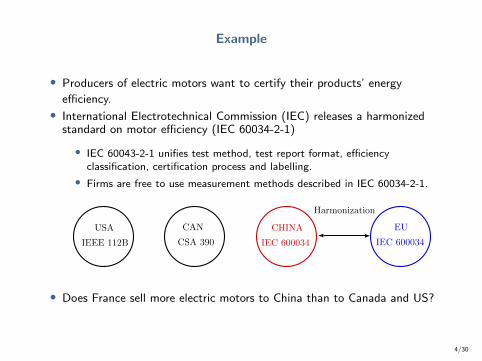
Example
• Producers of electric motors want to certify their products’ energy
efficiency.
• International Electrotechnical Commission (IEC) releases a harmonizedstandard on motor efficiency (IEC 60034-2-1)
• IEC 60043-2-1 unifies test method, test report format, efficiencyclassification, certification process and labelling.
• Firms are free to use measurement methods described in IEC 60034-2-1.
USA
IEEE 112B
CAN
CSA 390
CHINA
IEC 600034
EU
IEC 600034
Harmonization
• Does France sell more electric motors to China than to Canada and US?
4/30
Findings
• Introduction of a harmonized standard is beneficial to trade flows:
• On impact: 0.67% increase of new trade.
• Ad valorem equivalent tariff decrease: 0.16 to 1.58 pp.
• Increase in world trade: 0.27% per year.
• Contribution: 2 to 3 times larger than tariff reductions
• Driven by expansion of sales rather than entry of new products/firms.
• Channels:
• Heterogeneous firm model with voluntary standard adoption.
→ Harmonized standard releases allow for cost complementarities thatstimulate investment into product attributes that consumers value.
5/30
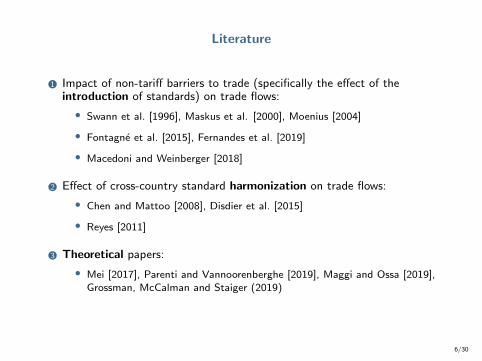
Literature
1 Impact of non-tariff barriers to trade (specifically the effect of theintroduction of standards) on trade flows:
• Swann et al. [1996], Maskus et al. [2000], Moenius [2004]
• Fontagne et al. [2015], Fernandes et al. [2019]
• Macedoni and Weinberger [2018]
2 Effect of cross-country standard harmonization on trade flows:
• Chen and Mattoo [2008], Disdier et al. [2015]
• Reyes [2011]
3 Theoretical papers:
• Mei [2017], Parenti and Vannoorenberghe [2019], Maggi and Ossa [2019],Grossman, McCalman and Staiger (2019)
6/30

Standards
The standard-setting process
• Standards are released by standard-setting organizations (SSOs).
• Examples: ISO, IEEE, DIN, ANSI
• Many SSOs are non-profit, non-governmental organizations.
• SSOs elaborate standards in working groups and technical committees.
• SSOs develop voluntary consensus standards.
• Legally binding when incorporated into governmental regulation.
• Majority of standards remain voluntary.
→ Regulatory standards notified to the WTO: 19,823 measures over1995–2014
→ Our database: >1.1 million standards (530,645 harmonized)
• Harmonized standard releases: mainly international standards accreditedby national SSOs.
• 6% due to national SSOs accrediting the standard of another national SSO
7/30
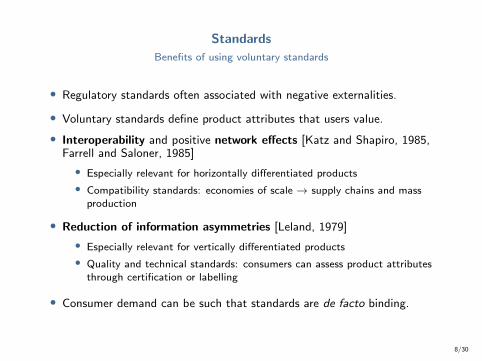
Standards
Benefits of using voluntary standards
• Regulatory standards often associated with negative externalities.
• Voluntary standards define product attributes that users value.
• Interoperability and positive network effects [Katz and Shapiro, 1985,Farrell and Saloner, 1985]
• Especially relevant for horizontally differentiated products
• Compatibility standards: economies of scale → supply chains and massproduction
• Reduction of information asymmetries [Leland, 1979]
• Especially relevant for vertically differentiated products
• Quality and technical standards: consumers can assess product attributesthrough certification or labelling
• Consumer demand can be such that standards are de facto binding.
8/30
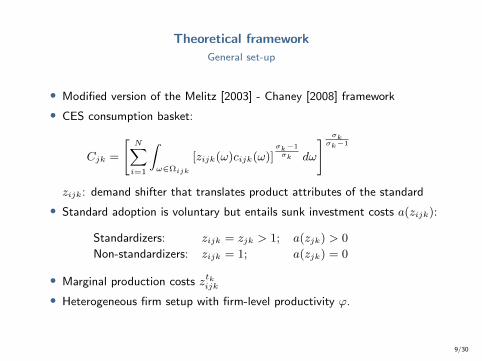
Theoretical framework
General set-up
• Modified version of the Melitz [2003] - Chaney [2008] framework
• CES consumption basket:
Cjk =
[N∑i=1
∫ω∈Ωijk
[zijk(ω)cijk(ω)]σk−1
σk dω
] σkσk−1
zijk: demand shifter that translates product attributes of the standard
• Standard adoption is voluntary but entails sunk investment costs a(zijk):
Standardizers: zijk = zjk > 1; a(zjk) > 0
Non-standardizers: zijk = 1; a(zjk) = 0
• Marginal production costs ztkijk• Heterogeneous firm setup with firm-level productivity ϕ.
9/30
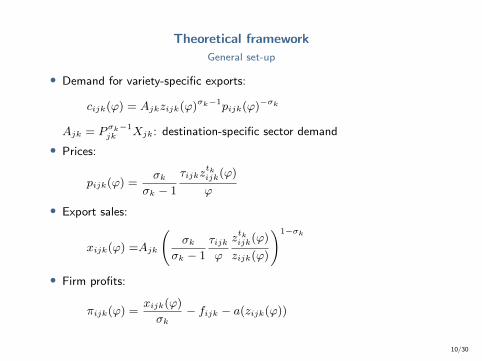
Theoretical framework
General set-up
• Demand for variety-specific exports:
cijk(ϕ) = Ajkzijk(ϕ)σk−1pijk(ϕ)−σk
Ajk = Pσk−1jk Xjk: destination-specific sector demand
• Prices:
pijk(ϕ) =σk
σk − 1
τijkztkijk(ϕ)
ϕ
• Export sales:
xijk(ϕ) =Ajk
(σk
σk − 1
τijkϕ
ztkijk(ϕ)
zijk(ϕ)
)1−σk
• Firm profits:
πijk(ϕ) =xijk(ϕ)
σk− fijk − a(zijk(ϕ))
10/30
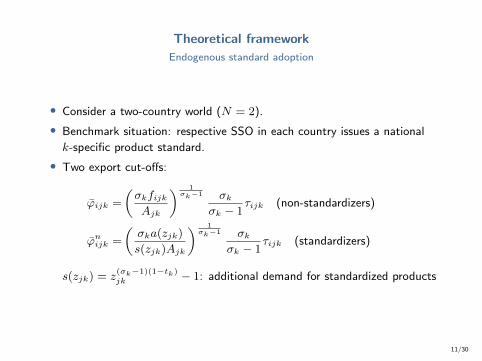
Theoretical framework
Endogenous standard adoption
• Consider a two-country world (N = 2).
• Benchmark situation: respective SSO in each country issues a national
k-specific product standard.
• Two export cut-offs:
ϕijk =
(σkfijkAjk
) 1σk−1 σk
σk − 1τijk (non-standardizers)
ϕnijk =
(σka(zjk)
s(zjk)Ajk
) 1σk−1 σk
σk − 1τijk (standardizers)
s(zjk) = z(σk−1)(1−tk)jk − 1: additional demand for standardized products
11/30
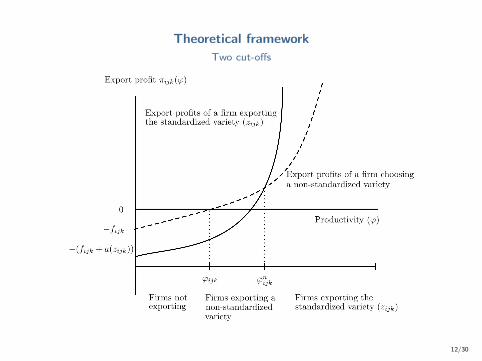
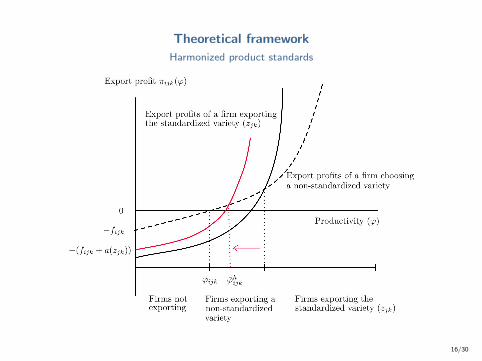
Theoretical framework
Two cut-offs
12/30
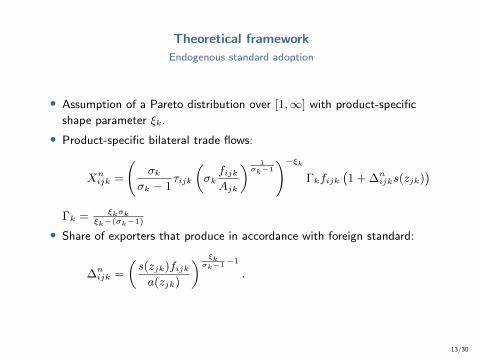
Theoretical framework
Endogenous standard adoption
• Assumption of a Pareto distribution over [1,∞] with product-specific
shape parameter ξk.
• Product-specific bilateral trade flows:
Xnijk =
(σk
σk − 1τijk
(σkfijkAjk
) 1σk−1
)−ξkΓkfijk
(1 + ∆n
ijks(zjk))
Γk = ξkσkξk−(σk−1)
• Share of exporters that produce in accordance with foreign standard:
∆nijk =
(s(zjk)fijka(zjk)
) ξkσk−1
−1
.
13/30
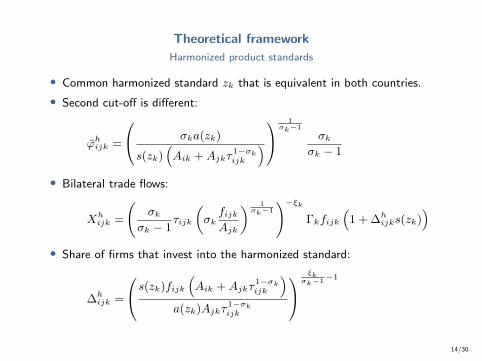
Theoretical framework
Harmonized product standards
• Common harmonized standard zk that is equivalent in both countries.
• Second cut-off is different:
ϕhijk =
σka(zk)
s(zk)(Aik +Ajkτ
1−σkijk
) 1σk−1
σkσk − 1
• Bilateral trade flows:
Xhijk =
(σk
σk − 1τijk
(σkfijkAjk
) 1σk−1
)−ξkΓkfijk
(1 + ∆h
ijks(zk))
• Share of firms that invest into the harmonized standard:
∆hijk =
s(zk)fijk(Aik +Ajkτ
1−σkijk
)a(zk)Ajkτ
1−σkijk
ξk
σk−1−1
14/30

Theoretical framework
Comparing national and harmonized standards: two effects
• Cost complementarity effect: always higher for harmonized standards
• Harmonized standards allow for complementarities in sunk investment costs.
• For a similar level of product attribute (zk = zjk), the share of exportersproducing the standardized variety is always higher (∆h
ijk > ∆nijk).
• Smaller markets profit from harmonized standards to a larger extent.
• Demand effect: captures the extent to which consumers value harmonizedstandards zk differently from national standards zjk
• Can be positive or negative.
Analytical expressions
15/30

Theoretical framework
Harmonized product standards
16/30
Theoretical framework
Harmonized product standards
16/30
Data sources
• Standard data from Searle Center (Northwestern University)
• Based on ICS classification system, use of 5 digit codes (405 classes)
• Cleaning SSO Industry
• Bilateral product-level trade data from Comtrade (UN)
• Use 4 digit HS code classification (1260 products).
• Firm-level trade data from French customs
• Sample period: 1995–2014
17/30

Linking standards to trade flows
Remedies
1 TBT IMS database from the WTO
• Technical Barriers to Trade (TBT) and Sanitary and Phytosanitary (SPS)notifications of WTO members
2 Keyword matching algorithm (see companion paper: Han et al. [2019])
• Keywords respectively from DIN and HS description
• Unbiased and comprehensive matching
• Drawback: quality of the match not as good as WTO table
• WTO table as benchmark, keyword matching table as robustness.
18/30
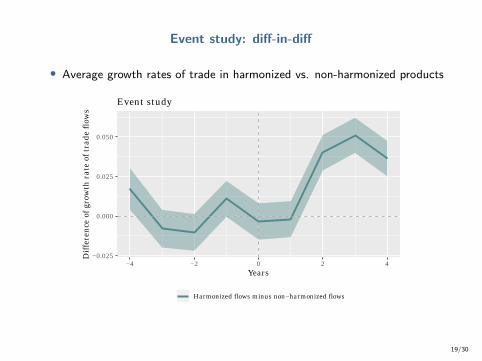
Event study: diff-in-diff
• Average growth rates of trade in harmonized vs. non-harmonized products
−0.025
0.000
0.025
0.050
−4 −2 0 2 4Years
Dif
fere
nce
of
grow
th r
ate
of t
rade
flo
ws
Harmonized flows minus non−harmonized flows
Event study
19/30
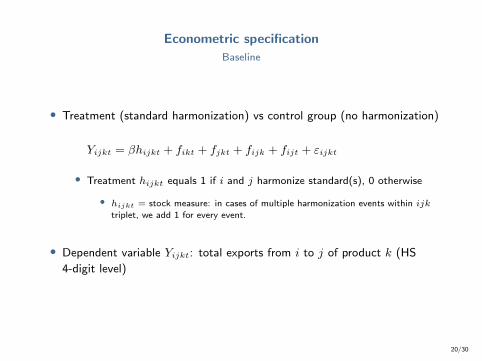
Econometric specification
Baseline
• Treatment (standard harmonization) vs control group (no harmonization)
Yijkt = βhijkt + fikt + fjkt + fijk + fijt + εijkt
• Treatment hijkt equals 1 if i and j harmonize standard(s), 0 otherwise
• hijkt = stock measure: in cases of multiple harmonization events within ijk
triplet, we add 1 for every event.
• Dependent variable Yijkt: total exports from i to j of product k (HS
4-digit level)
20/30
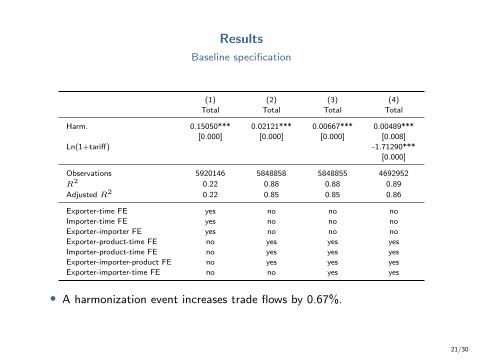
Results
Baseline specification
(1) (2) (3) (4)
Total Total Total Total
Harm. 0.15050*** 0.02121*** 0.00667*** 0.00489***
[0.000] [0.000] [0.000] [0.008]
Ln(1+tariff) -1.71290***
[0.000]
Observations 5920146 5848858 5848855 4692952
R2 0.22 0.88 0.88 0.89
Adjusted R2 0.22 0.85 0.85 0.86
Exporter-time FE yes no no no
Importer-time FE yes no no no
Exporter-importer FE yes no no no
Exporter-product-time FE no yes yes yes
Importer-product-time FE no yes yes yes
Exporter-importer-product FE no yes yes yes
Exporter-importer-time FE no no yes yes
• A harmonization event increases trade flows by 0.67%.
21/30
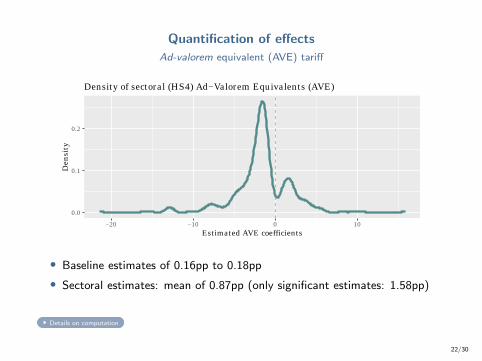
Quantification of effects
Ad-valorem equivalent (AVE) tariff
0.0
0.1
0.2
−20 −10 0 10Estimated AVE coefficients
Den
sity
Density of sectoral (HS4) Ad−Valorem Equivalents (AVE)
• Baseline estimates of 0.16pp to 0.18pp
• Sectoral estimates: mean of 0.87pp (only significant estimates: 1.58pp)
Details on computation
22/30
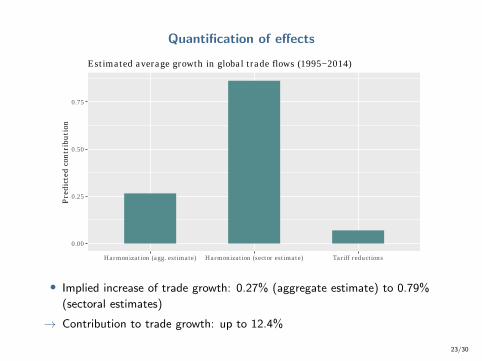
Quantification of effects
0.00
0.25
0.50
0.75
Harmonization (agg. estimate) Harmonization (sector estimate) Tariff reductions
Pre
dict
ed c
ontr
ibu
tion
Estimated average growth in global trade flows (1995−2014)
• Implied increase of trade growth: 0.27% (aggregate estimate) to 0.79%
(sectoral estimates)
→ Contribution to trade growth: up to 12.4%
23/30
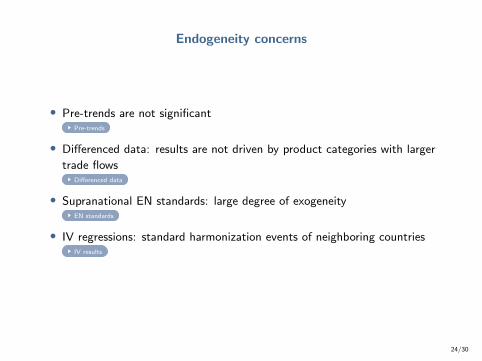
Endogeneity concerns
• Pre-trends are not significantPre-trends
• Differenced data: results are not driven by product categories with larger
trade flowsDifferenced data
• Supranational EN standards: large degree of exogeneityEN standards
• IV regressions: standard harmonization events of neighboring countriesIV results
24/30

Extensive and intensive margin
• Decomposition of French bilateral product-level trade flows into an
extensive and intensive margin:
log(Xijkt) = log(Mijkt) + log(xijkt)
(1) (2) (3)
Total Extensive
Margin
Intensive
Margin
Harmonization 0.01740*** 0.00319 0.01422***
[0.005] [0.108] [0.010]
Product-time FE yes yes yes
Importer-product FE yes yes yes
Importer-time FE yes yes yes
Observations 300457 300457 300457
R2 0.88 0.97 0.80
Adjusted R2 0.87 0.96 0.78
• Results driven by higher intensive margin, no effect on extensive margin.
25/30
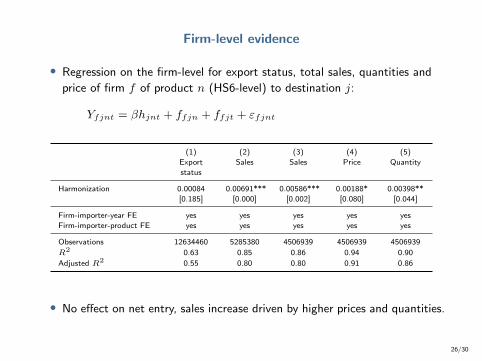
Firm-level evidence
• Regression on the firm-level for export status, total sales, quantities and
price of firm f of product n (HS6-level) to destination j:
Yfjnt = βhjnt + ffjn + ffjt + εfjnt
(1) (2) (3) (4) (5)
Export
status
Sales Sales Price Quantity
Harmonization 0.00084 0.00691*** 0.00586*** 0.00188* 0.00398**
[0.185] [0.000] [0.002] [0.080] [0.044]
Firm-importer-year FE yes yes yes yes yes
Firm-importer-product FE yes yes yes yes yes
Observations 12634460 5285380 4506939 4506939 4506939
R2 0.63 0.85 0.86 0.94 0.90
Adjusted R2 0.55 0.80 0.80 0.91 0.86
• No effect on net entry, sales increase driven by higher prices and quantities.
26/30
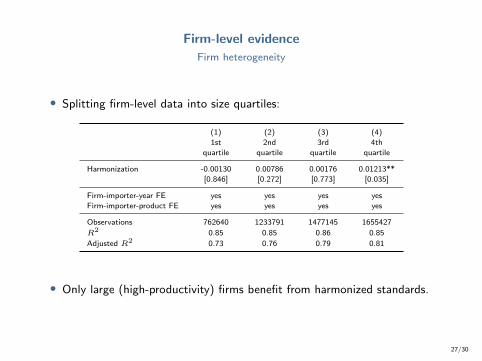
Firm-level evidence
Firm heterogeneity
• Splitting firm-level data into size quartiles:
(1) (2) (3) (4)
1st
quartile
2nd
quartile
3rd
quartile
4th
quartile
Harmonization -0.00130 0.00786 0.00176 0.01213**
[0.846] [0.272] [0.773] [0.035]
Firm-importer-year FE yes yes yes yes
Firm-importer-product FE yes yes yes yes
Observations 762640 1233791 1477145 1655427
R2 0.85 0.85 0.86 0.85
Adjusted R2 0.73 0.76 0.79 0.81
• Only large (high-productivity) firms benefit from harmonized standards.
27/30

Evidence on demand-shifting
• Interaction with dummy for horizontally differentiated goods [Rauch, 1999]
and for above-median “quality ladder” index [Khandelwal, 2010]:
(1) (2) (3)
Total Total Total
Harmonization 0.00157 0.00167 -0.00043
[0.488] [0.405] [0.850]
Harmonization x Rauch index 0.01692*** 0.01399***
[0.000] [0.000]
Harmonization x Quality ladder 0.02168*** 0.01487***
[0.000] [0.001]
Exporter-product-time FE yes yes yes
Importer-product-time FE yes yes yes
Exporter-importer-product FE yes yes yes
Exporter-importer-time FE yes yes yes
Observations 5176560 5848855 5176560
R2 0.88 0.88 0.88
Adjusted R2 0.85 0.85 0.85
• Differentiated goods drive results.
28/30
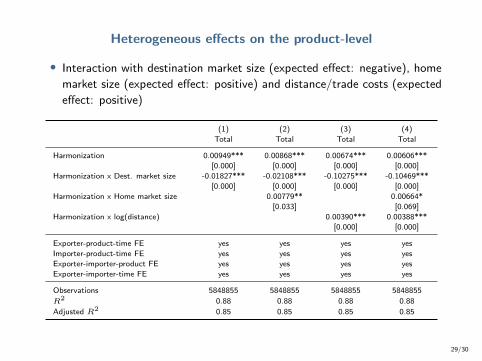
Heterogeneous effects on the product-level
• Interaction with destination market size (expected effect: negative), home
market size (expected effect: positive) and distance/trade costs (expected
effect: positive)
(1) (2) (3) (4)
Total Total Total Total
Harmonization 0.00949*** 0.00868*** 0.00674*** 0.00606***
[0.000] [0.000] [0.000] [0.000]
Harmonization x Dest. market size -0.01827*** -0.02108*** -0.10275*** -0.10469***
[0.000] [0.000] [0.000] [0.000]
Harmonization x Home market size 0.00779** 0.00664*
[0.033] [0.069]
Harmonization x log(distance) 0.00390*** 0.00388***
[0.000] [0.000]
Exporter-product-time FE yes yes yes yes
Importer-product-time FE yes yes yes yes
Exporter-importer-product FE yes yes yes yes
Exporter-importer-time FE yes yes yes yes
Observations 5848855 5848855 5848855 5848855
R2 0.88 0.88 0.88 0.88
Adjusted R2 0.85 0.85 0.85 0.85
29/30

Conclusion
• Novel database that tracks national and international product standards.
• Quantification of their impact on international trade: largely
outnumbering the effect of tariff reductions.
→ Uncover an industrial feature that can explain high levels of trade
integration among industrialized countries.
• Aggregate, average effect: abstract from standard-specific mechanisms.
• Further research: development and accreditation of standards.
• Optimality of the standard-setting process?
• Standard-essential patents and market-structure [Schmalensee, 2009, Llanesand Poblete, 2014, Lerner and Tirole, 2015]
• Effect on innovation/growth when an industry becomes “locked in” acertain technology [David, 1985, Farrell and Saloner, 1985, 1986]
Additional exercises
30/30

Appendix
30/30

Theoretical framework
Comparing national and harmonized standards: two effects
Xhijk −Xn
ijk =
(λh − λn
)s(zjk)
ξkσk−1︸ ︷︷ ︸
cost complementarity effect
+λh(s(zk)
ξkσk−1 − s(zjk)
ξkσk−1
)︸ ︷︷ ︸
demand effect
λh =
fijka(zk)
(Aik +Ajkτ
1−σkijk
)Ajkτ
1−σkijk
ξk
σk−1−1
λn =
(fijka(zjk)
) ξkσk−1
−1
Back
30/30
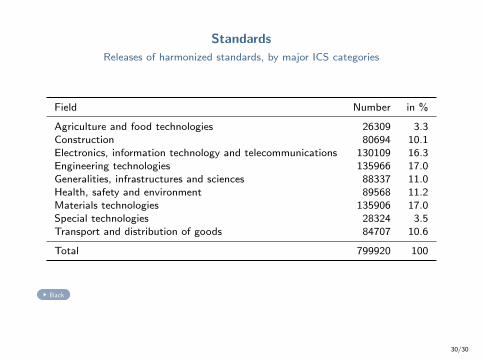
Standards
Releases of harmonized standards, by major ICS categories
Field Number in %
Agriculture and food technologies 26309 3.3Construction 80694 10.1Electronics, information technology and telecommunications 130109 16.3Engineering technologies 135966 17.0Generalities, infrastructures and sciences 88337 11.0Health, safety and environment 89568 11.2Materials technologies 135906 17.0Special technologies 28324 3.5Transport and distribution of goods 84707 10.6
Total 799920 100
Back
30/30
Standards
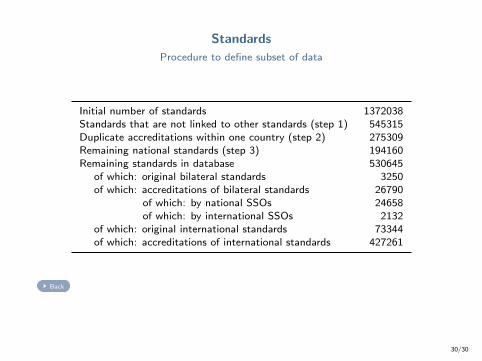
Procedure to define subset of data
Initial number of standards 1372038Standards that are not linked to other standards (step 1) 545315Duplicate accreditations within one country (step 2) 275309Remaining national standards (step 3) 194160Remaining standards in database 530645
of which: original bilateral standards 3250of which: accreditations of bilateral standards 26790
of which: by national SSOs 24658of which: by international SSOs 2132
of which: original international standards 73344of which: accreditations of international standards 427261
Back
30/30
Standards
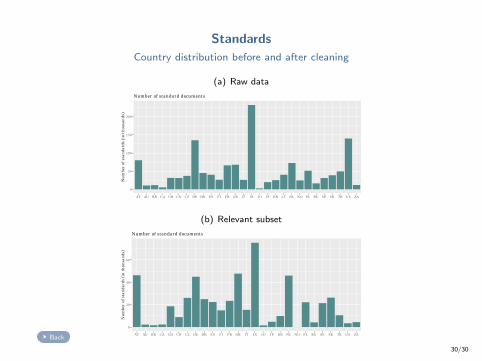
Country distribution before and after cleaning
(a) Raw data
0
50
100
150
200
AT AU BR CA CH CN CZ DE DK ES FI FR GB IT IX JO JP KR LT NL NO PL RU SE SK TR US ZA
Nu
mbe
r of
sta
nda
rds
(in
th
ousa
nds
)
Number of standard documents
(b) Relevant subset
0
20
40
60
AT AU BR CA CH CN CZ DE DK ES FI FR GB IT IX JO JP KR NL NO PL RU SE SK TR US ZA
Nu
mbe
r of
sta
nda
rds
(in
th
ousa
nds
)
Number of standard documents
Back
30/30
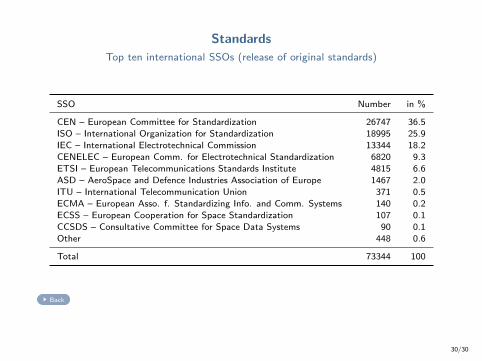
Standards
Top ten international SSOs (release of original standards)
SSO Number in %
CEN – European Committee for Standardization 26747 36.5ISO – International Organization for Standardization 18995 25.9IEC – International Electrotechnical Commission 13344 18.2CENELEC – European Comm. for Electrotechnical Standardization 6820 9.3ETSI – European Telecommunications Standards Institute 4815 6.6ASD – AeroSpace and Defence Industries Association of Europe 1467 2.0ITU – International Telecommunication Union 371 0.5ECMA – European Asso. f. Standardizing Info. and Comm. Systems 140 0.2ECSS – European Cooperation for Space Standardization 107 0.1CCSDS – Consultative Committee for Space Data Systems 90 0.1Other 448 0.6
Total 73344 100
Back
30/30

Quantification of effects
Ad-valorem equivalent (AVE) tariff
• Calculation of AVE tariff following Kee et al. [2009]:
AV E =
(exp(β)− 1
σ
)100.
• Two approaches:
1 Take baseline estimate of the harmonization dummy in column (4) for β andthe estimated coefficient of the average applied tariff rate minus one for σ.
2 Value 4 from Head and Mayer [2014] for σ and the baseline estimate of theharmonization dummy in column (3) for β.
→ Aggregate AVE between 0.16pp and 0.18pp.
• Product-specific ad-valorem equivalents (using 4-digit HS import demand
elasticity estimates from Soderbery [2018] ):
log(Xkijt)− σk log(1 + tijkt) = β1,kh
kijt + fit + fjt + fij + εijt.
→ Cross-sector average: 0.87pp (only significant estimates: 1.58pp)
Back
30/30
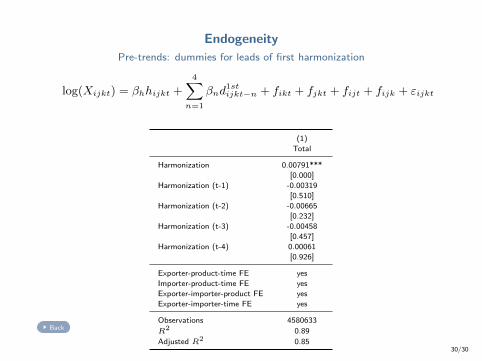
Endogeneity
Pre-trends: dummies for leads of first harmonization
log(Xijkt) = βhhijkt +4∑
n=1
βnd1stijkt−n + fikt + fjkt + fijt + fijk + εijkt
(1)
Total
Harmonization 0.00791***
[0.000]
Harmonization (t-1) -0.00319
[0.510]
Harmonization (t-2) -0.00665
[0.232]
Harmonization (t-3) -0.00458
[0.457]
Harmonization (t-4) 0.00061
[0.926]
Exporter-product-time FE yes
Importer-product-time FE yes
Exporter-importer-product FE yes
Exporter-importer-time FE yes
Observations 4580633
R2 0.89
Adjusted R2 0.85
Back
30/30
Endogeneity
Differenced data
• Endogeneity concern: countries harmonize standards of products with
large trade flows.
• Address endogeneity by differencing the data:
∆ log(Yijkt) = β∆ hijkt + fikt + fjkt + fijt + εijkt
• Harmonization dummy equals 1 (hijkt) if i and j harmonize standard(s) inproduct class k in year t , 0 otherwise.
• Taking care of medium-rum and potential anticipation effects [Baier et al.,
2014]: take differences of several years.
Back
30/30

Endogeneity
Differenced data
(1) (2) (3) (4) (5)
∆t−1 Total ∆t−2 Total ∆t−3 Total ∆t−4 Total ∆t−5 Total
Harmonization -0.00132 0.00301* 0.00630*** 0.00573*** 0.00568***
[0.533] [0.094] [0.000] [0.001] [0.001]
Exporter-product-time FE yes yes yes yes yes
Importer-product-time FE yes yes yes yes yes
Exporter-importer-time FE yes yes yes yes yes
Exporter-importer-product FE yes yes yes yes yes
Observations 5017031 4676493 4370967 4078732 3794623
R2 0.22 0.25 0.27 0.30 0.32
Adjusted R2 0.08 0.11 0.13 0.16 0.19
Back
30/30
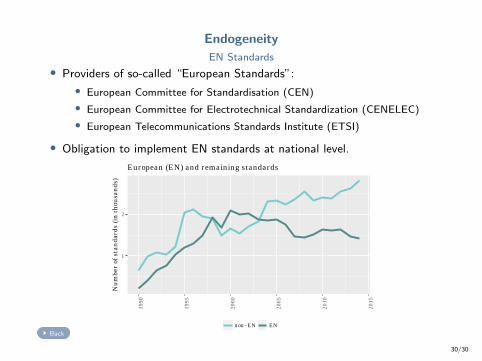
Endogeneity
EN Standards
• Providers of so-called “European Standards”:
• European Committee for Standardisation (CEN)
• European Committee for Electrotechnical Standardization (CENELEC)
• European Telecommunications Standards Institute (ETSI)
• Obligation to implement EN standards at national level.
1
2
1990
1995
2000
2005
2010
2015
Nu
mbe
r of
sta
nda
rds
(in
th
ousa
nds
)
non−EN EN
European (EN) and remaining standards
Back
30/30
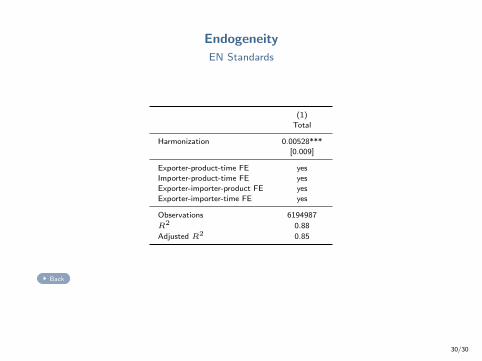
Endogeneity
EN Standards
(1)
Total
Harmonization 0.00528***
[0.009]
Exporter-product-time FE yes
Importer-product-time FE yes
Exporter-importer-product FE yes
Exporter-importer-time FE yes
Observations 6194987
R2 0.88
Adjusted R2 0.85
Back
30/30
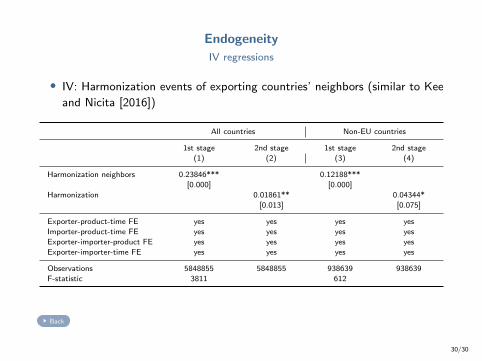
Endogeneity
IV regressions
• IV: Harmonization events of exporting countries’ neighbors (similar to Kee
and Nicita [2016])
All countries Non-EU countries
1st stage 2nd stage 1st stage 2nd stage
(1) (2) (3) (4)
Harmonization neighbors 0.23846*** 0.12188***
[0.000] [0.000]
Harmonization 0.01861** 0.04344*
[0.013] [0.075]
Exporter-product-time FE yes yes yes yes
Importer-product-time FE yes yes yes yes
Exporter-importer-product FE yes yes yes yes
Exporter-importer-time FE yes yes yes yes
Observations 5848855 5848855 938639 938639
F-statistic 3811 612
Back
30/30
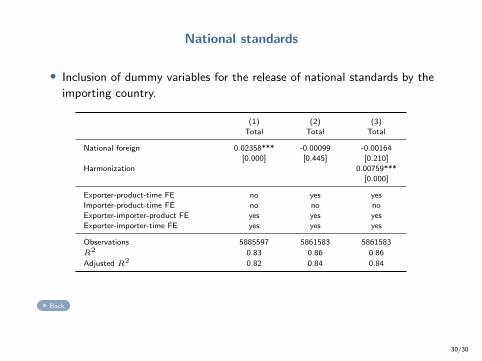
National standards
• Inclusion of dummy variables for the release of national standards by the
importing country.
(1) (2) (3)
Total Total Total
National foreign 0.02358*** -0.00099 -0.00164
[0.000] [0.445] [0.210]
Harmonization 0.00759***
[0.000]
Exporter-product-time FE no yes yes
Importer-product-time FE no no no
Exporter-importer-product FE yes yes yes
Exporter-importer-time FE yes yes yes
Observations 5885597 5861583 5861583
R2 0.83 0.86 0.86
Adjusted R2 0.82 0.84 0.84
Back
30/30
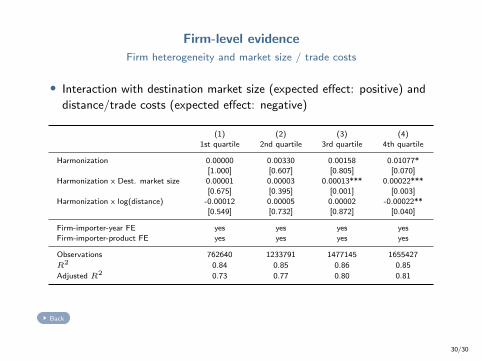
Firm-level evidence
Firm heterogeneity and market size / trade costs
• Interaction with destination market size (expected effect: positive) and
distance/trade costs (expected effect: negative)
(1) (2) (3) (4)
1st quartile 2nd quartile 3rd quartile 4th quartile
Harmonization 0.00000 0.00330 0.00158 0.01077*
[1.000] [0.607] [0.805] [0.070]
Harmonization x Dest. market size 0.00001 0.00003 0.00013*** 0.00022***
[0.675] [0.395] [0.001] [0.003]
Harmonization x log(distance) -0.00012 0.00005 0.00002 -0.00022**
[0.549] [0.732] [0.872] [0.040]
Firm-importer-year FE yes yes yes yes
Firm-importer-product FE yes yes yes yes
Observations 762640 1233791 1477145 1655427
R2 0.84 0.85 0.86 0.85
Adjusted R2 0.73 0.77 0.80 0.81
Back
30/30
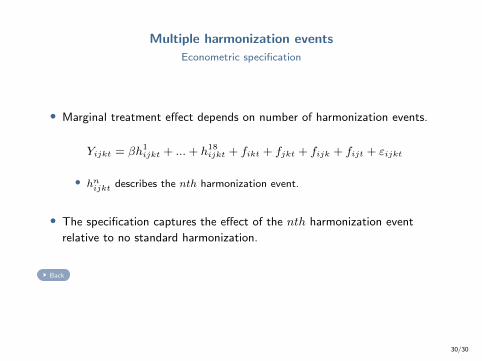
Multiple harmonization events
Econometric specification
• Marginal treatment effect depends on number of harmonization events.
Yijkt = βh1ijkt + ...+ h18
ijkt + fikt + fjkt + fijk + fijt + εijkt
• hnijkt describes the nth harmonization event.
• The specification captures the effect of the nth harmonization event
relative to no standard harmonization.
Back
30/30
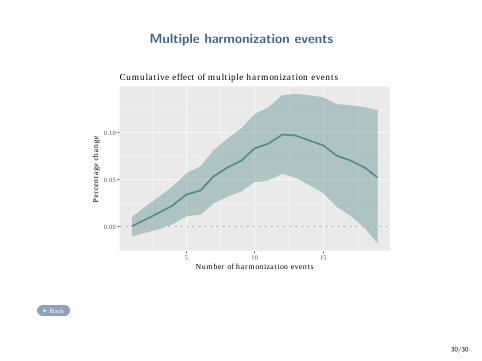
Multiple harmonization events
0.00
0.05
0.10
5 10 15Number of harmonization events
Per
cen
tage
ch
ange
Cumulative effect of multiple harmonization events
Back
30/30
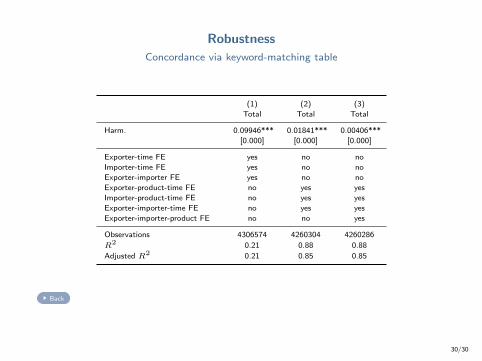
Robustness
Concordance via keyword-matching table
(1) (2) (3)
Total Total Total
Harm. 0.09946*** 0.01841*** 0.00406***
[0.000] [0.000] [0.000]
Exporter-time FE yes no no
Importer-time FE yes no no
Exporter-importer FE yes no no
Exporter-product-time FE no yes yes
Importer-product-time FE no yes yes
Exporter-importer-time FE no yes yes
Exporter-importer-product FE no no yes
Observations 4306574 4260304 4260286
R2 0.21 0.88 0.88
Adjusted R2 0.21 0.85 0.85
Back
30/30

Robustness
PPML estimates
(1) (2) (3)
Total Total Total
Harmonization 0.12745*** 0.03683*** 0.00267*
[0.000] [0.000] [0.061]
Exporter-time FE yes no no
Importer-time FE yes no no
Exporter-importer FE yes no no
Exporter-product-time FE no yes yes
Importer-product-time FE no yes yes
Exporter-importer-time FE no yes yes
Exporter-importer-product FE no no yes
Observations 10694300 9815057 8622827
Back
30/30
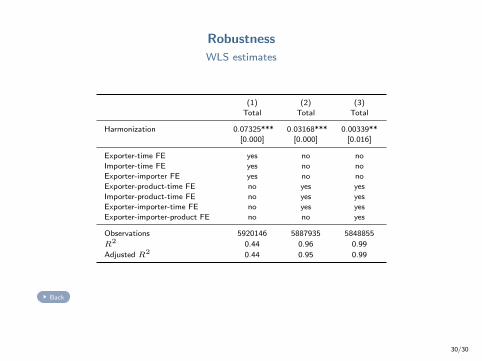
Robustness
WLS estimates
(1) (2) (3)
Total Total Total
Harmonization 0.07325*** 0.03168*** 0.00339**
[0.000] [0.000] [0.016]
Exporter-time FE yes no no
Importer-time FE yes no no
Exporter-importer FE yes no no
Exporter-product-time FE no yes yes
Importer-product-time FE no yes yes
Exporter-importer-time FE no yes yes
Exporter-importer-product FE no no yes
Observations 5920146 5887935 5848855
R2 0.44 0.96 0.99
Adjusted R2 0.44 0.95 0.99
Back
30/30
Recommended