No. 2003–75
COUNTRY AND CONSUMER SEGMENTATION: MULTI-LEVEL LATENT CLASS ANALYSIS OF FINANCIAL PRODUCT
OWNERSHIP
By Tammo H.A. Bijmolt, Leo J. Paas, Jeroen K. Vermunt
August 2003
ISSN 0924-7815
Country and Consumer Segmentation:
Multi-Level Latent Class Analysis
of Financial Product Ownership
Tammo H.A. Bijmolt1
Leo J. Paas1
Jeroen K. Vermunt2
1. Tilburg University, Department of Marketing
PO Box 90153, 5000 LE, Tilburg, The Netherlands
Phone: +13-13-4663022, Fax: +31-13-4668354,
2. idem, Department of Methodology and Statistics
1
Country and Consumer Segmentation:
Multi-Level Latent Class Analysis
of Financial Product Ownership
ABSTRACT
The financial services sector has internationalized over the last few decades. Important differences and
similarities in financial behavior can be anticipated between both consumers within a particular
country and those living in different countries. For companies in this market, the appropriate choice
between strategic options and the resulting international performance may critically depend on the
cross-national demand structure for the various financial products. Insight into country segments and
international consumer segments based on domain-specific behavioral variables will therefore be of
key strategic importance. We present a multi-level latent class framework for obtaining simultaneously
such country and consumer segments. In an empirical study we apply this methodology to data on
ownership of eight financial products. Information is available for fifteen European countries, with a
sample size of about 1000 consumers per country. We find that both country segments and consumer
segments are highly interpretable. Furthermore, consumer segmentation is related to demographic
variables such as age and income. Our conclusions feature implications, both academic and
managerial, and directions for future research.
JEL codes: C2, D1, F00, G1, M31
Key words: International market segmentation, Household portfolios of financial products, Latent class
analysis, Multi-level analysis

2
INTRODUCTION
The market for financial products has become more international - even global - in the past few
decades. Contemporary financial institutions often sell their products to consumers outside their
national market (Chryssochoidis and Wong, 2000) or are involved in international mergers,
acquisitions, or alliances (Berger, Dai, Ongena, and Smith, 2003; Focarelli and Pozzolo, 2001; Glaister
and Thwaites, 1994; Marois, 1997). However, positioning one’s products and targeting consumers
across multiple nations raises new challenges and requires specific competences (see, for example,
Kotabe and Helsen 2001, Chapter 7, and Jain, 1993, Chapter 11). When formulating an international
marketing strategy, a firm must have a thorough understanding of the demand side in the various
foreign markets and the ability to act upon these insights.
Household ownership of financial products is a fundamental element of this market. It has been
shown that household ownership represents highly relevant information for corporate decision-makers
to support decisions regarding product development and introduction, cross-selling, and segmentation
(Dickenson and Kirzner, 1986; Kamakura, Ramaswami, and Srivastava, 1991; Kamakura and Wedel,
2003; Kamakura, Wedel, De Rosa, and Mazzon, 2003; Paas, 1998 and 2001; Ramaswami, Srivastava,
and McInish, 1992; Ramaswamy, Chatterjee, and Chen, 1996; Soutar and Cornish-Ward, 1997). The
portfolio of financial products owned by a household has consequently received considerable attention
in both the marketing and economic literature (for a recent overview of the economic literature, see
Guiso, Haliassos, and Jappelli, 2002). Additionally, marketing research on financial markets, including
on household ownership patterns, has increased considerably throughout Europe (Bartram, 1998). In
internationalized markets specifically, insights in cross-national similarities and differences in
ownership patterns of financial and other products may reveal fruitful directions for international
marketing strategy formulation (Ganesh, 1998; Helsen, Jedidi, and DeSarbo, 1993; Kumar, Ganesh,
and Echambadi, 1998; Paas, 2001).

3
Segmentation will play an essential role in the formulation of an international marketing
strategy based on the insights on the demand side of the market, because of cross-border dissimilarities
and similarities in consumer needs, preferences, and behavior. Acting upon these dissimilarities and
similarities calls for the grouping and subsequent targeting of countries and consumers within these
countries. Furthermore, assessment and implementation of international segmentation requires specific
procedures and methodologies that take account of the international setting of the issue under study.
For many years, however, the issue of international market segmentation, has been largely ignored in
the academic literature (Douglas and Craig, 1992), although interest has increased since the beginning
of the ’90s (Steenkamp and Ter Hofstede, 2002).
Structuring the heterogeneity of international markets may refer to the act of grouping countries
or consumers into segments. Companies use country segmentation to select entire foreign markets, and
consumer segmentation to target specific groups of consumers within and across countries. Studies on
international segmentation typically assess either country segments or consumer segments (for an
overview, see Steenkamp and Ter Hofstede, 2002). Recently, Kotabe and Helsen (2001) and
Steenkamp and Ter Hofstede (2002) proposed a two-stage framework to combine such country and
consumer segmentations, which should result in a more comprehensive understanding of the demand
structure of international markets.
The contribution of this paper is twofold. First, we propose a methodological framework for
international segmentation in which we build on the notion of combining the segmentation of countries
and consumers by Kotabe and Helsen (2001) and Steenkamp and Ter Hofstede (2002). The
methodology underlying the model is based on multi-level latent class analysis, as recently proposed
by Vermunt (2003). New in our approach is the framework for simultaneously deriving country
segments and cross-national consumer segments on the basis of disaggregate data on consumer
behavior. In particular, country segmentation will be determined on the basis of the relative sizes of the
cross-national consumer segments. The simultaneous approach has the advantage that both country-
4
specific and cross-national consumer segments can be accommodated. Furthermore, the resulting
country segments will be highly relevant for international marketing management, thanks to the direct
connection between the country and consumer segmentations.
Next to the methodological objective, we aim at a substantive contribution, namely enhancing
the understanding of ownership patterns of financial products. Most previous research concentrated on
such patterns in a single country (e.g. Dickenson and Kirzner, 1986; Kamakura et al., 1991). To the
best of our knowledge, Paas (2001) is the only international study on differences between consumers
living in different countries. However, Paas (2001) did not study differences between consumers in the
same country, which are expected to be substantial in most cases. Here, we will assess the similarities
and differences across a large set of European countries. In particular, we study the extent to which
there are cross-national versus country-specific consumer segments defined by ownership patterns and
whether groups of countries exist that are homogenous in their consumer segment structure.
To realize these two contributions, we first discuss the concept of international segmentation
and the framework of simultaneous country and consumer segmentation. We present the
methodological framework of multi-level latent class modeling to perform the segmentation analysis.
Next, we discuss the market of financial products. In an empirical study, we apply the methodology
proposed to obtain country and consumer segments within the market of financial products. The
segmentation is based on information regarding the ownership of eight financial products. Data is
available for fifteen EU countries, with a sample size of about 1000 consumers per country. We
conclude with both academic and managerial implications, and directions for future research.
INTERNATIONAL SEGMENTATION
International segmentation aims to structure the heterogeneity that exists among countries and
consumers by identifying relatively homogenous segments of countries and/or consumers. The

5
structure that is revealed through such segmentations helps companies to develop and implement
international marketing strategies.
International studies have traditionally focused on the country as the basic unit of analysis
(Douglas and Craig, 1992; Steenkamp and Ter Hofstede, 2002). International segmentation thus
typically consists of a preliminary screening of countries to identify which are potentially the most
interesting (Kotabe and Helsen, 2001, p. 220). Through a strategic analysis of opportunities and risks
within this primary set of countries, management decides upon its country portfolio (Harrell and
Kiefer, 1993; Perlitz, 1985). Next, international segmentation is used for grouping the selected
countries (Helsen, et al., 1993). Such country selections and classifications are usually based on
aggregate data (at a national level) reflecting demographic, socio-economic, political, and cultural
factors (Jain, 1993, p. 425-437; Nachum, 1994), instead of consumer-level and domain-specific
variables. Variables specific for a certain domain, e.g. product ownership or benefits, however, are
often more effective segmentation bases than general variables (Van Raaij and Verhallen, 1994; Wedel
and Kamakura, 2000). Recently, penetration rates of products and international diffusion patterns have
been suggested as a means for comparing, selecting and segmenting countries (e.g. DeKimpe, Parker,
and Sarvary, 2000; Ganesh, 1998; Helsen, et al., 1993; Kumar, et al., 1998). However, in research
exploring international segmentation, little attention has been directed towards within-country
differences and to the behavioral variables measured at the consumer level.
Only a few studies have addressed the international segmentation issue by deriving cross-
national segments of consumers (e.g. Luqmani, Yavas, and Quraeshi, 1994; Ter Hofstede, Steenkamp
and Wedel, 1999), which could be due to the relative high cost and low availability of international
databases at the consumer level. The research process to arrive at such international consumer
segmentations is partly analogous to segmentation within a single country. To a large extent, the same
consumer variables could be applied as segmentation bases, and the same criteria for effective
segmentation hold (see, for example, Chapters 1 and 2 of Wedel and Kamakura, 2000). However, the

6
international nature of the problem at hand introduces additional conceptual and methodological
challenges (for a recent overview, see Steenkamp and Ter Hofstede, 2002).
A particularly promising approach - namely a two-stage approach to international segmentation
- has been proposed by Kotabe and Helsen (2001, p. 225) and Steenkamp and Ter Hofstede (2002).
Countries are screened, selected and grouped, in the first step (similarly to international country
segmentation as previously discussed). In the second step consumer segments are derived with either a
cross-national analysis or a country-by-country analysis. In case of the latter, consumer segmentation
per country, similarities between country-specific segments could be assessed across the countries.
Here, we build on the work by Kotabe and Helsen (2001) and Steenkamp and Ter Hofstede
(2002) and propose the study of country segmentation and consumer segmentation in a single step,
instead of sequentially. Segmentation at both levels is thereby based on disaggregate, domain-specific
behavioral variables, such as product usage or ownership. Consumers are grouped on the basis of
individual behavioral characteristics. Parallel to consumer segmentation, the formation of country
segments is based on the relative size of the consumer segments. Two countries will belong to same
country segment if they are highly similar in the within-country structure of consumer segmentation.
This direct connection between the country and consumer segmentations, ensures the resulting country
segments to be highly relevant and actionable for international marketing management. Furthermore,
as will be illustrated in the empirical study, a particular consumer segment obtained with our approach
can be cross-national, because it can be present in multiple country segments or in a single country
segment containing multiple countries. However, a consumer segment can potentially be country-
specific also, namely if it is present only in a single country segment which consists of just one
country. Hence, the procedure proposed here is flexible in the characteristics of the segmentation and
yields complete information on the segment structure of the international market.
7
MULTI-LEVEL LATENT CLASS ANALYSIS
Model Formulation
Latent class analysis or mixture modeling has been suggested as a model-based tool for regular market
segmentation (Wedel and Kamakura, 2000) and international segmentation (Steenkamp and Ter
Hofstede, 2002). Here, we present the method of multi-level latent class analysis to attain
simultaneously country segmentation and cross-national consumer segmentation.
Suppose data is available on an international sample of consumers, denoted i = 1,.., I,
originating from a set of countries, denoted j = 1,..., J. For each individual i, it is recorded whether this
person owns each product from a set of products, denoted k = 1,..., K, where Yijk = 1, if consumer i
from country j owns product k, and Yijk = 0 otherwise. The ownership data of an individual i is
collected in vector Yij, and Yj denotes the observed ownership data of all consumers of country j. The
international sample of consumers is assumed to represent a limited number of consumer segments,
denoted s = 1 ,…, S. Furthermore, the countries under study are assumed to belong to a limited number
of country segments, denoted t = 1 ,…, T. Discrete latent variables Xij and Zj represent the consumer
segment and country segment membership, respectively.
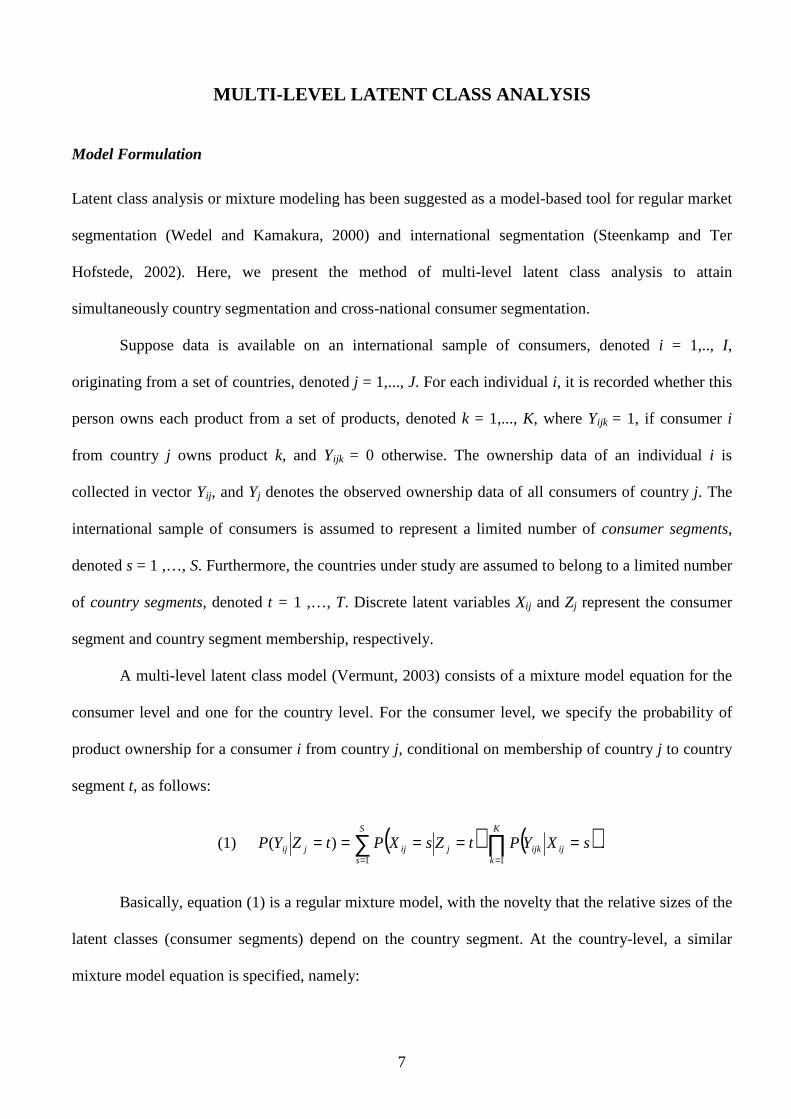
A multi-level latent class model (Vermunt, 2003) consists of a mixture model equation for the
consumer level and one for the country level. For the consumer level, we specify the probability of
product ownership for a consumer i from country j, conditional on membership of country j to country
segment t, as follows:
(1) ( ) ( )∑ ∏= =
=====S
s
K
kijijkjijjij sXYPtZsXPtZYP
1 1
)( .
Basically, equation (1) is a regular mixture model, with the novelty that the relative sizes of the
latent classes (consumer segments) depend on the country segment. At the country-level, a similar
mixture model equation is specified, namely:

8
(2) ( ) ( ) ,)(1 1
∑ ∏= =
===T
t
N
ijijjj
j
tZYPtZPYP
where Nj denotes the sample size in country j. Combining equations (1) and (2) yields:
(3) ( ) ( ) ( )∑ ∑ ∏∏= = ==
=====
T
t
S
s
K
kijijkjij
N
ijj sXYPtZsXPtZPYP
j
1 1 11
)( .
The right-hand side of equation (3) consists of three components, respectively: a) the
probability that country j belongs to a particular country segment, b) the probability that consumer j
belongs to a particular consumer segment, given the country segment membership, and c) the
probability of a consumer owning a particular product k, given the consumer segment membership.
Hence, the probability of observing the ownership data is a weighted average probability, where the
weights are the country segment and consumer segment probabilities.
Component c) of equation (3) captures the key differences between consumer segments,
namely the conditional probability that a consumer owns a particular product k. This is modeled in the
form of a logit equation:
(4) ( ) ( )( )ks
ksijijk sXYP
ββ
exp1
exp1
+=== .
Component b) of equation (3) captures the key differences between the country segments,
namely the relative size of each of the consumer segments. This is also modeled through a logit
equation:
(5) ( ) ( )( )∑ =
===S
s st
tsjij tZsXP
1
’
exp
exp’
γγ
.
Next to differences between countries in the relative size of consumer segments, we anticipate
effects of consumer characteristics, e.g. demographic variables, on consumer segment membership.
9
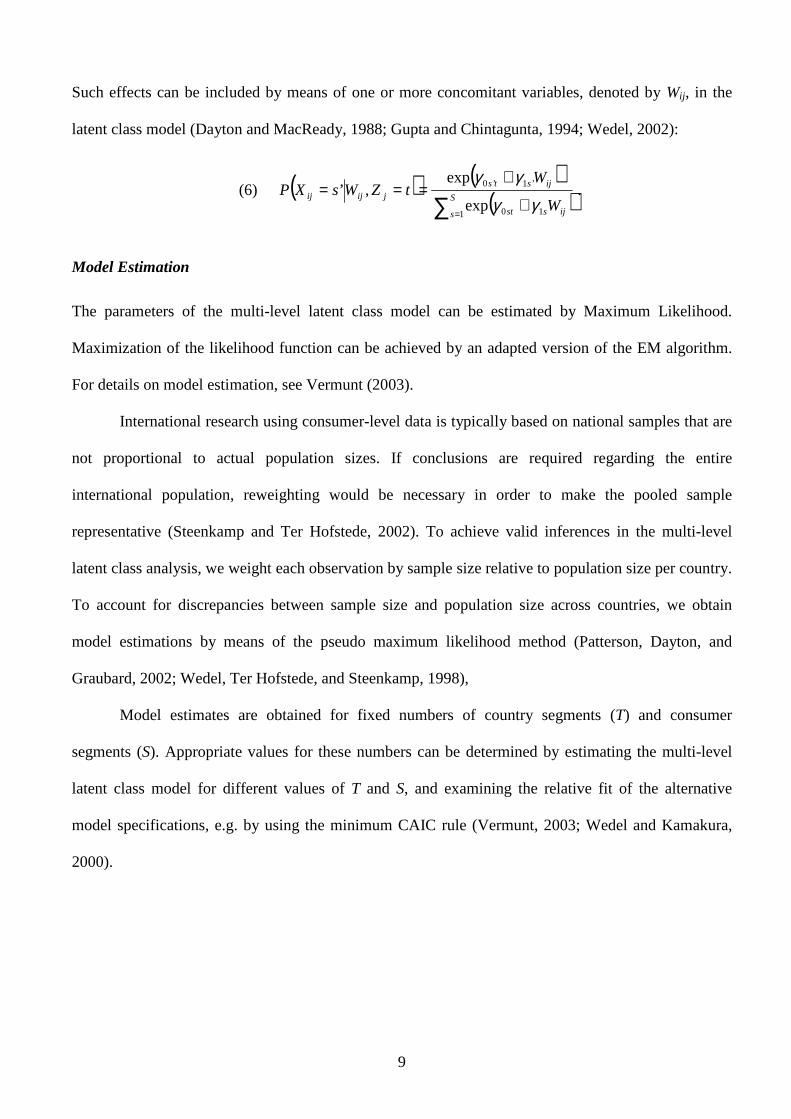
Such effects can be included by means of one or more concomitant variables, denoted by Wij, in the
latent class model (Dayton and MacReady, 1988; Gupta and Chintagunta, 1994; Wedel, 2002):
(6) ( ) ( )( ) .
exp
exp,’
1 10
’1’0
∑ =+
+===
S
s ijsst
ijstsjijij
W
WtZWsXP
γγ
γγ
Model Estimation
The parameters of the multi-level latent class model can be estimated by Maximum Likelihood.
Maximization of the likelihood function can be achieved by an adapted version of the EM algorithm.
For details on model estimation, see Vermunt (2003).
International research using consumer-level data is typically based on national samples that are
not proportional to actual population sizes. If conclusions are required regarding the entire
international population, reweighting would be necessary in order to make the pooled sample
representative (Steenkamp and Ter Hofstede, 2002). To achieve valid inferences in the multi-level
latent class analysis, we weight each observation by sample size relative to population size per country.
To account for discrepancies between sample size and population size across countries, we obtain
model estimations by means of the pseudo maximum likelihood method (Patterson, Dayton, and
Graubard, 2002; Wedel, Ter Hofstede, and Steenkamp, 1998),
Model estimates are obtained for fixed numbers of country segments (T) and consumer
segments (S). Appropriate values for these numbers can be determined by estimating the multi-level
latent class model for different values of T and S, and examining the relative fit of the alternative
model specifications, e.g. by using the minimum CAIC rule (Vermunt, 2003; Wedel and Kamakura,
2000).
10
EMPIRICAL STUDY: THE MARKET FOR FINANCIAL PRODUCTS
Internationalization of the Market for Financial Products
The financial service sector has become internationalized over the last few decades. Most
contemporary banks, insurance companies, and other financial service providers nowadays operate in
multiple countries. The internationalization of the market for financial products has been stimulated by
deregulation of the sector and improvements of information technology. Additionally, the foundation
of a single market within the European Union and the introduction of the Euro have accelerated the
internationalization process within Europe. Nevertheless, internationalization of the financial services
industry still lags behind many other industries and is often not quite successful (Berger, et al., 2003).
Managers in this internationalized market face strategic issues, such as whether or not the same
strategy can be used in several countries. Firms offering financial products turn out to differ
considerably in their strategies for survival in an increasingly international environment (Marois,
1997). The strategic options are direct selling of their products (Chryssochoidis and Wong, 2000) or
cross-national mergers, acquisitions, or alliances (Berger et al., 2003; Focarelli and Pozolo, 2001;
Glaister and Thwaites, 1994). Most academic and management attention has been directed to the
supply side of the market. The little attention towards the consumer side has usually been directed to
the general market structure, whereas insight into micro-level aspects, such as the behavior of
individual consumers, would also be highly relevant.
Important differences and similarities in financial behavior could be anticipated both between
consumers within a particular country as well as between consumers living in different countries
(Guiso, et al., 2002; Paas, 2001). For example, consumers in countries with less developed economic
systems typically have different financial needs than consumers in more industrialized countries, and
within Europe substantial differences can indeed be observed (Bartram, 1998). Such differences lead to
different consumer segments being present in various countries. Now, the appropriate choice between
11
strategic options and the (lack of) international success may critically depend on the cross-national
demand structure for the various financial products. In particular, the success in an international market
depends strongly on the appropriateness of the international segmentation, just as the success in a
national market depends on an effective segmentation (Wedel and Kamakura, 2000). Therefore, insight
into country and international consumer segments based on domain-specific behavioral variables will
be of key strategic importance in the financial products market.
Database on Product Ownership
We apply the model proposed in this paper to a recently collected data set: Eurobarometer 56.0
(Christensen, 2001). The data were collected between August 22nd and September 27th 2001 by a
consortium of market research agencies at the request of the European Commission, Directorate-
General Press and Communication, Opinion Polls. The Eurobarometer survey covers the population
(aged 15 years and over) of the EU member states. There are 17 sampling areas: Germany is divided
into East and West, United Kingdom into Great Britain and Northern Ireland, and one sampling area is
designated for each of the other countries. Below the terminology “country” will refer to a sampling
area. Sample sizes were targeted to be 1000 per country, with the exception of Luxembourg (600) and
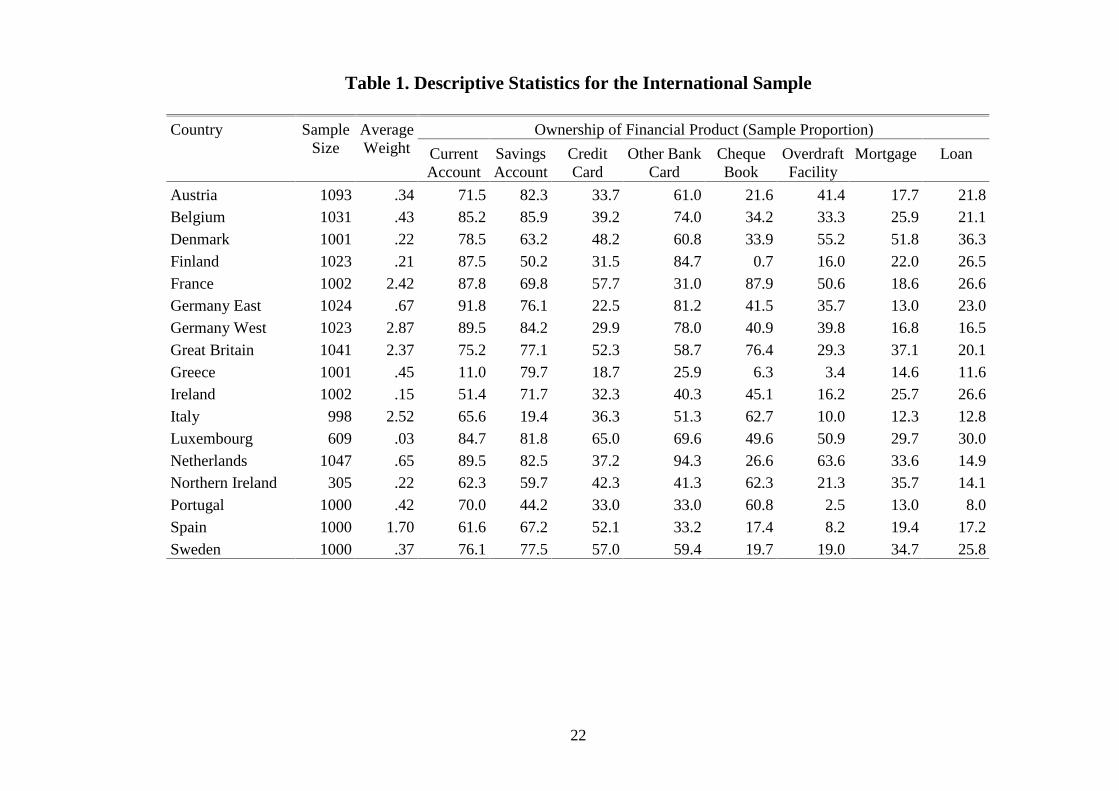
Northern Ireland (300). The total sample size is 16,200. A weighting variable was computed to make
each national sample representative with respect to basic demographic variables and additionally to
correct for cross-national differences in sample versus population size (see Table 1). All interviews
were conducted face-to-face in the respondent’s home and in the appropriate national language.
[ Insert Table 1 about here ]
Information is available on ownership of eight financial products: current account, savings
account, credit card, other bank card, cheque book, overdraft facility on current account, mortgage, and
12
other loan. This set of products corresponds to the set of core products in previous studies such as
Kamakura, et al. (1991). Preliminary inspection of penetration rates of the products shows large
differences across the countries, but also some striking similarities (Table 1). In addition, the following
four demographic variables that might be relevant for the topic at hand are available: age (15 to 29, 30
to 59, 60 and older), marital status (living with partner, single), income (below median, above median,
not available), and type of community (rural area or village, small city to large city).
RESULTS
Country and Consumer Segments
To study the ownership pattern for the eight financial products and to examine the similarities and
differences therein across 16,200 respondents and 17 countries, we apply the multi-level latent class
analysis as described previously. While obtaining parameter estimates, we weighted the observations
to correct for sampling discrepancies both within and between countries, as recommended by
Steenkamp and Ter Hofstede (2002). Model estimates are obtained for alternative values of the number
of consumer segments (S = 1,…, 15) and country segments (T = 1 ,…, 8). To account for sub-optimal
solutions, we estimated the model ten times for each combination of S and T with different random
starting values, and retained the best solution for each combination.
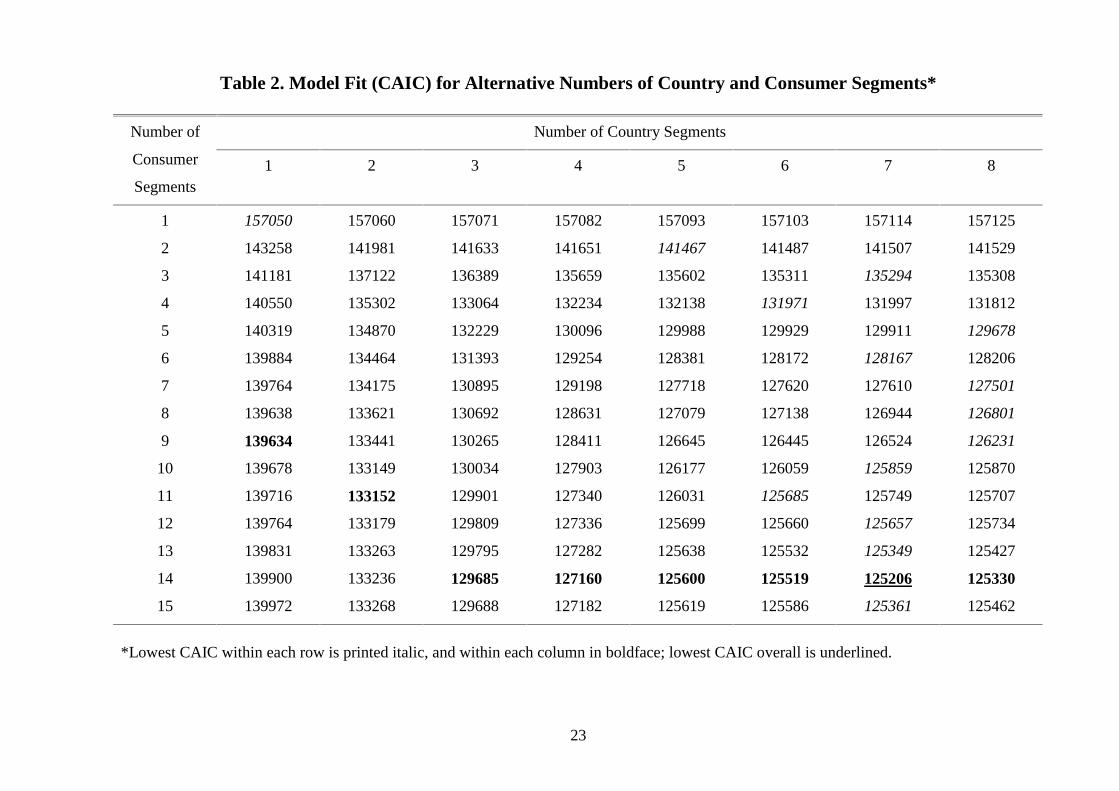
[ Insert Table 2 about here ]
Table 2 reports model fit (in particular, the CAIC value) for each combination of S and T. The
optimal number of consumer segments is relatively low when the number of country segments is low
also, but increases rapidly when the number of country segments increases from one to three. With
three to eight country segments, a minimum CAIC is reached with fourteen consumer segments. From
13
the opposite perspective: when the number of consumer segments is larger than two, the optimal
number of country segments varies between six and eight. The overall minimum CAIC is attained at
fourteen consumer segments and seven country segments, which we identify as the most appropriate
solution. These results are presented in Tables 3 and 4.
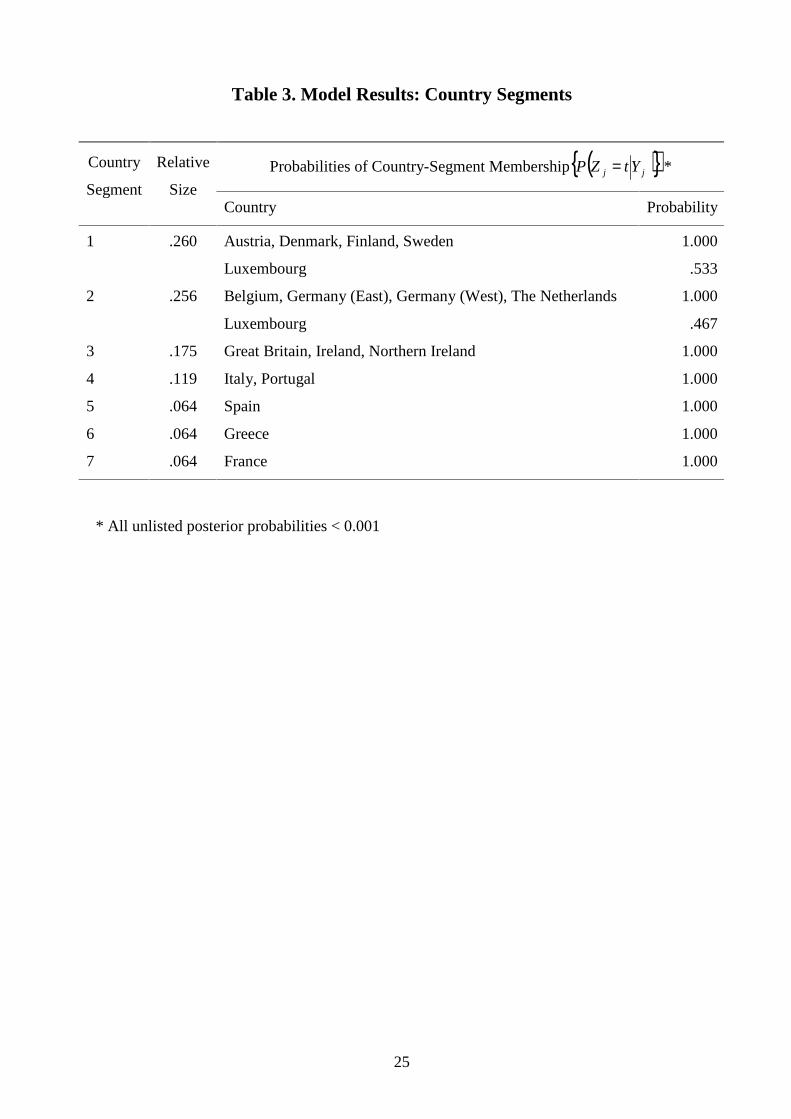
[ Insert Tables 3 and 4 about here ]
First, note that posterior classification of countries to segments can be done almost in a
deterministic fashion: almost all membership probabilities are virtually indistinguishable from 0 or 1
(Table 3). The only exception is Luxembourg, which has a fairly high membership probability for two
country segments. The classification of countries into segments is strongly related to the European
geography, with several noteworthy peculiarities. The country segments have been ordered in size to
support interpretation. The largest segment contains the Scandinavian countries, Austria, and
Luxembourg (for just over 50 %). The second segment is nearly as large and contains the low
countries (Belgium and The Netherlands), Germany, and Luxembourg (for 47 %). Great Britain,
Northern Ireland, and Ireland are combined to form segment 3. Contrary to the other parts of Europe,
Southern Europe consists of many small segments: Italy and Portugal together form country segment
4, and Spain, Greece, and France remain three single-country segments. Apparently, ownership
patterns of financial products are relatively diverse across the countries in Southern Europe.
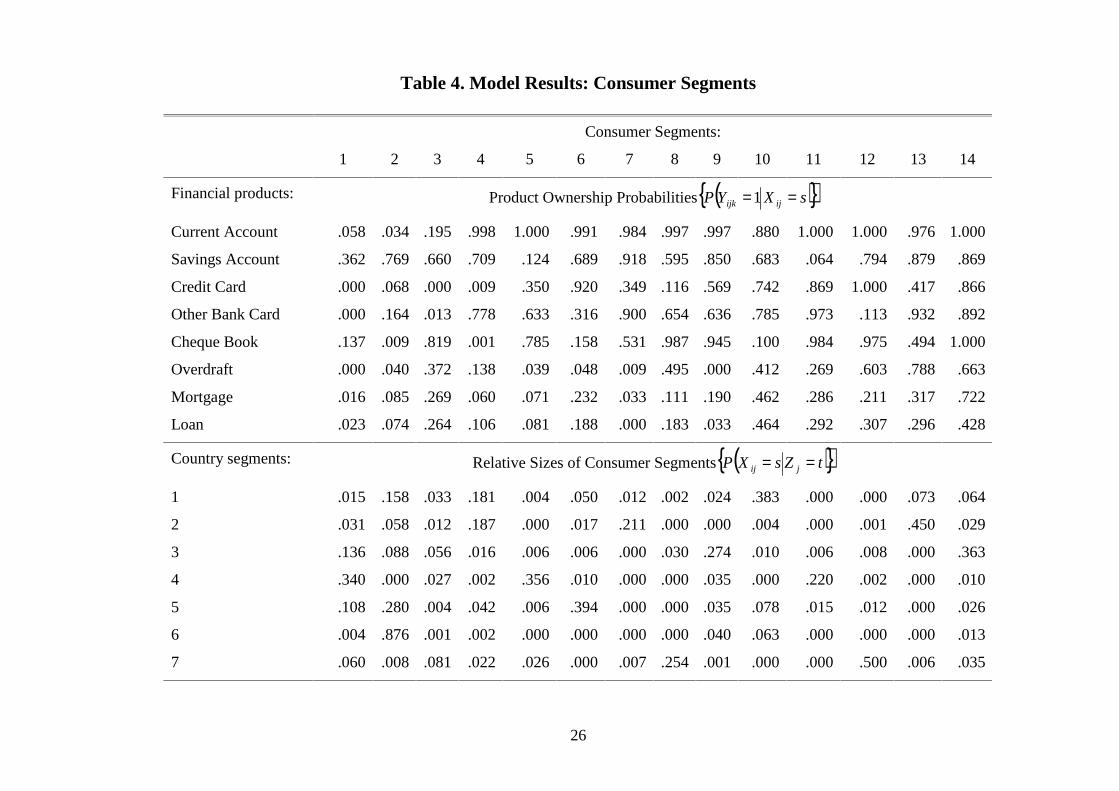
Product ownership within each of the fourteen international consumer segments is presented in
the upper part of Table 4. To aid interpretation, we ordered the consumer segments in ascending order
of the penetration rates aggregated across the eight financial products. The most pronounced feature of
the first three segments is the very low penetration of the basic payment product (current account) and
more advanced payment products (credit card or other banking card). Segment 1 actually has low
probabilities for all products, whereas segment 2 has a fairly high rate for the savings account only and

14
segment 3 for the savings account and the cheque book only. Overall, however, consumers of the first
three segments own only a very small number of financial products. Consumer segments 4 to 9 have
penetration rates close to one for the current account and some other payment-facilitating products. On
average, the penetration rates of these other payment-facilitating products gradually increase from
segments 4 to 9. Furthermore, which payment-related product is owned is the key factor differentiating
between these segments. For example, the ownership probabilities are similar for segments 7 and 9
with the exception of other bank card (much higher in segment 7) and cheque book (much higher in
segment 9). Also, credit card ownership is very high in segment 6, and cheque book ownership in
segment 8. Contrary to all other consumer segments, segments 10 to 14 have relatively high ownership
probabilities for the financial credit products (overdraft, mortgage, and other loans). Segments 10 and
12 are similar, with the exception of other bank card (much higher in segment 10) and cheque book
(much higher in segment 12). Segment 11 has high rates for almost all products, but has the lowest rate
across all segments for savings account. Segments 13 and 14 contain the heavy users: penetration rates
for all eight financial products are relatively high; most notably the rate pertaining to the overdraft
facility in segment 13 and mortgage in segment 14.
Model results linking the country and consumer segments are presented in the lower part of
Table 4. At first glance, fourteen consumer segments might seem to be a large number of segments.
However, many of these segments are present in only one or very few country segments. If we use
0.10 as a threshold for the relative size of a consumer segment within a country segment, consumer
segments 1, 2 and 4 appear in multiple-country segments, whereas consumer segments 5 to 14 are
sizeable in only one country segment. Hence, most consumer segments with small overall penetration
rates are truly cross-national (or even pan-European) segments, whereas consumer segments with
higher ownership rates are specific to a particular country segment.
Most country segments contain three relatively large consumer segments: one with low
penetration rates (consumer segments 1 to 3), one with medium to high rates for the payment products
15
but low rates for the credit products (consumer segments 4 to 9), and one with high rates for most
products (segments 10 to 14). For instance, country segment 1 (Austria, Scandinavian countries, and
Luxembourg) primarily contains consumer segments 2, 4, and 10, which share the feature of very low
penetration rates for the cheque book. Country segment 2 (Belgium, Germany, Netherlands,
Luxembourg) consists largely of consumer segments 4, 7, and 13, which all have very high penetration
rates for the current account, savings account, and other bank card. The consumer segments that shape
country segment 3 (Ireland, Northern Ireland, Great Britain) are very diverse: ranging from extremely
low rates on all products (consumer segment 1) to extremely high rates for all products (consumer
segment 14). Country segment 4 (Italy and Portugal) largely consists of consumer segments with very
low rates for the savings account (consumer segments 1, 5, and 11). In Spain (single-country segment
5) many consumer segments are medium-sized to large. The larger segments in this country are
consumer segments 1, 2, and 6, which share low penetration rates of cheque book, overdraft facility,
mortgage and loan. Consumers with high ownership rates are scattered here across segments 10, 11, 12
and 14. Consumer segment 2, with low penetration rates in all but the savings account, is extremely
dominant in Greece. Similarly, France (single-country segment 7) mainly consists of only two
consumer segments, namely 8 and 12. Both consumer segments have very high ownership rates for
cheque book, while consumers in segment 12 all have a credit card, whereas consumers in segment 8
typically have another bank card.
Effects of Demographic Variables
Ownership of financial products, and thereby membership to the consumer segments, is often related
to demographic variables such as age and income (Guiso, et al., 2002; Javalgi and Dion, 1999;
Ramaswamy, et al., 1996; Tin, 2000). The multi-level latent class analysis allows incorporation of such
individual differences by means of concomitant variables, as shown in equation (6). Hence, the
probability that a consumer belongs to a particular segment is modeled to depend on his/her
16
demographics as well as the country segment of this consumer. This relationship between the
consumer-segment classification and demographics supports interpretation of the segments and
subsequently increases the targeting possibilities of a company.
This empirical study assesses the effects of four demographic variables: age, marital status,
income, and type of community. To ensure that the consumer segments to be explained do not alter,
we fix the parameter values for the measurement model relating financial products to consumer
segments (upper part of Table 4). However, we re-estimate the country segmentation and the relation
between the country segments and consumer segments, next to the newly introduced demographic
effects.
We estimate a full model including all four concomitant variables, and four sub-models each
omitting one of the variables. To assess the significance of the demographic effects, we employ the
well-known chi-square test for nested models. All four demographic variables turn out to have a highly
significant influence of consumer segment membership: age (χ2 = 1267.49; d.f. = 50; p < .001),
income (χ2 = 978.94; d.f. = 50; p < .001), marital status (χ2 = 419.88; d.f. = 31; p < .001), and type of
community (χ2 = 67.46; d.f. = 31; p < .001).
The findings regarding the country-segment sizes, the classification of the countries to these
segments, and the relationship with the consumer segment are virtually identical between the model
including concomitant variables and the previous model without such effects (Tables 3 and 4).
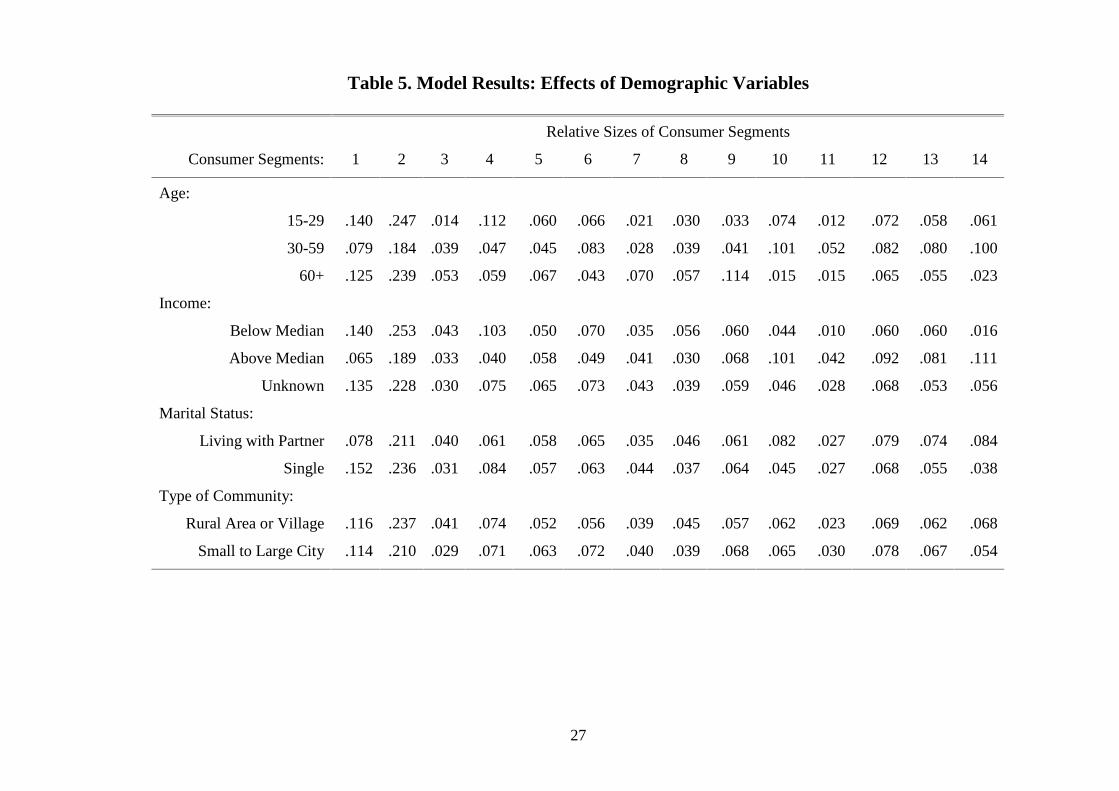
Therefore, we focus here on the effects of the demographic variables as presented in Table 5. To
facilitate interpretation we do not present the original logit parameters, but instead the segment
membership probability per category of each demographic variable, averaged across all categories of
the other variables.
[ Insert Table 5 about here ]
17
Age has a huge influence on the consumer segment probabilities. The low penetration segments
1 and 2 are overrepresented in the age groups 15 to 29 and 60 and older, whereas the high penetration
segments 10 to 14 are highly overrepresented in the intermediate age group (30 to 59 years). The
segments with generally moderate penetration rates are mixed in that sense: some are overrepresented
in the younger group (segment 4), whereas other segments are strongly present in the middle group
(segment 6) or in the older group (segments 7, 8, and 9). The effect of income resembles that of age,
where the high-income group corresponds to the age group of 30 to 59 years. An exception to this
comparison is segment 6, which is relatively large in age group 30 to 59 years, but relatively small in
the high-income group. This segment originates mainly from the single-country segment of Spain, and
stands for relative high penetration rates within that country segment. Consumers living together with a
partner have a relatively high probability to be member of segments 10, 13, or 14, which all have high
penetration rates for many financial products. These three segments form the top three with respect to
penetration of the mortgage, and mainly originate from the Northern and Western parts of Europe
(country segments 1 to 3). Of the demographics included in this study, the type of community has the
smallest impact, as shown by the chi-square tests and the differences between the segment
probabilities. Consumers living in a rural area or a village are overrepresented in segments 2, 3 and 14,
whereas consumers living in a city are overrepresented in segment 6. The other consumer segments
have similar probabilities for both types of communities. Finally, membership probability for segment
5 is not strongly affected by any of the demographic variables.
Segmentation Effectiveness
The following criteria have been put forward as determinants of the effectiveness of market
segmentation (Wedel and Kamakura, 2000, p. 4; Kotabe and Helsen, 2001, p. 219; Steenkamp and Ter
Hofstede, 2002): substantiality, stability, identifiability, accessibility, responsiveness, and actionability.
Although the number of consumer segments may appear relatively large, the fact that many consumer
18
segments are cross-national or else represent a large fraction of a single country ensures that all
segments are large in size (substantiality). Furthermore, the fact that financial product ownership does
not change frequently at the consumer level ensures that the segments do not change dramatically over
time (stability). However, the segmentation will not be excessively fixated, and trends could be
monitored regarding demographics and ownership rates of certain financial products. Furthermore, the
country segmentation should be monitored over time, among other reasons because of potential
convergence within the EU. Recognizing the distinct groups (identifiability) will be relatively easy to
accomplish in the proposed segmentation of the market for financial products. Although ownership of
financial products is registered automatically by the companies that sell the products, from the
perspective of a single company some information will be missing, which poses an additional
challenge (Kamakura and Wedel, 2003; Kamakura et al., 2003). Furthermore, the relation with
demographic variables further facilitates identification of the segments. This relationship also enhances
the extent to which a company can reach particular targeted segments (accessibility). Whether or not
the segmentation proposed will perform well on responsiveness and actionability is a priori somewhat
unclear. Fortunately, relationships between product ownership and marketing mix instruments have
been demonstrated, for example to suggest cross-selling opportunities (Kamakura et al., 1991 and
2003). The substantial differences between and within countries in product ownership, as observed in
this study, clearly suggest actions regarding cross-selling, product introductions, and targeting of
particular country and/or consumer segments. Hence, considering the criteria for effective
segmentation, the solution obtained here qualifies as excellent.
CONCLUSION
International market segmentation is an essential tool to enlarge understanding of international markets
and thereby supports companies to formulate strategies to deal effectively with demand heterogeneity
across borders. However, to fulfill this promise a number of issues have to be dealt with. Steenkamp
19
and Ter Hofstede (2002, Figure 2) mentioned: 1) combining country segmentation and cross-national
consumer segmentation, 2) model-based segmentation, 3) correction for response styles, and 4) sample
reweighting.
In this paper, we present a framework using multi-level latent class analysis, which
simultaneously derives country segments and consumer segments. The model-implied direct
connection between the country and consumer segmentations, ensures the resulting segments at both
levels to be highly relevant and actionable for international marketing management. In addition, the
consumer segmentation is flexible in the sense that the segments obtained can be cross-national or
country-specific. Moreover, the procedure proposed meets the guidelines for effective international
market segmentation as mentioned previously. The two levels are modeled as interdependent:
countries are grouped on basis of the similarity between their within-country structure of the consumer
segments. The segments at both levels are obtained using consumer-level data on ownership of
financial products. Given the type of data, objective measures rather than attitude ratings, biases due to
response styles are avoided. Furthermore, marketing and economic theory on ownership of financial
products and statistical model formulation allow a model-based approach. Finally, by using pseudo
maximum likelihood, which reweights the observations to correct for relative sample size differences
between countries, we construct an internationally representative sample and obtain generalizable
findings. Hence, the procedure presented promises to be a fruitful direction for international market
segmentation.
Besides the methodological contribution, the empirical study of ownership patterns of financial
products yields a number of interesting substantive insights. The demand structure is highly similar
within certain small groups of European countries, whereas it is considerably different between these
groups. This country grouping is strongly related to the European geographical map. For example,
Belgium, Germany, Luxembourg, and the Netherlands constitute a group of countries that is fairly
homogenous in the ownership patterns observed within these countries. The Mediterranean countries,
20
on the other hand, are much more heterogeneous. For example, Greece includes a huge consumer
segment that basically only has a savings account, whereas France includes several segments that have
exceptionally high penetration rates for the cheque book. Although, convergence could be anticipated
within the EU (Berger, et al., 2003; Ganesh, 1998) because of the Euro and regulatory standardization,
for the moment Europe consists of a partly heterogeneous group of countries considering the
ownership of financial products.
The consumer segmentation is strongly related to demographic variables such as age, income,
and marital status. Segments with high penetration rates for many financial products are typically
overrepresented in the intermediate age group, high income group, and in the group of consumers
living with a partner. This finding is consistent with previous research on the family life-cycle effects
within this category (Javalgi and Dion, 1999; Soutar and Cornish-Ward, 1997; Tin, 2002) and to the
life-cycle theory (Browning and Lusardi, 1996). The latter suggests that households with a middle-
aged head and consisting of more than one person are most likely to be financially active. Potentially
these findings could also support the idea of preset acquisition patterns (Dickenson and Kirzner, 1986;
Paas, 1998, 2001; Soutar and Cornish-Ward, 1997), which determine the order by which the financial
products are purchased. Given the nature of the product category, such an ordering should be reflected
in the ownership segments. However, ordering the financial products in ascending penetration rates
does not yield an ordered structure for the consumer segments. This holds across country segments as
well as within a country segment. For example, consumer segments 8 and 12 are similar and both
fairly large in France, but whereas in segment 8 penetration of the credit card is very low and
penetration of the bank card very high, the opposite holds within segment 12.
Our findings are highly relevant in the contemporary international markets, as studying
financial markets is a growing practice and now takes a prominent place in marketing research
worldwide (Bartram, 1998). Important managerial insights can be obtained on behavior of consumers
within such markets. In particular, our empirical study reveals a clear international segmentation
21
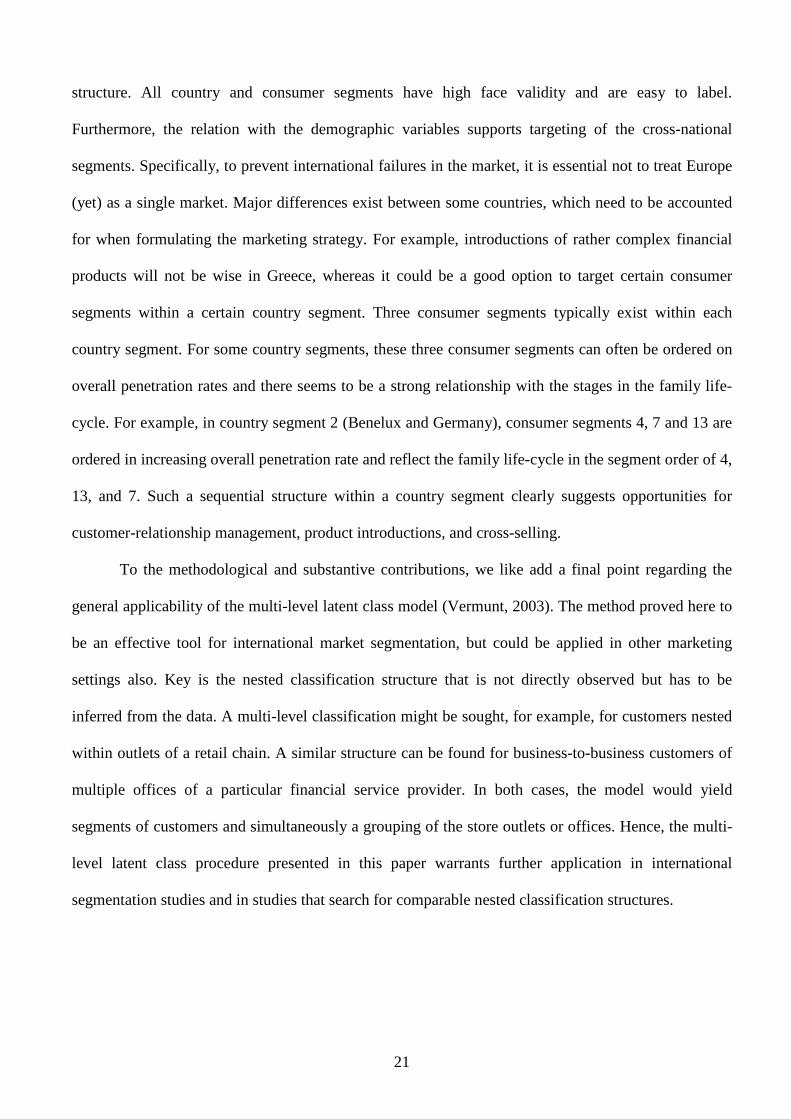
structure. All country and consumer segments have high face validity and are easy to label.
Furthermore, the relation with the demographic variables supports targeting of the cross-national
segments. Specifically, to prevent international failures in the market, it is essential not to treat Europe
(yet) as a single market. Major differences exist between some countries, which need to be accounted
for when formulating the marketing strategy. For example, introductions of rather complex financial
products will not be wise in Greece, whereas it could be a good option to target certain consumer
segments within a certain country segment. Three consumer segments typically exist within each
country segment. For some country segments, these three consumer segments can often be ordered on
overall penetration rates and there seems to be a strong relationship with the stages in the family life-
cycle. For example, in country segment 2 (Benelux and Germany), consumer segments 4, 7 and 13 are
ordered in increasing overall penetration rate and reflect the family life-cycle in the segment order of 4,
13, and 7. Such a sequential structure within a country segment clearly suggests opportunities for
customer-relationship management, product introductions, and cross-selling.
To the methodological and substantive contributions, we like add a final point regarding the
general applicability of the multi-level latent class model (Vermunt, 2003). The method proved here to
be an effective tool for international market segmentation, but could be applied in other marketing
settings also. Key is the nested classification structure that is not directly observed but has to be
inferred from the data. A multi-level classification might be sought, for example, for customers nested
within outlets of a retail chain. A similar structure can be found for business-to-business customers of
multiple offices of a particular financial service provider. In both cases, the model would yield
segments of customers and simultaneously a grouping of the store outlets or offices. Hence, the multi-
level latent class procedure presented in this paper warrants further application in international
segmentation studies and in studies that search for comparable nested classification structures.
22
Table 1. Descriptive Statistics for the International Sample
Ownership of Financial Product (Sample Proportion) Country Sample Size
Average Weight Current
Account Savings Account
Credit Card
Other Bank Card
Cheque Book
Overdraft Facility
Mortgage Loan
Austria 1093 .34 71.5 82.3 33.7 61.0 21.6 41.4 17.7 21.8 Belgium 1031 .43 85.2 85.9 39.2 74.0 34.2 33.3 25.9 21.1 Denmark 1001 .22 78.5 63.2 48.2 60.8 33.9 55.2 51.8 36.3 Finland 1023 .21 87.5 50.2 31.5 84.7 0.7 16.0 22.0 26.5 France 1002 2.42 87.8 69.8 57.7 31.0 87.9 50.6 18.6 26.6 Germany East 1024 .67 91.8 76.1 22.5 81.2 41.5 35.7 13.0 23.0 Germany West 1023 2.87 89.5 84.2 29.9 78.0 40.9 39.8 16.8 16.5 Great Britain 1041 2.37 75.2 77.1 52.3 58.7 76.4 29.3 37.1 20.1 Greece 1001 .45 11.0 79.7 18.7 25.9 6.3 3.4 14.6 11.6 Ireland 1002 .15 51.4 71.7 32.3 40.3 45.1 16.2 25.7 26.6 Italy 998 2.52 65.6 19.4 36.3 51.3 62.7 10.0 12.3 12.8 Luxembourg 609 .03 84.7 81.8 65.0 69.6 49.6 50.9 29.7 30.0 Netherlands 1047 .65 89.5 82.5 37.2 94.3 26.6 63.6 33.6 14.9 Northern Ireland 305 .22 62.3 59.7 42.3 41.3 62.3 21.3 35.7 14.1 Portugal 1000 .42 70.0 44.2 33.0 33.0 60.8 2.5 13.0 8.0 Spain 1000 1.70 61.6 67.2 52.1 33.2 17.4 8.2 19.4 17.2 Sweden 1000 .37 76.1 77.5 57.0 59.4 19.7 19.0 34.7 25.8
23
Table 2. Model Fit (CAIC) for Alternative Numbers of Country and Consumer Segments*
Number of Country Segments Number of
Consumer
Segments 1 2 3 4 5 6 7 8
1 157050 157060 157071 157082 157093 157103 157114 157125
2 143258 141981 141633 141651 141467 141487 141507 141529
3 141181 137122 136389 135659 135602 135311 135294 135308
4 140550 135302 133064 132234 132138 131971 131997 131812
5 140319 134870 132229 130096 129988 129929 129911 129678
6 139884 134464 131393 129254 128381 128172 128167 128206
7 139764 134175 130895 129198 127718 127620 127610 127501
8 139638 133621 130692 128631 127079 127138 126944 126801
9 139634 133441 130265 128411 126645 126445 126524 126231
10 139678 133149 130034 127903 126177 126059 125859 125870
11 139716 133152 129901 127340 126031 125685 125749 125707
12 139764 133179 129809 127336 125699 125660 125657 125734
13 139831 133263 129795 127282 125638 125532 125349 125427
14 139900 133236 129685 127160 125600 125519 125206 125330
15 139972 133268 129688 127182 125619 125586 125361 125462
*Lowest CAIC within each row is printed italic, and within each column in boldface; lowest CAIC overall is underlined.

25
Table 3. Model Results: Country Segments
Probabilities of Country-Segment Membership ( ){ }jj YtZP = * Country
Segment
Relative
Size Country Probability
1 .260 Austria, Denmark, Finland, Sweden
Luxembourg
1.000
.533
2 .256 Belgium, Germany (East), Germany (West), The Netherlands
Luxembourg
1.000
.467
3 .175 Great Britain, Ireland, Northern Ireland 1.000
4 .119 Italy, Portugal 1.000
5 .064 Spain 1.000
6 .064 Greece 1.000
7 .064 France 1.000
* All unlisted posterior probabilities < 0.001
26
Table 4. Model Results: Consumer Segments
Consumer Segments:
1 2 3 4 5 6 7 8 9 10 11 12 13 14
Financial products: Product Ownership Probabilities ( ){ }sXYP ijijk ==1
Current Account .058 .034 .195 .998 1.000 .991 .984 .997 .997 .880 1.000 1.000 .976 1.000
Savings Account .362 .769 .660 .709 .124 .689 .918 .595 .850 .683 .064 .794 .879 .869
Credit Card .000 .068 .000 .009 .350 .920 .349 .116 .569 .742 .869 1.000 .417 .866
Other Bank Card .000 .164 .013 .778 .633 .316 .900 .654 .636 .785 .973 .113 .932 .892
Cheque Book .137 .009 .819 .001 .785 .158 .531 .987 .945 .100 .984 .975 .494 1.000
Overdraft .000 .040 .372 .138 .039 .048 .009 .495 .000 .412 .269 .603 .788 .663
Mortgage .016 .085 .269 .060 .071 .232 .033 .111 .190 .462 .286 .211 .317 .722
Loan .023 .074 .264 .106 .081 .188 .000 .183 .033 .464 .292 .307 .296 .428
Country segments: Relative Sizes of Consumer Segments ( ){ }tZsXP jij ==
1 .015 .158 .033 .181 .004 .050 .012 .002 .024 .383 .000 .000 .073 .064
2 .031 .058 .012 .187 .000 .017 .211 .000 .000 .004 .000 .001 .450 .029
3 .136 .088 .056 .016 .006 .006 .000 .030 .274 .010 .006 .008 .000 .363
4 .340 .000 .027 .002 .356 .010 .000 .000 .035 .000 .220 .002 .000 .010
5 .108 .280 .004 .042 .006 .394 .000 .000 .035 .078 .015 .012 .000 .026
6 .004 .876 .001 .002 .000 .000 .000 .000 .040 .063 .000 .000 .000 .013
7 .060 .008 .081 .022 .026 .000 .007 .254 .001 .000 .000 .500 .006 .035
27
Table 5. Model Results: Effects of Demographic Variables
Relative Sizes of Consumer Segments
Consumer Segments: 1 2 3 4 5 6 7 8 9 10 11 12 13 14
Age:
15-29 .140 .247 .014 .112 .060 .066 .021 .030 .033 .074 .012 .072 .058 .061
30-59 .079 .184 .039 .047 .045 .083 .028 .039 .041 .101 .052 .082 .080 .100
60+ .125 .239 .053 .059 .067 .043 .070 .057 .114 .015 .015 .065 .055 .023
Income:
Below Median .140 .253 .043 .103 .050 .070 .035 .056 .060 .044 .010 .060 .060 .016
Above Median .065 .189 .033 .040 .058 .049 .041 .030 .068 .101 .042 .092 .081 .111
Unknown .135 .228 .030 .075 .065 .073 .043 .039 .059 .046 .028 .068 .053 .056
Marital Status:
Living with Partner .078 .211 .040 .061 .058 .065 .035 .046 .061 .082 .027 .079 .074 .084
Single .152 .236 .031 .084 .057 .063 .044 .037 .064 .045 .027 .068 .055 .038
Type of Community:
Rural Area or Village .116 .237 .041 .074 .052 .056 .039 .045 .057 .062 .023 .069 .062 .068
Small to Large City .114 .210 .029 .071 .063 .072 .040 .039 .068 .065 .030 .078 .067 .054
28
LITERATURE
Bartram, P. (1998), “Chapter 24: Financial Research,” In: The ESOMAR Handbook of Market and
Opinion Research, 4th Edition, C. McDonald and P. Vangelder, eds., Amsterdam: ESOMAR, 891-
926.
Berger, A.N., Q. Dai, S. Ongena, and D.C. Smith (2003), “To What Extent will the Banking Industry
be Globalized? A Study of Bank Nationality and Reach in 20 European Nations,” Journal of
Banking & Finance, 27 (3), 383-415.
Browning, M. and A. Lusardi (1996), “Household Savings: Micro Theories and Micro Facts,” Journal
of Economic Literature, 34 (4), 1797-1855.
Christensen, T. (2001), Eurobarometer56.0: Information and Communication Technologies, Financial
Services, and Cultural Activities, August-September 2001. Brussels: European Opinion Research
Group.
Chryssochoidis, G.M. and V. Wong (2000), “Service Innovation Multi-Country Launch: Causes of
Delays,” European Journal of Innovation Management, 3 (1), 35-44.
Dayton, C.M. and G.B. MacReady (1988), “Concomitant-Variable Latent-Class Models,” Journal of
the American Statistical Association, 83 (March), 173-178.
DeKimpe, M.G., P.M. Parker, and M. Sarvary (2000), “Global Diffusion of Technological
Innovations: A Coupled-Hazard Approach,” Journal of Marketing Research, 37 (February), 47-
59.
Dickenson, J.R. and E. Kirzner (1986), “Priority Patterns of Financial Assets,” Journal of the Academy
of Marketing Science, 14 (Summer), 43-49.
Douglas, S.P. and C.S. Craig (1992), “Advances in International Marketing: Review,” International
Journal of Research in Marketing, 9 (4), 291-318.
Focarelli, D. and A.F. Pozzolo (2001), “The Patterns of Cross-Border Bank Mergers and
Shareholdings in OECD Countries,” Journal of Banking & Finance, 25 (12), 2305-2337.
29
Ganesh, J. (1998), “Converging Trends Within the European Union: Insights from an Analysis of
Diffusion Patterns,” Journal of International Marketing, 6 (4), 32-48.
Glaister, K.W. and D. Thwaites (1994), “International Joint Venture Formation: The Financial
Services Sector,” Service Industry Journal, 14 (4), 438-454.
Guiso, L., M. Haliassos, and T. Jappelli (2002), Household Portfolios.Cambridge, MA: MIT Press.
Gupta, S. and P.K. Chintagunta (1994), “On Using Demographic Variables to Determine Segment
Membership in Logit Mixture Models,” Journal of Marketing Research, 31 (February), 128-136.
Harrell, G.D. and R.O. Kiefer (1993), “Multinational Market Portfolios in Global Strategy
Development,” International Marketing Review, 10 (1), 60-72.
Helsen, K., K. Jedidi, and W.S. DeSarbo (1993), “A New Approach to Country Segmentation Utilizing
Multinational Diffusion Patterns,” Journal of Marketing, 57 (October), 60-71.
Jain, S.C. (1993), International Marketing Management, 4rth edition. Belmont, CA: Wadsworth.
Javalgi, R.G. and P. Dion (1999), “A Life Cycle Segmentation Approach to Marketing Financial
Products and Services,” Services Industries Journal, 19 (3), 74-96.
Kamakura,W.A., S.N. Ramaswami, and R.K. Srivastava (1991), “Applying Latent Trait Analysis in
the Evaluation of Prospects for Cross-selling of Financial Services,” International Journal of
Research in Marketing, 8 (3), 329-349.
Kamakura, W.A. and M. Wedel (2003), “List Augmentation with Model Based Multiple Imputation: A
Case Study Using a Mixed-Outcome Factor Model,” Statistica Neerlandica, 57 (1), 46-57.
Kamakura, W.A., M. Wedel, F. de Rosa, and J.A. Mazzon (2003), “Cross-Selling through Database
Marketing: A Mixed Data Factor Analyzer for Data Augmentation and Prediction,” International
Journal of Research in Marketing, 20 (1), 45-65.
Kotabe, M. and K. Helsen (2001), Global Marketing Management, second edition. New York: Wiley.
Kumar, V., J. Ganesh, and R. Echambadi (1998), “Cross-National Diffusion Research: What Do We
Know and How Certain Are We?” Journal of Product Innovation Management, 15 (3), 255-268.
30
Luqmani, M., U. Yavas, and Z.A. Quraeshi (1994), “A Convenience-Oriented Approach to Country
Segmentation: Implications for Global Marketing Strategies,” Journal of Consumer Marketing, 11
(4), 29-40.
Marois, B. (1997), “French Banks and European Strategy,” European Management Journal, 15 (2),
183-189.
Nachum, L. (1994), “The Choice of Variables for Segmentation of the International Market,”
International Marketing Review, 11 (3), 54-67.
Paas, L.J. (1998), “Mokken Scaling Characteristic Sets and Acquisition Patterns of Durable and
Financial Products,” Journal of Economic Psychology, 19 (3), 353-376.
Paas, L.J. (2001), “Acquisition Patterns of Products Facilitating Financial Transactions: A Cross-
National Investigation,” International Journal of Bank Marketing, 19 (7), 266-275.
Patterson, B.H., C.M. Dayton, and B.I. Graubard (2002), “Latent Class Analysis of Complex Sample
Survey Data: Application to Dietary Data. With Discussions.” Journal of the American Statistical
Association, 97 (September), 721-741.
Perlitz, M. (1985), “Country-Portfolio Analysis: Assessing Country Risk and Opportunity,” Long
Range Planning, 18 (4), 11-26.
Ramaswami, S.N., Srivastava, R.K. and T.H. McInish (1992), “An Exploratory Study of Portfolio
Objectives and Asset Holding,” Journal of Economic Behavior and Organization, 19 (3), 285-
306.
Ramaswamy, V., R. Chatterjee, and S.H. Chen (1996), “Joint Segmentation on Distinct Interdependent
Bases with Categorical Data,” Journal of Marketing Research, 33 (August), 337-350.
Soutar, G.N. and S. Cornish-Ward (1997), “Ownership Patterns for Durable Goods and Financial
Assets: A Rasch Analysis,” Applied Economics, 29 (7), 903-911.
Steenkamp, J.-B.E.M. and F. Ter Hofstede (2002), “International Market Segmentation: Issues and
Perspectives,” International Journal of Research in Marketing, 19 (3), 185-213.
31
Ter Hofstede, F., J.-B.E.M. Steenkamp, and M. Wedel (1999), “International Market Segmentation
Based on Consumer-Product Relations,” Journal of Marketing Research, 36 (February), 1-17.
Tin, J. (2000), “Life-Cylce Hypothesis, Propensities to Save, and Demand for Financial Assets,”
Journal of Economics and Finance, 24 (2), 110-121.
Van Raaij, W.F. and Th.M.M. Verhallen (1994), “Domain-Specific Market Segmentation,” European
Journal of Marketing, 28 (10), 49-66.
Vermunt, J.K. (2003), “Multilevel Latent Class Models,” Sociological Methodology, 33, forthcoming.
Wedel, M. (2002), “Concomitant Variables in Finite Mixture Models,” Statistica Neerlandica, 56 (3),
362-375.
Wedel, M. and W.A. Kamakura (2000), Market Segmentation: Conceptual and Methodological
Foundations. Second edition. Dordrecht: Kluwer.
Wedel, M., F. Ter Hofstede, and J.-B.E.M. Steenkamp (1998), “Mixture Model Analysis of Complex
Samples,” Journal of Classification, 15 (2), 225-244.
Recommended