Send comments about this document to:[email protected]
NFS Server Performance and TuningGuide for Sun Hardware
Part No.: 805-4448September 1998, Revision A
Sun Microsystems, Inc.901 San Antonio Road
Palo Alto, CA 94303-4900U.S.A

1998 Sun Microsystems, Inc., 901 San Antonio Road, Palo Alto, California 94303-4900 U.S.A.
This product or document is protected by copyright and distributed under licenses restricting its use, copying, distribution, and decompilation.
No part of this product or document may be reproduced in any form by any means without prior written authorization of Sun and its licensors,
if any. Third-party software, including font technology, is copyrighted and licensed from Sun suppliers.
Parts of the product may be derived from Berkeley BSD systems, licensed from the University of California. UNIX is a registered trademark in
the U.S. and other countries, exclusively licensed through X/Open Company, Ltd.
Sun, Sun Microsystems, the Sun logo, SunSoft, SunDocs, SunExpress, NFS, SPARCcenter, SPARCserver, Netra, Sun Enterprise, SunDocs, Sun
StorEdge, SmartServe, Solstice SyMON, UltraSPARC, Gigaplane, SuperSPARC, MultiPack, Volume Manager, DiskSuite, UniPack, and Solaris
are trademarks, registered trademarks, or service marks of Sun Microsystems, Inc. in the U.S. and other countries. All SPARC trademarks are
used under license and are trademarks or registered trademarks of SPARC International, Inc. in the U.S. and other countries. Products bearing
SPARC trademarks are based upon an architecture developed by Sun Microsystems, Inc.
The OPEN LOOK and Sun™ Graphical User Interface was developed by Sun Microsystems, Inc. for its users and licensees. Sun acknowledges
the pioneering efforts of Xerox in researching and developing the concept of visual or graphical user interfaces for the computer industry. Sun
holds a non-exclusive license from Xerox to the Xerox Graphical User Interface, which license also covers Sun’s licensees who implement OPEN
LOOK GUIs and otherwise comply with Sun’s written license agreements.
RESTRICTED RIGHTS: Use, duplication, or disclosure by the U.S. Government is subject to restrictions of FAR 52.227-14(g)(2)(6/87) and FAR
52.227-19(6/87), or DFAR 252.227-7015(b)(6/95) and DFAR 227.7202-3(a).
DOCUMENTATION IS PROVIDED “AS IS” AND ALL EXPRESS OR IMPLIED CONDITIONS, REPRESENTATIONS AND WARRANTIES,
INCLUDING ANY IMPLIED WARRANTY OF MERCHANTABILITY, FITNESS FOR A PARTICULAR PURPOSE OR NON-INFRINGEMENT,
ARE DISCLAIMED, EXCEPT TO THE EXTENT THAT SUCH DISCLAIMERS ARE HELD TO BE LEGALLY INVALID.
Copyright 1998 Sun Microsystems, Inc., 901 San Antonio Road, Palo Alto, Californie 94303 Etats-Unis. Tous droits réservés.
Ce produit ou document est protégé par un copyright et distribué avec des licences qui en restreignent l’utilisation, la copie, la distribution, et la
décompilation. Aucune partie de ce produit ou document ne peut être reproduite sous aucune forme, par quelque moyen que ce soit, sans
l’autorisation préalable et écrite de Sun et de ses bailleurs de licence, s’il y en a. Le logiciel détenu par des tiers, et qui comprend la technologie
relative aux polices de caractères, est protégé par un copyright et licencié par des fournisseurs de Sun.
Des parties de ce produit pourront être dérivées des systèmes Berkeley BSD licenciés par l’Université de Californie. UNIX est une marque
déposée aux Etats-Unis et dans d’autres pays et licenciée exclusivement par X/Open Company, Ltd.
Sun, Sun Microsystems, le logo Sun, SunSoft, SunDocs, SunExpress, NFS, SPARCcenter, SPARCserver, Netra, Sun Enterprise, SunDocs, Sun
StorEdge, SmartServe, Solstice SyMON, UltraSPARC, Gigaplane, SuperSPARC, MultiPack, Volume Manager, DiskSuite, UniPack, et Solaris
sont des marques de fabrique ou des marques déposées, ou marques de service, de Sun Microsystems, Inc. aux Etats-Unis et dans d’autres pays.
Toutes les marques SPARC sont utilisées sous licence et sont des marques de fabrique ou des marques déposées de SPARC International, Inc.
aux Etats-Unis et dans d’autres pays. Les produits portant les marques SPARC sont basés sur une architecture développée par Sun
Microsystems, Inc.
L’interface d’utilisation graphique OPEN LOOK et Sun™ a été développée par Sun Microsystems, Inc. pour ses utilisateurs et licenciés. Sun
reconnaît les efforts de pionniers de Xerox pour la recherche et le développement du concept des interfaces d’utilisation visuelle ou graphique
pour l’industrie de l’informatique. Sun détient une licence non exclusive de Xerox sur l’interface d’utilisation graphique Xerox, cette licence
couvrant également les licenciés de Sun qui mettent en place l’interface d’utilisation graphique OPEN LOOK et qui en outre se conforment aux
licences écrites de Sun.
CETTE PUBLICATION EST FOURNIE "EN L’ETAT" ET AUCUNE GARANTIE, EXPRESSE OU IMPLICITE, N’EST ACCORDEE, Y COMPRIS
DES GARANTIES CONCERNANT LA VALEUR MARCHANDE, L’APTITUDE DE LA PUBLICATION A REPONDRE A UNE UTILISATION
PARTICULIERE, OU LE FAIT QU’ELLE NE SOIT PAS CONTREFAISANTE DE PRODUIT DE TIERS. CE DENI DE GARANTIE NE
S’APPLIQUERAIT PAS, DANS LA MESURE OU IL SERAIT TENU JURIDIQUEMENT NUL ET NON AVENU.
Please
Recycle

Contents
Preface xiii
1. NFS Overview 1
NFS Characteristics 1
NFS Version 2 and Version 3 2
NFS Version 3 Features and Operations 2
Changes in Version 3 from Version 2 4
64-Bit File Size 4
Asynchronous Writes 5
Read Directory With Attributes 5
Weak Cache Consistency 5
Tuning Cycle 6
Third Party Tools 7
2. Hardware Overview 9
NFS File Servers 9
Dedicated NFS Servers 13
Netra NFS Server System 13
Enterprise Servers 15
Sun Enterprise 4000, 5000, and 6000 Systems 15
Contents iii

Sun Enterprise 3500, 4500, 5500, and 6500 Systems 17
SPARCcenter 2000 and SPARCcenter 2000E Systems 19
Workgroup Servers 20
Sun Enterprise 150 Server System 21
Sun Enterprise 250 System 22
Sun Enterprise 450 System 24
Sun Enterprise 1 and 2 Systems 25
SPARCserver 20 System 26
SPARCserver 20 System Features 27
Disk Expansion Units 28
SPARCstorage Array Subsystem 28
Sun StorEdge A1000 RAID Disk Array 30
Sun StorEdge A3000 Subsystem 31
Sun StorEdge A5000 Subsystem 33
Sun StorEdge A7000 Intelligent Storage Server 34
Sun StorEdge MultiPack 34
Sun StorEdge UniPack 35
3. Analyzing NFS Performance 37
Tuning the NFS Server 37
Optimizing Performance 37
Resolving Performance Problems 38
Checking Network, Server, and Client Performance 38
▼ To Check the Network 39
Checking the NFS Server 42
▼ To Check the NFS Server 42
Checking Each Client 56
▼ To Check Each Client 56
iv NFS Server Performance and Tuning Guide for Sun Hardware • September 1998

4. Configuring the Server and the Client to Maximize NFS Performance 61
Tuning to Improve NFS Performance 61
▼ To Monitor and Tune Server Performance 62
Balancing NFS Server Workload 62
Networking Requirements 62
Data-Intensive Applications 63
Configuring the Network When the Primary Application of Your Server Is
Data-Intensive 63
Attribute-Intensive Applications 64
Systems with More Than One Class of Users 64
Disk Drives 65
Determining if Disks Are the Bottleneck 65
Limiting Disk Bottlenecks 65
Replicating File Systems 66
Adding the Cache File System 67
Configuration Rules for Disk Drives 69
Using Solstice DiskSuite or Online: DiskSuite to Spread Disk Access
Load 70
Using Log-Based File Systems With Solstice DiskSuite or Online: DiskSuite
3.0 71
Using the Optimum Zones of the Disk 71
Central Processor Units 72
Determining CPU Usage 72
Memory 73
Determining if an NFS Server Is Memory Bound 74
▼ To Determine if the Server Is Memory Bound 74
Calculating Memory 75
General Memory Rules 75
Specific Memory Rules 75
Contents v

Swap Space 76
▼ To Set Up Swap Space 76
Prestoserve NFS Accelerator 76
NVRAM-NVSIMM 77
NVRAM SBus 77
Tuning Parameters 78
Setting the Number of NFS Threads in /etc/init.d/nfs.server 78
Identifying Buffer Sizes and Tuning Variables 79
Using /etc/system to Modify Kernel Variables 79
Adjusting Cache Size: maxusers 80
Parameters Derived From maxusers 80
Adjusting the Buffer Cache (bufhwm) 80
Directory Name Lookup Cache (DNLC) 82
▼ To Reset ncsize 82
Increasing the Inode Cache 83
Increasing the Inode Cache in the Solaris 2.4 or the 2.5 Operating
Environments 83
Increasing Read Throughput 84
▼ To Increase the Number of Read-Aheads With Version 2 85
▼ To Increase the Number of Read-Aheads With Version 3 85
5. Troubleshooting 87
Troubleshooting Tools 87
General Troubleshooting Tuning Tips 87
Client Bottlenecks 89
Server Bottlenecks 90
Network Bottlenecks 91
A. Using NFS Performance-Monitoring and Benchmarking Tools 93
vi NFS Server Performance and Tuning Guide for Sun Hardware • September 1998

NFS Monitoring Tools 94
Network Monitoring Tools 95
SPEC System File Server 2.0 98
Contents vii

viii NFS Server Performance and Tuning Guide for Sun Hardware • September 1998

Figures
FIGURE 1-1 Overview of the Tuning Cycle 6
FIGURE 2-1 Environments Supported by the Netra NFS Server 14
FIGURE 2-2 Sun Enterprise 6000 and 5000 Server Cabinet System and Sun Enterprise 4000 Stand-aloneSystem 16
FIGURE 2-3 Front View of the Sun Enterprise 6500, 5500, and 4500 Servers 19
FIGURE 2-4 Sun Enterprise 150 Front View 22
FIGURE 2-5 Sun Enterprise 250 Front View 23
FIGURE 2-6 Front View of the Sun Enterprise 450 Server 25
FIGURE 2-7 Sun Enterprise 1 Front View 26
FIGURE 2-8 SPARCserver 20 System Front View 27
FIGURE 2-9 Front View of the SPARCstorage Array Subsystem 29
FIGURE 2-10 SPARCstorage Array Subsystem Installation Options 29
FIGURE 2-11 Sun StorEdge A1000 Front View of a Twelve Drive System 31
FIGURE 2-12 Front View of the Sun StorEdge A3000 Subsystem 32
FIGURE 2-13 Front View of the Sun StorEdge A5000 Subsystem 33
FIGURE 2-14 Front View of the Sun StorEdge MultiPack 35
FIGURE 2-15 Sun StorEdge UniPack 35
FIGURE 3-1 Flow Diagram for Checking the Network Performance 39
FIGURE 3-2 Flow Diagram of Possible Responses to the ping -sRv Command 42
Figures ix

x NFS Server Performance and Tuning Guide for Sun Hardware • September 1998

Tables
TABLE 1-1 NFS Operations in Version 2 and Version 3 3
TABLE 1-2 New NFS Operations in Version 3 3
TABLE 2-1 NFS Server Comparison Table 10
TABLE 3-1 netstat -i 15 Command Arguments 39
TABLE 3-2 Arguments to the ping -sRv Command 41
TABLE 3-3 Ouput of the iostat -x 15 Command (Extended Disk Statistics) 47
TABLE 3-4 Options to the iostat -xc 15 | d2fs.server Command 48
TABLE 3-5 Output for the iostat -xc 15 Command 49
TABLE 3-6 Output of the sar -d 15 1000 | d2fs.server Command 51
TABLE 3-7 Description of the Output of the nfsstat -s Command 53
TABLE 3-8 Description of the nfsstat -s Command Output 54
TABLE 3-9 Output of the nfsstat -c Command 57
TABLE 3-10 Description of the nfsstat -c Command Output 57
TABLE 3-11 Description of the Output of the nfsstat -m Command 58
TABLE 3-12 Results of the nfsstat -m Command 59
TABLE 4-1 Statistical Information Supplied by the cachefsstat Command 68
TABLE 4-2 Ouput of the mpstat Command 72
TABLE 4-3 Guidelines for Configuring CPUs in NFS Servers 73
TABLE 4-4 Swap Space Requirements 76
Tables xi

TABLE 4-5 Default Settings for Inode and Name Cache Parameters 80
TABLE 4-6 Descriptions of the Arguments to the sar Command 81
TABLE 5-1 General Troubleshooting Tuning Problems and Actions to Perform 87
TABLE 5-2 Client Bottlenecks 89
TABLE 5-3 Server Bottlenecks 90
TABLE 5-4 Network-Related Bottlenecks 91
TABLE A-1 NFS Operations and Performance-Monitoring Tools 94
TABLE A-2 Network Monitoring Tools 95
TABLE A-3 Arguments to the snoop Command 97
TABLE A-4 Description of Arguments to the snoop -i pkts -v 101 Command 97
TABLE A-5 Arguments to the snoop -i pkts rpc nfs and sunroof and boutiqueCommand 98
TABLE A-6 Description of Arguments to the snoop -i pkts -o.nfs rpc nfs sunroof boutiqueCommand 98
TABLE A-7 NFS Operations Mix by Call 100
TABLE A-8 SPEC SFS 2.0 Results With Version 2 101
TABLE A-9 SPEC SFS 2.0 Results With Version 3 101
xii NFS Server Performance and Tuning Guide for Sun Hardware • September 1998

Preface
The SMCC NFS Server Performance and Tuning Guide is about the NFS™ distributed
computing file system. It describes:
■ NFS and network performance analysis and tuning
■ NFS and network monitoring tools
This book is written with these assumptions about your server:
■ It runs the Solaris™ 2.4, 2.5, 2.5.1, 2.6, or 7 operating environment.
■ It is set up in a networked configuration.
■ It is a SPARCserver™ system, SPARCcenter™ 2000(E), Netra™ NFS 150 Server, or
a Sun™ Enterprise™ 3x00, 4x00, 5x00, or 6x00 system.
This book is for system administrators and network specialists who configure,
analyze performance, or tune servers that provide the NFS service to network
clients. It discusses NFS version 2 and version 3 tuning for the Solaris 2.4, 2.5, 2.5.1,
2.6, and 7 operating environments.
xiii

Typographic Conventions
Shell Prompts
TABLE P-1 Typographic Conventions
Typeface orSymbol Meaning Examples
AaBbCc123 The names of commands, files,
and directories; on-screen
computer output.
Edit your .login file.
Use ls -a to list all files.
% You have mail .
AaBbCc123 What you type, when
contrasted with on-screen
computer output.
% suPassword:
AaBbCc123 Book titles, new words or terms,
words to be emphasized.
Command-line variable; replace
with a real name or value.
Read Chapter 6 in the User’s Guide.
These are called class options.
You must be root to do this.
To delete a file, type rm filename.
TABLE P-2 Shell Prompts
Shell Prompt
C shell machine_name%
C shell superuser machine_name#
Bourne shell and Korn shell $
Bourne shell and Korn shell superuser #
xiv NFS Server Performance and Tuning Guide for Sun Hardware • September 1998

Sun Documentation on the Web
The docs.sun.com web site enables you to access Sun technical documentation on
the Web. You can browse the docs.sun.com archive or search for a specific book
title or subject at:
http://docs.sun.com
Sun Welcomes Your Comments
We are interested in improving our documentation and welcome your comments
and suggestions. You can email your comments to us at [email protected].
Please include the part number of your document in the subject line of your email.
xv

xvi NFS Server Performance and Tuning Guide for Sun Hardware • September 1998

CHAPTER 1
NFS Overview
This chapter briefly discusses NFS characteristics, the tuning cycle, and third-party
tools used to monitor NFS activity.
NFS Characteristics
The NFS environment provides transparent file access to remote files over a
network. File systems of remote devices appear to be local. Clients access remote file
systems by using either the mount command or the automounter.
The NFS protocol enables multiple client retries and easy crash recovery. The client
provides all of the information for the server to perform the requested operation.
The client retries the request until it is acknowledged by the server, or until it times
out. The server acknowledges writes when the data is flushed to nonvolatile storage.
The multithreaded kernel does not require the maintenance of multiple nfsd or
asynchronous-block I/O daemon(biod ) processes; they are both implemented as
operating system kernel threads. There are no biod s on the client and one nfsdprocess exists on the server.
NFS traffic is characterized by its random patterns. NFS requests, which are usually
of many types, are generated in bursts. The capacity of an NFS server must address
the bursty nature of NFS file service demands. Demand varies widely but is
relatively predictable during normal activity.
Most requests from applications (which may be local or remote), follow this pattern:
1. The user reads in the sections of the application binary then executes the code
pages leading to a user dialog, which specifies a data set on which to operate.
2. The application reads the data set from the remote disk.
1

3. The user can then interact with the application, manipulating the in-memory
representation of the data. This phase continues for most of the runtime of the
application.
4. The modified data set is saved to disk.
More sections of the application binary may be paged in as the application continues
to run.
NFS Version 2 and Version 3
The Solaris 2.5 through Solaris 7 operating environments are shipped with NFS
Version 2 and NFS version 3. NFS version 3 is a new addition to the Solaris
operating environments beginning with Solaris 2.5.
The NFS client negotiates with the server regarding whether to use NFS version 2 or
NFS version 3. If the server supports NFS version 3, then version 3 becomes the
default to use. You can override the default NFS version used with the vers= mount
option.
You tune NFS version 2 and NFS version 3 similarly.
NFS Version 3 Features and Operations
NFS version 3 contains several features to improve performance, reduce server load,
and reduce network traffic. Since NFS version 3 is faster for I/O writes, and uses
fewer operations over the network, you will have more efficient use of the network.
Note that higher throughput may make the network busier.
NFS version 3 maintains the stateless server design and simple crash recovery of
version 2 along with its approach to build a distributed file service from cooperating
protocols.
2 NFS Server Performance and Tuning Guide for Sun Hardware • September 1998

TABLE 1-1 describes the NFS operations and their functions for versions 2 and 3.
TABLE 1-2lists the NFS operations new to Version 3.
TABLE 1-1 NFS Operations in Version 2 and Version 3
Operation Function in Version 2 Change in Version 3
create Creates a file system node; may be a file or a symbolic link No change
statfs Gets dynamic file system information Replaced by fsstat
getattr Gets file or directory attributes such as file type, size,
permissions, and access times
No change
link Creates a hard link in the remote file system No change
lookup Searches directory for file and return file handle No change
mkdir Creates a directory No change
null Does nothing; used for testing and timing of server response No change
read Reads an 8-Kbyte block of data (32-KByte blocks). This can be
raised beyond 64 KBytes for TCP.
Block of data up to 4
Gbytes
readdir Reads a directory entry No change
readlink Follows a symbolic link on the server No change
rename Changes the directory name entry No change
remove Removes a file system node No change
rmdir Removes a directory No change
root Retrieves the root of the remote file system (not presently
used)
Removed
setattr Changes file or directory attributes No change
symlink Makes a symbolic link in a remote file system No change
wrcache Writes an 8 Kbyte block of data to the remote cache (not
presently used)
Removed
write Writes an 8 Kbyte block of data (32-KByte blocks). This can be
raised beyond 64 KBytes for TCP.
Block of data up to 4
Gbytes
TABLE 1-2 New NFS Operations in Version 3
Operation in Version 3 Function
access Check access permission
mknod Create a special device
readdir Read from directory
Chapter 1 NFS Overview 3

Changes in Version 3 from Version 2
The root and writecache operations have been removed. A mknod operation has
been defined to allow the creation of special files, thus eliminating the overloading
of create . Caching on the client is not defined nor dictated by Version 3.
Additional information and hints have been added to Version 3 to allow clieints that
implement caching to manage their caches more effectively.
Operations that affect the attributes of a file or directory may now return the new
attributes after the operation has completed to optimize out a subsequent getattr
used in validating attribute caches. Also, operations that modify the directory in
which the target object resides return the old and new attribues of the directory to
allow clients to implement more intelligent cache invalidation procedures.
The access operation provides access permission checking on the server. The
fsstat operation returns static information about a file system and server. The
readdirplus operation returns file handles and attributes in additional to directory
entries. The pathconf operation returns POSIX pathconf information about a file.
64-Bit File Size
Version 3 of the NFS protocol enables access to files whose length fits in 64 bits.
With version 2, the length had to fit in 32 bits (4 Gbytes).
Access to large files (64-bit) is possible only if the client, server, and the operating
system support large files. If the client implementation is limited to 32-bit files, then
the client can’t access files larger than 32 bits (even if the server supports them).
Conversely, if the client supports 64-bit files but the server only supports 32-bit files,
the client is limited to 32-bit files. The Solaris 7 operating environment is the first
Solaris release that takes advantage of this protocol feature. Operating
environments prior to Solaris 7 did not have 64-bit file support.
The limit for the UNIX File System in the Solaris 2.6 and 7 operating environments is
1 Terrabyte (40 bits).
readdirplus Extended read from directory
fsinfo Get static file system information
pathconf Retrieve POSIX information
commit Commit cached data on a server to stable storage
TABLE 1-2 New NFS Operations in Version 3
Operation in Version 3 Function
4 NFS Server Performance and Tuning Guide for Sun Hardware • September 1998

Asynchronous Writes
NFS version 3 can use asynchronous writes, which is optional. The NFS version 3
client sends asynchronous write requests to the server, which acknowledges
receiving the data. However, the server is not required to write the data to stable
storage before replying. The server may schedule the write, or wait to gather
multiple write requests together.
The client maintains a copy of the data in case the server is unable to complete the
writes. When the client wants to free its copy, it notifies the server with a COMMIToperation. The server responds positively only after it ensures that the data is
written to stable storage. Otherwise, it responds with an error and the client resends
the data synchronously.
Asynchronous writes enable the server to determine the best policy to synchronize
the data. The data is most likely synchronized by the time the COMMITarrives.
Compared with NFS version 2, this scheme enables better buffering and more
parallelism.
With NFS version 2, the server does not respond to a write request until the data is
placed in stable storage. However, it may use techniques such as write gathering to
issue multiple concurrent requests before responding to any of the requests.
Read Directory With Attributes
NFS version 3 contains an operation called READDIRPLUS. Most READDIRs are now
issued as READDIRPLUScalls; for example, an ls or an ls -l triggers
READDIRPLUScalls. When the ls -l commands run over version 3, the file handles
and attributes are returned with the list of names in the directory. In version 2, the
names are returned first, then additional calls to the server are required to obtain the
file handles and attributes.
The advantage of the READDIRPLUSoperation in version 3 is that an ls and an
ls -l are now comparable in speed because separate GETATTRrequests are not
required for each file.
Weak Cache Consistency
Many NFS version 2 clients cache file and directory data to improve performance. At
times, the version 2 method fails when multiple clients are sharing and caching the
same data.
Weak cache consistency enables the client to detect data changes between its last
access and the current request. This is done when the server sends back the previous
attributes with the response. The client can then compare the previous attributes
with what it thought the previous attributes were and detect the changes.
Chapter 1 NFS Overview 5

Tuning Cycle
FIGURE 1-1 shows a flowchart of the tuning cycle:
FIGURE 1-1 Overview of the Tuning Cycle
Measure currentperformance andanalyze data (seeChapter 3).
Tune for NFS/opssecond (seeChapter 4).
Furtherimprovementsrequired?
Yes
No
Reconfigure newhardware on theserver, if needed.
End
Start
6 NFS Server Performance and Tuning Guide for Sun Hardware • September 1998

Third Party Tools
Some of the third party tools you can use for NFS and networks include:
■ NetMetrix (Hewlett-Packard)
■ SharpShooter (Network General Corporation, formerly AIM Technology)
SharpShooter (version 3) understands the NFS version 3 protocol.
Chapter 1 NFS Overview 7

8 NFS Server Performance and Tuning Guide for Sun Hardware • September 1998

CHAPTER 2
Hardware Overview
This chapter provides an overview of the following NFS servers and expansion
units:
■ Sun Enterprise 1 system
■ Sun Enterprise 2 system
■ SPARCserver 20 system
■ Sun Enterprise 150 system
■ Sun Enterprise 250 system
■ Sun Enterprise 450 system
■ Sun Enterprise 4000, 5000, and 6000 systems
■ Sun Enterprise 3500, 4500, 5500, and 6500 systems
■ SPARCserver 1000 or SPARCserver 1000E system
■ SPARCcenter 2000 or SPARCserver 2000E system
■ Netra NFS Server system
■ SPARCstorage Array subsystem
■ Sun StorEdge A1000 RAID Disk Array
■ Sun StorEdge A3000 subsystem
■ Sun StorEdge A5000 subsystem
■ Sun StorEdge A7000 Intelligent Storage Server
■ SPARCstorage MultiPack enclosure
■ SPARCstorage UniPack enclosure
NFS File Servers
This section provides a hardware overview of Sun NFS servers. TABLE 2-1 illustrates
the conditions under which a particular NFS file server will meet your needs. This
table is arranged by first presenting the Netra NFS Server, a dedicated NFS server.
Next, the table presents high capacity enterprise servers followed by workgroup
9

servers. Workgroup servers are dedicated to a group, department, or small
organization that shares common resources or tasks. Workgroup servers usually
provide a specific function such as an NFS file server.
TABLE 2-1 NFS Server Comparison Table
Server Maximum Specifications Positioning Key Advantages
Netra NFS Server —100 NFS clients
—24 Gbytes of internal
disk storage (48 Gbytes
with 4 Gbyte disk drives)
—2 subnets with Fast
Ethernet (100 BaseT),
Token Ring, FDDI
—9 subnets with 10BaseT
Ethernet
Dedicated NFS server
supporting both
workgroup and
department needs
Industry leading NFS price/
performance with RAID 5;
Fast response times; easy to
administer with HTML user
interface;
highly reliable with internal
UPS and RAID 5;
includes PC-NFS server
software;
exclusively supports NFS
applications;
RAID 5 and single file
system is preconfigured
Sun Enterprise 6000 —At least 600 NFS clients
—189 Gbytes of disk
storage (system enclosure
only)
—More than 20 subnets
per system
—Ethernet, optional
FDDI, SunATM, and
Token Ring
Most scalable and
expandable Sun server
Handles a minimum of
14,000 ops/second, which is
equivalent to 140,000 PC
clients; handles arbitrary
NFS client loads
Sun Enterprise 5000 —At least 400 NFS clients
—233 Gbytes of disk
storage (system enclosure
only)
—More than 20 subnets
per system
—Ethernet, optional
FDDI, SunATM, and
Token Ring
Data center server
system
Delivers high performance
and high availability for
enterprise wide applications
supporting thousands of
users; able to handle
arbitrary NFS client loads
Sun Enterprise 4000 —At least 400 NFS clients
—168 Gbytes of disk
storage (system enclosure
only)
—More than 20 subnets
per system
—Ethernet, optional
FDDI, SunATM, and
Token Ring
Compact yet highly
expandable system
Delivers high performance
scalability for department
applications in a distributed
network computing
environment; handles
arbitrary NFS client loads
10 NFS Server Performance and Tuning Guide for Sun Hardware • September 1998

Sun Enterprise 3000 —At least 300 NFS clients
—42 Gbytes of disk
storage (system enclosure
only)
—More than 20 subnets
per system
— Ethernet, optional
FDDI, SunATM, and
Token Ring
Affordable departmental
server
Applications support up to
hundreds of users in an
office environments; handles
arbitrary NFS client loads
Sun Enterprise 6500 —382 Gbytes internal
storage (system cabinet
only)
—Greater than 10
Terabytes of total disk
storage
—30 CPUs and 30 Gbytes
of memory
High end datacenter
server
Handles arbitrary NFS client
loads; Dynamic
Reconfiguration, Alternate
Pathing, and CPU power
control
Sun Enterprise 5500 —509 Gbytes of internal
storage (system cabinet
only)
—Greater than 6
Terabytes of maximum
disk storage
—14 CPUs and 14 Gbytes
of memory
Entry level datacenter
server
Handles arbitrary NFS client
loads; Dynamic
Reconfiguration, Alternate
Pathing, and CPU power
control
Sun Enterprise 4500 —33.6 Gbytes of internal
storage (system only)
—Greater than 4
Terabytes of total disk
storage
—14 CPUs and 14 Gbytes
of memory
High end departmental
server
Handles arbitrary NFS client
loads; Dynamic
Reconfiguration, Alternate
Pathing, and CPU power
control
Sun Enterprise 3500 —72.8 Gbytes of internal
storage (system only)
—Greater than 2
Terabytes of total disk
storage
—8 CPUs and up to 8
Gbytes of memory
Entry level departmental
server
Handles arbitrary NFS client
loads; Dynamic
Reconfiguration, Alternate
Pathing, and CPU power
control
SPARCcenter 2000 or
2000E
—500 NFS clients
—36 subnets
—731 Gbytes of storage
—Ethernet, FDDI,
SunATM, and Token Ring
Highest capacity;
multipurpose enterprise
server (the total solution
for an entire company)
Centralized administration
maximum headroom for
growth; multiprocessor, I/
O, and network performance
scalability
TABLE 2-1 NFS Server Comparison Table (Continued)
Server Maximum Specifications Positioning Key Advantages
Chapter 2 Hardware Overview 11

SPARCserver 1000 or
1000E
—300 NFS clients
—12 subnets
—395 Gbytes of storage
—Ethernet, FDDI,
SunATM, and Token Ring
High capacity
multipurpose
workgroup server
Excellent capacity
performance; multipurpose
server (NFS, compute,
database), affordable,
scalable, integrated
packaging
Sun Enterprise 450 —Used in environments
that require large
amounts of disk storage
with fast or multiple I/O
channels to clients or to
the network
Mid-range server Supports RAID 1 (disk
mirroring), RAID 3 (striping
data and parity across drive
groups), and RAID 5 (hot
spares for FC-AL disks)
Sun Enterprise 250
Server
—Up to 54 Gbytes of disk
storage, dual CPU
processor, and fast PCI I/
O channels
Mid-range server Supports RAID 0 (disk
striping), RAID 1 (disk
mirroring), and RAID 5 (hot
spares); automated hardware
failure notification; hot
sparing support
Sun Enterprise 150
Server
—Internal disk array
with up to twelve hot-
plugable disks providing
48 Gbytes of disk capacity
(based on 4 Gbyte disks)
High end workgroup
server
Supports RAID 0 (disk
striping) RAID 1 (disk
mirroring) and RAID 5 (hot
spares); high level of I/O
throughput and capacity;
significant expansion
capabilities; advanced I/O
and networking
TABLE 2-1 NFS Server Comparison Table (Continued)
Server Maximum Specifications Positioning Key Advantages
12 NFS Server Performance and Tuning Guide for Sun Hardware • September 1998
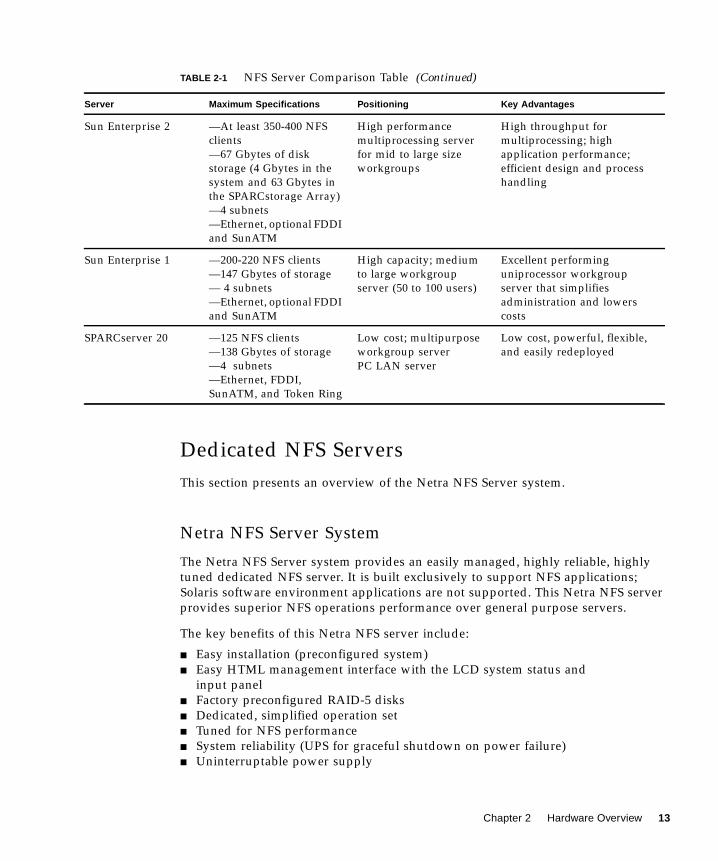
Dedicated NFS Servers
This section presents an overview of the Netra NFS Server system.
Netra NFS Server System
The Netra NFS Server system provides an easily managed, highly reliable, highly
tuned dedicated NFS server. It is built exclusively to support NFS applications;
Solaris software environment applications are not supported. This Netra NFS server
provides superior NFS operations performance over general purpose servers.
The key benefits of this Netra NFS server include:
■ Easy installation (preconfigured system)
■ Easy HTML management interface with the LCD system status and
input panel
■ Factory preconfigured RAID-5 disks
■ Dedicated, simplified operation set
■ Tuned for NFS performance
■ System reliability (UPS for graceful shutdown on power failure)
■ Uninterruptable power supply
Sun Enterprise 2 —At least 350-400 NFS
clients
—67 Gbytes of disk
storage (4 Gbytes in the
system and 63 Gbytes in
the SPARCstorage Array)
—4 subnets
—Ethernet, optional FDDI
and SunATM
High performance
multiprocessing server
for mid to large size
workgroups
High throughput for
multiprocessing; high
application performance;
efficient design and process
handling
Sun Enterprise 1 —200-220 NFS clients
—147 Gbytes of storage
— 4 subnets
—Ethernet, optional FDDI
and SunATM
High capacity; medium
to large workgroup
server (50 to 100 users)
Excellent performing
uniprocessor workgroup
server that simplifies
administration and lowers
costs
SPARCserver 20 —125 NFS clients
—138 Gbytes of storage
—4 subnets
—Ethernet, FDDI,
SunATM, and Token Ring
Low cost; multipurpose
workgroup server
PC LAN server
Low cost, powerful, flexible,
and easily redeployed
TABLE 2-1 NFS Server Comparison Table (Continued)
Server Maximum Specifications Positioning Key Advantages
Chapter 2 Hardware Overview 13

This server meets the demands of high speed network environments. Because this
server delivers high performance for NFS operations, it is most often installed in
departments and workgroups where data access requirements are high and other
servers are available for running applications and system management software
(see FIGURE 2-1).
FIGURE 2-1 Environments Supported by the Netra NFS Server
As FIGURE 2-1 shows, the Netra NFS Server system supports both workgroup and
department needs.
Netra NFSServer Software Support
The easy to use customized Netra NFS SmartServe™ software, which is focused
exclusively on NFS applications, is tuned for NFS performance and is easy to
administer. The software has the following features:
■ Modified Solaris operating environment (dedicated and optimized for NFS)
PC
WorkstationPC
Mac
Clients
Workgroup
Workgroup
Workgroup
Netra NFS
Netra NFSserver
server
General-purposeserver
General-purposeserver
Department
14 NFS Server Performance and Tuning Guide for Sun Hardware • September 1998

■ SNMP agent
■ Single file system and RAID 5 preconfigured
■ Backup software for online backups
■ Support for NFS Version 2 and NFS Version 3
■ Disk management support (RAID level 5 for storage management)
■ Failure management and recovery
■ System performance tuning (stable memory and NFS Smart Cache)
■ PCNFSD (to use with NFS on PCs)
Netra NFS Server Hardware Overview
This server is based on the Ultra 1 processor board, which is designed to deliver
balanced system performance. With twelve slots of data disks, the data disk capacity
of this server is 24 Gbytes (48 Gbytes with 4 Gbyte disk drives). The disk drives are
hot plugable. A 10BaseT Ethernet controller is built onboard.
One of the three SBus slots are used for ISP controllers. The second SBus slot
contains a 100BaseT network card. The third SBus slot is available for additional
network interfaces.
This system comes in two options: tower and rack-ready. Four rack-ready systems
can be installed in standard Sun racks. The system also has a standard 3.5-inch
diskette drive and a 644 Mbyte capacity CD-ROM drive. The eight SIMM slots can
store up to 512 Mbytes of RAM.
Enterprise Servers
Sun has a range of enterprise servers. This section discusses the following enterprise
servers:
■ Sun Enterprise 4x00, 5x00, and 6x00 servers
■ SPARCcenter 2000/2000E servers
■ SPARCserver 1000/1000E servers
Sun Enterprise 4000, 5000, and 6000 Systems
The Sun Enterprise 6000 server system, the Sun Enterprise 5000 server system and
the Sun Enterprise 4000 server system are available in two enclosures (see
FIGURE 2-2):
■ Enterprise 6000 or 5000 is a 56-inch cabinet containing either a 16-slot or 8-slot
card cage.
■ Enterprise 4000 is a stand-alone enclosure containing an 8-slot card cage.
Chapter 2 Hardware Overview 15

FIGURE 2-2 Sun Enterprise 6000 and 5000 Server Cabinet System and Sun Enterprise 4000Stand-alone System
The same CPU/memory board, I/O boards, disk board, processor modules, memory
SIMMs, power modules, and cooling modules are used in all enclosures.
The minimum configuration for the Sun Enterprise 4000, 5000, and 6000 is:
■ 16-slot or 8-slot card cage
■ Modular power supply
■ Fan tray (cabinet servers) or fan box (standalone server)
■ Clock board
■ CPU/memory board
■ I/O board
■ Peripheral power supply
■ AC distribution unit
■ SCSI receptacle for removable media, including CD-ROM
Sun Enterprise 6000/5000 are16-slot or 8-slot cabinet servers
Sun Enterprise 4000 is an8-slot stand-alone server
16 NFS Server Performance and Tuning Guide for Sun Hardware • September 1998

Sun Enterprise systems have extensive error detection mechanisms, and an
Automatic System Reconfiguration (ASR) feature that enables the system to be
rebooted with failed components (such as CPUs, memory, or I/O) disabled. When an
error is detected, the system is reconfigured so that the board containing the failed
components is placed in low power mode and is no longer accessible.
The hot-plugable feature inserts a new board into a powered up system, despite
being “live,” or being supplied with electrical power. Once a working board is
added to a powered on system with the hot-plugable feature, the Solaris 2.5.1 or 2.6
software environments will not use the new board until the system is rebooted. The
systems also support hot-plugable disk drives and redundant, hot-plugable power
and cooling units.
High speed networking is supported by integrated 10 or 100 Mb Ethernet and
optional ATM interface.
The systems support remote control administration, which enables remote rebooting
and power cycling.
The system monitor for these servers is Solstice™ SyMON™, a system performance
tool that you can use to:
■ Monitor the performance of a large server with multiple processors, I/O, and
disks.
■ Optimize the configuration and throughput of the server.
■ Identify hardware and software failures quickly. Failures range from major
failures (CPU crash), to minor failures (slow cooling fan). Solstice SyMON
identifies the component or software and its location.
■ Monitor hardware performance to detect incipient hardware failure (soft read
errors on a disk).
Sun Enterprise 3500, 4500, 5500, and 6500 Systems
The 3500-6500 mid range server line uses the 336 MHz UltraSPARC™ processor and
the 84MHz to 100 MHz interconnect called the Sun Gigaplane™ system bus. This
server family includes hot-pluggable disk drives, processors, power supplies and
cooling. Dynamic Reconfiguration and Alternate Pathing software, which lets you
add, remove, or replace system resources while maintaining application availability,
is a new feature of these servers. The server family also has CPU power control, a
new feature.
The Sun™ Enterprise™3500 server, designed to be an entry-level departmental
server, is contained in a tower/deskside enclosure. It has five system slots that can
be used for either CPU/memory boards or I/O boards and contains up to eight
CPUs. It has up to 8 Gbytes of memory, 72.8 GBytes of internal disk storage, and can
Chapter 2 Hardware Overview 17
provide greater than 2 Terabytes of maximum total disk storage. The system also
includes one CD-ROM drive and an optional tape drive. It includes disk bays for
eight dual-ported FC-AL disk drives.
The Sun Enterprise 4500 server is housed in a tabletop enclosure and has eight
system slots providing capacity for up to 14 CPUs. It is designed to be a high end
departmental server and has up to 14 Gbytes of memory. The server provides 33.6
Gbytes of interal storage and can provide up to 4 Terabytes of maximum total disk
storage. The server also contains one tape drive.
The Sun Enterprise 5500 server, designed to be an entry-level datacenter server, also
has eight system slots providing up to 14 CPUs but the enclosure is a 68-inch
cabinet. It contains up to 14 Gbytes of memory. It provides up to 509 Gbytes of
internal storage and has the capability to provide greater than 6 Terabytes of
maximum total disk storage. The server also contains a tape library.
The Sun Enterprise 6500 server, a high-end datacenter server, also is housed in a 68-
inch cabinet. It has 16 system slots and can contain up to 30 CPUs and 30 Gbytes of
memory. The server provides 382 Gbytes of internal storage and can provide greater
than 10 Terabytes of maximum total disk storage. The server also contains a tape
library. The system rack provides support for multiple internal disk subsystems and
tape options.
18 NFS Server Performance and Tuning Guide for Sun Hardware • September 1998

FIGURE 2-3 Front View of the Sun Enterprise 6500, 5500, and 4500 Servers
SPARCcenter 2000 and SPARCcenter 2000E Systems
The SPARCcenter 2000 and the SPARCcenter 2000E systems, which were introduced
in 1992, provide the computing solution for a company. As such, the SPARCcenter
2000 system and the SPARCcenter 2000E system are multifunctional network NFS
file servers. They support less than 500 NFS clients and have the flexibility required
for dedicated or multifunctional application environments.
The SPARCcenter 2000 system and the SPARCcenter 2000E system provide
scalability and extensive expansion in these areas:
■ CPU processor power
■ Memory capability
■ I/O connectivity
They meet the following requirements:
■ High capacity I/O requirements of corporate data centers
■ Computationally intensive demands of other organizations
Sun Enterprise 6500/5500 Sun Enterprise 4500
Chapter 2 Hardware Overview 19

The heart of the SPARCcenter 2000 system or the SPARCcenter 2000E system is a
high-speed packet-switched bus complex that provides very high data transfer
bandwidth. The backplane supports two distinct XDBuses operating in parallel.
The SPARCcenter 2000 system or the SPARCcenter 2000E system use up to twenty
SuperSPARCTM modules in a shared-memory symmetric multiprocessing
configuration, meeting most performance needs. You can expand or upgrade the
processing capability by adding SuperSPARC modules.
Main memory is configured in multiple logical units that are installed in the
bus complex.
The I/O is expandable. For example, you can configure up to 40 SBus slots on
10 independent buses. The large I/O capacity and configurability makes the
SPARCcenter 2000 system or the SPARCcenter 2000E system suitable for very
large applications.
The system monitor for this server is Solstice SyMON.
SPARCserver 1000 and the SPARCserver 1000E System Features
The SPARCserver 1000 and the SPARCserver 1000E systems have the
following features:
■ Up to four system boards can be installed
■ Up to eight SuperSPARC processors (two per system board) can be installed
■ Up to 2 Gbytes of main memory (using 32 Mbyte SIMMs) can be installed
■ Up to 16.8 Gbytes of internal storage
■ 50 MHz system clock speed in the SPARCserver 1000E system (40 MHz in the
SPARCserver 1000 system)
■ 25 MHz SBus speed in the SPARCserver 1000E system (20 MHz in the
SPARCserver 1000 system)
■ When connected to 12 SPARCstorage Array subsystems, the SPARCserver 1000 or
1000E systems provide up to 756 Gbytes of external storage
■ Up to 12 SBus slots
■ Onboard SCSI-2 port and twisted pair Ethernet on each system board
■ Internal 5 Gbyte 4mm tape drive (or 10 Gbyte 8mm tape drive)
■ Internal CD-ROM drive
■ NVRAM-NVSIMM Prestoserve NFS accelerator (optional)
Workgroup Servers
This section presents an overview of the following workgroup servers:
■ Sun Enterprise 150 server system
■ Sun Enterprise 250 serversystem
20 NFS Server Performance and Tuning Guide for Sun Hardware • September 1998

■ Sun Enterprise 450 serversystem
■ Sun Enterprise 2 server system
■ Sun Enterprise 1 server system
■ SPARCserver 20 server system
The highest capacity workgroup servers are presented first.
Sun Enterprise 150 Server System
The Sun Enterprise 150 server system is a tower workgroup server based on the 167
MHz UltraSPARC™ microprocessor. It has the following features:
■ Autosensing 10/100 Mbps Fast Ethernet
■ 10 Mbps Ethernet
■ 20 Mbyte/second Fast/Wide SCSI-2 peripheral interface
■ ECC-protected memory
■ Internal disk array with up to twelve hot-plugable disks supporting RAID 0 (disk
striping), RAID 1 (disk mirroring), and RAID 5 (hot spares) providing 48 Gbytes
of disk capacity (based on 4 Gbyte disk drives)
■ 1.44 Mbyte diskette drive
■ 644 Mbyte CD-ROM drive
The Sun Enterprise 150 server system is ideal for an NFS server because it is a high-
end workgroup server with high I/O performance and fast system throughput.
FIGURE 2-4 shows a front view of the server.
Chapter 2 Hardware Overview 21

FIGURE 2-4 Sun Enterprise 150 Front View
For additional disk storage, you can attach either the Sun StorEdge UniPack or the
Sun StorEdge MultiPack to the server. If you need greater amounts of disk storage,
use the SPARCstorage Array to the server. For a backup device, use the
SPARCstorage Library, which olds ten cartridges in a removable magazine for an
average total capacity of 140 Mbytes.
Sun Enterprise 250 System
The Sun Enterprise 250 system server is a mid-range server with up to 54 Gbytes of
disk storage, dual CPU processors, and fast PCI I/O channels.
Software features are:
■ RAID 0 (disk striping), RAID 1 (disk mirroring), and RAID 5 (hot spares)
■ System performance and configuration monitors
■ Automated hardware failure notification
■ Error and panic logging
■ Temperature sensing and fan control
■ Backup power supply failure detection
■ Hot sparing support
■ Automatic fault detection, response, and recovery
■ Logging file systems
22 NFS Server Performance and Tuning Guide for Sun Hardware • September 1998

■ Secure remote system monitoring feature for geographically distributed or
physically inaccessible systems
Hardware features are:
■ Four PCI slots supporting up to four full size PCI cards (three regular PCI slots
and one enhanced PCI slot)
■ Up to sixteen SIMM slots, which support 16, 32, 64, or 128 Mbyte SIMMs totaling
up to 2 Gbytes of memory capacity
■ 10/100 Mbit Ethernet
■ 20 Mbyte/second Fast Wide SCSI
■ Up to two CPU modules (UltraSPARC-II)
■ Up to six 1.6-inch high or 1-inch high UltraSCSI disks
■ 1.44 Mbyte diskette drive
■ 644 Mbyte CD-ROM drive
■ Two 5 1/4-inch x 1.6-inch removable media bays
■ Two high speed synchronous/asynchronous serial ports
■ Up to two redundant hot swapable power supplies
■ Module to provide remote system monitoring capability
■ Supports rack mounting allowing the system to integrate easily into a computer
room environment
FIGURE 2-5shows a front view of the Sun Enterprise 250 system.
FIGURE 2-5 Sun Enterprise 250 Front View
Chapter 2 Hardware Overview 23

Sun Enterprise 450 System
The Sun Enterprise 450 system server, based on the UltraSPARC-II™ processor, is
designed for mid-range server markets that require large amounts of local disk
storage with fast or multiple I/O channels to clients or to the network.
Software features are:
■ Support for RAID 1 (disk mirroring), RAID 3 (striping data and parity across
drive groups) and RAID 5 (hot spares for FC-AL disk drives)
■ System performance and configuration monitors
■ Automated hardware failure notification
■ Error and panic logging
■ Temperature sensing and fan control
■ Backup power supply failure detection
■ Hot sparing support
■ Automatic fault detection, response, and recovery
■ Logging file systems
Hardware features are:
■ 10 PCI slots supporting up to 10 full size PCI cards (seven regular PCI slots and
three enhanced PCI slots)
■ Up to sixteen SIMM slots, which support 32, 64, 128 or 256 Mbyte SIMMs totalling
up to 4 Gbytes of memory capacity
■ 10/100 Mbit Ethernet
■ 20 Mbyte/second Fast Wide SCSI
■ Up to four CPU modules (UltraSPARC-II)
■ Up to twenty hot swappable FC-AL disks and up to two 1.6-inch high SCSI disks
that provide up to 84 Gbytes internal storage
■ Up to 6 Terabytes of external disk storage
■ 1.44 Mbyte diskette drive
■ 644 Mbyte CD-ROM drive
■ Two 5 1/4-inch bays for optional tape backup
■ Two high speed synchronous/asynchronous serial ports
■ Up to three redundant hot swapable power supplies, which can be added one at a
time to improve reliability and provide growth as needed
■ Supports rack mounting allowing the system to integrate easily into a computer
room environment
24 NFS Server Performance and Tuning Guide for Sun Hardware • September 1998

FIGURE 2-6 Front View of the Sun Enterprise 450 Server
You can attach up to two external tape devices or a single size or twelve drive Sun
StorEdge MuliPack to the SCSI port. You can attach additional tape or disk devices
by installing PCI host adapter cards. If you require large amounts of disk storage,
you can also attach the Sun StorEdge A3000 subsystem to the system that provides a
reduntant array of inexpensive disks (RAID).
Sun Enterprise 1 and 2 Systems
The Sun Enterprise 1 system is the first member of a new class of workstations based
on the UltraSPARC-I processor and is designed to deliver balanced system
performance.
The Sun Enterprise 1 system can be used as a high capacity NFS server for medium
to large workgroups (50 to 100 users). It is designed for reliability, availability, and
serviceability. It enables easy access to replace disk drives, SIMMs, and graphics
cards.
The Sun Enterprise 2 system is a multiprocessor system based on the UltraSPARC-I
processor. It is standard with Fast/Wide SCSI and Fast Ethernet, which enables the
data throughput capability of this system to include the disk I/O and the network
traffic. The system also has a 64-bit SBus running at 25 MHz giving maximum SBus
throughput.
The Sun Enterprise 2 system can be used as an NFS server for mid- to large-
sized workgroups.
Chapter 2 Hardware Overview 25

The Ultra SPARC CPU is matched by a very high performance crossbar-switched
interconnect that can move data at peak rates of 1.3 Gbytes/second. This
interconnect, the Ultra Port Architecture (UPA), is the key to providing the greatly
enhanced memory bandwidth. Both the Sun Enterprise 1 and 2 systems have a
64-bit SBus running at 25 MHz giving maximum SBus throughput.
The architecture was designed to be fully compatible with previous generations of
workstations so that all Solaris operating environment applications can run
unchanged.
FIGURE 2-7 shows a front view of the Sun Enterprise 1 system.
FIGURE 2-7 Sun Enterprise 1 Front View
SPARCserver 20 System
The SPARCserver 20 system, introduced in 1994, is designed to be a workgroup NFS
file server or a database server in an office environment. It is based on the same
MBus and SBus technologies as the SPARCserver 10 system. Performance is
increased over the SPARCserver 10 by using faster MBus and SBus technology, and
faster SPARC modules. The SPARCserver 20 system has increased computing and
network performance.
The SPARCserver 20 system is available in three uniprocessor configurations and
three multiprocessor configurations.
The uniprocessor configurations are:
■ Model 50—50 MHz SuperSPARC processor
■ Model 51—50 MHz SuperSPARC processor and 1 Mbyte SuperCache‰
■ Model 61—60 MHz SuperSPARC processor and 1 Mbyte SuperCache
■ Model 71—75 MHz SuperSPARC processor and 1 Mbyte SuperCache
■ Model 151—one 150 MHz HyperSPARC processor and 0.5 Mbyte external cache
26 NFS Server Performance and Tuning Guide for Sun Hardware • September 1998

The multiprocessor configurations are:
■ Model 502MP—two 50 MHz SuperSPARC processors
■ Model 514MP—four 50 MHz SuperSPARC processors and 1 Mbyte SuperCache
■ Model 612MP—two 60 MHz SuperSPARC processors and 1 Mbyte SuperCache
■ Model 712—two 75 MHz SuperSPARC processors and 1 Mbyte SuperCache
■ Model 152MP—two 150 MHz HyperSPARC processors and 0.5 Mbyte of external
cache
FIGURE 2-8 shows the front view of the SPARCserver 20 system.
FIGURE 2-8 SPARCserver 20 System Front View
SPARCserver 20 System Features
The SPARCserver 20 system features include:
■ More than 2 Gbytes of internal hard disk storage (two 1.05 Gbyte disk drives)
■ Up to 126 Gbytes of disk storage in the SPARCstorage Array (Model 101)
subsystems when directly connected to four SPARCstorage Array subsystems
■ 1.44 Mbyte diskette drive (optional)
■ 644 Mbyte CD-ROM drive (optional)
■ Two serial ports, one parallel port
■ Twisted-pair Ethernet
■ Up to 512 Mbytes of memory (60 ns SIMMs)
■ AUI Ethernet (optional) (can have up to 9 Ethernet networks)
■ SBus or NVRAM-NVSIMM Prestoserve NFS accelerator (optional)
Chapter 2 Hardware Overview 27

Disk Expansion Units
This section describes an overview of the following disk expansion units:
■ SPARCstorage ArrayTM subsystem
■ Sun StorEdge A1000 RAID system
■ Sun StorEdge A3000 subsystem
■ Sun StorEdge A5000 subsystem
■ Sun StorEdge A7000 Intelligent Storage Server
■ Sun StorEdge MultiPackTM
■ Sun StorEdge UniPackTM
SPARCstorage Array Subsystem
To expand your disk storage, consider the SPARCstorage Array subsystem. This
disk array is a high-performance and high-capacity companion unit for the Sun
Enterprise 4000, 5000, or 6000 systems, SPARCcenter 2000 or 2000E, SPARCserver
1000 or 1000E, Sun Enterprise 150 system, Sun Enterprise 2 system, and the
SPARCserver 20 system.
The Model 101 uses 1.05 Gbyte single connector 3.5-inch disk drives. Each disk
array contains three drive trays. Each drive tray supports up to ten 3.5-inch single-
connector SCSI disk drives. All disk drive SCSI addresses are hardwired. The
position of the disk drive in the drive tray automatically sets the SCSI addresses.
Each disk array uses six internal fast, wide SCSI buses. Each drive tray contains two
SCSI buses that support five disk drives for each SCSI bus.
FIGURE 2-9 shows a front view of the SPARCstorage Array subsystem.
28 NFS Server Performance and Tuning Guide for Sun Hardware • September 1998

FIGURE 2-9 Front View of the SPARCstorage Array Subsystem
FIGURE 2-10 shows how you can connect the SPARCstorage Array subsystem to your
NFS server.
FIGURE 2-10 SPARCstorage Array Subsystem Installation Options
The SPARCstorage Array subsystem uses RAID (Redundant Array of Inexpensive
Disks) technology. RAID 0 stripes data without parity, RAID 1 does disk mirroring,
RAID 0+1 does mirroring optimized stripes, and RAID 5 does striping data with
parity.
SPARCstorage Array
TabletopSPARCserver 20shown on top
Tower StackMaximum of (4)arrays orSPARCserver1000 systems
Sun RackMaximum of (5)SPARCstorageArray subsystems
Chapter 2 Hardware Overview 29
Within the disk array, independent disks plus RAID levels 5, 1, 0, 0+1 are available
at the same time so you can easily match data layouts to meet the specific
requirements for capacity, performance, high availability, and cost.
If any disk in a RAID-5, 1, or 0+1 group fails, an optional hot spare (if configured) is
automatically swapped to replace the failed disk. Continuous, redundant data
protection is provided, even if a disk fails.
Warm plug service lets you replace one or more disks without powering down the
system and the disk array, or rebooting the system. You can obtain warm plug
service if multiple disk arrays are configured.
Using the SPARCstorage Array subsystem can improve NFS performance because its
processor manages and schedules disk I/O.
The SPARCstorage Manager software is provided with the disk array and provides
similar functionality to Online: Disk Suite software. Since there are often many more
disks to manage in the SPARCstorage Array subsystem, the SPARCstorage Manager
software has an intuitive GUI interface.
Sun StorEdge A1000 RAID Disk Array
The Sun StorEdge A1000 unit is a RAID controller-based configuration. It is
designed as a RAID solution for workgroup servers and contains the following:
■ RAID controller module
■ Two power supplies(hot swappable)
■ Battery
■ Dual cooling fans (hot swappable)
■ Up to twelve disk drives (hot swappable)
The RAID Manager controller module provides disk array management services. It
supports dual SCSI hosts on a 16-bit SCSI-2 bus. The two SCSI controllers inside the
controller module manage data distribution and storage for up to twelve disk drives.
The controllers also perform system status and fault detection functions.
The RAID Manager software allows you to reset the disk array in different RAID
configurations
FIGURE 2-11shows a front view of a twelve drive system.
30 NFS Server Performance and Tuning Guide for Sun Hardware • September 1998

FIGURE 2-11 Sun StorEdge A1000 Front View of a Twelve Drive System
Sun StorEdge A3000 Subsystem
The Sun StorEdge A3000 subsystem is a redundant array of inexpensive disks
(RAID) product. It is offered as a companion unit for the following systems:
■ SPARCserver 1000
■ SPARCcenter 2000
■ Sun Enterprise 3x00, 4x00, 5x00, and 6x00
■ Sun Enterprise 450 and 250
It is a high performance rack-mounted disk array controller that features redundant
power and cooling by incorporating hot-plug technology to support the unexpected
loss of one controller, one fan, or one power supply. Failed disk driver can be hot-
plugged without stopping I/O activity to the subsystem.
The controller module, which is installed in the subsystem, supports dual SCSI hosts
on a 16-bit SCSI-2 bus. In addition, the unit provides the same SCSI-2 bus interface
for up to five differential drive trays in the expansion cabinet.
There are two SCSI controllers inside the controller module that use five
independent drive channels to manage data distribution and storage for up to thirty-
five disk drives. The controllers perform system status and fault detection functions
as well.
Chapter 2 Hardware Overview 31

The controller module combines disk array technology with redundant modular
components to provide fast data transfer rates, plus reliable, high-volume data
retrieval and storage functions across multiple drives. It works with the RAID
Manager software, a disk array management program for configuring, monitoring,
and troubleshooting the disk array and provides high-performance disk array
management services.
As part of this overall disk management system, the controller module supports the
following disk array elements and configurations:
■ RAID levels 0 (disk striping), 1 (disk mirroring), 0+1 (disk striping plug disk
mirroring), 3 (data and parity are striped across a drive group), and 5 (hot spares)
■ Redundant, dual-active controller configurations
■ Hot swapable components (controllers, fans, and so on)
■ Fast write cache
With RAID 3, data and parity are striped across a drive group. One drive is used for
redundancy. All other drives are available for storing user data. FIGURE 2-12 shows
a front view of the Sun StorEdge A3000 subsystem.
FIGURE 2-12 Front View of the Sun StorEdge A3000 Subsystem
32 NFS Server Performance and Tuning Guide for Sun Hardware • September 1998

Sun StorEdge A5000 Subsystem
This high-performance and high-availability storage subsystem is designed for the
Sun Enterprise 3x00, 4x00, 5x00, and 6x00 family of servers. It replaces the
SPARCstorage Array. This subsystem uses 100 Mbit/second Fibre Channel
Arbitrated Loop (FC-AL) to create disk arrays that offer two to four times the
performance of SCSI-based disk arrays.
The hardware features of this product are:
■ 100 Mbit/second PCI and FC-AL host adapters
■ Fully redundant hardware drive chassis for rack and tabletop configurations
supporting 1.6-inch and 1-inch disk drives
■ Optional FC-AL hub
The software features of this product are:
■ Volume manager with RAID support
■ I/O driver for the FC-AL host adapter
■ Solstice SyMON and SNMP support
■ Management GUI
This subsystem can store up to 112 Gbytes of information (using 1.6-inch disk
drives) or 88 Gbytes of information (using 1-inch disk drives). You can attach up to
four disk enclosures using one host adapter. The components in the enclosure are
redundant and can be replaced while the subsystem is operating.
FIGURE 2-13 shows a front view of the array.
FIGURE 2-13 Front View of the Sun StorEdge A5000 Subsystem
Chapter 2 Hardware Overview 33

Sun StorEdge A7000 Intelligent Storage Server
The Sun StorEdge A7000 Intelligent Storage Server is a mainframe-class disk array
system containing nearly 3 Terrabytes of disk storage. It is designed for the Sun
Enterprise 6000 or 6500 data center system.The system contains Symmetric
Multiprocessor (SMP) nodes as storage processors. The DataShare software, which
runs on this disk array, permits both mainframe and open systems’ hosts to directly
share the data on the same data volume.
Hardware features of this disk array include fully redundant hardware controllers,
cache, hot-pluggable disks, fans, power, and power cords.
Software features include configurable RAID levels, self-diagnostics, health-
monitoring, environmental-monitoring, and performance-monitoring.
Serviceablity features include automatic ”phone home“ and problem reporting
supports by on-line diagnostics and repair capability.
Sun StorEdge MultiPack
The Sun StorEdge MultiPack enclosure, which is Fast Wide SCSI, can adapt to 50-
pin or narrow hosts. It is self-terminating but it can be chained with units that
require external termination.
The Sun StorEdge MultiPack uses single connector disks and it is hot plugable. The
enclosure can either contain from two to six 1.5-inch disk drives or from two to
twelve 1-inch disk drives. To accommodate from two to twelve 1-inch disk drives
you must use an SBus SCSI host adapter.
This unit is an excellent RAID solution for desktop servers when you use the unit
with Sun StorEdge Volume Manager or Solstice DiskSuite. You can also use the
Sun StorEdge MultiPack with the Netra NFS server for fast and reliable network
attached storage.
FIGURE 2-14shows a front view of the Sun StorEdge MultiPack
34 NFS Server Performance and Tuning Guide for Sun Hardware • September 1998
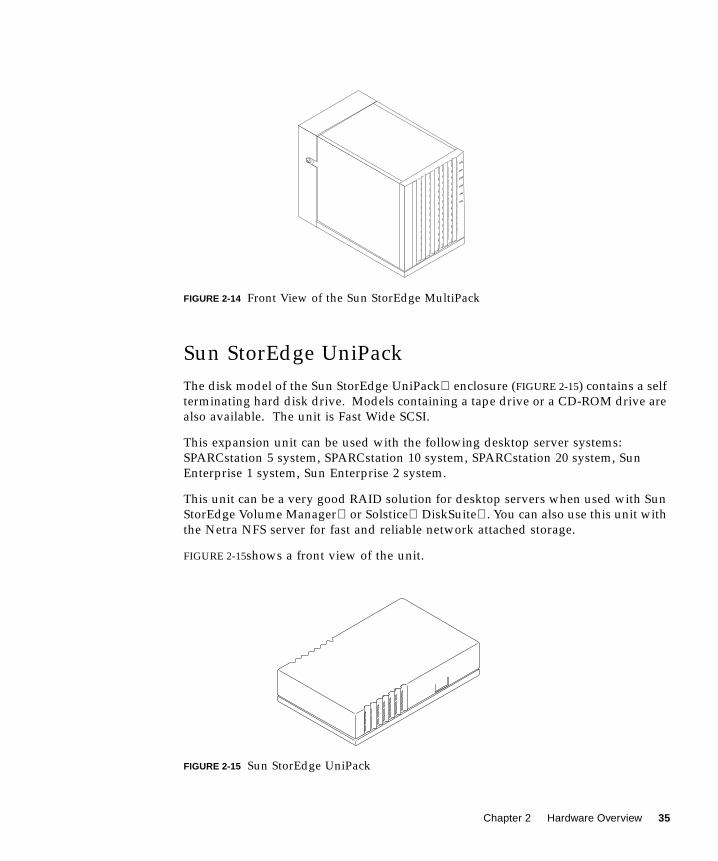
FIGURE 2-14 Front View of the Sun StorEdge MultiPack
Sun StorEdge UniPack
The disk model of the Sun StorEdge UniPack enclosure (FIGURE 2-15) contains a self
terminating hard disk drive. Models containing a tape drive or a CD-ROM drive are
also available. The unit is Fast Wide SCSI.
This expansion unit can be used with the following desktop server systems:
SPARCstation 5 system, SPARCstation 10 system, SPARCstation 20 system, Sun
Enterprise 1 system, Sun Enterprise 2 system.
This unit can be a very good RAID solution for desktop servers when used with Sun
StorEdge Volume Manager or Solstice DiskSuite. You can also use this unit with
the Netra NFS server for fast and reliable network attached storage.
FIGURE 2-15shows a front view of the unit.
FIGURE 2-15 Sun StorEdge UniPack
Chapter 2 Hardware Overview 35

36 NFS Server Performance and Tuning Guide for Sun Hardware • September 1998

CHAPTER 3
Analyzing NFS Performance
This chapter explains how to analyze NFS performance and describes the general
steps for tuning your system. This chapter also describes how to verify the
performance of the network, server, and each client.
Tuning the NFS Server
When you first set up the NFS server, you need to tune it for optimal performance.
Later, in response to a particular problem, you need to tune the server again to
optimize performance.
Optimizing Performance
Follow these steps in sequence to improve the performance of your NFS server.
1. Measure the current level of performance for the network, server, and each client.
See “Checking Network, Server, and Client Performance” later in this chapter.
2. Analyze the gathered data by graphing it. Look for exceptions, high disk and
CPU utilization, and high disk service times. Apply thresholds or performance
rules to the data.
3. Tune the server. See Chapter 4.
4. Repeat Steps 1 through 3 until you achieve the desired performance.
37

Resolving Performance Problems
Follow these steps in sequence to resolve performance problems with your
NFS server.
1. Use tools then observe the symptoms to pinpoint the source of the problem.
2. Measure the current level of performance for the network, server, and each client.
See “Checking Network, Server, and Client Performance.”
3. Analyze the data gathered by graphing the data. Look for exceptions, high disk
and CPU utilization, and high disk service times. Apply thresholds or
performance rules to the data.
4. Tune the server. See Chapter 4.
5. Repeat Steps 1 through 4 until you achieve the desired performance.
Checking Network, Server, and ClientPerformance
Before you can tune the NFS server, you must check the performance of the
network, the NFS server, and each client. The first step is to check the performance
of the network. If disks are operating normally, check network usage because a slow
server and a slow network look the same to an NFS client.
FIGURE 3-1 illustrates the steps you must follow in sequence to check the network.
38 NFS Server Performance and Tuning Guide for Sun Hardware • September 1998

FIGURE 3-1 Flow Diagram for Checking the Network Performance
▼ To Check the Network
1. Find the number of packets, collisions, or errors on each network by typingnetstat -i 15.
To look at other interfaces use -I .
A description of the arguments to the netstat command follows:
server% netstat -i 15 input le0 output input (Total) outputpackets errs packets errs colls packets errs packets errs colls10798731 533 4868520 0 1078 24818184 555 14049209 157 89493751 0 43 0 0 238 0 139 0 085 0 69 0 0 218 0 131 0 244 0 29 0 0 168 0 94 0 0
TABLE 3-1 netstat -i 15 Command Arguments
-i Shows the state of the interfaces that are used for TCP/IP traffic
15 Collects information every 15 seconds
Find the number ofpackets andcollisions or errorson each network.
Determine how longa round trip echopacket takes on thenetwork. Displaypacket losses.
End
Chapter 3 Analyzing NFS Performance 39
In the netstat -i 15 display, a machine with active network traffic should show
both input packets and output packets continually increasing.
2. Calculate the network collision rate by dividing the number of output collisioncounts (Output Colls - le) by the number of output packets (le) .
A network-wide collision rate greater than 10 percent can indicate an overloaded
network, a poorly configured network, or hardware problems.
3. Calculate the input packet error rate by dividing the number of input errors (le)by the total number of input packets (le) .
If the input error rate is high (over 25 percent), the host may be dropping packets.
Transmission problems can be caused by other hardware on the network, as well as
heavy traffic and low-level hardware problems. Bridges and routers can drop
packets, forcing retransmissions and causing degraded performance.
Bridges also cause delays when they examine packet headers for Ethernet addresses.
During these examinations, bridge network interfaces may drop packet fragments.
To compensate for bandwidth-limited network hardware:
■ Reduce the packet size specifications.
■ Set the read buffer size, rsize , and the write buffer size, wrsize , when
using mount or in the /etc/vfstab file. Reduce the appropriate variable(s)
(depending on the direction of data passing through the bridge) to 2048.
If data passes in both directions through the bridge or other device, reduce
both variables:
If a lot of read and write requests are dropped and the client is communicating with
the server using the User Datagram Protocol (UDP), then the entire packet will be
retransmitted, instead of the dropped packets.
4. Determine how long a round trip echo packet takes on the network by typingping -sRv servername from the client to show the route taken by the packets.
If the round trip takes more than a few milliseconds, there are slow routers on the
network, or the network is very busy. Ignore the results from the first pingcommand. The ping -sRv command also displays packet losses.
server:/home /home/server nfs rw,rsize=2048,wsize=2048 0 0
40 NFS Server Performance and Tuning Guide for Sun Hardware • September 1998

The following screen shows the output of the ping -sRv command.
A description of the arguments to the ping command follows:
If you suspect a physical problem, use ping -sRv to find the response time of
several hosts on the network. If the response time (ms) from one host is not what
you expect, investigate that host.
The ping command uses the ICMP protocol’s echo request datagram to elicit an
ICMP echo response from the specified host or network gateway. It can take a long
time on a time-shared NFS server to obtain the ICMP echo. The distance from the
client to the NFS server is a factor for how long it takes to obtain the ICMP echo
from the server.
FIGURE 3-2 shows the possible responses or the lack of response to the
ping -sRv command.
client% ping -sRv servernamePING server: 56 data bytes64 bytes from server (129.145.72.15): icmp_seq=0. time=5. ms IP options: <record route> router (129.145.72.1), server(129.145.72.15), client (129.145.70.114), (End of record)64 bytes from server (129.145.72.15): icmp_seq=1. time=2. ms IP options: <record route> router (129.145.72.1), server(129.145.72.15), client (129.145.70.114), (End of record)
TABLE 3-2 Arguments to the ping -sRv Command
s Send option. One datagram is sent per second and one line of output is
printed for every echo response it receives. If there is no response, no
output is produced.
R Record route option. The Internet Protocol (IP) record option is set so that it
stores the route of the packet inside the IP header.
v Verbose option. CMP packets other than echo response that are received are
listed.
Chapter 3 Analyzing NFS Performance 41

FIGURE 3-2 Flow Diagram of Possible Responses to the ping -sRv Command
Checking the NFS Server
Note – The server used in the following examples is a large SPARCserver 690
configuration.
▼ To Check the NFS Server
1. Determine what is being exported by typing share .
server% share- /export/home rw=netgroup ““- /var/mail rw=netgroup ““- /cdrom/solaris_2_3_ab ro ““
Responsefrom server?
No
Yes
Is the serversaturated?
Yes
No
Is the networkslow?
Yes
No
Check configurationfiles carefully andreboot the server.
The server ornetwork is down orthere is a routingproblem.
Look for serverbottlenecks (seeTable 5-3 inChapter 5).
Look for networkbottlenecks (seeTable 5-4 inChapter 5).
42 NFS Server Performance and Tuning Guide for Sun Hardware • September 1998

2. Display the file systems mounted and the disk drive on which the file system ismounted by typing df -k .
If a file system is over 100 percent full, it may cause NFS write errors on the clients.
Note – For this example, the /var/mail and /export/home file systems are used.
Determine on which disk the file systems returned by the df -k command
are stored.
In the previous example, note that /var/mail is stored on /dev/dsk/c1t0d0s4and /export/home is stored on /dev/md/dsk/d100 , an Online: DiskSuitemetadisk.
3. Determine the disk number if an Online: DiskSuite metadisk is returned by thedf -k command by typing/usr/opt/SUNWmd/sbin/metastat disknumber.
In the previous example, /usr/opt/SUNWmd/sbin/metastat d100 determines
what physical disk /dev/md/dsk/d100 uses.
server% df -kFilesystem kbytes used avail capacity Mounted on/dev/dsk/c1t0d0s0 73097 36739 29058 56% //dev/dsk/c1t0d0s3 214638 159948 33230 83% /usr/proc 0 0 0 0% /procfd 0 0 0 0% /dev/fdswap 501684 32 501652 0% /tmp/dev/dsk/c1t0d0s4 582128 302556 267930 53% /var/mail/dev/md/dsk/d100 7299223 687386 279377 96% /export/home/vol/dev/dsk/c0t6/solaris_2_3_ab 113512 113514 0 100% /cdrom/solaris_2_3_ab
Chapter 3 Analyzing NFS Performance 43

The d100 disk is a mirrored disk. Each mirror is made up of three striped disks of
one size concatenated with four striped disks of another size. There is also a hot
spare disk. This system uses IPI disks (id X). SCSI disks (sd X) are treated
identically.
server% /usr/opt/SUNWmd/sbin/metastat d100d100: metamirror Submirror 0: d10 State: Okay Submirror 1: d20 State: Okay Regions which are dirty: 0%d10: Submirror of d100 State: Okay Hot spare pool: hsp001 Size: 15536742 blocks Stripe 0: (interlace : 96 blocks)
Device Start Block Dbase State Hot Spare/dev/dsk/c1t1d0s7 0 No Okay/dev/dsk/c2t2d0s7 0 No Okay/dev/dsk/c1t3d0s7 0 No Okay
Stripe 1: (interlace : 64 blocks)Device Start Block Dbase State Hot Spare/dev/dsk/c3t1d0s7 0 No Okay/dev/dsk/c4t2d0s7 0 No Okay/dev/dsk/c3t3d0s7 0 No Okay/dev/dsk/c4t4d0s7 0 No Okay
d20: Submirror of d100 State: Okay Hot spare pool: hsp001Size: 15536742 blocks Stripe 0: (interlace : 96 blocks)
Device Start Block Dbase State Hot Spare/dev/dsk/c2t1d0s7 0 No Okay/dev/dsk/c1t2d0s7 0 No Okay/dev/dsk/c2t3d0s7 0 No Okay
Stripe 1: (interlace : 64 blocks)Device Start Block Dbase State Hot Spare/dev/dsk/c4t1d0s7 0 No Okay/dev/dsk/c3t2d0s7 0 No Okay/dev/dsk/c4t3d0s7 0 No Okay/dev/dsk/c3t4d0s7 0 No Okay /dev/dsk/c2t4d0s7
44 NFS Server Performance and Tuning Guide for Sun Hardware • September 1998
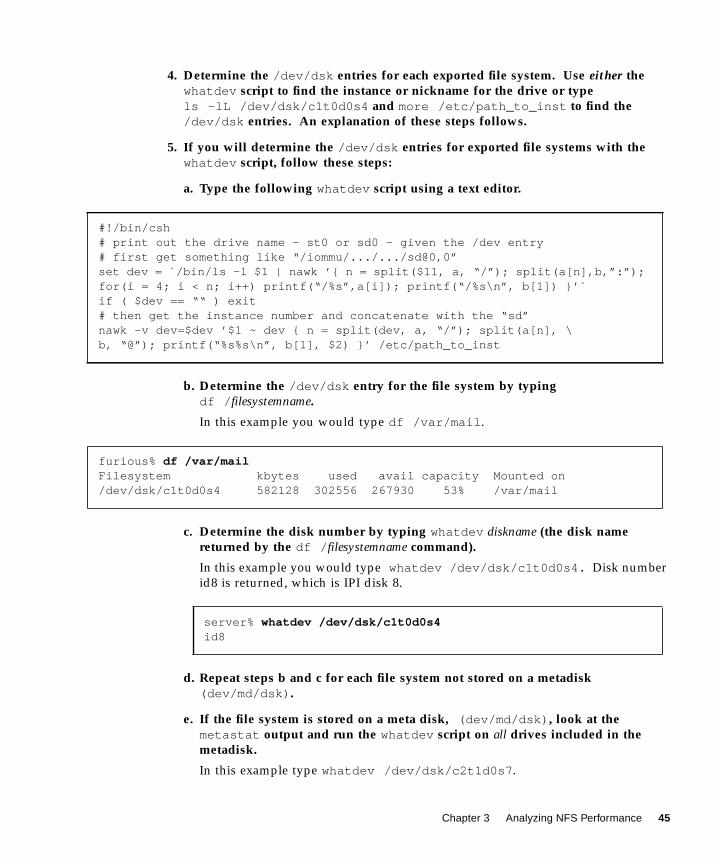
4. Determine the /dev/dsk entries for each exported file system. Use either thewhatdev script to find the instance or nickname for the drive or typels -lL /dev/dsk/c1t0d0s4 and more /etc/path_to_inst to find the/dev/dsk entries. An explanation of these steps follows.
5. If you will determine the /dev/dsk entries for exported file systems with thewhatdev script, follow these steps:
a. Type the following whatdev script using a text editor.
b. Determine the /dev/dsk entry for the file system by typingdf / filesystemname.
In this example you would type df /var/mail .
c. Determine the disk number by typing whatdev diskname (the disk namereturned by the df / filesystemname command).
In this example you would type whatdev /dev/dsk/c1t0d0s4. Disk number
id8 is returned, which is IPI disk 8.
d. Repeat steps b and c for each file system not stored on a metadisk(dev/md/dsk) .
e. If the file system is stored on a meta disk, (dev/md/dsk) , look at themetastat output and run the whatdev script on all drives included in themetadisk.
In this example type whatdev /dev/dsk/c2t1d0s7 .
#!/bin/csh# print out the drive name - st0 or sd0 - given the /dev entry# first get something like “/iommu/.../.../sd@0,0”set dev = `/bin/ls -l $1 | nawk ’{ n = split($11, a, “/”); split(a[n],b,”:”);for(i = 4; i < n; i++) printf(“/%s”,a[i]); printf(“/%s\n”, b[1]) }’`if ( $dev == ““ ) exit# then get the instance number and concatenate with the “sd”nawk -v dev=$dev ’$1 ~ dev { n = split(dev, a, “/”); split(a[n], \b, “@”); printf(“%s%s\n”, b[1], $2) }’ /etc/path_to_inst
furious% df /var/mailFilesystem kbytes used avail capacity Mounted on/dev/dsk/c1t0d0s4 582128 302556 267930 53% /var/mail
server% whatdev /dev/dsk/c1t0d0s4id8
Chapter 3 Analyzing NFS Performance 45

There are 14 disks in the /export/home file system. Running the whatdevscript on the /dev/dsk/c2t1d0s7 disk, one of the 14 disks comprising the
/export/home file system, returns the following display.
Note that /dev/dsk/c2t1d0s7 is disk id17 ; this is IPI disk 17.
f. Go to Step 7.
6. If you didn’t determine the /dev/dsk entries for exported file systems with thewhatdev script, you need to identify the /dev/dsk entries for exported filesystems with ls -lL . Follow these steps:
a. List the drive and its major and minor device numbers by typingls -lL disknumber.
For example, for the /var/mail file system, type:
ls -lL /dev/dsk/c1t0d0s4.
b. Locate the minor device number in the ls -lL output.
In the previous screen example, the first number following the file ownership
(root) , 66 , is the major number. The second number, 68 , is the minor
device number.
c. Determine the disk number.
■ Divide the minor device number, 68 in the previous example, by 8
(68/8 = 8.5).
■ Truncate the fraction. The number 8 is the disk number.
d. Determine the slice (partition) number.
Look at the number following the s (for slice) in the disk number. For example,
in /dev/dsk/c1t0d0s4 , the 4 following the s refers to slice 4.
Now you know that the disk number is 8 and the slice number is 4. This disk is
either sd8 (SCSI) or ip8 (IPI).
server% whatdev /dev/dsk/c2t1d0s7id17
ls -lL /dev/dsk/c1t0d0s4brw-r----- 1 root 66, 68 Dec 22 21:51 /dev/dsk/c1t0d0s4
46 NFS Server Performance and Tuning Guide for Sun Hardware • September 1998

7. View the disk statistics for each disk by typing iostat -x 15 . The -x optionsupplies extended disk statistics. The 15 means disk statistics are gathered every15 seconds.
Use the iostat -x 15 command to see the disk number for the extended disk
statistics. In the next procedure you will use a sed script to translate the disk names
into disk numbers.
The output for the extended disk statistics is:
server% iostat -x 15extended disk statisticsdisk r/s w/s Kr/s Kw/s wait actv svc_t %w %bid10 0.1 0.2 0.4 1.0 0.0 0.0 24.1 0 1id11 0.1 0.2 0.4 0.9 0.0 0.0 24.5 0 1id17 0.1 0.2 0.4 1.0 0.0 0.0 31.1 0 1id18 0.1 0.2 0.4 1.0 0.0 0.0 24.6 0 1id19 0.1 0.2 0.4 0.9 0.0 0.0 24.8 0 1id20 0.0 0.0 0.1 0.3 0.0 0.0 25.4 0 0id25 0.0 0.0 0.1 0.2 0.0 0.0 31.0 0 0id26 0.0 0.0 0.1 0.2 0.0 0.0 30.9 0 0id27 0.0 0.0 0.1 0.3 0.0 0.0 31.6 0 0id28 0.0 0.0 0.0 0.0 0.0 0.0 5.1 0 0id33 0.0 0.0 0.1 0.2 0.0 0.0 36.1 0 0id34 0.0 0.2 0.1 0.3 0.0 0.0 25.3 0 1id35 0.0 0.2 0.1 0.4 0.0 0.0 26.5 0 1id36 0.0 0.0 0.1 0.3 0.0 0.0 35.6 0 0id8 0.0 0.1 0.2 0.7 0.0 0.0 47.8 0 0id9 0.1 0.2 0.4 1.0 0.0 0.0 24.8 0 1sd15 0.1 0.1 0.3 0.5 0.0 0.0 84.4 0 0sd16 0.1 0.1 0.3 0.5 0.0 0.0 93.0 0 0sd17 0.1 0.1 0.3 0.5 0.0 0.0 79.7 0 0sd18 0.1 0.1 0.3 0.5 0.0 0.0 95.3 0 0sd6 0.0 0.0 0.0 0.0 0.0 0.0 109.1 0 0
TABLE 3-3 Ouput of the iostat -x 15 Command (Extended Disk Statistics)
r/s Reads per second
w/s Writes per second
Kr/s Kbytes read per second
Kw/s Kbytes written per second
wait Average number of transactions waiting for service (queue length)
actv Average number of transactions actively being serviced
Chapter 3 Analyzing NFS Performance 47

8. Translate disk names into disk numbers
Use iostat and sar . One quick way to do this is to use a sed script:.
a. Type a sed script using a text editor similar to the following d2fs.serversed script.
Your sed script should substitute the file system name for the disk number.
In this example, disk id8 is substituted for /var/mail and disks id9, id10,id11, id17, id18, id19, id25, id26, id27, id28, id33, id34,id35, and id36 are substituted for /export/home .
b. Run the iostat -xc 15 command through the sed script by typingiostat -xc 15 | d2fs.server.
The options to the previous iostat -xc 15 | d2fs.server command are
explained below.
svc_t Average service time, (milliseconds)
%w Percentage of time the queue is not empty
%b Percentage of time the disk is busy
sed ‘s/id8 /var/mail/s/id9 /export/home/s/id10 /export/home/s/id11 /export/home/s/id17 /export/home/s/id18 /export/home/s/id25 /export/home/s/id26 /export/home/s/id27 /export/home/s/id28 /export/home/s/id33 /export/home/s/id34 /export/home/s/id35 /export/home/s/id36 /export/home/’
TABLE 3-4 Options to the iostat -xc 15 | d2fs.server Command
-x Supplies extended disk statistics
-c Reports the percentage of time the system was in user mode (us ), system
mode (sy), waiting for I/O (wt ), and idling (id)
15 Means disk statistics are gathered every 15 seconds
TABLE 3-3 Ouput of the iostat -x 15 Command (Extended Disk Statistics)
48 NFS Server Performance and Tuning Guide for Sun Hardware • September 1998

The following explains the output and headings of the iostat -xc 15 |d2f2.server command.
The following is a description of the output for the iostat -xc 15 |d2fs.server command.
% iostat -xc 15 | d2fs.serverextended disk statistics cpudisk r/s w/s Kr/s Kw/s wait actv svc_t %w %b us sy wt idexport/home 0.1 0.2 0.4 1.0 0.0 0.0 24.1 0 1 0 11 2 86export/home 0.1 0.2 0.4 0.9 0.0 0.0 24.5 0 1export/home 0.1 0.2 0.4 1.0 0.0 0.0 31.1 0 1export/home 0.1 0.2 0.4 1.0 0.0 0.0 24.6 0 1export/home 0.1 0.2 0.4 0.9 0.0 0.0 24.8 0 1id20 0.0 0.0 0.1 0.3 0.0 0.0 25.4 0 0export/home 0.0 0.0 0.1 0.2 0.0 0.0 31.0 0 0export/home 0.0 0.0 0.1 0.2 0.0 0.0 30.9 0 0export/home 0.0 0.0 0.1 0.3 0.0 0.0 31.6 0 0export/home 0.0 0.0 0.0 0.0 0.0 0.0 5.1 0 0export/home 0.0 0.0 0.1 0.2 0.0 0.0 36.1 0 0export/home 0.0 0.2 0.1 0.3 0.0 0.0 25.3 0 1export/home 0.0 0.2 0.1 0.4 0.0 0.0 26.5 0 1export/home 0.0 0.0 0.1 0.3 0.0 0.0 35.6 0 0var/mail 0.0 0.1 0.2 0.7 0.0 0.0 47.8 0 0id9 0.1 0.2 0.4 1.0 0.0 0.0 24.8 0 1sd15 0.1 0.1 0.3 0.5 0.0 0.0 84.4 0 0sd16 0.1 0.1 0.3 0.5 0.0 0.0 93.0 0 0sd17 0.1 0.1 0.3 0.5 0.0 0.0 79.7 0 0sd18 0.1 0.1 0.3 0.5 0.0 0.0 95.3 0 0sd6 0.0 0.0 0.0 0.0 0.0 0.0 109.1 0 0
TABLE 3-5 Output for the iostat -xc 15 Command
disk Name of disk device
r/s Average read operations per second
w/s Average write operations per second
Kr/s Average Kbytes read per second
Kw/s Average Kbytes written per second
wait Number of requests outstanding in the device driver queue
actv Number of requests active in the disk hardware queue
%w Occupancy of the wait queue
%b Occupancy of the active queue—device busy
Chapter 3 Analyzing NFS Performance 49

c. Run the sar -d 15 1000 command through the sed script by typingsar -d 15 1000 | d2fs.server .
svc_t Average service time in milliseconds for a complete disk request; includes wait
time, active queue time, seek rotation, and transfer latency
us CPU time
sy System time
wt Wait for I/O time
id Idle time
server% sar -d 15 1000 | d2fs.server12:44:17 device %busy avque r+w/s blks/s avwait avserv12:44:18 export/home 0 0.0 0 0 0.0 0.0
export/home 0 0.0 0 0 0.0 0.0export/home 0 0.0 0 0 0.0 0.0export/home 0 0.0 0 0 0.0 0.0export/home 0 0.0 0 0 0.0 0.0id20 0 0.0 0 0 0.0 0.0export/home 0 0.0 0 0 0.0 0.0export/home 0 0.0 0 0 0.0 0.0export/home 0 0.0 0 0 0.0 0.0export/home 0 0.0 0 0 0.0 0.0export/home 0 0.0 0 0 0.0 0.0export/home 0 0.0 0 0 0.0 0.0export/home 0 0.0 0 0 0.0 0.0export/home 0 0.0 0 0 0.0 0.0var/mail 0 0.0 0 0 0.0 0.0export/home 0 0.0 0 0 0.0 0.0sd15 7 0.1 4 127 0.0 17.6sd16 6 0.1 3 174 0.0 21.6sd17 5 0.0 3 127 0.0 15.5
TABLE 3-5 Output for the iostat -xc 15 Command (Continued)
50 NFS Server Performance and Tuning Guide for Sun Hardware • September 1998

In the sar –d option reports the activities of the disk devices. The 15 means that
data is collected every 15 seconds. The 1000 means that data is collected 1000
times. The following terms and abbreviations explain the output.
d. For file systems that are exported via NFS, check the %b/%busy value.
If it is more than 30 percent, check the svc_t value.
The %bvalue, the percentage of time the disk is busy, is returned by the iostatcommand. The %busyvalue, the percentage of time the device spent servicing a
transfer request, is returned by the sar command. If the %band the %busyvalues are greater than 30 percent, go to Step e. Otherwise, go to Step 9.
e. Calculate the svc_t/(avserv + avwait) value.
The svc_t value, the average service time in milliseconds, is returned by the
iostat command. The avserv value, the average time (milliseconds) for a
transfer request to be completed by the device, is returned by the sar command.
Add the avwait to get the same measure as svc_t .
If the svc_t value, the average total service time in milliseconds, is more than 40
ms, the disk is taking a long time to respond. An NFS request with disk I/O will
appear to be slow by the NFS clients. The NFS response time should be less than
50 ms on average, to allow for NFS protocol processing and network transmission
time. The disk response should be less than 40 ms.
The average service time in milliseconds is a function of the disk. If you have fast
disks, the average service time should be less if you have slow disks.
TABLE 3-6 Output of the sar -d 15 1000 | d2fs.server Command
device Name of the disk device being monitored
%busy Percentage of time the device spent servicing a transfer request (same
as iostat %b )
avque Average number of requests outstanding during the monitored period
(measured only when the queue was occupied) (same as iostatactv )
r+w/s Number of read and write transfers to the device, per second (same as
iostat r/s + w/s )
blks/s Number of 512-byte blocks transferred to the device, per second (same
as iostat 2*(Kr/s + Kw/s ))
avwait Average time, in milliseconds, that transfer requests wait in the queue
(measured only when the queue is occupied) (iostat wait gives the
length of this queue)
avserv Average time, in milliseconds, for a transfer request to be completed by
the device (for disks, this includes seek, rotational latency, and data
transfer times)
Chapter 3 Analyzing NFS Performance 51

9. Collect data on a regular basis by uncommenting the lines in the user’ssys crontab file so that sar collects the data for one month.
Performance data will be continuously collected to provide a history of sar results.
Performance data is continuously collected to provide you with a history of sarresults.
Note – A few hundred Kbytes will be used at most in /var/adm/sa .
10. Spread the load over the disks.
Stripe the file system over multiple disks if the disks are overloaded using SolsticeDiskSuite or Online: DiskSuite. Reduce the number of accesses and spread peak
access loads out in time using a Prestoserve write cache (see “Using Solstice
DiskSuite or Online: DiskSuite to Spread Disk Access Load” on page 70 in
Chapter 4.)
11. Adjust the buffer cache if you have read-only file systems (see “Adjusting theBuffer Cache (bufhwm)” on page 80 in Chapter 4.
12. Display server statistics to identify NFS problems by typing nfsstat -s.
root# crontab -l sys#ident“@(#)sys1.592/07/14 SMI”/* SVr4.0 1.2*/## The sys crontab should be used to do performance collection.# See cron and performance manual pages for details on startup.0 * * * 0-6 /usr/lib/sa/sa120,40 8-17 * * 1-5 /usr/lib/sa/sa15 18 * * 1-5 /usr/lib/sa/sa2 -s 8:00 -e 18:01 -i 1200 -A
52 NFS Server Performance and Tuning Guide for Sun Hardware • September 1998

The -s option displays server statistics.
The NFS server display shows the number of NFS calls received (calls ) and
rejected (badcalls ), and the counts and percentages for the various calls that were
made. The number and percentage of calls returned by the nfsstat -s command
are shown in the following table.
The following terms explain the output of the nfsstat -s command.
server% nfsstat -sServer rpc:calls badcalls nullrecv badlen xdrcall480421 0 0 0 0Server nfs:calls badcalls480421 2null getattr setattr root lookup readlink read95 0% 140354 29% 10782 2% 0 0% 110489 23% 286 0% 63095 13%wrcache write create remove rename link symlink0 0% 139865 29% 7188 1% 2140 0% 91 0% 19 0% 231 0%mkdir rmdir readdir statfs435 0% 127 0% 2514 1% 2710 1%
TABLE 3-7 Description of the Output of the nfsstat -s Command
calls Total number of RPC calls received
badcalls Total number of calls rejected by the RPC layer (the sum of badlen and
xdrcall )
nullrecv Number of times an RPC call was not available when it was thought to
be received
badlen Number of RPC calls with a length shorter than a minimum-sized RPC
call
xdrcall Number of RPC calls whose header could not be XDR decoded
Chapter 3 Analyzing NFS Performance 53

TABLE 3-8 explains the nfsstat -s command output and what actions to take.
13. Eliminate symbolic links.
If symlink is greater than ten percent in the output of the nfsstat -s command,
eliminate symbolic links. In the following example,
/usr/tools/dist/sun4 is a symbolic link for /usr/dist/bin .
a. Type rm /usr/dist/bin to eliminate the symbolic link for /usr/dist/bin .
b. Make /usr/dist/bin a directory by typing mkdir /usr/dist/bin .
TABLE 3-8 Description of the nfsstat -s Command Output
If Then
writes > 5%** Install a Prestoserve NFS accelerator (SBus card or NVRAM-
NVSIMM) for peak performance. See “Prestoserve NFS
Accelerator” on page 76 in Chapter 4.
There are any badcalls Badcalls are calls rejected by the RPC layer and are the sum
of badlen and xdrcall . The network may be overloaded.
Identify an overloaded network using network interface
statistics.
readlink > 10% of total
lookup calls on NFS
servers
NFS clients are using excessive symbolic links that are on the
file systems exported by the server. Replace the symbolic link
with a directory. Mount both the underlying file system and
the symbolic link’s target on the NFS client. See Step 11.
getattr > 40% Increase the client attribute cache using the actimeo option.
Make sure that the DNLC and inode caches are large. Use
vmstat -s to determine the percent hit rate (cache hits) for
the DNLC and, if needed, increase ncsize in the
/etc/system file. See Step 12 later in this chapter and
“Directory Name Lookup Cache (DNLC)” on page 82in
Chapter 4
** The number of writes, 29% is very high.
# rm /usr/dist/bin
# mkdir /usr/dist/bin
54 NFS Server Performance and Tuning Guide for Sun Hardware • September 1998

c. Mount the directories and type the following:
14. View the Directory Name Lookup Cache (DNLC) hit rate by typing vmstat -s .
This command returns the hit rate (cache hits).
a. If the hit rate is less than 90 percent and there is no problem with the numberof longnames, increase the ncsize variable in the /etc/system file bytyping:
Directory names less than 30 characters long are cached and names that are too
long to be cached are also reported.
The default value of ncsize is: ncsize (name cache) = 17 * maxusers + 90
■ For NFS server benchmarks ncsize has been set as high as 16000.
■ For maxusers = 2048 ncsize would be set at 34906.
For more information on the Directory Name Lookup Cache, see “Directory
Name Lookup Cache (DNLC)” on page 82 in Chapter 4.
b. Reboot the system.
15. Check the system state if the system has a Prestoserve NFS accelerator by typing/usr/sbin/presto . Verify that it is in the UP state.
client# mount server: /usr/dist/binclient# mount server: /usr/tools/dist/sun4client# mount
% vmstat -s... lines omitted79062 total name lookups (cache hits 94%)16 toolong
set ncsize=5000
server% /usr/sbin/prestostate = UP, size = 0xfff80 bytesstatistics interval: 1 day, 23:17:50 (170270 seconds)write cache efficiency: 65%All 2 batteries are ok
Chapter 3 Analyzing NFS Performance 55

■ If it is in the DOWN state, type presto -u .
■ If it is in the error state, see the Prestoserve User’s Guide.
This completes the steps you use to check the server. Continue by checking each
client.
Checking Each Client
The overall tuning process must include client tuning. Sometimes, tuning the client
yields more improvement than fixing the server. For example, adding 4 Mbytes of
memory to each of 100 clients dramatically decreases the load on an NFS server.
▼ To Check Each Client
1. Check the client statistics for NFS problems by typing nfsstat -c at the %prompt.
Look for errors and retransmits.
The output of the nfsstat -c command shows that there were only 52 retransmits
(retrans ) and 52 time-outs (timeout ) out of 384687 calls.
server% presto -u
client % nfsstat -cClient rpc:calls badcalls retrans badxids timeouts waits newcreds384687 1 52 7 52 0 0badverfs timers toobig nomem cantsend bufulocks0 384 0 0 0 0Client nfs:calls badcalls clgets cltoomany379496 0 379558 0Version 2: (379599 calls)null getattr setattr root lookup readlink read0 0% 178150 46% 614 0% 0 0% 39852 10% 28 0% 89617 23%wrcache write create remove rename link symlink0 0% 56078 14% 1183 0% 1175 0% 71 0% 51 0% 0 0%mkdir rmdir readdir statfs49 0% 0 0% 987 0% 11744 3%
56 NFS Server Performance and Tuning Guide for Sun Hardware • September 1998
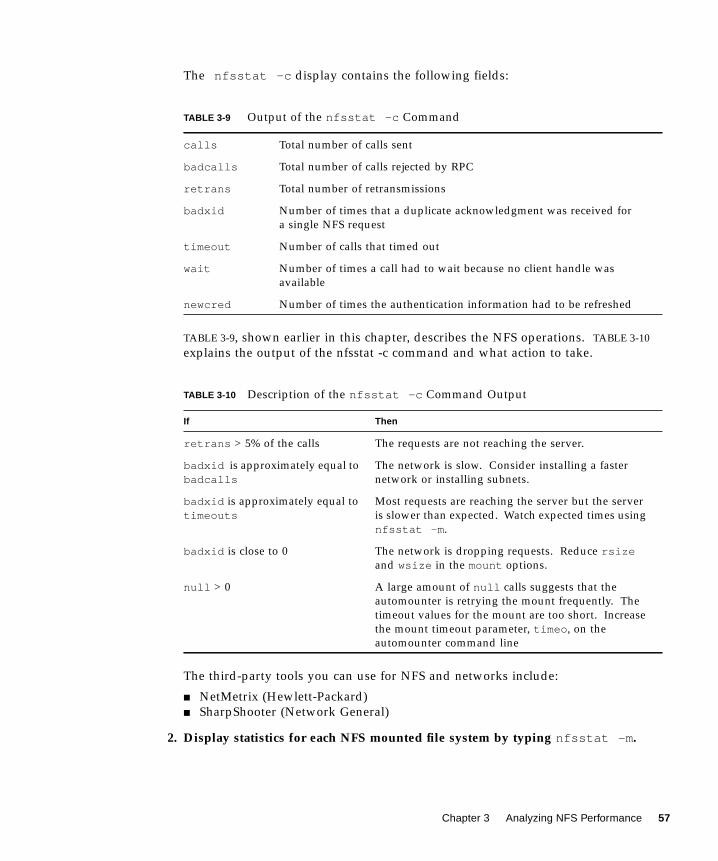
The nfsstat -c display contains the following fields:
TABLE 3-9, shown earlier in this chapter, describes the NFS operations. TABLE 3-10
explains the output of the nfsstat -c command and what action to take.
The third-party tools you can use for NFS and networks include:
■ NetMetrix (Hewlett-Packard)
■ SharpShooter (Network General)
2. Display statistics for each NFS mounted file system by typing nfsstat -m .
TABLE 3-9 Output of the nfsstat -c Command
calls Total number of calls sent
badcalls Total number of calls rejected by RPC
retrans Total number of retransmissions
badxid Number of times that a duplicate acknowledgment was received for
a single NFS request
timeout Number of calls that timed out
wait Number of times a call had to wait because no client handle was
available
newcred Number of times the authentication information had to be refreshed
TABLE 3-10 Description of the nfsstat -c Command Output
If Then
retrans > 5% of the calls The requests are not reaching the server.
badxid is approximately equal to
badcallsThe network is slow. Consider installing a faster
network or installing subnets.
badxid is approximately equal to
timeoutsMost requests are reaching the server but the server
is slower than expected. Watch expected times using
nfsstat -m .
badxid is close to 0 The network is dropping requests. Reduce rsizeand wsize in the mount options.
null > 0 A large amount of null calls suggests that the
automounter is retrying the mount frequently. The
timeout values for the mount are too short. Increase
the mount timeout parameter, timeo , on the
automounter command line
Chapter 3 Analyzing NFS Performance 57

The statistics include the server name and address, mount flags, current read and
write sizes, transmission count, and the timers used for dynamic transmission.
Descriptions of the following terms, used in the output of the nfsstat -mcommand, follow:
client % nfsstat -m/export/home from server:/export/home Flags:vers=2,hard,intr,dynamic,rsize=8192,wsize=8192,retrans=5 Lookups: srtt=10 (25ms), dev=4 (20ms), cur=3 (60ms) Reads: srtt=9 (22ms), dev=7 (35ms), cur=4 (80ms) Writes: srtt=7 (17ms), dev=3 (15ms), cur=2 (40ms) All: srtt=11 (27ms), dev=4 (20ms), cur=3 (60ms)
TABLE 3-11 Description of the Output of the nfsstat -m Command
srtt Smoothed round-trip time
dev Estimated deviation
cur Current backed-off timeout value
58 NFS Server Performance and Tuning Guide for Sun Hardware • September 1998

The numbers in parentheses in the previous code example are the actual times in
milliseconds. The other values are unscaled values kept by the operating system
kernel. You can ignore the unscaled values. Response times are shown for lookups,
reads, writes, and a combination of all of these operations (all). TABLE 3-12 shows the
appropriate action for the nfsstat -m command.
TABLE 3-12 Results of the nfsstat -m Command
If Then
srtt > 50 ms That mount point is slow. Check the network and
the server for the disk(s) that provide that mount
point. See “To Check the Network” and “To Check
the NFS Server” earlier in this chapter.
The message “NFS server notresponding” is displayed
Try increasing the timeo parameter in the
/etc/vfstab file to eliminate the messages and
improve performance. Doubling the initial timeoparameter value is a good baseline.
After changing the timeo value in the vfstab file,
invoke the nfsstat -c command and observe the
badxid value returned by the command. Follow the
recommendations for the nfsstat -c command
earlier in this section.
Lookups: cur > 80 ms The requests are taking too long to process.
This indicates a slow network or a slow server.
Reads: cur > 150 ms The requests are taking too long to process.
This indicates a slow network or a slow server.
Writes: cur > 250 ms The requests are taking too long to process.
This indicates a slow network or a slow server.
Chapter 3 Analyzing NFS Performance 59

60 NFS Server Performance and Tuning Guide for Sun Hardware • September 1998

CHAPTER 4
Configuring the Server and theClient to Maximize NFSPerformance
This chapter provides configuration recommendations to maximize NFS
performance. For troubleshooting tips see Chapter 5.
Tuning to Improve NFS Performance
This chapter discusses tuning recommendations for these environments:
■ Attribute-intensive environments, in which primarily small files (one to two
hundred bytes) are accessed. Software development is an example of an
attribute-intensive environment.
■ Data-intensive environments, in which primarily large files are accessed. A largefile can be defined as a file that takes one or more seconds to transfer (roughly 1
Mbyte). CAD or CAE are examples of data-intensive environments.
Check these items when tuning the system:
■ Networks
■ Disk drives
■ Central processor units
■ Memory
■ Swap space
■ Number of NFS threads in /etc/init.d/nfs.server■ /etc/system to modify kernel variables
61
Once you have profiled the performance capabilities of your server, begin tuning the
system. Tuning an NFS server requires a basic understanding of how networks, disk
drives, CPUs, and memory affect performance. To tune the system, determine which
parameters need adjusting to improve balance.
▼ To Monitor and Tune Server Performance
1. Collect statistics. See Chapter 3.
2. Identify a constraint or overutilized resource and reconfigure around it.
Refer to this chapter and Chapter 3 for tuning recommendations.
3. Measure the performance gain over a long evaluation period.
Balancing NFS Server Workload
All NFS processing takes place inside the operating system kernel at a higher
priority than user-level tasks.
Note – Do not combine databases or time-shared loads on an NFS server because
when the NFS load is high any additional tasks performed by an NFS server will run
slowly.
Non-interactive workloads such as mail delivery and printing, excluding the
SPARCprinter (not supported in the Solaris 2.6 and later releases of the Solaris
operating environment) or other Sun printers based on the NeWSprintΤΜ software
are good candidates for using the server for dual purpose (such as NFS and other
tasks). If you have spare CPU power and a light NFS load, then interactive work
will run normally.
Networking Requirements
Providing sufficient network bandwidth and availability is the most important
configuration for NFS servers. This means that you should configure the
appropriate number and type of networks and interfaces.
Follow these tips when setting up and configuring the network.
62 NFS Server Performance and Tuning Guide for Sun Hardware • September 1998

■ Make sure that network traffic is well balanced across all client networks and that
networks are not overloaded.
■ If one client network is excessively loaded, watch the NFS traffic on that segment.
1. Identify the hosts that are making the largest demands on the servers.
2. Partition the work load or move clients from one segment to another.
Simply adding disks to a system does not improve its NFS performance unless the
system is truly disk I/O-bound. The network itself is likely to be the constraint as
the file server increases in size, requiring the addition of more network interfaces to
keep the system in balance.
Instead of attempting to move more data blocks over a single network, consider
characterizing the amount of data consumed by a typical client and balance the NFS
reads and writes over multiple networks.
Data-Intensive Applications
Data-intensive applications demand relatively few networks. However, the
networks must be of high-bandwidth.
If your configuration has either of the following characteristics, then your
applications require high-speed networking:
■ Your clients require aggregate data rates of more than 1 Mbyte per second.
■ More than one client must be able to simultaneously consume 1 Mbyte per second
of network bandwidth.
Configuring the Network When the Primary
Application of Your Server Is Data-Intensive■ Configure FDDI, SunATM™, or another high-speed network.
If fiber cabling can’t be used for logistical reasons, consider FDDI, CDDI, or
SunFastEthernet™ over twisted-pair implementations. SunATM uses the same size
fiber cabling as FDDI. For more information on FDDI, see the FDDI/S3.0 User’sGuide.
■ Configure one FDDI ring for each five to seven concurrent fully NFS-active
clients.
Few data-intensive applications make continuous NFS demands. In typical data-
intensive EDA and earth-resources applications, this results in 25-40 clients per ring.
Chapter 4 Configuring the Server and the Client to Maximize NFS Performance 63

A typical use consists of loading a big block of data that is manipulated then written
back to the server. Because the data is written back, these environments can have
very high write percentages.
■ If your installation has Ethernet cabling, configure one Ethernet for every two
active clients.
This almost always requires a SPARCserver 1000, SPARCserver 1000E, SPARCcenter
2000, SPARCcenter 2000E system, or an Ultra Enterprise 3000, 4000, 5000, or 6000
system since useful communities require many networks. Configure a maximum of
four to six clients per network.
Attribute-Intensive Applications
In contrast, most attribute-intensive applications are easily handled with less
expensive networks. However, attribute-intensive applications require many
networks. Use lower-speed networking media, such as Ethernet or Token Ring.
To configure networking when the primary application of the server is attribute-
intensive:
■ Configure on Ethernet or Token Ring.
■ Configure one Ethernet network for eight to ten fully active clients.
More than 20 to 25 clients per Ethernet results in severe degradation when many
clients are active. As a check, an Ethernet can sustain about 250-300 NFS
ops/second on the SPECnfs_097 (LADDIS) benchmark, albeit at high collision rates.
It is unwise to exceed 200 NFS ops/second on a sustained basis.
■ Configure one Token Ring network for each ten to fifteen active clients.
If necessary, 50 to 80 total clients per network are feasible on Token Ring networks,
due to their superior degradation characteristics under heavy load (compared to
Ethernet).
Systems with More Than One Class of Users
Mixing network types is not unreasonable. For example, both FDDI and Token Ring
are appropriate for a server that supports both a document imaging application
(data-intensive) and a group of PCs running a financial analysis application (most
likely attribute-intensive).
The platform you choose is often dictated by the type and number of networks, as
they may require many network interface cards.
64 NFS Server Performance and Tuning Guide for Sun Hardware • September 1998

● To configure networking for servers that have more than one class of users, mixnetwork types.
Disk Drives
Disk drive usage is frequently the tightest constraint in an NFS server. Even a
sufficiently large memory configuration may not improve performance if the cache
cannot be filled quickly enough from the file systems.
Determining if Disks Are the Bottleneck
● Use iostat to determine disk usage.
Look at the number of read and write operations per second (see “Checking the NFS
Server” on page 42” in Chapter 3).
Because there is little dependence in the stream of NFS requests, the disk activity
generated contains large numbers of random access disk operations. The maximum
number of random I/O operations per second ranges from 40-90 per disk.
Driving a single disk at more than 60 percent of its random I/O capacity creates a
disk bottleneck.
Limiting Disk Bottlenecks
Disk bandwidth on an NFS server has the greatest effect on NFS client performance.
Providing sufficient bandwidth and memory for file system caching is crucial to
providing the best possible file server performance. Note that read/write latency is
also important. For example, each NFSop may involve one or more disk accesses.
Disk service times add to the NFSop latency, so slow disks mean a slow NFS server.
Follow these guidelines to ease disk bottlenecks:
■ Balance the I/O load across all disks on the system.
If one disk is heavily loaded and others are operating at the low end of their
capacity, shuffle directories or frequently accessed files to less busy disks.
■ Partition the file system(s) on the heavily used disk and spread the file system(s)
over several disks.
Adding disks provides additional disk capacity and disk I/O bandwidth.
Chapter 4 Configuring the Server and the Client to Maximize NFS Performance 65

■ Replicate the file system to provide more network-to-disk bandwidth for the
clients if the file system used is read-only by the NFS clients, and contains data
that doesn’t change constantly.
See the following section, “Replicating File Systems.”
■ Size the operating system caches correctly, so that frequently needed file system
data may be found in memory.
Caches for inodes (file information nodes), file system metadata such as cylinder
group information, and name-to-inode translations must be sufficiently large, or
additional disk traffic is created on cache misses. For example, if an NFS client opens
a file, that operation generates several name-to-inode translations on the NFS server.
If an operation misses the Directory Name Lookup Cache (DNLC), the server must
search the disk-based directory entries to locate the appropriate entry name. What
would nominally be a memory-based operation degrades into several disk
operations. Also, cached pages will not be associated with the file.
Replicating File Systems
Commonly used file systems, such as the following, are frequently the most heavily
used file systems on an NFS server:
■ /usr directory for diskless clients
■ Local tools and libraries
■ Third-party packages
■ Read-only source code archives
The best way to improve performance for these file systems is to replicate them.
One NFS server is limited by disk bandwidth when handling requests for only one
file system. Replicating the data increases the size of the aggregate “pipe” from NFS
clients to the data. However, replication is not a viable strategy for improving
performance with writable data, such as a file system of home directories. Use
replication with read-only data.
To replicate file systems, do the following:
■ Identify the file or file systems to be replicated.
■ If several individual files are candidates, consider merging them in a single file
system. The potential decrease in performance that arises from combining heavily
used files on one disk is more than offset by performance gains through
replication.
■ Use nfswatch , to identify the most commonly used files and file systems in a
group of NFS servers. TABLE A-1 in Appendix Alists performance monitoring
tools, including nfswatch , and explains how to obtain nfswatch .
■ Determine how clients will choose a replica.
66 NFS Server Performance and Tuning Guide for Sun Hardware • September 1998

Specify a server name in the /etc/vfstab file to create a permanent binding from
NFS client to the server. Alternatively, listing all server names in an automounter
map entry allows completely dynamic binding, but may also lead to a client
imbalance on some NFS servers. Enforcing “workgroup” partitions in which groups
of clients have their own replicated NFS server strikes a middle ground between the
extremes and often provides the most predictable performance.
■ Choose an update schedule and method for distributing the new data.
The frequency of change of the read-only data determines the schedule and the
method for distributing the new data. File systems that undergo a complete change
in contents, for example, a flat file with historical data that is updated monthly, can
be best handled by copying data from the distribution media on each machine, or
using a combination of ufsdump and restore . File systems with few changes can
be handled using management tools such as rdist .
■ Evaluate what penalties, if any, are involved if users access old data on a replica
that is not current. One possible way of doing this is with the Solaris 2.xJumpStartTM facilities in combination with cron .
Adding the Cache File System
The cache file system is client-centered. You use the cache file system on the client to
reduce server load. With the cache file system, files are obtained from the server,
block by block. The files are sent to the memory of the client and manipulated
directly. Data is written back to the disk of the server.
Adding the cache file system to client mounts provides a local replica for each client.
The /etc/vfstab entry for the cache file system looks like this:
Use the cache file system in situations with file systems that are read mainly, such as
application file systems. Also, you should use the cache file system for sharing data
across slow networks. Unlike a replicated server, the cache file system can be used
with writable file systems, but performance will degrade as the percent of writes
climb. If the percent of writes is too high, the cache file system may decrease NFS
performance.
You should also consider using the cache file system if your networks are high speed
networks interconnected by routers.
# device device mount FS fsck mount mount# to mount to fsck point type pass at boot optionsserver:/usr/dist cache /usr/dist cachefs 3 yesro,backfstype=nfs,cachedir=/cache
Chapter 4 Configuring the Server and the Client to Maximize NFS Performance 67

If the NFS server is frequently updated, do not use the cache file system because
doing so would result in more traffic than operating over NFS.
● To monitor the effectiveness of the cached file systems use the cachefsstatcommand (available with the Solaris 2.5 and later operating environment).
The syntax of the cachefsstat command is as follows:
where:
-z initializes statistics. You should execute cachefs -z (superuser only) before
executing cachfsstat again to gather statistics on the cache performance. The
statistics printed reflect those just before the statistics are reinitialized.
path is the path the cache file system is mounted on. If you do not specify a path, all
mounted cache file systems are used.
Without the -z option, you can execute this command as a regular UNIX user. The
statistical information supplied by the cachefsstat command includes cache hits
and misses, consistency checking, and modification operation:
An example of the cachefsstat command is:
In the previous example, the cache hit rate for the file system should be higher than
thirty percent. If the cache hit rate is lower than thirty percent, this means that the
access pattern on the file system is widely randomized or that the cache is too small.
The output for a consistency check means that the cache file system checks with the
server to see if data is still valid. A high failure rate (15 to 20 percent) means that the
data of interest is rapidly changing. The cache may be updated more quickly than
system# /usr/bin/cachefsstat [-z] path
TABLE 4-1 Statistical Information Supplied by the cachefsstat Command
Output Description
cache hit rate Percentage of cache hits over the total number of attempts
(followed by the actual numbers of hits and misses)
consistencychecks
Number of consistency checks performed. It is followed by
the number that passed and the number that failed.
modifies Number of modify operations, including writes and creates.
system% /usr/bin/cachefsstat /home/samcache hit rate: 73% (1234 hits, 450 misses)consistency checks: 700 (650 pass, 50 fail)modifies: 321
68 NFS Server Performance and Tuning Guide for Sun Hardware • September 1998

what is appropriate for a cached file system. When you use the output from
consistency checks with the number of modifies, you can learn if this client or other
clients are making the changes.
The output for modifies is the number of times the client has written changes to the
file system. This output is another method to understand why the hit rate may be
low. A high rate of modify operations likely goes along with a high number of
consistency checks and a lower hit rate.
Also available, beginning with the Solaris 2.5 software environment, are the
commands cachefswssize , which determine the working set size for the cache file
system and cachefsstat , which displays where the cache file system statistics are
being logged. Use these commands to determine if the cache file system is
appropriate and valuable for your installation.
Configuration Rules for Disk Drives
Follow these general guidelines for configuring disk drives. In addition to the
following general guidelines, more specific guidelines for configuring disk drives in
data-intensive environments and attribute-intensive environments follows:
■ Configure additional drives on each host adapter without degrading performance
(as long as the number of active drives does not exceed SCSI standard
guidelines).
■ Use Online: DiskSuite or Solstice DiskSuite to spread disk access load across
many disks. See “Using Solstice DiskSuite or Online: DiskSuite to Spread Disk
Access Load” later in this chapter.
■ Use the fastest zones of the disk when possible. See “Using the Optimum Zones
of the Disk” later in this chapter.
Keep these rules in mind when configuring disk drives in data-intensive
environments:
■ Configure for a sequential environment.
■ Use disks with the fastest transfer speeds (preferably in stripes).
■ Configure one RAID device (logical volume or metadisk) for every three active
version 3 clients or one device for every four to five version 2 clients.
■ Configure one drive for every client on Ethernet or Token Ring.
When configuring disk drives in attribute-intensive environments:
■ Configure with a larger number of smaller disks, which are connected to a
moderate number of SCSI host adapters (such as a disk array).
■ Configure four to five (or up to eight or nine) fully active disks per fast SCSI host
adapter Using smaller disk drives is much better than operating with one large
disk drive.
Chapter 4 Configuring the Server and the Client to Maximize NFS Performance 69

■ Configure at least one disk drive for every two fully active clients (on any type
of network.)
■ Configure no more than eight to ten fully active disk drives for each fast/wide
SCSI host adapter.
Using Solstice DiskSuite or Online: DiskSuite to
Spread Disk Access Load
A common problem in NFS servers is poor load balancing across disk drives and
disk controllers.
To balance loads, do the following:
■ Balance loads by physical usage instead of logical usage. Use Solstice DiskSuite
or Online: DiskSuite to spread disk access across disk drives transparently by
using its striping and mirroring functions.
The disk mirroring feature of Solstice DiskSuite or Online: DiskSuite improves disk
access time and reduces disk usage by providing access to two or three copies of the
same data. This is particularly true in environments dominated by read operations.
Write operations are normally slower on a mirrored disk since two or three writes
must be accomplished for each logical operation requested.
■ Balance loads using disk concatenation when disks are relatively full. This
procedure accomplishes a minimum amount of load balancing
■ If your environment is data-intensive, stripe the disk with a small interlace to
improve disk throughput and distribute the service load. Disk striping improves
read and write performance for serial applications. Use 64 Kbytes per number of
disks in the stripe as a starting point for interlace size.
■ If your environment is attribute-intensive, where random access dominates disk
usage, stripe the disk with the default interlace (one disk cylinder).
■ Use the iostat and sar commands to report disk drive usage.
Attaining even disk usage usually requires some iterations of monitoring and data
reorganization. In addition, usage patterns change over time. A data layout that
works when installed may perform poorly a year later. For more information on
checking disk drive usage, see “Checking the NFS Server” on page 42 in Chapter 3.
70 NFS Server Performance and Tuning Guide for Sun Hardware • September 1998

Using Log-Based File Systems With Solstice
DiskSuite or Online: DiskSuite 3.0
The Solaris 2.4 through Solaris 7 software environments and the Online: Disk Suite
3.0 or Solstice DiskSuite software support a log-based extension to the standard
UNIX file system, which works like a disk-based Prestoserve NFS accelerator.
In addition to the main file system disk, a small (typically 10 Mbytes) section of disk
is used as a sequential log for writes. This speeds up the same kind of operations as
a Prestoserve NFS accelerator with two advantages:
■ In dual-machine high-available configurations, the Prestoserve NFS accelerator
cannot be used. The log can be shared so that it can be used.
■ After an operating system crash, the fsck of the log-based file system involves a
sequential read of the log only. The sequential read of the log is almost
instantaneous, even on very large file systems.
Note – You cannot use the Prestoserve NFS accelerator and the log on the same
file system.
Using the Optimum Zones of the Disk
When you analyze your disk data layout, consider zone bit recording.
All of Sun’s current disks (except the 207 Mbyte disk) use this type of encoding
which uses the peculiar geometric properties of a spinning disk to pack more data
into the parts of the platter closest to its edge. This results in the lower disk
addresses (corresponding to the outside cylinders) usually outperforming the inside
addresses by 50 percent.
● Put the data in the lowest-numbered cylinders.
The zone bit recording data layout makes those cylinders the fastest ones.
This margin is most often realized in serial transfer performance, but also affects
random access I/O. Data on the outside cylinders (zero) not only moves past the
read/write heads more quickly, but the cylinders are also larger. Data will be spread
over fewer large cylinders, resulting in fewer and shorter seeks.
Chapter 4 Configuring the Server and the Client to Maximize NFS Performance 71

Central Processor Units
This section explains how to determine CPU usage and provides guidelines for
configuring CPUs in NFS servers.
Determining CPU Usage
● To get 30 second averages, type mpstat 30 at the %prompt.
The following screen is displayed:
The mpstat 30 command reports statistics per processor. Each row of the table
represents the activity of one processor. The first table summarizes all activities
since the system was last booted. Each subsequent table summarizes activity for the
preceding interval. All values are rates (events per second).
Review the following data in the mpstat output (see Table 4-2 ):
If sys is greater than 50 percent, increase CPU power to improve NFS performance.
system% mpstat 30CPU minf mjf xcal intr ithr csw icsw migr smtx srw syscl usr sys wt idl 0 6 0 0 114 14 25 0 6 3 0 48 1 2 25 72 1 6 0 0 86 85 50 0 6 3 0 66 1 4 24 71 2 7 0 0 42 42 31 0 6 3 0 54 1 3 24 72 3 8 0 0 0 0 33 0 6 4 0 54 1 3 24 72
TABLE 4-2 Ouput of the mpstat Command
usr Percent user time
sys Percent system time (can be caused by NFS processing)
wt Percent wait time (treat as for idle time)
idl Percent idle time
72 NFS Server Performance and Tuning Guide for Sun Hardware • September 1998

Table 4-2 describes guidelines for configuring CPUs in NFS servers.
Memory
Since NFS is a disk I/O-intensive service, a slow server can suffer from I/O
bottlenecks. Adding memory eliminates the I/O bottleneck by increasing the file
system cache size.
TABLE 4-3 Guidelines for Configuring CPUs in NFS Servers
If Then
Your environment is predominantly
attribute-intensive, and you have
one to three medium-speed Ethernet or
Token Ring networks.
A uniprocessor system is sufficient. For smaller systems, the
UltraServer 1, SPARCserver 2, or SPARCserver 5 systems have
sufficient processor power.
Your environment is predominantly
attribute-intensive and you have
between 4 to 60 medium-speed
Ethernet or Token Ring networks.
Use an UltraServer 2, SPARCserver 10, or SPARCserver 20 system.
You have larger attribute-intensive
environments and SBus and disk
expansion capacity is sufficient.
Use multiprocessor models of the UltraServer 2, SPARCserver 10 or
the SPARCserver 20 systems.
You have larger attribute-intensive
environments.
Use dual-processor systems such as:
– SPARCserver 10 system Model 512
– SPARCserver 20 system
– SPARCserver 1000 or 1000E system
– Ultra Enterprise 3000, 4000, 5000, or 6000 system
– SPARCcenter 2000/2000E system
Either the 40 MHz/1Mbyte or the 50MHz/2 Mbyte module work
well for an NFS work load in the SPARCcenter 2000 system. You
will get better performance from the 50 MHz/2Mbyte module.
Your environment is data-intensive
and you have a high-speed network.
Configure one SuperSPARC processor per high-speed network
(such as FDDI).
Your environment is data-intensive
and you must use an Ethernet
connection due to cabling restrictions.
Configure one SuperSPARC processor for every four Ethernet or
Token Ring networks.
Your environment is a pure NFS
installation.
You do not need to configure additional processors beyond the
recommended number on your server(s).
Your servers perform tasks in addition
to NFS processing.
Add additional processors to increase performance significantly.
Chapter 4 Configuring the Server and the Client to Maximize NFS Performance 73

The system could be waiting for file system pages, or it may be paging process
images to and from the swap device. The latter effect is only a problem if additional
services are provided by the system, since NFS service runs entirely in the operating
system kernel.
If the swap device is not showing any I/O activity, then all paging is due to file I/O
operations from NFS reads, writes, attributes, and lookups.
Determining if an NFS Server Is Memory Bound
Paging file system data from the disk into memory is a more common NFS server
performance problem.
▼ To Determine if the Server Is Memory Bound
1. Watch the scan rate reported by vmstat 30 .
If the scan rate (sr , the number of pages scanned) is often over 200 pages/second,
then the system is short of memory (RAM). The system is trying to find unused
pages to be reused and may be reusing pages that should be cached for rereading by
NFS clients.
2. Add memory.
Adding memory eliminates repeated reads of the same data and enables the NFS
requests to be satisfied out of the page cache of the server. To calculate the memory
required for your NFS server, see “Calculating Memory,” which follows.
The memory capacity required for optimal performance depends on the average
working set size of files used on that server. The memory acts as a cache for recently
read files. The most efficient cache matches the current working set size as closely
as possible.
Because of this memory caching feature, it is not unusual for the free memory in
NFS servers to be between 0.5 Mbytes to 1.0 Mbytes if the server has been active for
a long time. Such activity is normal and desirable. Having enough memory allows
you to service multiple requests without blocking.
The actual files in the working set may change over time. However, the size of the
working set may remain relatively constant. NFS creates a sliding window of active
files, with many files entering and leaving the working set throughout a typical
monitoring period.
74 NFS Server Performance and Tuning Guide for Sun Hardware • September 1998

Calculating Memory
You can calculate memory according to general or specific memory rules.
General Memory Rules
Follow these general guidelines to calculate the amount of memory you will need.
■ Virtual memory = RAM (main memory) + swap space
■ Calculate the amount of memory according to the five-minute rule:
Memory is sized at 16 Mbytes plus memory to cache the data, which will be
accessed more often than once in five minutes.
Specific Memory Rules
Follow these specific guidelines to calculate the amount of memory you will need.
■ If your server primarily provides user data for many clients, configure relatively
minimal memory.
For small installations, this will be 32 Mbytes; for large installations, this will be
about 128 Mbytes. In multiprocessor configurations, provide at least 64 Mbytes per
processor. Attribute-intensive applications normally benefit slightly more from
memory than data-intensive applications.
■ If your server normally provides temporary file space for applications that use
those files heavily, configure your server memory to about 75 percent of the size
of the active temporary files in use on the server.
For example, if each client’s temporary file is about 5 Mbytes, and the server is
expected to handle 20 fully active clients, configure it as follows:
(20 clients x 5 Mbytes)/75% = 133 Mbytes of memory
Note that 128 Mbytes is the most appropriate amount of memory that is easily
configured.
■ If the primary task of your server is to provide only executable images, configure
server memory to be equal to approximately the combined size of the heavily-
used binary files (including libraries).
For example, a server expected to provide /usr/openwin should have enough
memory to cache the X server, CommandTool, libX11.so , libview.so and
libXt . This NFS application is considerably different from the more
typical /home , /src, or /data server in that it normally provides the same files
repeatedly to all of its clients and is hence able to effectively cache this data. Clients
will not use every page of all of the binaries, which is why it is reasonable to
Chapter 4 Configuring the Server and the Client to Maximize NFS Performance 75

configure only enough to hold the frequently-used programs and libraries. Use the
cache file system on the client, if possible, to reduce the load and RAM needs on the
server.
■ If the clients are DOS PCs or Macintosh machines, add more RAM cache on the
Sun NFS server; these systems do much less caching than UNIX system clients.
Swap Space
Swap space is almost not needed because NFS servers do not run user processes.
▼ To Set Up Swap Space
1. Configure at least 64 Mbytes virtual memory, which is RAM plus swap space (seeTable 4-3).
2. Set up fifty percent of main memory as an emergency swap space to save a crashdump in case of a system panic.
Prestoserve NFS Accelerator
Note – NFS version 3 reduces the need for Prestoserve™ capability. Using the
Prestoserve NFS accelerator makes a significant difference with NFS version 2. The
Prestoserve NFS accelerator makes only a slight improvement with NFS version 3.
Adding a Prestoserve NFS accelerator with NFS version 2 is another way to improve
NFS performance. NFS version 2 requires all writes to be written to stable storage
before responding to the operation. The Prestoserve NFS accelerator enables high-
speed NVRAM instead of slow disks to meet the stable storage requirement.
TABLE 4-4 Swap Space Requirements
Amount of RAM Swap Space Requirements
16 Mbytes 48 Mbytes
32 Mbytes 32 Mbytes
64 or more Mbytes None
76 NFS Server Performance and Tuning Guide for Sun Hardware • September 1998

Two types of NVRAM used by the Prestoserve NFS accelerator are:
■ NVRAM-NVSIMM
■ SBus
Both types of Prestoserve NFS accelerators speed up NFS server performance by:
■ Providing faster selection of file systems
■ Caching writes for synchronous I/O operations
■ Intercepting synchronous write requests to disk and storing the data in
nonvolatile memory
NVRAM-NVSIMM
If you can use either NVRAM hardware, use the NVRAM-NVSIMM for the
Prestoserve cache. The NVRAM-NVSIMM and SBus hardware are functionally
identical. However, the NVRAM-NVSIMM hardware is slightly more efficient and
does not require an SBus slot. The NVRAM-NVSIMMs reside in memory and the
NVRAM-NVSIMM cache is larger than the SBus hardware.
The NVRAM-NVSIMM Prestoserve NFS accelerator significantly improves the
response time of NFS clients with heavily loaded or I/O-bound servers. To improve
performance add the NVRAM-NVSIMM Prestoserve NFS accelerator to the
following platforms:
■ SPARCserver 20 system
■ SPARCserver 1000 or 1000E system
■ SPARCcenter 2000 or 2000E system
You can use an alternate method for improving NFS performance in Sun Enterprise
3x00, 4x00, 5x00, and 6x00 systems. This method is to upgrade NVRAM in the
SPARCstorage Array that is connected to the server.
Sun Enterprise 3x00, 4x00, 5x00, and 6x00 server systems enable SPARCstorage
Array NVRAM fast writes. Turn on fast writes by invoking the ssaadm command.
NVRAM SBus
The SBus Prestoserve NFS accelerator contains only a 1 Mbyte cache and resides on
the SBus. You can add the SBus Prestoserve NFS accelerator to any SBus-based
server except the SPARCserver 1000(E) system, the SPARCcenter 2000(E), or the Sun
Enterprise 3x00, 4x00, 5x00, or 6x00 server systems.
Some systems on which you can add the SBus Prestoserve NFS accelerator are:
■ SPARCserver 5 system
Chapter 4 Configuring the Server and the Client to Maximize NFS Performance 77
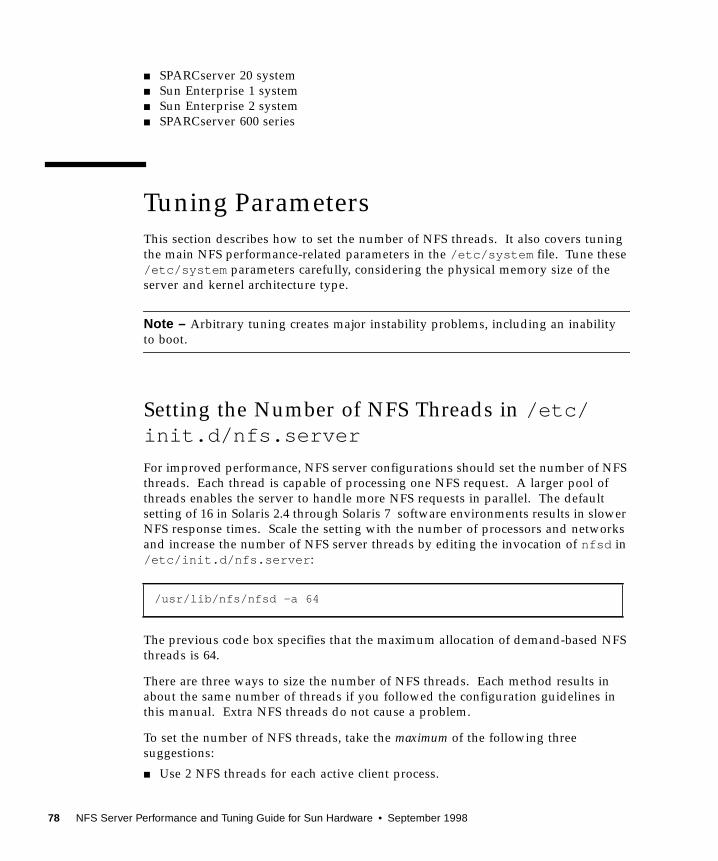
■ SPARCserver 20 system
■ Sun Enterprise 1 system
■ Sun Enterprise 2 system
■ SPARCserver 600 series
Tuning Parameters
This section describes how to set the number of NFS threads. It also covers tuning
the main NFS performance-related parameters in the /etc/system file. Tune these
/etc/system parameters carefully, considering the physical memory size of the
server and kernel architecture type.
Note – Arbitrary tuning creates major instability problems, including an inability
to boot.
Setting the Number of NFS Threads in /etc/init.d/nfs.server
For improved performance, NFS server configurations should set the number of NFS
threads. Each thread is capable of processing one NFS request. A larger pool of
threads enables the server to handle more NFS requests in parallel. The default
setting of 16 in Solaris 2.4 through Solaris 7 software environments results in slower
NFS response times. Scale the setting with the number of processors and networks
and increase the number of NFS server threads by editing the invocation of nfsd in
/etc/init.d/nfs.server :
The previous code box specifies that the maximum allocation of demand-based NFS
threads is 64.
There are three ways to size the number of NFS threads. Each method results in
about the same number of threads if you followed the configuration guidelines in
this manual. Extra NFS threads do not cause a problem.
To set the number of NFS threads, take the maximum of the following three
suggestions:
■ Use 2 NFS threads for each active client process.
/usr/lib/nfs/nfsd -a 64
78 NFS Server Performance and Tuning Guide for Sun Hardware • September 1998

A client workstation usually only has one active process. However, a time-shared
system that is an NFS client may have many active processes.
■ Use 16 to 32 NFS threads for each CPU.
Use roughly 16 for a SPARCclassic or a SPARCstation 5 system. Use 32 NFS threads
for a system with a 60 MHz SuperSPARC processor.
■ Use 16 NFS threads for each 10 Mbits of network capacity.
For example, if you have one SunFDDITM interface, set the number of threads to 160.
With two SunFDDI interfaces, set the thread count to 320, and so on.
Identifying Buffer Sizes and Tuning Variables
The number of fixed-size tables in the kernel has been reduced in each release of the
Solaris software environment. Most are now dynamically sized or are linked to the
maxusers calculation. Extra tuning to increase the DNLC and inode caches is
required for the Solaris 2.4 through Solaris 7 software environments. For Solaris
version 2.4 you must tune the pager. Tuning the pager is not necessary for Solaris
2.5, 2.5.1, 2.6, or 7 operating environments.
Using /etc/system to Modify Kernel Variables
The /etc/system file is read by the operating system kernel at start-up. It
configures the search path for loadable operating system kernel modules and
enables kernel variables to be set. For more information, see the man page for
system(4) .
Caution – Use the set commands in /etc/system carefully because the commands
in /etc/system cause automatic patches of the kernel.
If your machine does not boot and you suspect a problem with /etc/system , use
the boot -a option. With this option, the system prompts (with defaults) for its
boot parameters. One of these is the /etc/system configuration file. Either use the
name of a backup copy of the original /etc/system file or /dev/null . Fix the file
and immediately reboot the system to make sure it is operating correctly.
Chapter 4 Configuring the Server and the Client to Maximize NFS Performance 79

Adjusting Cache Size: maxusers
The maxusers parameter determines the size of various kernel tables such as the
process table. The maxusers parameter is set in the /etc/system file. For
example:
In the Solaris 2.4 through Solaris 7 software environments, maxusers is dynamically
sized based upon the amount of RAM configured in the system.The sizing method
used formaxuser s is:
The number of Mbytes of RAM configured into the system is actually based upon
physmem which does not include the 2 Mbytes or so that the kernel uses at boot
time. The minimum limit is 8 and the maximum automatic limit is 1024, which
corresponds to systems with 1 Gbyte or more of RAM. It can still be set manually in
/etc/system but the manual setting is checked and limited to a maximum of 2048.
This is a safe level on all kernel architectures, but uses a large amount of operating
system kernel memory.
Parameters Derived From maxusers
Table 4-4 describes the default settings for the performance-related inode cache and
name cache operating system kernel parameters.
Adjusting the Buffer Cache (bufhwm)
The bufhwm variable, set in the /etc/system file, controls the maximum amount of
memory allocated to the buffer cache and is specified in Kbytes. The default value of
bufhwm is 0, which allows up to 2 percent of system memory to be used. This can be
increased up to 20 percent and may need to be increased to 10 percent for a
set maxusers = 200
maxusers = Mbytes of RAM configured in the system
TABLE 4-5 Default Settings for Inode and Name Cache Parameters
Kernel Resource Variable Default Setting
Inode cache ufs_ninode 17 * maxusers + 90
Name cache ncsize 17 * maxusers + 90
80 NFS Server Performance and Tuning Guide for Sun Hardware • September 1998

dedicated NFS file server with a relatively small memory system. On a larger
system, the bufhwm variable may need to be limited to prevent the system from
running out of the operating system kernel virtual address space.
The buffer cache is used to cache inode, indirect block, and cylinder group related
disk I/O only. The following is an example of a buffer cache ( bufhwm) setting in the
/etc/system file that can handle up to 10 Mbytes of cache. This is the highest
value to which you should set bufhwm .
You can monitor the buffer cache using sar -b (see the following code example),
which reports a read (%rcache ) and a write hit rate (%wcache) for the buffer cache.
If a significant number of reads and writes per second occur (greater than 50) and if
the read hit rate (%rcache ) falls below 90 percent, or if the write hit rate (%wcache)
falls below 65 percent, increase the buffer cache size, bufhwm .
In the previous sar -b 5 10 command output, the read hit rate (%rcache ) and
the write hit rate (%wcache) did not fall below 90 percent or 65 percent respectively.
Following are descriptions of the arguments to the sar command.
Your system will prevent you from increasing the buffer cache to an unacceptably
high level. Signs of increasing buffer cache size include:
■ Hung server
■ Device drivers that suffer from a shortage of operating system kernel
virtual memory
set bufhwm=10240
# sar -b 5 10SunOS hostname 5.2 Generic sun4c 08/06/9323:43:39 bread/s lread/s %rcache bwrit/s lwrit/s %wcache pread/s pwrit/sAverage 0 25 100 3 22 88 0 0
TABLE 4-6 Descriptions of the Arguments to the sar Command
b Checks buffer activity
5 Time, every 5 seconds (must be at least 5 seconds)
10 Number of times the command gathers statistics
Chapter 4 Configuring the Server and the Client to Maximize NFS Performance 81

Directory Name Lookup Cache (DNLC)
Size the directory name lookup cache (DNLC) to a default value using maxusers .
A large cache size (ncsize ) significantly increases the efficiency of NFS servers with
multiple clients.
● To show the DNLC hit rate (cache hits), type vmstat -s .
Directory names less than 30 characters long are cached and names that are too long
to be cached are also reported. A cache miss means that a disk I/O may be needed
to read the directory when traversing the path name components to get to a file. A
hit rate of less than 90 percent requires attention.
Cache hit rates can significantly affect NFS performance. getattr , setattr, and
lookup usually represent greater than 50 percent of all NFS calls. If the requested
information isn’t in cache, the request will generate a disk operation that results in a
performance penalty as significant as that of a read or write request. The only
limit to the size of the DNLC cache is available kernel memory.
If the hit rate (cache hits) is less than 90 percent and a problem does not exist with
the number of longnames, tune the ncsiz e variable (see ”To Reset ncsize, ”)
which follows. The variable ncsize refers to the size of the DNLC in terms of the
number of name and vnode translations that can be cached. Each DNLC entry uses
about 50 bytes of extra kernel memory.
▼ To Reset ncsize
● Set ncsize in the /etc/system file to values higher than the default (basedon maxusers .)
As an initial guideline, since dedicated NFS servers do not need a lot of RAM,
maxusers will be low and the DNLC will be small; double its size.
The default value of ncsize is:
ncsize (name cache) = 17 * maxusers + 90
■ For NFS server benchmarks, set it as high as 16000.
% vmstat -s... lines omitted79062 total name lookups (cache hits 94%)16 toolong
set ncsize=5000
82 NFS Server Performance and Tuning Guide for Sun Hardware • September 1998

■ For maxusers = 2048, set it at 34906.
● Reboot the system.
See “Increasing the Inode Cache“ which follows.
Increasing the Inode Cache
A memory-resident inode is used whenever an operation is performed on an entity
in the file system. The inode read from disk is cached in case it is needed again.
ufs_ninode is the size that the UNIX file system attempts to keep the list of idle
inodes. You can have ufs_ninod set to 1 but have 10,000 idle inodes. As active
inodes become idle, if the number of idle inodes goes over ufs_ninode , then
memory is reclaimed by tossing out idle inodes.
Every entry in the DNLC cache points to an entry in the inode cache, so both caches
should be sized together. The inode cache should be at least as big as the DNLC
cache. For best performance, it should be the same size in the Solaris 2.4 through
Solaris 7 operating environments.
Since it is just a limit, ufs_ninode you can tweak with adb on a running system
with immediate effect. The only upper limit is the amount of kernel memory used by
the inodes. The tested upper limit corresponds to maxusers = 2048, which is the
same as ncsize at 34906.
To report the size of the kernel memory allocation use sar -k .
■ In the Solaris 2.4 operating environment, each inode uses 300 bytes of kernel
memory from the lg_mem pool .
■ In the Solaris 2.5.1, 2.6, and 7 operating environments, each inode uses 320 bytes
of kernel memory from the lg_mem pool . ufs_ninode is automatically
adjusted to be at least ncsize . Tune ncsize to get the hit rate up and let the
system pick the default ufs_ninodes .
With the Solaris 2.5.1. 2.6, and 7 software environments,ufs_ninode is
automatically adjusted to be at least ncsize . Tune ncsize to get the hit rate up
and let the system pick the default ufs_ninodes .
Increasing the Inode Cache in the Solaris 2.4 or the 2.5Operating Environments
If the inode cache hit rate is below 90 percent, or if the DNLC requires tuning for
local disk file I/O workloads:
1. Increase the size of the inode cache.
Chapter 4 Configuring the Server and the Client to Maximize NFS Performance 83

2. Change the variable ufs_ninode in your /etc/system file to the same size asthe DNLC (ncsize ). For example, for the Solaris version 2.4, type:
The default value of the inode cache is the same as that for ncsize :
ufs_ninode (default value) = 17 * maxusers + 90.
Caution – Do not set ufs_ninode less than ncsize . The ufs_ninode parameter
limits the number of inactive inodes, rather than the total number of active and
inactive inodes.
Reboot the system.
Increasing Read Throughput
If you are using NFS over a high speed network such as FDDI, SunFastEthernet, or
SunATMTM, you will have better read throughput by increasing the number of read-
aheads on the NFS client.
Increasing read-aheads is not recommended under these conditions:
■ The client is very short of RAM.
■ The network is very busy.
■ File accesses are randomly distributed.
When free memory is low, read-ahead will not be performed.
The read-ahead is set to 1 block, by default (8 Kbytes with version 2 and to 32 Kbytes
with version 3). For example, a read-ahead set to 2 blocks uses an additional 16
Kbytes from a file while you are reading the first 8 Kbytes from the file. Thus, the
read-ahead stays one step ahead of you and uses information in 8 Kbyte increments
to stay ahead of the information you need.
Increasing the read-ahead count can improve read throughput up to a point. The
optimal read-ahead setting will depend on your configuration and application.
Increasing the read-ahead value beyond that setting may actually reduce
throughput. In most cases, the optimal read-ahead setting is less than eight read-
aheads (8 blocks)..
set ufs_ninode=5000
84 NFS Server Performance and Tuning Guide for Sun Hardware • September 1998

Note – In the following procedure you can tune the nfs_nra and the nfs3_nravalues independently.
If a client is running Solaris the 2.5, 2.5.1, 2.6, or 7 operating environment, the client
may need to tune nfs_nra (NFS version 2). This happens if the client is talking to
a server that does not support version 3.
▼ To Increase the Number of Read-Aheads With
Version 2
1. Add the following line to /etc/system on the NFS client.
2. Reboot the system to implement the read-ahead value.
▼ To Increase the Number of Read-Aheads With
Version 3
1. Add the following line to /etc/system on the NFS client:
■ With versions of the Solaris software environment before the Solaris 2.6 software
environment:
■ With the Solaris 2.6 operating environment, type:
■ With the Solaris 7 operating environment type:
set nfs:nfs_nra=4
set nfs:nfs3_nra=6
set nfs:nfs3_nra=2
set nfs:nfs3_nra=4
Chapter 4 Configuring the Server and the Client to Maximize NFS Performance 85

Note – Raising the read-ahead count too high can make read throughput worse.
You may consider running benchmarks with different values of nfs3_nra or
nfs_nra to see what works best in your environment.
2. Reboot the system to implement the read-ahead value.
86 NFS Server Performance and Tuning Guide for Sun Hardware • September 1998

CHAPTER 5
Troubleshooting
Troubleshooting Tools
This chapter presents troubleshooting tips for the following types of problems:
■ General troubleshooting tuning
■ Client bottlenecks
■ Server bottlenecks
■ Network-related bottlenecks
General Troubleshooting Tuning Tips
This section (see TABLE 5-1) lists the actions to perform when you encounter a tuning
problem.
TABLE 5-1 General Troubleshooting Tuning Problems and Actions to Perform
Command/Tool Command Output/Result Action
netstat -i Collis+Ierrs+Oerrs/Ipkts +Opkts > 2%
Check the Ethernet hardware.
netstat -i Collis/Opkts > 10% Add an Ethernet interface and distribute
the client load.
87

netstat -i Ierrs/Ipks > 25% The host may be dropping packets, causing
high input error rate. To compensate for
bandwidth-limited network hardware:
reduce the packet size; set the read buffer
size, rsize and/or the write buffer size
wsize to 2048 when using mount or in the
/etc/vfstab file. See “To Check the
Network” on page 39 in Chapter 3.
nfsstat -s readlink > 10% Replace symbolic links with mount points.
nfsstat -s writes > 5% Install a Prestoserve NFS accelerator (SBus
card or NVRAM-NVSIMM) for peak
performance. See “Prestoserve NFS
Accelerator” on page 76 in Chapter 4.
nfsstat -s There are any badcall s. The network may be overloaded. Identify
an overloaded network using network
interface statistics.
nfsstat -s getattr > 40% Increase the client attribute cache using the
actimeo option. Make sure the DNLC and
inode caches are large. Use vmstat -s to
determine the percent hit rate (cache hits)
for the DNLC and, if needed, increase
ncsize in the /etc/system file. See
“Directory Name Lookup Cache (DNLC)”
on page 82in Chapter 4.
vmstat -s Hit rate (cache hits) < 90% Increase ncsize in the /etc/system file.
Ethernet monitor, for
example:
SunNet Manager
SharpShooter, NetMetrix
Load > 35% Add an Ethernet interface and distribute
client load.
TABLE 5-1 General Troubleshooting Tuning Problems and Actions to Perform
Command/Tool Command Output/Result Action
88 NFS Server Performance and Tuning Guide for Sun Hardware • September 1998

Client Bottlenecks
This section (see TABLE 5-2) shows potential client bottlenecks and how to remedy
them.
TABLE 5-2 Client Bottlenecks
Symptom(s) Command/Tool Cause Solution
NFS server hostname not
responding or slow response
to commands when using
NFS-mounted directories
nfsstat User’s path variable List directories on local file
systems first, critical directories
on remote file systems second,
and then the rest of the remote
file systems.
NFS server hostname not
responding or slow response
to commands when using
NFS-mounted directories
nfsstat Running executable
from an NFS-
mounted file system
Copy the application locally
(if used often).
NFS server hostname not
responding; badxid >5%
of total calls and badxid =
timeout
nfsstat -rc Client times out
before server
responds
Check for server bottleneck. If
the server’s response time isn’t
improved, increase the timeoparameter in the /etc/vfstabfile of clients. Try increasing
timeo to 25, 50, 100, 200 (tenths
of seconds). Wait one day
between modifications and
check to see if the number of
time-outs decreases.
badxid = 0 nfsstat -rc Slow network Increase rsize and wsize in
the /etc/vfstab file. Check
interconnection devices
(bridges, routers, gateways).
Chapter 5 Troubleshooting 89

Server Bottlenecks
This section (see TABLE 5-3) shows server bottlenecks and how to remedy them.
TABLE 5-3 Server Bottlenecks
Symptom(s) Command/Tool Cause Solution
NFS server hostname not
responding
vmstat -sor iostat
Cache hit rate is
< 90%
Adjust the suggested parameters
for DNLC, then run to see if the
symptom is gone. If not, reset
the parameters for DNLC.
Adjust the parameters for the
buffer cache, then the inode
cache, following the same
procedure as for the DNLC.
NFS server hostname not
responding
netstat -mor nfsstat
Server not keeping
up with request
arrival rate
Check the network. If the
problem is not the network, add
appropriate Prestoserve NFS
accelerator, or upgrade the
server.
High I/O wait time or CPU
idle time; slow disk access
times or NFS serverhostname not responding
iostat -x I/O load not
balanced across
disks; the svc_tvalue is greater than
40 ms
Take a large sample (~2 weeks).
Balance the load across disks;
add disks as necessary. Add a
Prestoserve NFS accelerator for
synchronous writes. To reduce
disk and network traffic, use
tmpfs for /tmp for both server
and clients. Measure system
cache efficiencies. Balance load
across disks; add disks as
necessary.
Slow response when
accessing remote files
netstat -sor snoop
Ethernet interface
dropping packets
If retransmissions are indicated,
increase buffer size. For
information on how to use
snoop , see “snoop ” in
Appendix A.
90 NFS Server Performance and Tuning Guide for Sun Hardware • September 1998

Network Bottlenecks
This section (see TABLE 5-4) shows network-related bottlenecks and how to remedy
them.
TABLE 5-4 Network-Related Bottlenecks
Symptoms Command/Tool Cause Solution
Poor response time when
accessing directories
mounted on different
subnets or NFS server
hostname not responding
netstat -rs NFS requests being
routed
Keep clients on the subnet
directly connected to server.
Poor response time when
accessing directories
mounted on different
subnets or NFS server
hostname not responding
netstat -sshows
incomplete or
bad headers, bad
data length fields,
bad checksums.
Network problems Check the network hardware.
Poor response time when
accessing directories
mounted on different
subnets or NFS server
hostname not responding;
sum of input and output
packets per second for an
interface is over 600 per
second
netstat -i Network overloaded The network segment is very
busy. If this is a recurring
problem, consider adding
another (le ) network interface.
Network interface collisions
are over 120 per second
netstat -i Network overloaded Reduce the number of machines
on the network or check the
network hardware.
Poor response time when
accessing directories
mounted on different
subnets or NFS server
hostname not responding
netstat -i High packet collision
rate (Collis/Opkts >.10)
- If packets are corrupted, it may
be due to a corrupted MUX box;
use the Network General Sniffer
product or another protocol
analyzer to find the cause.
- Check for overloaded
network. If there are too many
nodes, create another subnet.
- Check network hardware;
could be bad tap, transceiver,
hub on 10base-T. Check cable
length and termination.
Chapter 5 Troubleshooting 91

92 NFS Server Performance and Tuning Guide for Sun Hardware • September 1998

APPENDIX A
Using NFS Performance-Monitoringand Benchmarking Tools
This appendix discusses tools that help you monitor NFS and network performance.
These tools generate information that you can use to tune and improve performance.
See Chapter 3, “Analyzing NFS Performance,” and Chapter 4, “Configuring the
Server and the Client to Maximize NFS Performance.”
For more information about these tools, refer to their man pages (where applicable).
For third-party tools, refer to the product documentation.
This chapter also describes SPEC SFS 2.0, an NFS file server benchmarking tool.
93

NFS Monitoring Tools
TABLE A-1 describes the tools that you can use to monitor NFS operations
and performance.
For additional networking and network monitoring utilities, see the URL:
http://www.alw.nih.gov/Security/prog-network.html
TABLE A-1 NFS Operations and Performance-Monitoring Tools
Tool Function
iostat Reports I/O statistics, including disk I/O activity
nfsstat Reports NFS statistics: NFS and RPC (Remote Procedure Call)
interfaces to the kernel; can also be used to initialize statistical
information
nfswatch Shows NFS transactions classified by file system; nfswatch is a
public domain tool with source code available on the URL:
http://www.ers.ibm.com/~davy/software/nfswatch.html
sar Reports system activity such as CPU utilization, buffer activity, and
disk and tape device activity
SharpShooter* Pinpoints bottlenecks, balances NFS load across clients and servers;
shows effect of distributed applications and balances network
traffic across servers; accounts for disk usage by user or group
vmstat Reports virtual memory statistics including disk activity
* by Network General Corporation, formerly AIM Technology
94 NFS Server Performance and Tuning Guide for Sun Hardware • September 1998

Network Monitoring Tools
Use the tools described in TABLE A-2 to monitor network performance as it relates to
NFS.
snoop
The snoop command is part of the Solaris 2.x software environment. The snoopcommand must run by root (#) to capture packets in promiscuous mode. To
capture packets in non-promiscuous mode, or to analyze packets from a captured
file, you do not need to be superuser.
In promiscuous mode, the interface turns off its filter, which enables you to see all
packets on the subnet, whether or not they are addressed to your system. You can
observe other packets not destined for your system. Promiscuous mode is limited to
root .
Using the snoop command turns a Sun system into a network sniffer, which can
detect network problems. It also captures a certain number of network packets,
enables you to trace the calls from each client to each server, and displays the
contents of the packets. You can also save the contents of the packets to a file, which
you can inspect later.
TABLE A-2 Network Monitoring Tools
Tool Function
snoop Displays information about specified
packets on Ethernet
netstat Displays the contents of network-related
data structures
ping Sends ICMP ECHO_REQUESTpackets to
network hosts
NetMetrix Load Monitor Handles network load monitoring and
characterization of load in terms of time,
source, destination, protocol, and packet
size
SunNet Manager Performs network device monitoring and
troubleshooting
LAN analyzers: Network General Sniffer,
Novell/Excelan Lanalyzer
Performs packet analysis
Appendix A Using NFS Performance-Monitoring and Benchmarking Tools 95

The snoop command does the following:
■ Logs or displays packets selectively
■ Provides accurate time stamps for checking network Remote Procedure Call
(RPC) response time
■ Formats packets and protocol information in a user-friendly manner
The snoop command can display packets in a single-line summary or in expanded
form. In summary form, only the data pertaining to the highest level protocol is
displayed. For example, an NFS packet will have only NFS information displayed.
The underlying RPC, UDP (User Datagram Protocol), IP (Internet Protocol), and
network frame information is suppressed, but can be displayed if you choose either
of the verbose (-v or -V ) options.
The snoop command uses both the packet filter and buffer modules of the Data Link
Provider Interface (DLPI) so the packets can be captured efficiently and transmitted
to or received from the network.
To view or capture all traffic between any two systems, run snoop on a third system.
The snoop command is a useful tool if you are considering subnetting, since it is a
packet analysis tool. You can use the output of the snoop command to drive scripts
that accumulate load statistics. The program is capable of breaking the packet
header in order to debug it, and to investigate the source of incompatibility
problems.
The following shows some examples of how to use snoop .
Looking at Selected Packets in a Capture File (pkts)
The statistics show which client is making a read request, and the left column shows
the time in seconds, with a resolution of about 4 microseconds.
When a read or write request is made, be sure the server doesn’t time-out. If
it does, the client has to re-send again, and the client’s IP code will break up the
write block into smaller UDP blocks. The default write time is .07 seconds.
The time-out factor is a tunable parameter in the mount command.
CODE EXAMPLE A-1 Output of the snoop -i pkts -p99, 108 Command
# snoop -i pkts -p99,10899 0.0027 boutique -> sunroof NFS C GETATTR FH=8E6C100 0.0046 sunroof -> boutique NFS R GETATTR OK101 0.0080 boutique -> sunroof NFS C RENAME FH=8E6CMTra00192 to .nfs08102 0.0102 marmot -> viper NFS C LOOKUP FH=561Escreen.r.13.i386
96 NFS Server Performance and Tuning Guide for Sun Hardware • September 1998

The following table describes the arguments to the snoop command.
● To get more information on a packet, type:
The command snoop -i pkts -v 101 obtains more detailed information on
packet 101. TABLE A-4 describes the command arguments.
To view NFS packets, type:
103 0.0072 viper -> marmot NFS R LOOKUP No such fileor directory104 0.0085 bugbomb -> sunroof RLOGIN C PORT=1023 h105 0.0005 kandinsky -> sparky RSTAT C Get Statistics106 0.0004 beeblebrox -> sunroof NFS C GETATTR FH=0307107 0.0021 sparky -> kandinsky RSTAT R108 0.0073 office -> jeremiah NFS C READ FH=2584 at40960 for 8192
TABLE A-3 Arguments to the snoop Command
-i pkts Displays packets previously captured in the pkts file
-p99,108 Selects packets 99 through 108 to be displayed from a capture file; the
first number 99, is the first packet to be captured; the last number, 108,
is the last packet to be captured; the first packet in a capture file is
packet 1
# snoop -i pkts -v 101
TABLE A-4 Description of Arguments to the snoop -i pkts -v 101 Command
-i pkts Displays packets previously captured in the pkts file
-v Verbose mode; prints packet headers in detail for packet 101; use this
option only when you need information on selected packets
# snoop -i pkts rpc nfs and sunroof and boutique1 0.0000 boutique -> sunroof NFS C GETATTR FH=8E6C2 0.0046 sunroof -> boutique NFS R GETATTR OK3 0.0080 boutique -> sunroof NFS C RENAME FH=8E6C MTra00192 to .nfs08
CODE EXAMPLE A-1 Output of the snoop -i pkts -p99, 108 Command
Appendix A Using NFS Performance-Monitoring and Benchmarking Tools 97

This example gives a view of the NFS packets between the systems sunroof and
boutique . TABLE A-5describes the arguments to the previous snoop command.
● To save packets to a new capture file, type:
TABLE A-6describes the arguments to the previous snoop command.
See the snoop man page for additional details on options used with the snoopcommand and additional information about using snoop .
SPEC System File Server 2.0
SPEC System File Server (SFS) 2.0 measures NFS file server throughput and response
time. It is a one test benchmark suite consisting of 097.LADDIS. It contains an
updated workload that was developed based on a survey of more than 1,000 NFS
servers in different application environments. The workload is larger and the
TABLE A-5 Arguments to the snoop -i pkts rpc nfs and sunroof andboutique Command
-i pkts Displays packets previously captured in the pkts file
rpc nfs Displays packets for an RPC call or reply packet for the NFS protocol;
the option following nfs is the name of an RPC protocol from /etc/rpc or a program number
and Performs a logical and operation between two boolean values; for
example, sunroof boutique is the same as sunroof andboutique
# snoop -i pkts -o pkts.nfs rpc nfs sunroof boutique
TABLE A-6 Description of Arguments to the snoop -i pkts -o.nfs rpc nfssunroof boutique Command
-i pkts Displays packets previously captured in the pkts file
-o pkts.nfs Saves the displayed packets in the pkts.nfs output file
rpc nfs Displays packets for an RPC call or reply packet for the NFS
protocol; the option following nfs is the name of an RPC protocol
from /etc/rpc or a program number
98 NFS Server Performance and Tuning Guide for Sun Hardware • September 1998

response-time threshold is lower than those used in SFS 1.1, due to advances in
server technologies. Because of these and other changes, you cannot compare SPEC
SFS 2.0 results to SFS 1.1 or SFS 1 results.
In addition to general code improvemenets, SPEC SFS 2.0 includes these
enhancements
■ Measures results for both NFS Version 2 and 3
■ Adds support for TCP (either TCP or UDP can be used as the network transport)
■ Operation mix more closely matches real-world NFS workloads
■ Improved interface to accomodate both accomplished and novice users
Two reference points are considered when reporting 097.LADDIS:
■ NFS operation throughput—The peak number of NFS operations the target server
can complete in a given number of milliseconds. The larger the number of
operations an NFS server can support, the more users it can serve.
■ Response time—The average time needed for an NFS client to receive a reply
from a target server in response to an NFS request. The response time of an NFS
server is the client’s perception of how fast the server is.
LADDIS is designed so that its workload can be incrementally increased until the
target server performance falls below a certain level. That point is defined as an
average response time exceeding 50ms. This restriction is applied when deriving the
maximum throughput in NFS operations per second for which the response time
does not exceed 50 ms.
If throughput continues to increase with the workload, the throughput figure at 50
ms is reported. In many cases, throughput will start to fall off at a response time
below the 50 ms limit. In these cases, the tables in this chapter report the response
time at the point of maximum throughput.
0.97 LADDIS Benchmark
The SPEC SFS 2.0 (0.97 LADDIS)benchmark is a synthetic NFS workload based on
an application abstraction, an NFS operation mix, and an NFS operation request
rate. The workload generated by the benchmark emulates an intensive software
development environment at the NFS protocol level. The LADDIS benchmark
makes direct RPC calls to the server, eliminating any variation in NFS client
implementation. This makes it easier to control the operation mix and workload,
especially for comparing results between vendors. However, this also hides the
benefits of special client implementations, such as the cache file system client.
Appendix A Using NFS Performance-Monitoring and Benchmarking Tools 99

TABLE A-7 shows the NFS operations mix. These percentages indicate the relative
number of calls made to each operation.
The LADDIS benchmark for NFS file systems uses an operation mix that is 15
percent write operations. If your NFS clients generate only one to two percent write
operations, LADDIS underestimates your performance. The greater the similarity
between the operation mixes, the more reliable the maximum throughput in NFS
operations is as a reference.
Running the benchmark requires the server being benchmarked to have at least two
NFS clients (the NFS load generators), and one or more isolated networks. The
ability to support multiple networks is important because a single network may
become saturated before the server maximum performance point is reached. One
client is designated as the LADDIS Prime Load Generator. The Prime Load
Generator controls the execution of the LADDIS load generating code on all load-
generating clients. It typically controls the benchmark. In this capacity, it is
responsible for collecting throughput and response time data at each of the
workload points and for generating results.
To improve response time, configure your NFS server with the NVRAM-NVSIMM
Prestoserve NFS accelerator. NVSIMMs provide storage directly in the high-speed
memory subsystem. Using NVSIMMs results in considerably lower latency and
reduces the number of disks required to attain a given level of performance.
Since there are extra data copies in and out of the NVSIMM, the ultimate peak
throughput is reduced. Because NFS loads rarely sustain peak throughput, the
better response time using the NVSIMMs is preferable. For information on the
Prestoserve NFS accelerator, see “Prestoserve NFS Accelerator” on page 76 in
Chapter 4.
TABLE A-7 NFS Operations Mix by Call
NFS Operation Percent Mix
Lookup 34
Read 22
Write 15
GetAttr 13
ReadLink 8
ReadDir 3
Create 2
Remove 1
Statfs 1
SetAttr 1
100 NFS Server Performance and Tuning Guide for Sun Hardware • September 1998

SPEC SFS 2.0 Results
Sun Microsystems has run SPEC SFS 2.0 benchmarks on the Sun Enterprise 3000-
6000 family of servers. The benchmarks were run with NFS Version 2 and NFS
Version 3. TABLE A-8 shows the results with Version 2. TABLE A-9 shows the results
with Version 3.
TABLE A-8 SPEC SFS 2.0 Results With Version 2
System Number of CPUs ResultOverall ResponseTime
Sun Enterprise 3000 6 11806 5.1
Sun Enterprise 4000 12 20406 6.7
Sun Enterprise 6000 18 25639 9.9
TABLE A-9 SPEC SFS 2.0 Results With Version 3
System Number of CPUs ResultOverall ResponseTime
Sun Enterprise 3000 6 5903 5.4
Sun Enterprise 4000 12 10592 5.6
Appendix A Using NFS Performance-Monitoring and Benchmarking Tools 101

102 NFS Server Performance and Tuning Guide for Sun Hardware • September 1998
Index
NUMERICS100 Mbit Ethernet, 84
64-bit file size
NFS version 3, 4
Aasynchronous writes
NFS version 3, 5
ATM, 63
Bbadxid , 89
bottlenecks
network-related, 91
pinpointing, 94
bridges and routers dropping packets, 40
buffer cache
adjusting, bufhwm , 80
increasing, 52
buffer sizes, identifying, 79
bufhwm , 80
Ccache file system, adding, 67
cache hit rate, 55, 82, 90
cache size, adjusting, maxusers , 80
checking
client, 56
network, 38
NFS server, 42
client
bottlenecks, 89
checking, 56
NFS problems, 56
configuration recommendations for NFS
performance, 61
configuring
CPUs, 72
disk drives, 65
/etc/init.d/nfs.server , 78
/etc/system , 78
memory, 73
CPU
configuring, 72
in NFS servers guidelines, 73
CPU idle time, 90
CPU utilization, determining, 72
cron , 67
crontab , 52
Ddata structures, network-related, displaying
contents, 95
data, collecting, long-term, 52
dedicated NFS server
Netra NFS 150 Server, 13
Index 103

/dev/dsk entries
determining for exported file systems, 45
df -k , 43
Directory Name Lookup Cache (DNLC), 82
disk
access load, spreading, 70
activity, reporting, 94
array, technology used, 32
array, using, 28
concatenation, 70
configuration, 71
constraints, easing of, 65
load, spreading out, 52
mirroring, 70
statistics for each disk, 47
striping, 70
utilization, 65
disk drive
configuration rules, 69
configuring, 65
data layout, 71
load balancing, 90
disk names into disk numbers
translating, 48
disk units
SPARCstorage MultiPack, 34
SPARCstorage UniPack, 35
DNLC, 82
cache hits, 55
hit rate, 55
setting, 90
drive
data layout, 71
load balancing, 90
number supported, 31
drive channel, 31
dropping packets
bridges and routers, 39
Eecho packets
round trip time, 40
/etc/init.d/nfs.server
tuning, 78
/etc/system , 78, 79
kernel variables
modifying using /etc/system , 79
tuning
/etc/system , 78
Ethernet, 64
packets, displaying information, 95
Excelan Lanalyzer, 95
exporting file systems
determining, 42
FFastEthernet, 84
FDDI, 63, 84
file system
heavy usage, 66
paging from disk, 74
file systems, mounted
determining, 43
displaying statistics, 57
Hhit rate, 55, 82
host, number supported, 31
hot swap, 32
II/O load
not balanced across disks, 90
I/O wait time, high, 90
inode cache, increasing, 83
interlace size, 70
iostat , 47, 48, 90, 94
iostat -x , 90
JJumpStart, 67
104 NFS Server Performance and Tuning Guide for Sun Hardware • September 1998

LLADDIS, 98
LAN analyzers, 95
load balancing, 71
ls -lL
identifying /dev/dsk entries, 46
Mmaxusers
parameters derived from, 80
memory bound, determining, 74
memory configuration, 73, 75
memory requirements
calculating, 75
metadisk, 43
metastat , 43
mpstat , 72
Nncsize, setting, 55
NetMetrix, 95
Netra NFS150 Server system, 13
netstat , 95
netstat -i , 39, 87, 91
netstat -m , 90
netstat -rs , 91
netstat -s , 90
network
checking, 38
collisions, checking with netstat , 40
configuring, 63
device monitoring and troubleshooting, 95
monitoring tools, 95
overloaded, 91
problems, 91
requirements
attribute-intensive applications, 64
data-intensive applications, 63
systems with more than one class of users, 64
subnetting, 96
tracing calls, 95
tuning, 63
Network General Sniffer, 95
NFS
characteristics, 1
load balancing, 94
monitoring tools, 94
network and performance tools, 93
operation throughput, 99
performance, increasing with the SPARCstorage
Array, 30
problems
client, 56
displaying server statistics, 52
requests, 1
server not responding, 89
server workload, balancing, 62
server, checking, 42
statistics, reporting, 94
threads in/etc/init.d/nfs.server , 78
transactions, showing, 94
NFS server, dedicated
Netra NFS 150 Server, 13
NFS version 3, 2
64-bit file size, 4
asynchronous writes, 5
read directory with attributes, 5
weak cache consistency, 5
nfsstat , 90, 94
nfsstat -c , 56
nfsstat -m , 57
nfsstat -rc , 89
nfsstat -s , 52, 88
nfswatch , 94
number of packets and collisions/errors per
network, 39
OOnline Disk Suite, 52, 70
spreading disk access load, 70
using log-based file systems with, 71
optimizing data layout on disk drives, 70
Ppacket analysis, 95
Index 105

packet size specifications, 40
packets
calculating packet error rate, 40
dropping bridges and routers, 40
echo, round trip time, 40
Ethernet, displaying information, 95
parameters, tuning, 78
performance monitor
Ultra Enterprise 3000, 4000, 5000, 6000
systems, 17
performance tuning recommendations, 88
performance-monitoring tools, 93
ping , 95
ping -s , 40, 41
poor response time, 91
presto , 55
Prestoserve NFS accelerator
adding, 76
checking its state, 55
procedures
checking each client, 56
checking the network, 38
tuning, 37, 62
general performance improvement, 37
performance problem resolution, 38
RRAID, 29
RAID level, 32
RAID Manager, 32
random I/O capacity, 65
read directory with attributes
NFS version 3, 5
read throughput, increasing, 84
read-aheads, increasing, NFS clients, 84
read-only data, 66
redundant, 32
replicating
data, 66
file systems, 66
response time, 99
poor, 91
Ssar , 48, 94
scan rate, 74
SCSI controller, 31
SCSI host, 31
SCSI-2 bus, 31
server
bottlenecks, 90
checking, 42
statistics, identifying NFS problems, 52
share , 42
SharpShooter, 94
slow disk access times, 90
slow response, 90
snoop , 90, 95
software
RAID Manager, 32
Solstice SyMON, 17
SPARCcenter 2000
expandability, 20
main memory, 20
modules, 20
overview, 19
SPARCcenter 2000E
expandability, 20
main memory, 20
modules, 20
overview, 19
SPARCserver 1000
features, 20
SPARCserver 1000E
features, 20
SPARCserver 20
configurations, 26
features, 27
overview, 26
SPARCstorage Array subsystem
features, 28
using, 28
SPARCstorage MultiPack
disk units, 34
SPARCstorageUniPack
disk units, 35
SPEC SFS 2.0, 98
SunNet Manager, 95
106 NFS Server Performance and Tuning Guide for Sun Hardware • September 1998

swap space
configuration, 75
requirements, calculating, 76
symbolic links, eliminating, 54
system activity, reporting, 94
system monitor
Ultra Enterprise 3000, 4000, 5000 and 6000
systems, 17
Ttroubleshooting, 87
tuning, 91
CPUs, 72
cycle, 6
disk drives, 65
memory, 73
network, 63
NFS performance improvement, 61
NFS threads in /etc/init.d/nfs.server , 78
parameters, 78
performance problem resolution, 91
procedures, 37, 38, 62
general performance improvement, 37
performance problem resolution, 38
recommendations for NFS performance, 61
variables, identifying, 79
Uufs_ninode , 84
Ultra Enterprise 1 system, 25
Ultra Enterprise 2 system, 25
Ultra Enterprise 4000 server system, 15
Ultra Enterprise 5000 server sysem, 15
Ultra Enterprise 600 server system, 15
update schedules, 67
Vvfstab , 67
virtual memory statistics, reporting, 94
vmstat , 74, 94
vmstat -s , 55, 82, 90
Wweak cache consistency, NFS version 3, 5
whatdev script, 45
Z
zone-bit recording, 71
Index 107

108 NFS Server Performance and Tuning Guide for Sun Hardware • September 1998
Recommended