nFgineering Desin and Analysis Laboratory
University of New Hampshire
Durham, New Hampshire
PSYCHRFUC.ITRIC PROPERTIFS
OF
qTh< HELIUM-WATER VAPOR MIXTURES
A Study of the Relationship Between
Temperature, Pressure and Humidity,
and Wet- and Dr7-Bulb Temperatures
by 0. T. Zimmennan
and
Robert C. Ramsey
Technical Report No. 106
This research was sponsored by
Office of Naval Research
Contract N00014 -67-A-0158-.0003
August, 1968
- - - - IF:• -,•
I. ABS..RACTr. . ..
II. INTI'RODUCTION .... 2
III. THEORY OF UME WET- AND DRY-BULB PSVCH..E... 4
IV. WT--BULB TEMPERATURE vs. ADITAATIC SATURATION TEPPERATEJRE . 11
V. APPARAT .. . . 15
Gas Preparation and Delivery Svstem . 15
Measuring System . 20
The Psychrameter.................... . . 20
VI. VEDLC=IT OF GAS OVER THE 'VET BULB 24
VII. RMUTS . ................................ 26
VIII. ANAfLYSIS OF ERROR . . . 28
IX. PSYrls.......= . . . ................ ... 35
NOMNCLATTJE . . ............................ 41
REFERENCES.. ............................ . 44
APPTINDIX (Coxmputer Program) 46
ii
FIGURFS
Figure Page
1. Sketch to Illustrate Wet-Bulb Temperature ...... ........ 5
2. Sketches to Illustrate Adiabatic Saturaticn ..... ...... 12
3. Diagram of Apparatus .............. ........ .. 16
4. Gas Humidification System ............. ........ 17
5. Humidification Columnr ............ ............ 19
6. Entrainment Separator .............. ........ ... 19
7. Details of Psychrometer .......... ......... 22
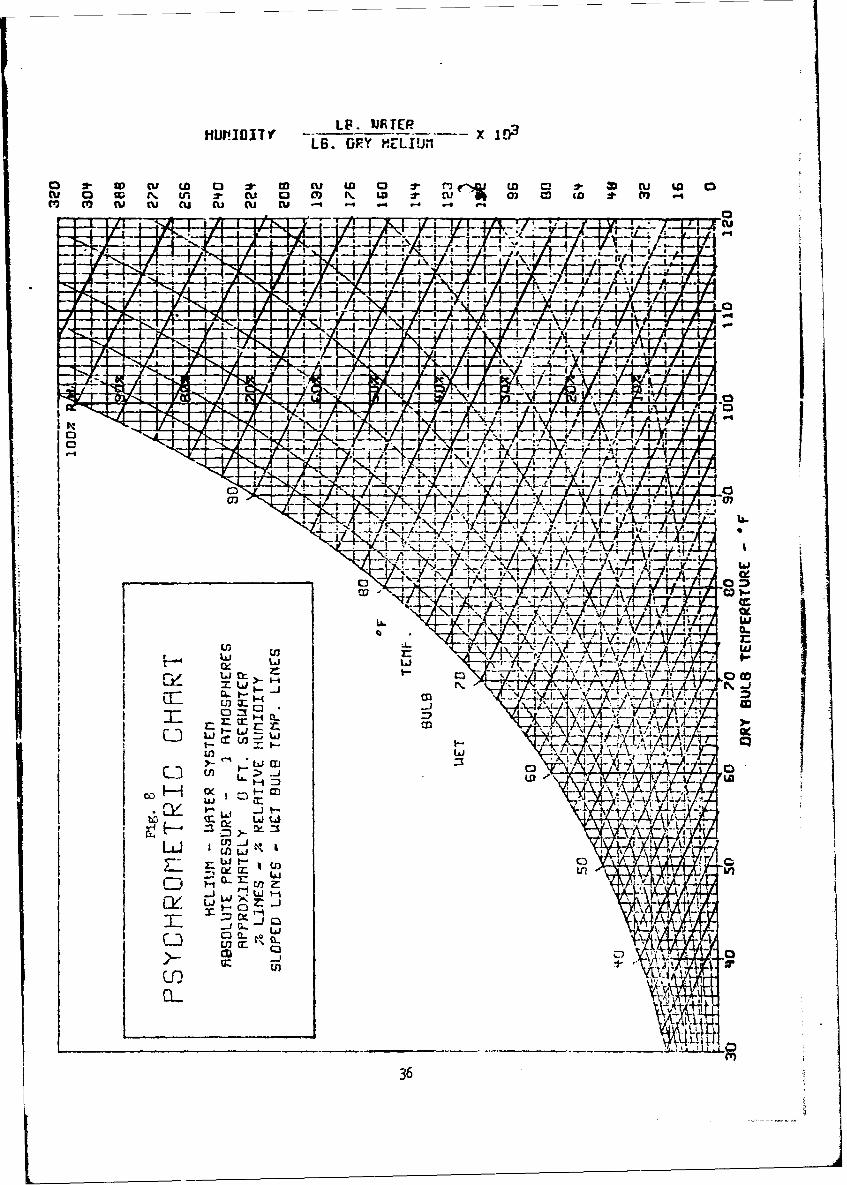
8. Psychrometric Chart for Hel1iu-Water System at 1 Atm.. .... 36
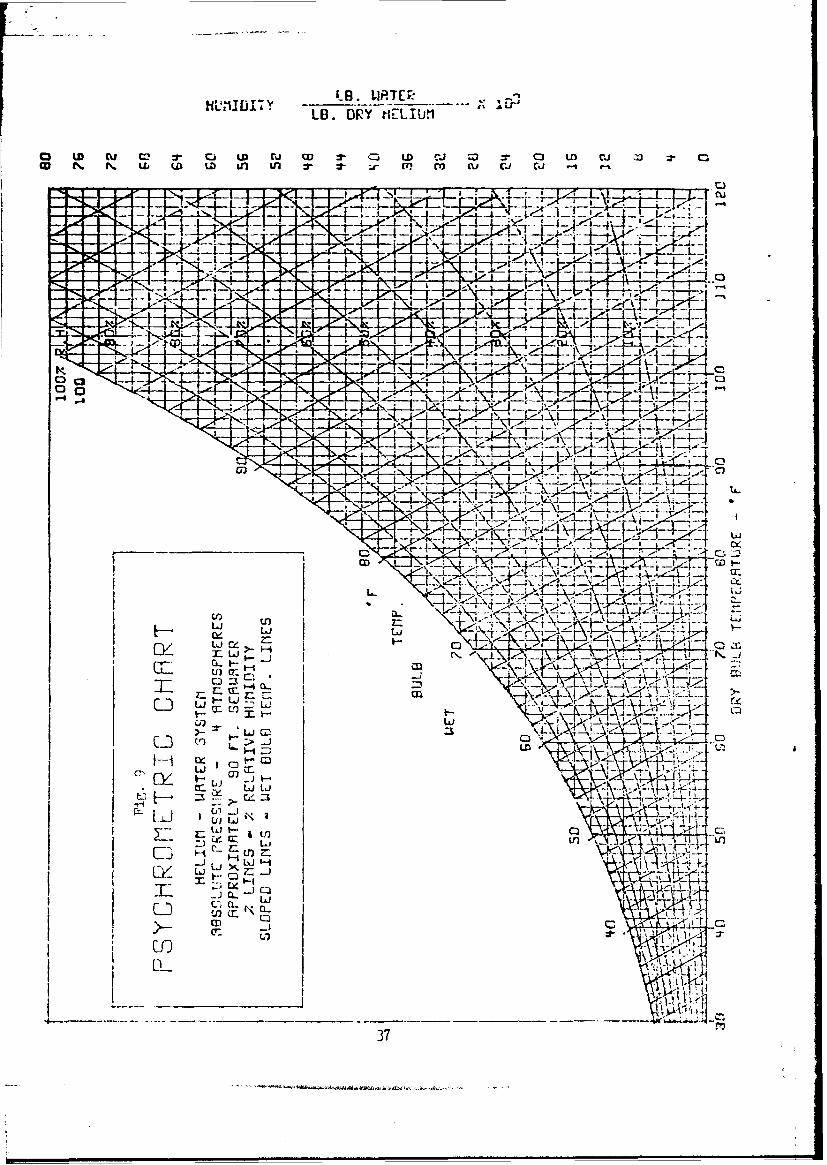
9. Psychrcmetric Chart for He&,un-Water System at 4 Atm ...... .37(Approx. 90 ft. sea water)
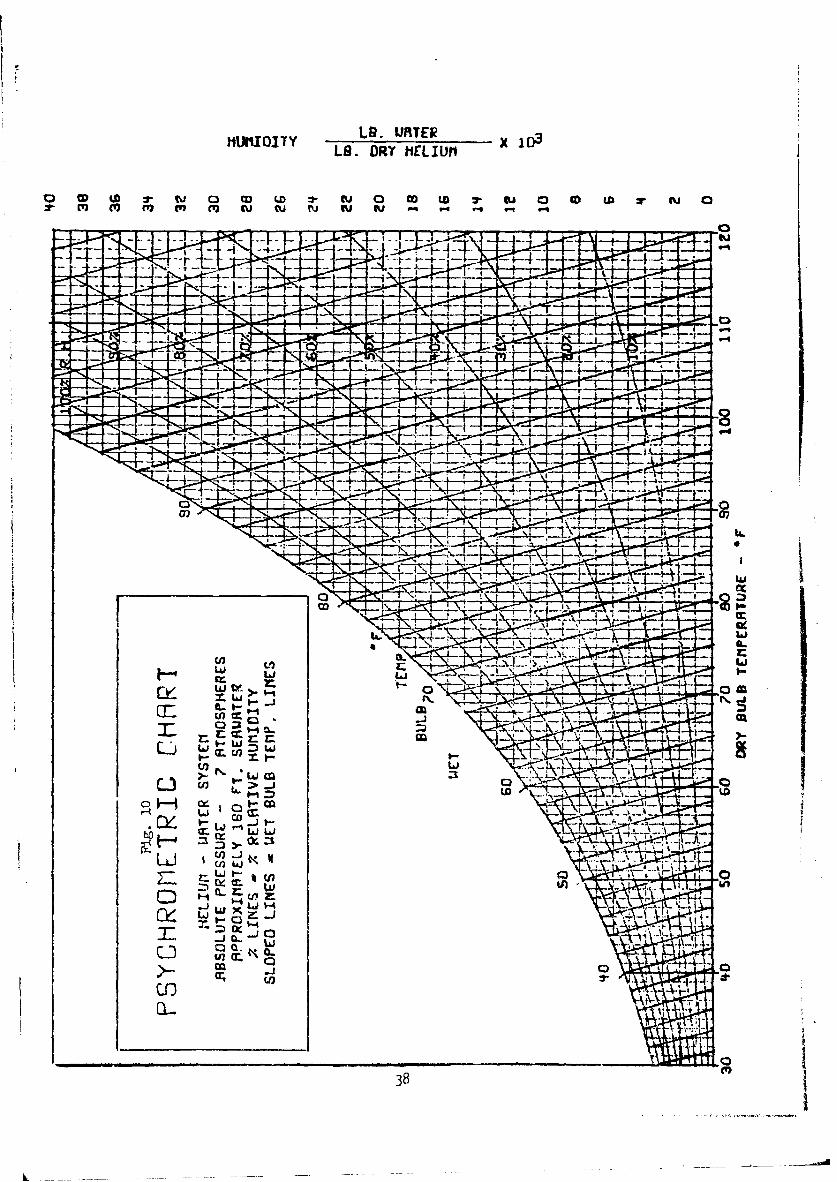
10. Psychrometric Chart for H.iim-Water System at 7 Atm. ..... 38(Approx 180 ft. sea water",
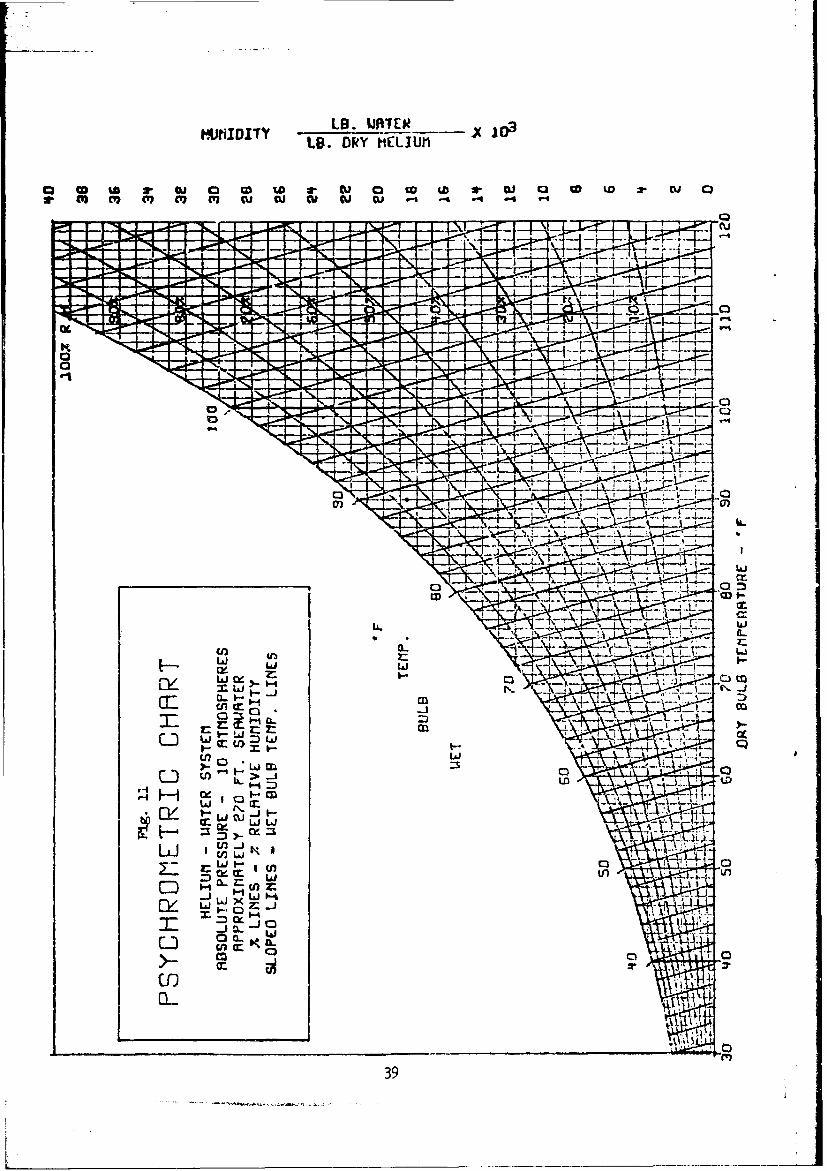
11. Psychrcmetric Chart for Ie1lium-Water System at 10 Atm ...... .39(Approx. 270 ft. sea water)
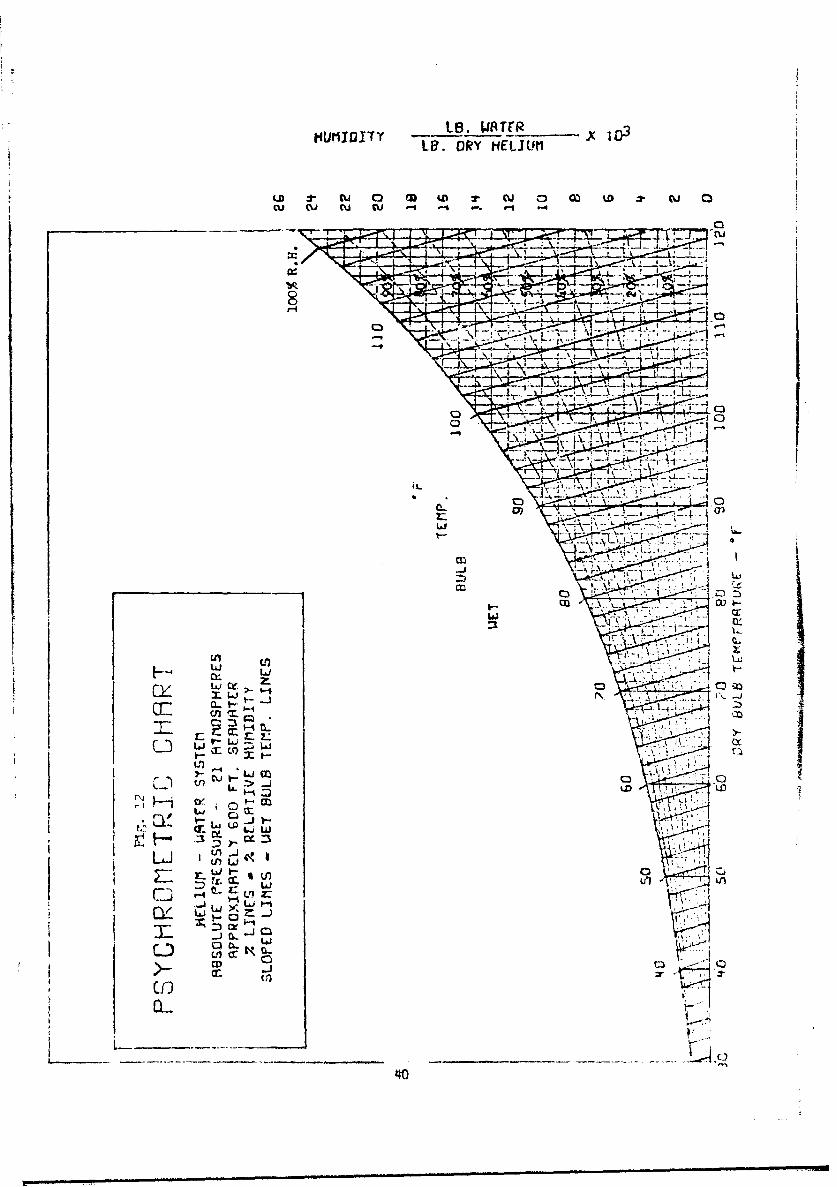
12. Psychrometric Chart for Pelim-Water System at 21 Atm ...... .40(Apprcx. 600 ft. sea water)
TABLES
Table Page
1. Sumnary of Data and Tesults of Determnination ofPsychrometric Constant ............. ........ ... 27
2. Deviations of Psych*ýYmetric Constant from Average. . . .... 34
iii
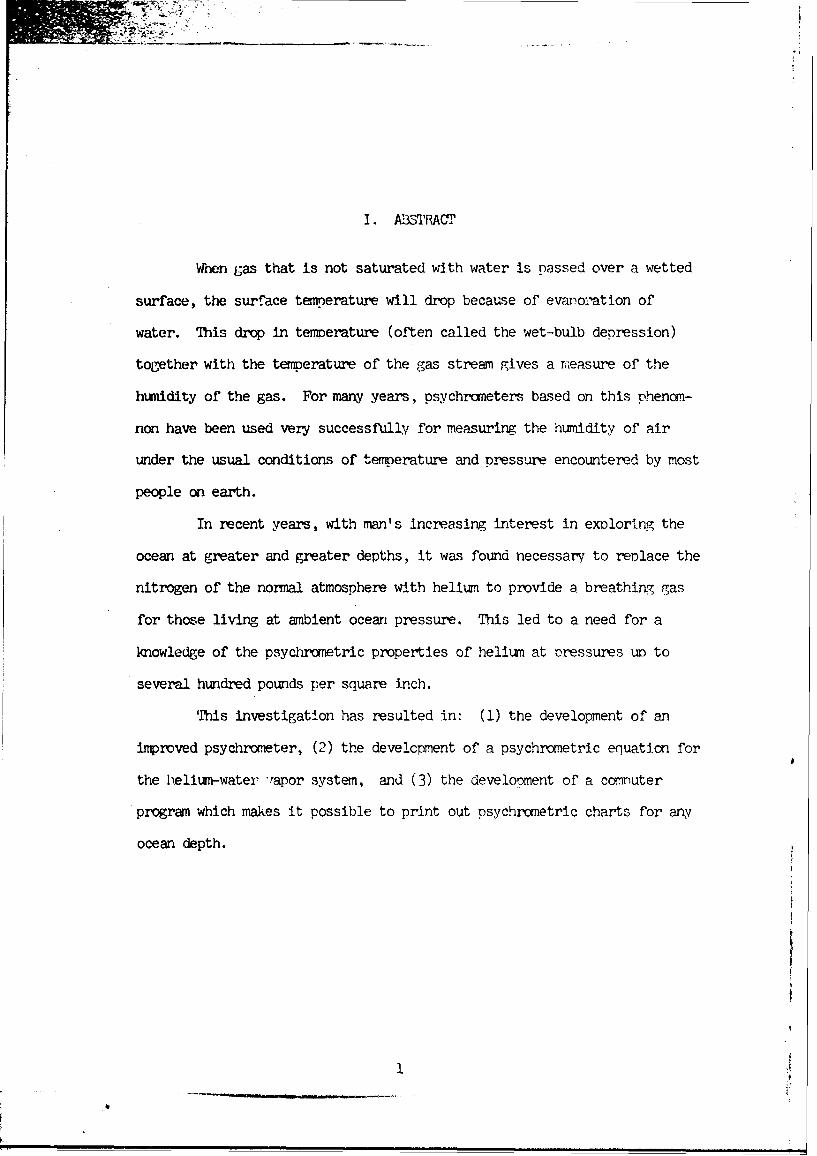
I. A'STRACT
When gas that is not saturated with water is passed over a wetted
surface, the surface temperature will drop because of evaporation of
water. This drop in temperature (often called the wet-bulb depression)
together with the temperature of the gas stream gives a measure of the
himidity of the gas. For many years, psychrameters based on this phencm-
non have been used very successfully for measuring the humidity of air
under the usual conditions of temperature and pressure encountered by most
people on earth.
In recent years, with man's increasing interest in exploring the
ocean at greater and greater depths, it was found necessary to replace the
nitrogen of the normal atmosphere with helium to provide a breathing gas
for those living at anbient ocean pressure. This led to a need for a
knowledge of the psychrometric properties of helium at pressures up to
several hundred pounds per square inch.
'This investigation has resulted in: (1) the development of an
improved psychrometer, (2) the develcpment of a psychrometric equation for
the helium-water *7apor system, and (3) the development of a crnnuter
program which makes it possible to print out psychrometric charts for any
ocean depth.
1]
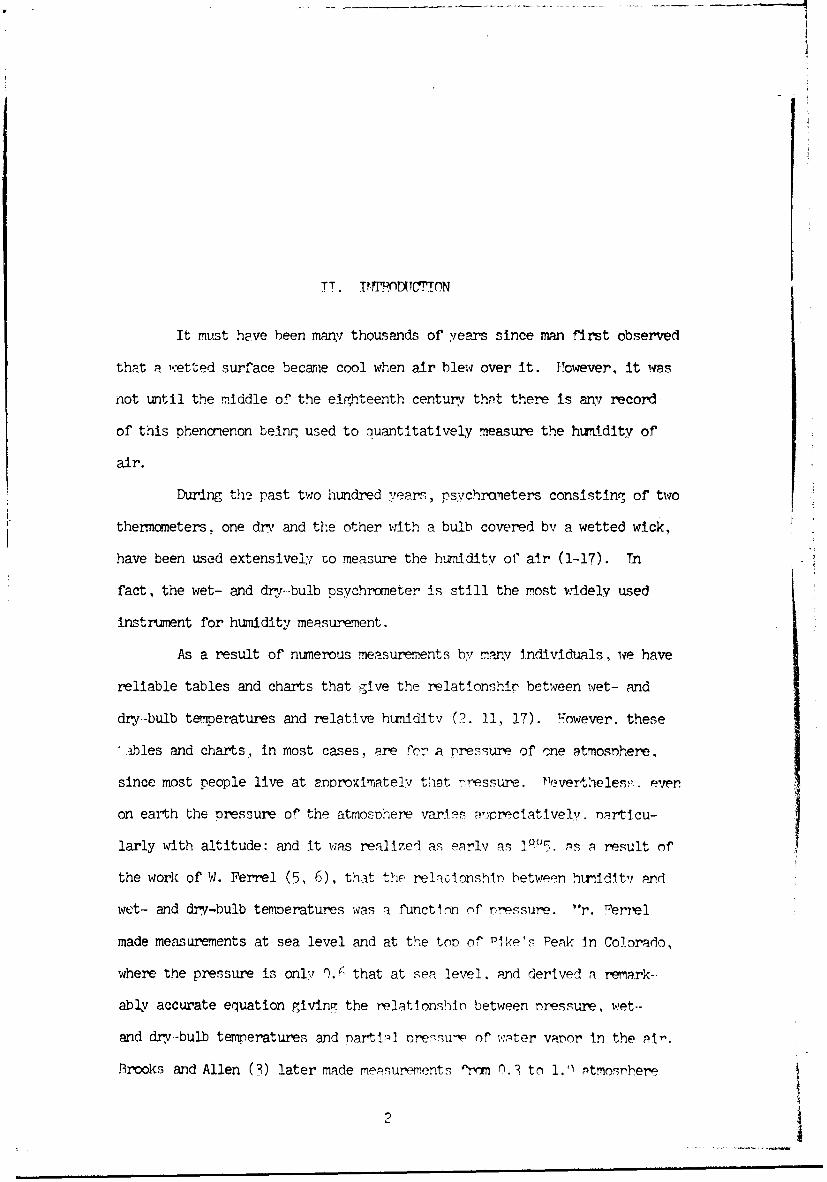
TT. TM"?LDT.CPTON
It mLst have been many thousands of years since man first observed
that a 1--etted surface becarie cool when air blew over it. However, it was
not until the middle of the eirhteenth century that there is an', record
of this phenorienon beinr, used to quantitatively measure the htrttdity of
air.
During th'3 past two hundred years, psychravneters consistinm of two
thermometers. one dry, and the other with a bulb covered by a wetted wick,
have been used extensively ro measure the humnidity of1 air (1-17). Tn
fact, the wet- and dr*--bulb psychrometer is still the most widely used
instrument for humidity measurement.
As a resut.t of nunerous measurements by many individuals, we have
reliable tables and charts that give the relationship between wet- and
dry--bulb temperatures and relative htmidity (2. 1.i 17). However, these
ables and charts, in most cases . are for a pressure of cne atmosnhere,
since most people live at anproximately that p-ressure. ý7ever'theles,. ever.
on earth the pressure of the atrnosohere varies 9,preclative1y. n•rticu-
larly with altitude: and it was realized as early as ln5. ,s a result of
the work of W. Ferrel (5. 6), that the relaclonshin between humidltv and
wet- and dry-bulb temoeratures was a functlnn rof pressure. •r. 'errel
made measurements at sea level and at the top of Pike's Peak In Colorado,
where the pressure is only q. r that at sea level, and derived n remark--
ably accurate equation givinr, the relationshin between pressure, wet--
and dry-bulb temperatures and narti:-1 ore-su-(, of water vanor In the pIr'.
Brooks and Allen (3) later made measu-ements r n.3 to l.') Ptmosbhere 1
24
pressure, and recently 3rown (It) extended the ranme fram 0.114 to 5.2n
atmospheres.
Reliable psychrcmetric data or eauations for gases other than air
have not been available. Since man is nonrally an air-breathing animal
and psychrcmetry has been principally concerned with man's comfort. there
has been little need for psychrometric prooertles of gases other than air.
This is no longer the case, for today some men do breath gas mix-
tures that are radically different fran the usual nitrogen--oxyven mixture.
For hundreds of years air-breathing men have explored and worked
in the ocean in various types of diving gear. but they have been limited
to rather shallow depths because of the narcotic effect of nitrogen, which
can cause serious trouble at depths greater than 50 feet. For greater
depths (down to 1,000 feet or more) the nitrogen must be reolaced by sane
other gas, and the gas that has proved most practicable is helium.
In recent years, there have been a nunber of undersea habitats
in which men have lived and worked in the ocean at deoths up to several
hundred feet. The pioneering efforts of Jacques Cous~tau with his Con-
shelfs and the U. S. Navy with Sealabs I and TI are well known, but many
private organizations have also entered this field. The control of hum.id-
Ity in all of these ventures has proved a serious problem, and nart of the
difficulty has been due to a lack of knowledge of the psychranetric pr'op-
erties of the heliumr-water vapor system. Attempts to extrapolate fron
air-water vapor at one atmosphere to helium-water vapor at several atmos-
pheres have caused lots of trouble.
A knowledge of the psychranetric properties of the helium-water
vapor system at the conditions encountered in undersea habitits was badly
needed. This investigation was designed to fill that need.
III. THEORY OF THE WE-T- AND DRY-BULB PSYCHMOM=l'ER
Many people have contributed to the theory of the wet- and dry-
bulb psychrometer (1, 9, 10, 16), and although there is a difference of
opinion as to some of the details of mass and heat transfer, the follow-
ing seems to represent the facts:
When liquid water is brought into contact with a gas that
is not saturated with water vapor, the water will evaporate.
This requires latent heat of vaporization, and the temperature
of the wetted bulb drops as heat is removed. However, as the
temperature of the wetted bulb drops, two things happen: (1)
the rate of evaporation decreases as the wetted bulb gets
colder, and (2) as soon as the temperature of the wetted bulb
gets lower than that of the gas, heat begins to flow fran the
gas to the bulb, and the rate of heat flow keeps increasing as
the temperature of the wetted surface keeps dropping. Eventu-
ally the rate at which heat flows from the gas to the bulb
becoimes equal to the rate at which heat is lost through latent
heat of vaporization, and the temperature of' the wetted bulb
drms no further.
If the r tity of gas is so large compared to the quantity of
water' that the temperature and hunidlty of the gas do not change appre-
ciably and if the velocity of the gas over the wetted surface is above
a certain minimum value, the lowest temperature reached by the wetted
bulb is called the "wet-bulb temperature". The conditions are illustra-
ted in Figure 1.
~1 __
Dry-Bulb Wet-BulbTheinometer -- Thermometer
g g xgPg _9 _g •g P,
t t Iw Hw X, PW
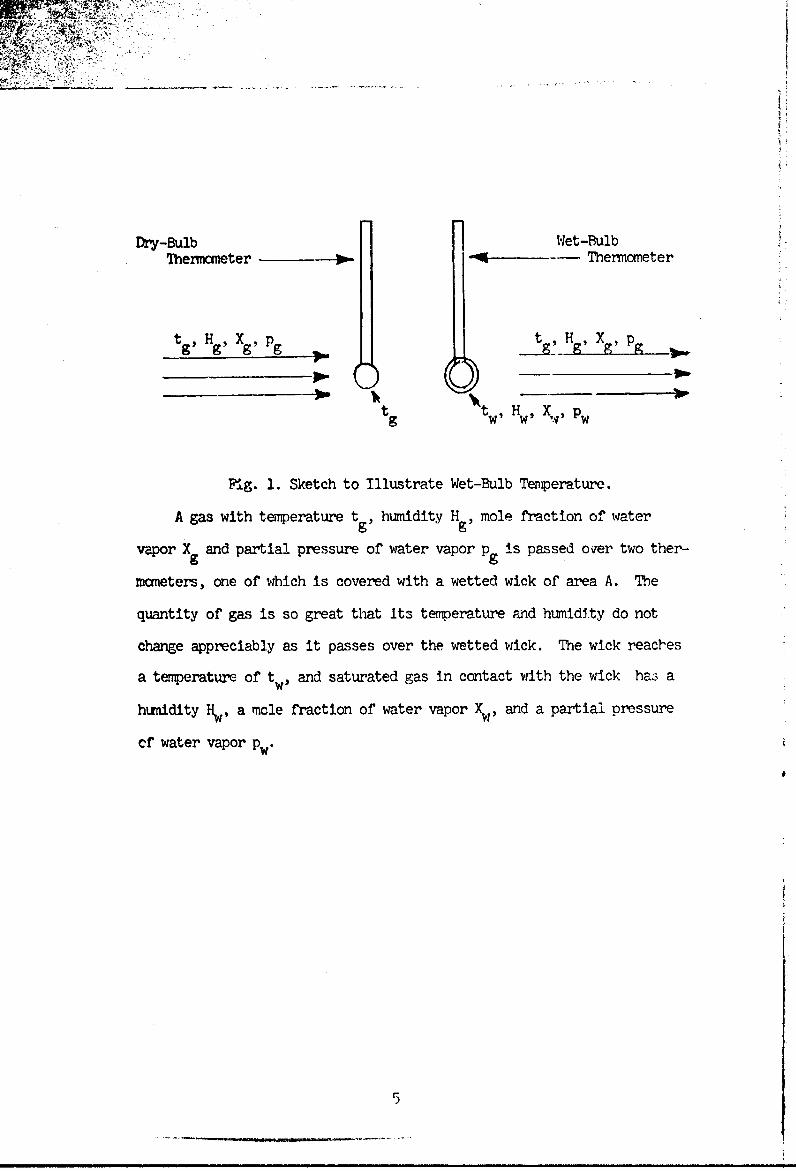
K,.g. 1. Sketch to Illustrate Wet-Bulb Temperature.
A gas with temperature tg, humidity Hg, mole fraction of water
vapor X and partial pressure of water vapor pg is passed over two ther-
mcmeters, one of which is covered with a wetted wick of area A. The
quantity of gas is so great that Its temperature and humidity do not
change appreciably as it passes over the wetted wick. The wick reaches
a temperature of tw, and saturated gas in contact with the wick ha3 a
hunidity Hw, a mole fraction of water vapor X, and a partial pressure
cf water vapor pw"
5
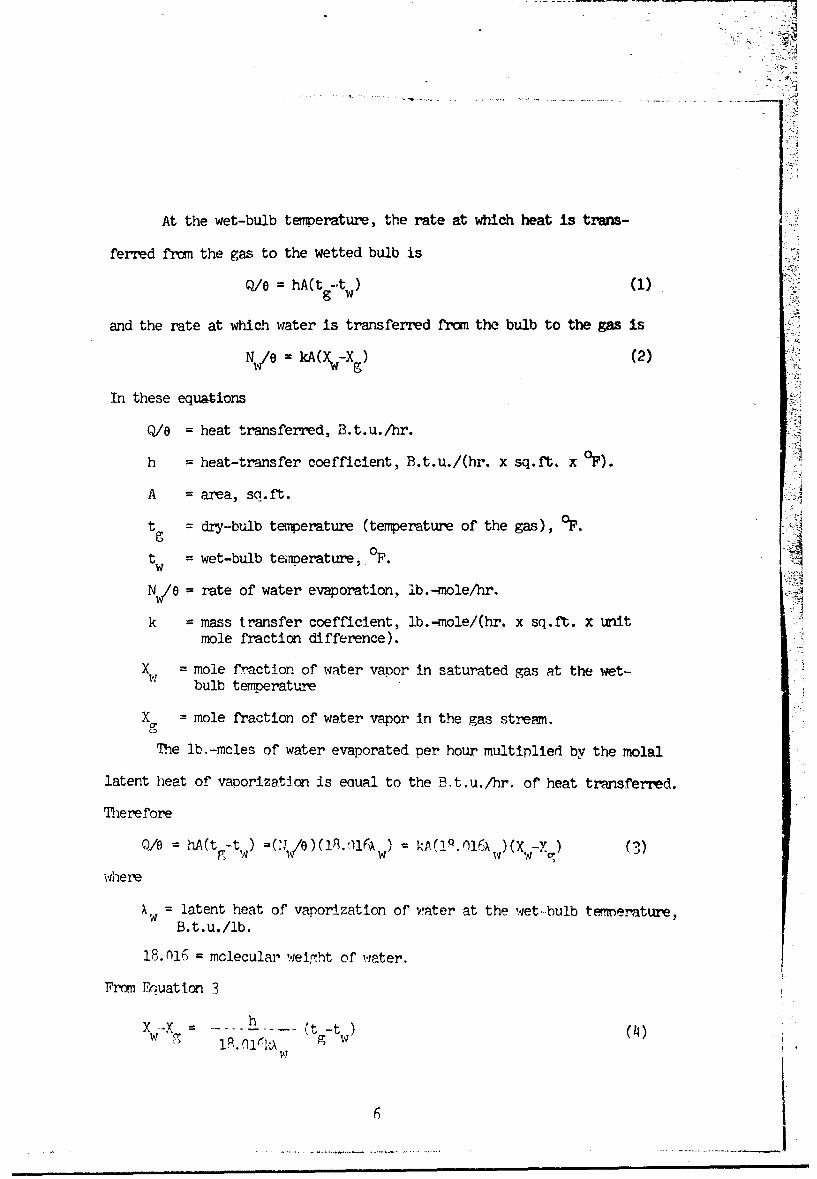
At the wet-bulb temperature, the rate at which heat is trans-
ferred from the gas to the wetted bulb is
Q/e = hA(tg-tw) (1)g w
and the rate at which water is transferred from the bulb to the gas is
N - kA -X (2)
In these equations
Q/0 = heat transferred, B.t.u./hr.
h = heat-transfer coefficient, B.t.u./(hr. x sq.ft. x °F).
A = area, sq.ft.
t = dry-bulb temperature (temperature of the gas), OF.g
tw = wet-bulb teimnerature, P.
N/e = rate of water evaporation, lb.-mole/hr.
k = mass transfer coefficient, lb.-mole/(hr. x sq.ft. x unitmole fraction difference).
X - mole fraction of water vapor in saturated gas at the wet-bulb temperature
X mole fraction of water vapor in the gas stream.9
The lb.-mcles of water evaporated per hour multiplied by the molal
latent heat of vaporization is eaual to the B.t.u./hr. of heat transferred.
Therefore
Q/e =hA(t -tw) = (/e ) (1q. •16A = kP(19.01 w)(X,1.M-'A) (3)
whereAw latent heat of vaporization of water at the wet-bulb temnerature,
B. t. u./lb.
18.016 = molecular weig7ht of water.
Frcm Enuation 3
XW c t _t-t ) (4)i lwW6
,m • • I m •
4C
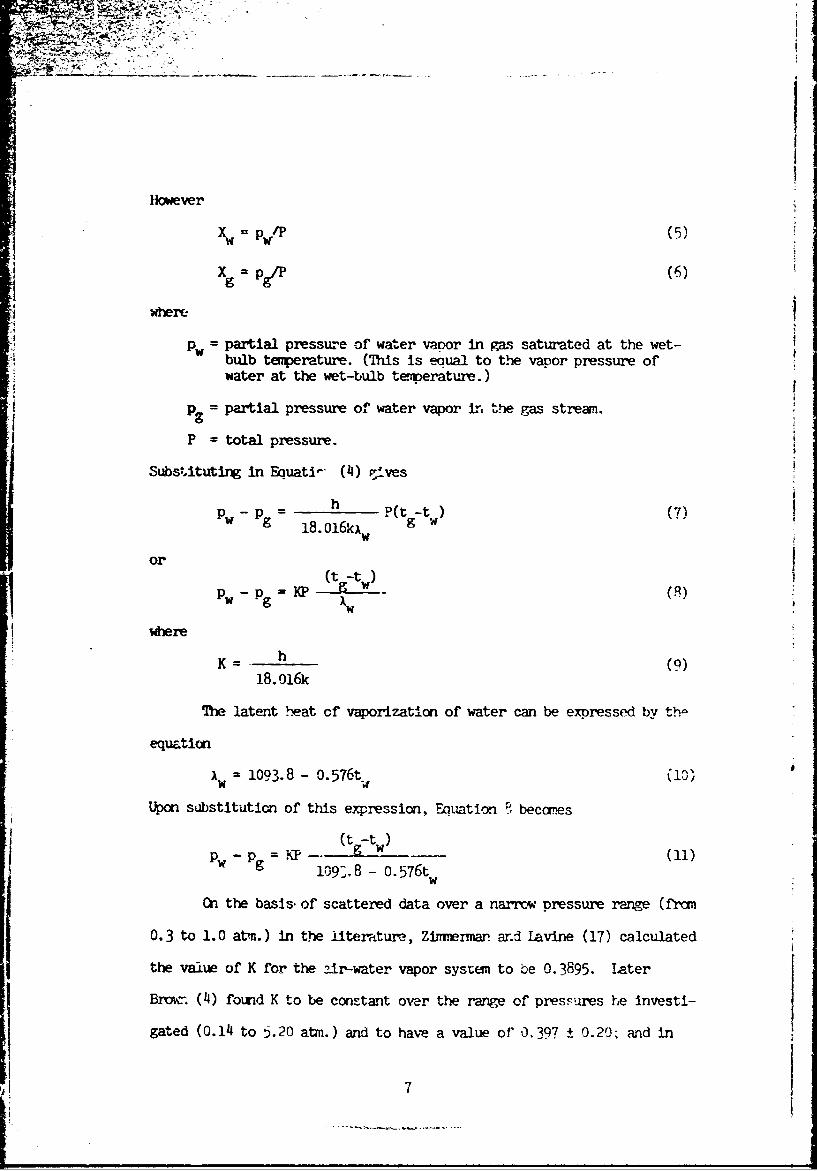
However
xg Pg/P(6
Pw= partial pressure of water vapor in gas saturated at the wet-bulb temperature. (This Is equal to the vapor pressure ofwater at the wet-bulb temperature.)
pI =partial pressure of water vapor in tl.e gas stream.
P= total pressure.
Substituting in Equati'- (4) rves
Pw Pg = _ ?(_tt) (7)18.016kx g 9
or(t -t )
p - P (Q)w AW
where
hSK- (9)
18.0i6k
The latent heat of vaporization of water can be expressed by tho
equation
Aw 1093.8 - 0.576t W
Upon substitution of this expression, Equation ; beca%.s
(t•-tw)Pw - Pg=
109,.8 - 0.576t (
On the basis. of scattered data over a narrow pressure range (from
0.3 to 1.0 atm.) in the literature, Zimmennan and Lavine (17) calculated
the value of K for the air-water vapor systen to be 0. 3895. Later
Brown. (4) found K to be constant over the range of pressures he investi-
gated (0.14 to 5.20 atm.) and to have a value of 03.397 ± 0.20; and in
7
the present investigation a value of 0. 392 was determined.
According to Equation 9 , the psychrcmetric constant K is a
Amnction of the heat and mass transfer c.f'icients and the molecular
weight of the liquid. (The previous discussion referred to "water" and
"water vapor" since water is the usual liquid we are interested in, but
the analysis applies equally well to any gas-liquid system.)
If we could calculate heat and mass transfer coefficients with
sufficient accuracy there would be no need to determine psychrrmetric
data exoerimentally, except to check the validity of the equation. How-
ever, we don't know enough yet about the actual mechanism of heat and
mass transfer in the systems to permit us to make calculations of suffi-
cient accuracy.
Calculations for the air-water system indicated that the constant
was between 0.34 and 0.40. This was reasonably good since the experi-
mentally determined constant is approximately 0.39. For the helium-
water system, however, calculations indicated that the constant was betweer
0.28 and 2.1 - a range much too great to be of any help.
Because we can't calculate the constant, we must determine it
experimentally. In fact, the psychrometer is an excellent device for
determining mass transfer coefficients from heat-transfer data.
If the constant K is known for a pazt.icular system, the partial
pressure cf vapor in the gas stream can be calculated, and this in turn
can be used to calculate the absolute hunidity (pounds or moles of vapor
per pound or mole of vapor-free gas) or the relative humidity (ratio of
partial pressure of vapor -in the gas to partial pre.s.xire at saturation).
Using ideal gas laws, whi ch are sufficiently occura~e for mos't
purposes:
mole wt. of gas
HW [ mole wt. ofliqluid] (13)" ~ ~~mole wt. of gas J(3
p- s x 100 (i'O
where
H - humidity of the gas stream, lb. vapor/lb. vapor-free gas.
It• - humidity of gas saturated at the wet-bulb temperature, lb.vapor/lb. vapor-free gas.
RH - percent relative humidity.
Ps M partiai pressure of vapor in saturated vapor-gas mixture at thedry-bulb temperature. (This is equal to the vapor pressure ofthe liquid at t ).
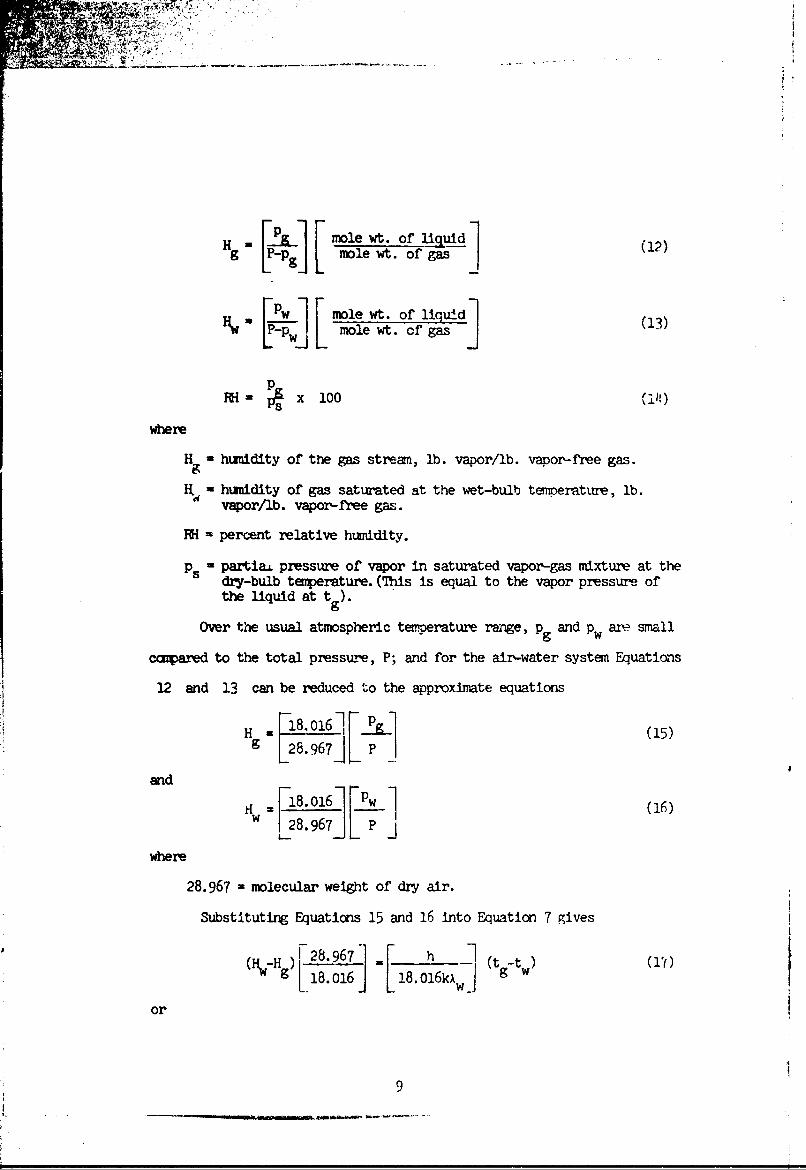
Over the usual atmospheric temperature range, Pg and Pw are small
cczpamd to the total pressure, P; and for the air-water system Equations
12 and 13 can be reduced to the approximate equations
H-l l6 F&] (15)2 2.967]
and
S 016- Pw (16)1i =28. 967] L- _ý_
Where
28.967 a molecular weight of dry air.
Substituting Equations 15 and 16 into Equation 7 gives
A ~ =1 [ 18.016kX~ (tw~ w
or
9
or
i- f (tg-tw) (18)
where
K'- h (19)
28.967k
For the air-water system, it has been found exnerimentally that
K' = 0.26. Therefore, the common relationship for air-water vapor for
the usual atmospheric conditions is
0 26illw- Hg '-w. (tg-t) (20)
It must always be kept in mind, however, that: (1) Efnuation 20
is only an approximate equation and that it beccmes more and more inac--
curate as the temperature is raised, and (2) that it only applies to the
air-water system.
10
IV. WEr-BULB TMVERATURE vs. ADIABATIC SATURATION TF/PERATU1M
As pointed out earlier, wet- and dry-bulb psychranetry is based
on bringing a large quantity of gas into contact with a limited quantity
of liquid. Under these conditions neither the temperature nor the hTmid-
ity of the gas is changed. A related phenomenon is based on bringing a
limited quantity of gas into contact with a large quantity of liquid.
Under these conditions, the gas (unless it is already saturated with
vapor) will increase in hu-idity and decrease in temperature. If the
system is i solated so that it can neither lose nor gain heat, the tempera-
ture reached by the water is known &z the "adiabatic-saturation
temperature". And, if the system is large enough the gas will leave the
chamber saturatea with vapor at the adiabatic-saturation temperature. A
camon exarple of this process is the humidification of air by passing it
through sprays cf circulating water.
The wet-bulb temperature is something quite different fran the
adiabatic-saturation t erature: the former is based on heat and mass
transfer while the latter depends only on a simple heat balance, as shown
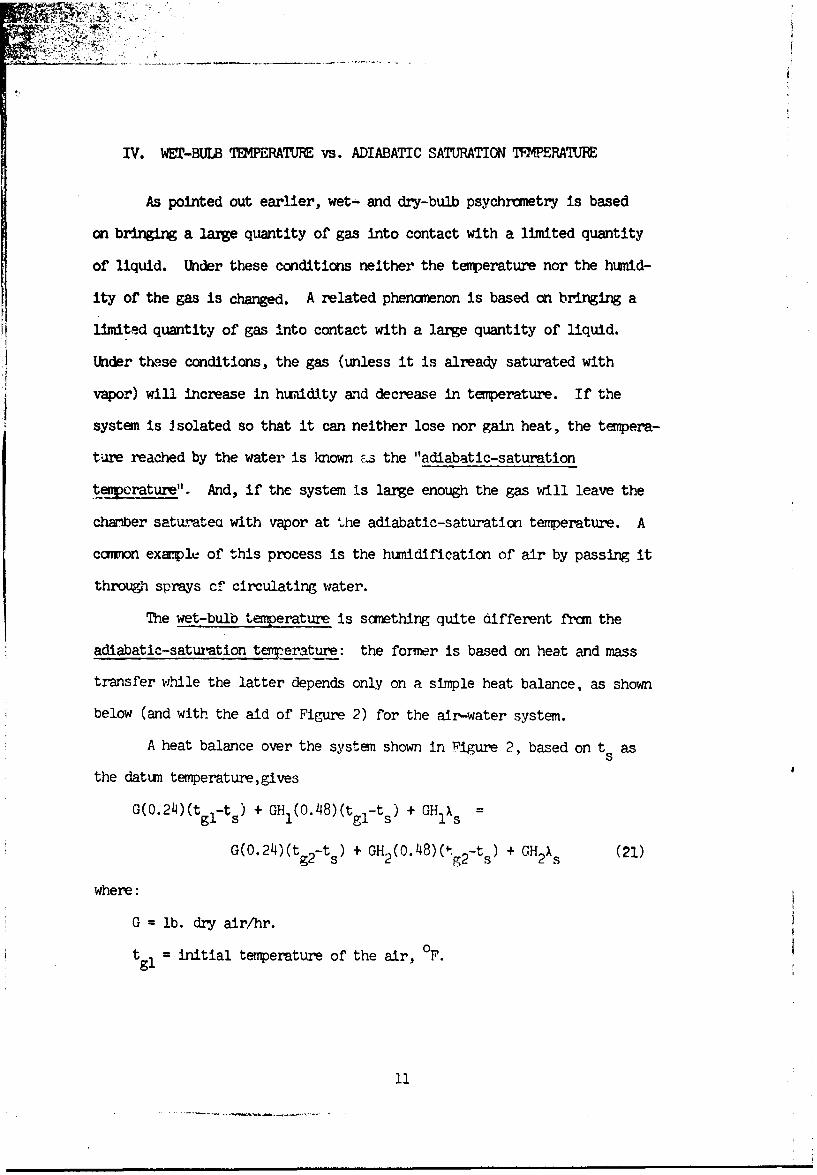
below (and with the aid of Figure 2) for the air-water system.
A heat balance over the system shown in Figure 2, based on t ass
the datum temperature,gives
G(O.24)(t gl-t s) + GH (0.48)(t gl-t s) + GH 1s =
G(O.24)(t g2-ts + GH 2(0.48)(tg2-ts + GH2)s (21)
where:
G = lb. dry air/hr.
tgI = initial temperature of the air, F.
ii
H G H2 tgl
0gl t12 tg29 ~ g2
H1a b a a
tS
A B C
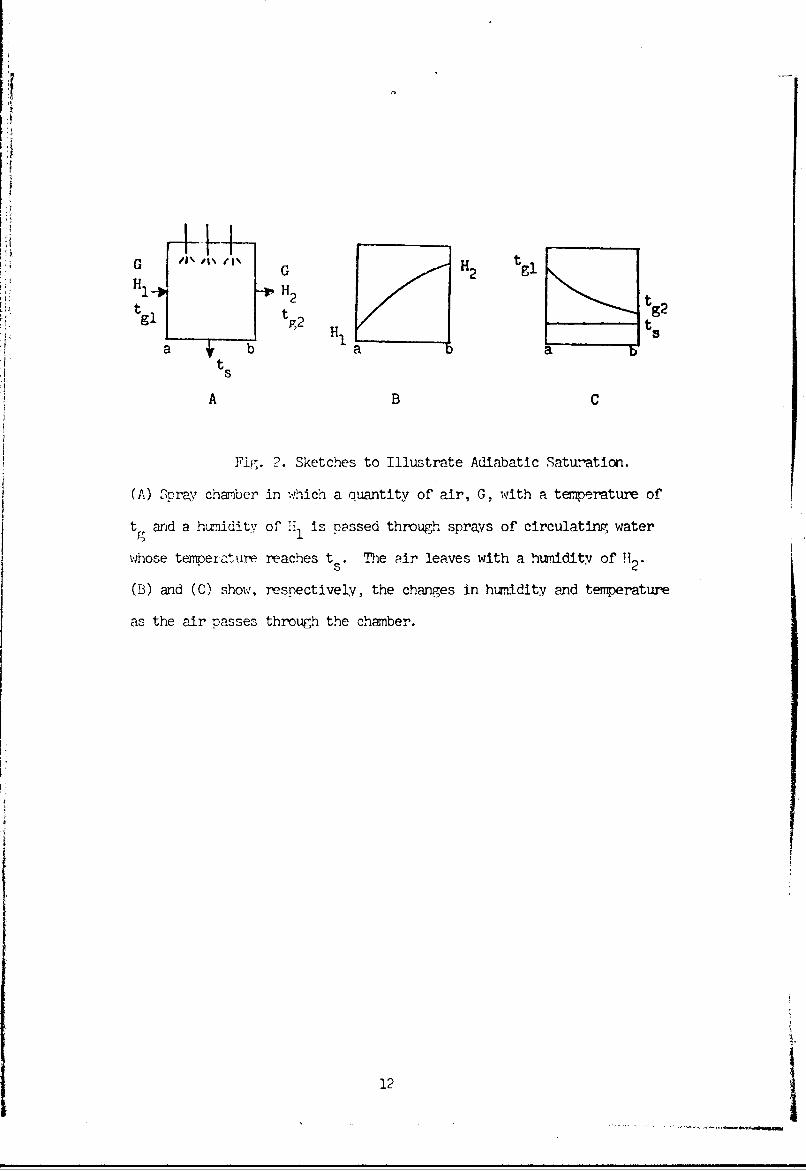
Fifr. 2. Sketches to Illustrate Adiabatic Satuiration.
(A) Spray chamber in which a quantity of air, G, wiith a temperature of
t and a humidity of H1 is passed through sprays of circulating- water
whose temoerature reaches ts. The air leaves with a hunidity of !12.
(B) and (C) show, respectively, the changes in hunidity and temperature
as the air passes through the chamber.
12
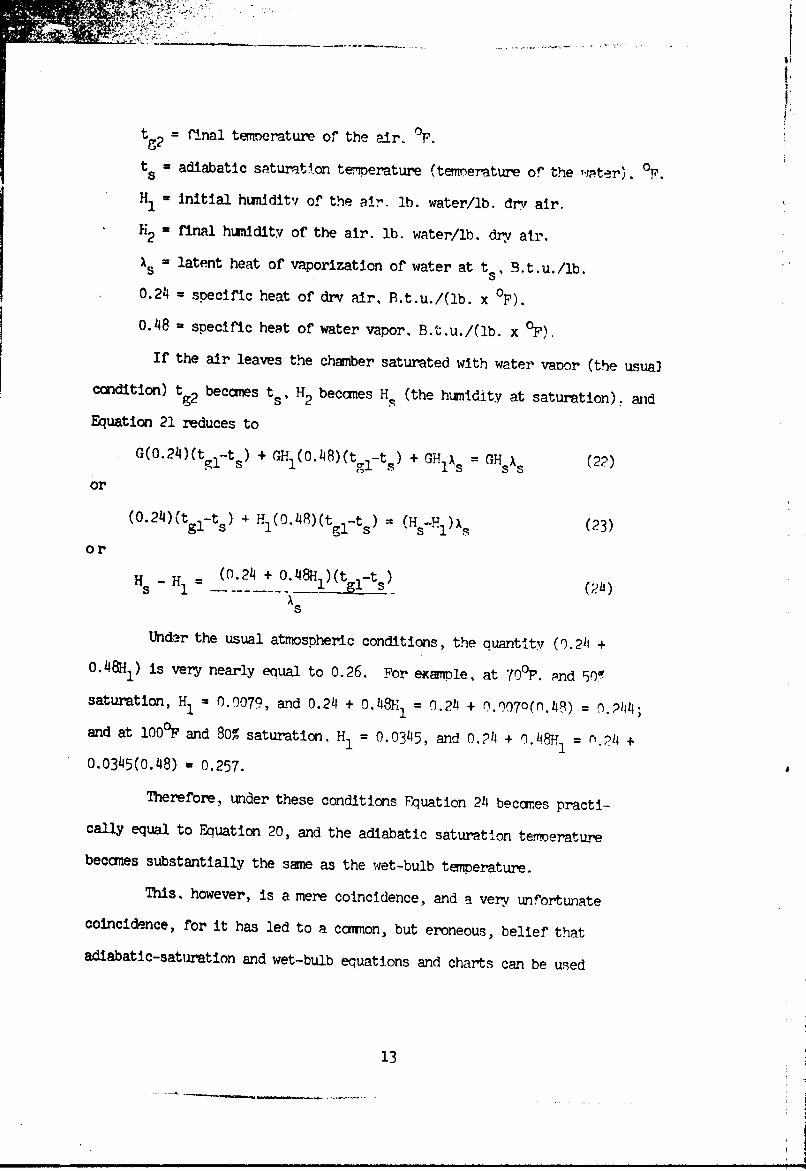
t = final temnerature of the air. OP.
t a adiabatic saturati.on temperature (temnerature of the -rmter), °F.H1 initial huniditv of the air. lb. water/lb. dy air.
H2 I final hunidity of the air. lb. water/lb. dmy air.
AS = latent heat of vaporization of water at tsl B.t.u./lb.
0.24 = specific heat of dry air, B.t.u./(lb. x OF).0.48 = specific heat of water vapor, B.t.u./(lb. x °F).
If the air leaves the chamber saturated with water vanor (the usualcondition) tg2 becomes t, H2 becanes H (the huntdity at saturation). aid
Equation 21 reduces to
G(0.24)(tg l - tS) + GH 1(0.48)(t l-t ) + GH As = GH A (22)
or
(0.24)(tglts) : H (H(0.48t
or
Hs H1 (0.24 + 0.48Hl)(tl_ts)(a
S
Under the usual atmospheric conditions, the quantlty (0.211 +
•0.48H1) is very nearly enual to 0.26. For example, at 70°F. Pnd 50wsaturation, H1 = 0.0079, and 0.24 + 0.48, = 0.24 + 0.0070(0.49) = 0.244;
and at 100°F and 80% saturation. H1 = 0.0345, and 0.2h + 0.48H = r).211 +0.0345(0.48) = 0.257.
Therefore, under these conditions Fquation 24 becares practi-
cally equal to Equation 20, and the adiabatic saturation temoerature
becanes substantially the same as the wet-bulb temperature.
This, however, is a mere coincidence, and a very unfortunate
coincidence, for it has led to a caoion, but eroneous, belief that
adiabatic-saturation and wet-bulb equations and charts can be used
13
interchangeably. Actually, they can be used interchangeablv for the air-
water system if the temperatures are not very high and the highest accur-
acy is not required.
However, for systems other than air and water, this coincidence
does not occur, and widely different results are obtained fron the two
equations even at low temperatures. For example, if adiabatic-saturation
temperatures are calculated for the helimn-water system and then used as
wet-bulb temperatures the results are worthless. And even for the air-
water system it is not wise to use the equations interchangeably at
terperatures much above 1250F.
I1
I
V. APPARATUS
An apparatus for determining the value of the constant K in the
psychranetric equation consists of the following elements: (1) a system
for preparing and delivering a gas stream of the desired temperature,
pressure, and humidity; (2) instrumnents for determining the amount of
water vapor in the gas stream, the gas flow rate, and the pressure; and
(3) a psychrcnmter consisting of wet- and dry-bulb measuring devices with
appropriate means for feeding water to the wet bulb.
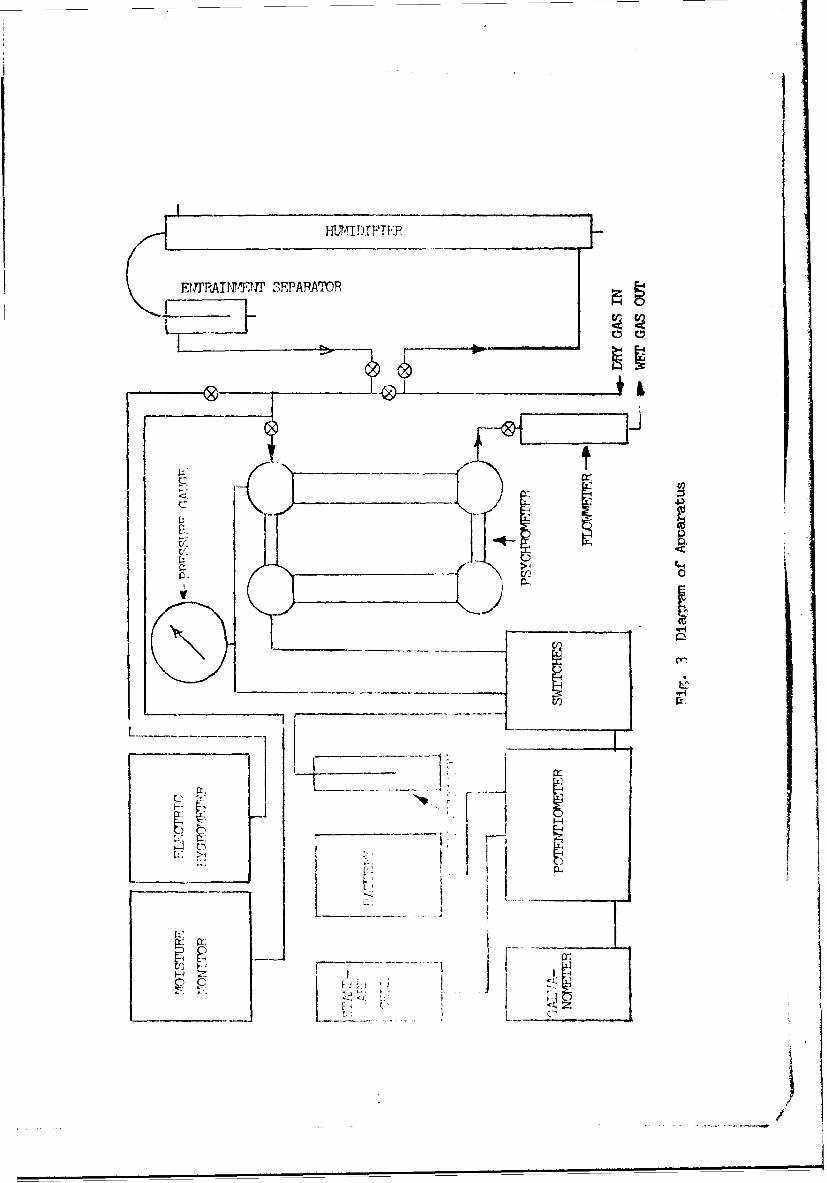
The apparatus finally used is shown diagramatically in Figure 3.
Most of the system presented few problems, but the psychrameter, itself,
required a great deal of study before a reliable unit was developed.
Gas Pýrparation and Delivery System
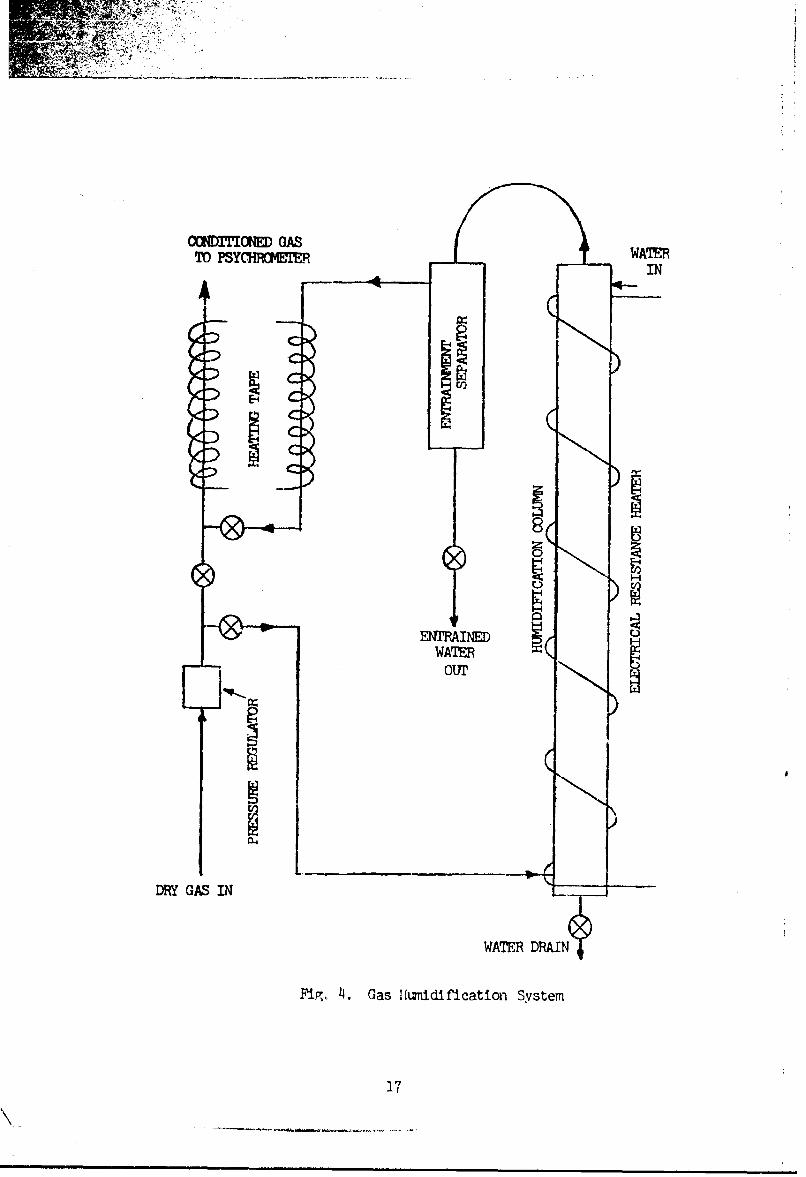
The gas preparation and delivery system (Figure 4) includes a
pressure regulator, humidification column, entrainment separator, electri-
cal heating tapes, and a series of needle valves to portion the flow.
The various parts of the system are connected with 3/8" o.d., 0.032"
wall-thickness, standard, soft, copper, refrigeration tubing connected
with campression-type fittirgs. All components can withstand pressures
of at least 400 psi. The line pressure, and resulting flow rate, is kept
constant with a diaphragn-type flow regulator.
As can be seen frrjm Figure 4, gas from a cylinder is split into
two streams, one of which is passed through a humidification column after
which it is reccmbined with the other stream. By regulating the tempera-
ture of the humidification column and the ratio of the two gas flow rates,
15
HUMTDTFIM� --
I.4:
0
___ I1
_ _ ZIZZlI.
W � FlII
H
__________ p�.
I HL
Li? KH �2
Ky HH � I
I/
C04DITIONED GASTO PSYCERMEM IN
D C\
D( c
DRY GAS IN
WATER DRAIN
Pig. 4. Gas Humikdlfication System
17
a final gas stream of any desired humidity can be readily obtained.
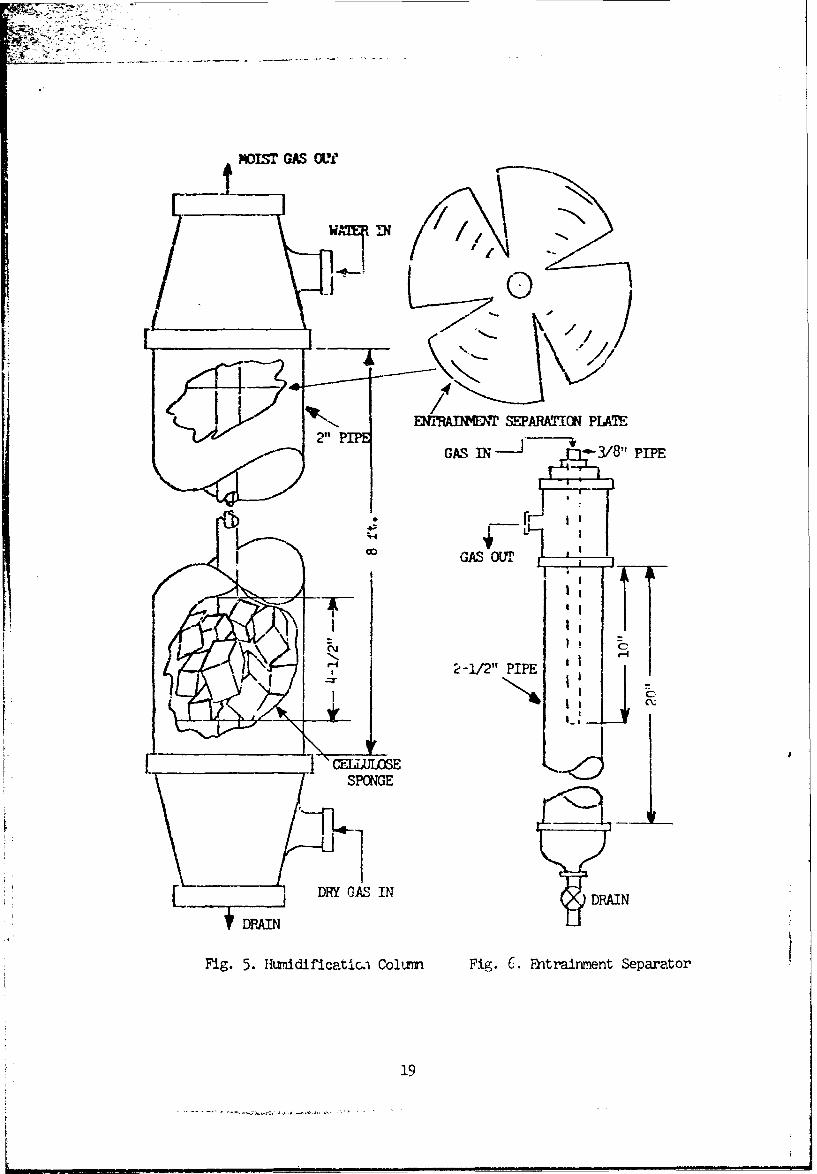
To eliminate the neea for a circulating pump, the batch-type
humidiflcation column shown in Figure 5 was designed, and it proved to
be very satisfactory. It consists of an 8-foot length of 2-inch nominal
diameter, schedule 40 steel pipe, packed with one-half inch cubes of
cellulose sponge to a height of 7k feet. The packed section is divided
into nineteen 4½-inch sections of sponges separated by discs of 20-mesh
stainless steel screen. This construction keeps the sponges frou packing
together in the bottan of the column after they are wetted. In orzration,
water is introduced into the top of the column, with no gas flowing, until
the sponges absorb all of the water they can. The wet packing holds 2.2
lb. of water, and has a void fraction of 0.429. This quantity of water
is sufficient to supply 6 standard cu. ft. per minute of saturated gas at
100°F. and 20 psig for 2.7 hr. starting with dry helium.
The column is wrapped with a 1,200-watt heating tape, a&d other
heating tapes are wrapped around the delivery piping. Var!ible transform-
ers are used to control temperatures.
An entrairnment separator, Figure 6, effectively prevents the carrTy
over of liquid water.
With this apparatus, the gas -leaving the system is discarded to the
atmosphere. Originally, the system was designed so that discharged gas
could be collected in a balloon and purped back into cylinders. Unfortun-
ately, the only compressor available had insufficient capacity and proved
unsatisfactory.
1'
LB i ] ] i•
M=is GMS OWi
-D1
•K. ANMEN SEPARA'TI.ON PLATEr 02"-PI/"8" PIPEP
DRY GAS INDRIN
Fig. 5. Iltmddificatic.i Colum Fig. - Fntrainment Separator
19
easurir•S-s!m'
,Measurements are made of the follL-wir cquantities: wet- and dry-
bulb ter•eratur-es, pressure, flow rate, and hainidity. rl7wpe.ratuwes axe
measured by meams of copper-constantan theiriocouples and a Leeds arid
Northrum Type K-3 potenticmeter. -r•essures up to a little more than 1
atm.. gauge are measured with a mercury mnanmeter. For higher pressures,
a Heise bourdon tube pressure gauge, reading to 0.2 psi gauge, is used.
Atmospheric pressure is measurd with a Taylor aneroid barometer. Gas
flow is measured with a Brooks Full-View Potameter.
For humidity measure-ents - two instrunarnts are used: a Moisture
Monitor frn Consolidated Electrodynýics Corporation and an Flectric
Hygrnmeter from Hygrodynanics Incorporated. The forner, which indicates
humidity in parts per million by voluwe at 25°C. and one atmosphere, works
best below 3,000 parts per million. The electric hygrameter, which uses
a dew point sensor, indicates relative humidity at atmrospheric pressure
and roan temperature. It works best above 7% relative humidity.
The PsvchrometerThe design of a psychrameter for heliur presents certain problem
that are not of great importance in a psychrometer for air, Just as a
psychrometer for pressure operation presents o;'oblems not present in a
psychrometer for atmospheric pressure. Helium is expensive. Its density
is so low that it takes several times the quantity of helium, by volu-zn as
of air to obtain sufficient velocity for a true wet-bulb temperature
reading. Thermal conductivities and heat-transfer coefficients of helium
are much greater than those of air, and water evaporates into helium
much faster than into air- All of these factors make it desirable to
20
construct a psychrometer for heliun as small as practicable.
At first, a psychrameter was constructed using 3Y8" :.-d. copper
tubing and fittirgs and a wet-bulb thermocouple with the bead covered by
a cieth wick which extended into a well filled with water. The results
obtained with this apparatus using, air, nitrogen, and helium were very
Inoo•sistent and did not agree with results obtained with apparatus of
larger internal diameter.
After mwry experiments it was found that the original apparatus
had jeveral faults: (1) the diameter of the wick war so large capared
to the internal cross section of the 3/8" tubing that the Ifree cross
sectional area was not great enough to give a proper flow pattern; (2)
the water evaporated so rapidly that the wick could nar be kept properly
wetted; (3) the pressure tap was located at sace distance ffromn the wet-
bulb thermocouple, and it was not certain that the neasu,-'ed oressure was
the tre pressure at the wet-bulb thermocouple; and (4) haat conductivity
alog the thermocouple resulted in a wet-buill reading that was higher than
the true wet-bulb temrature.
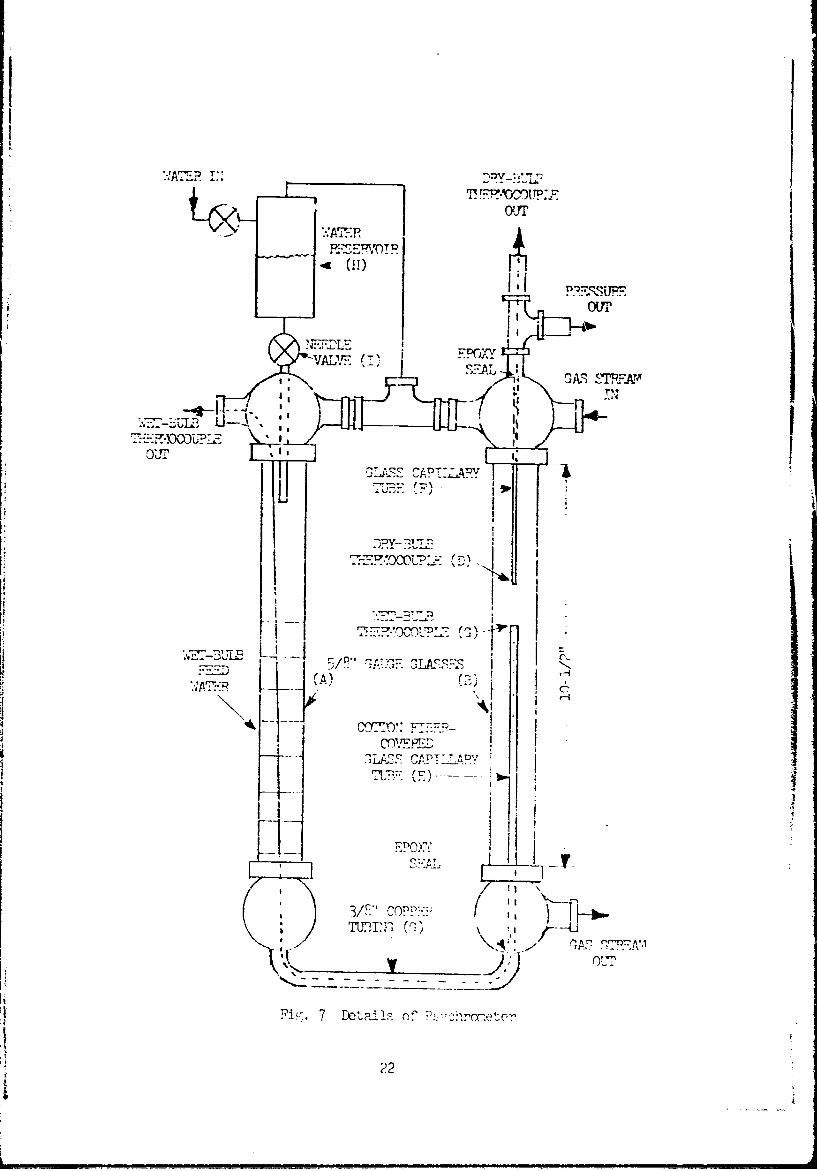
The apparatus shown in Figure 7 eliminated all of the difficulties
and gave reproducible results which were consistent with tnose obtained
in other apparatus.
This appar•atus, which was made frcm 5/8" o.d., approx. 7/16" i.d.
water gauge glass (A and B) and fittings, has a nunber of significant
features: Both the wet- and dry-bulb thermocouples (C and D) are made
fram 30-gauge, fiberglass-covered, copper-constantan wire and are mounted
in fine glass capillary tubes (E and F) made by softening and drawing out
thin-valled glass tubing. The capillary tubes are attached to the brass
fittings with epoxy cement. The wet-bulb thermocouple is covered fram
21
T F
lip
LieI
:J:~L D 7ý 7
TA 4 1"1 ~ ST~X
r~Erwi~c D I
OL7
Fi.oDtarso
22' A'
its tip to the bottan of the gaiz'e glass with a thin sheet of cotton
fibers; and the total d&waeter of the unit is slif.htly -,reater than one-
tenth of an Inch. The wet-bulb therocouple Is oassed th.rot7, the cotton
fiber-covered capillary tube, through the copper tubing (G) connecting
the two sections of gauge glass. and out the too of the feed-water Mrau-e
glass. The glass capillary tube (F) through which the dry-bulb therro-
couple is passed, is comected directly to the pressure-masuring system.
Thus, the measured pressure is actuallv the pressure at the tin of the
dry-bulb thermocouple.
During operation, water is fed to the system continualy fram
reservoir (H) through control valve (I) into gauge glass (A) at a rate
suIrlcient to maintain a level that gives the desired flow to the .et bulb.
The water flows through the comoer tubing (G) and capillary tube (F), out
of the top of the capillary tube, and down the outside of the cotton
fiber-covered capillar:y. The rate of flow is controlled so that the
fibers ame kept covered with water throughout their entire lervth but
without excess water dripping off. However, it was fo-nd that there -cul,'
be a considerable variation in water flow without affecting the wet-bulb
temperature reading.
The water flowing da.n the ftber-covLred surface is cooled hi
evaporation as the gas passes over it. ThiAs, in turn, cools the -'ater
rising through the capillary tube. As a result, thi water is cooled to
practically the wet-bulb tL-perature before it reaches the thel.-ocour•.l.
bead, which is covered at all ti'mes by a thin flim of wate-. Fsurthei.'ore.
since the thermocouple wire and glass capillary are cooled to the wet-
bulb temperature over an appreciable length. there iL no conc",ctfon o'
heat away from the thermocouple bead.
23
S~I
VI. VELOCITY OF GAS OVER Th.P.PE T BBULB
It has been observed (1, 3, 4) that as the velocity of the gas
stream increases the temperature of the wet bulb decreases to a certain
min:Lnum value which is independent of further increase in velocity. This
constant value is the true wet-bulb tem.eratume. Therefore, in using a
wet- and dry-bulb psychrrmeter it is essential that the gas velocity be
high enogph. For the air-water system at 1-atm. pressure, the accepted
mnini:bi required velocity is 6M0 ft. per ,rdn.
For any given gas-liquid system, the minirum required linear velo-
city decreases with pressure. Brooks and Allen (3) reported that this
minnlmun velocity varies inverselv as the square root of the pressure, but
Brown (4), who worked over a much greater pressure range tmhan -rooks and
Allen, found that the minimum required linear velocity varied inversely
with pressure and, therefore, the minimum required mass velocity remained
constant. For the air-water systecm he found the value to be 2,800 lb./
(hr. x sq. ft.), and in his subsequent experimental work he used a mass
velocity of 3,090 lb./(hr. x so.ft.) to have a margin of safety.
Harrison (9) and Kusuda (11), however, claimed that Reynolds num-
ber, DG/u, is the true paraneter. Nevertheless, even if this Is correct,
for a given system the diameter, D, is constant and the viscosity of the
gas, p, is essentially independent of pressure at constant temeerature.
Therefore, the mass velocity, G, like Reynolds nunber, will remain constant
as the pressure is varied. Purthermore, viscosities of gases do not vary
much over the ordinary range of atmospheric temperature; and whether a
Tminimum mass velocity or a minimum Reynolds number is maintained is immnater a1
24
In the present Investigation the mnirrium mass velocity for air and
for helium was found to be approximatelv 3,500 lb./(hr. x sq.ft.). This
coresptds to a Reynolds number of approximately 2,200; and this minimum
value was maintained in all subsequent work with helium.
It is interesting to note that the minimun Reynolds number for
accurate wet-bulb temperature readings corresponds to the transition frcm
viscous to turbulent flow. Therefore, it seems tlhat to insure an accurate
wet-bulb teierature zeading the gas flow must be turbulent.
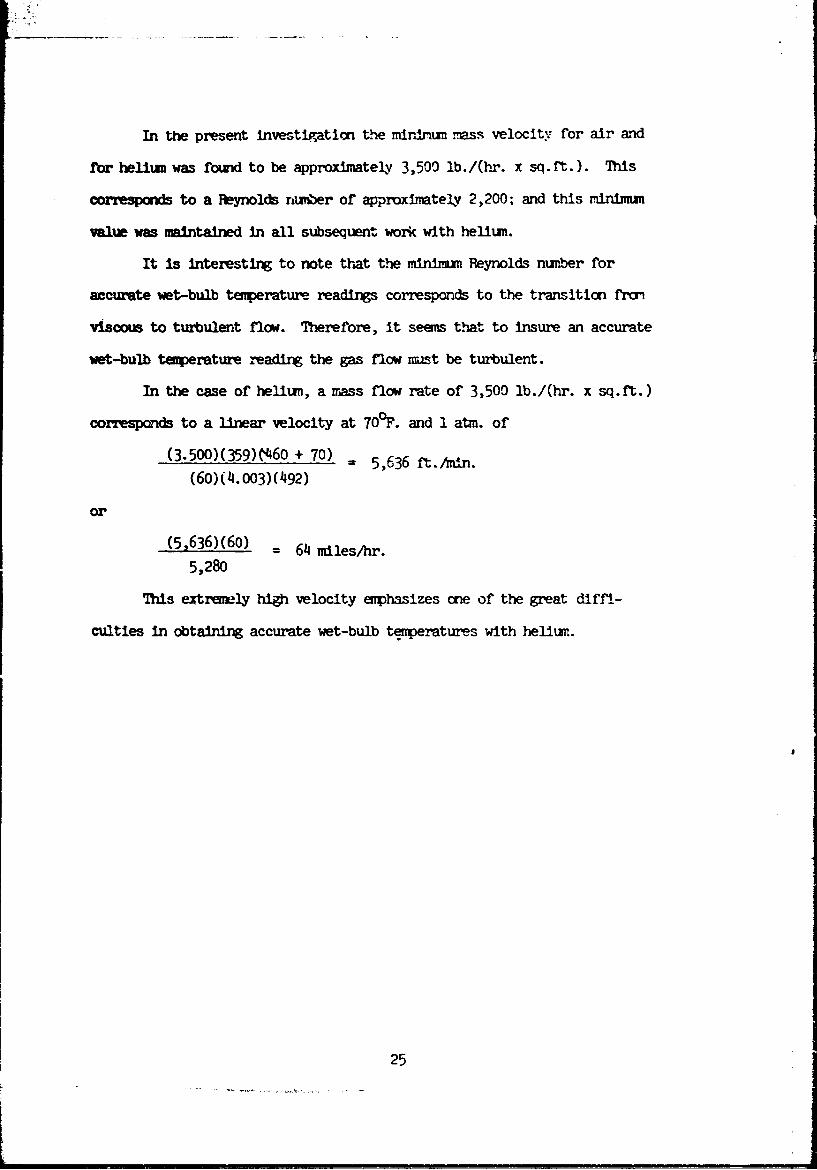
In the case of helium, a mass flow rate of 3,500 lb./(hr. x sq.ft.)
correspcnd to a linear velocity at 70°F. and 1 atm. of
(3.500)(359) M60 + 70) 5In.=5,636 ft./1mn
(60) (4. 003)((492)
or
(5,636)(60) = 64 miles/h.
5,280
This extremely high velocity mphasizes one of the great diffi-
culties in obtaining accurate wet-bulb temperatures with heliun.
25
VII. RESULTS
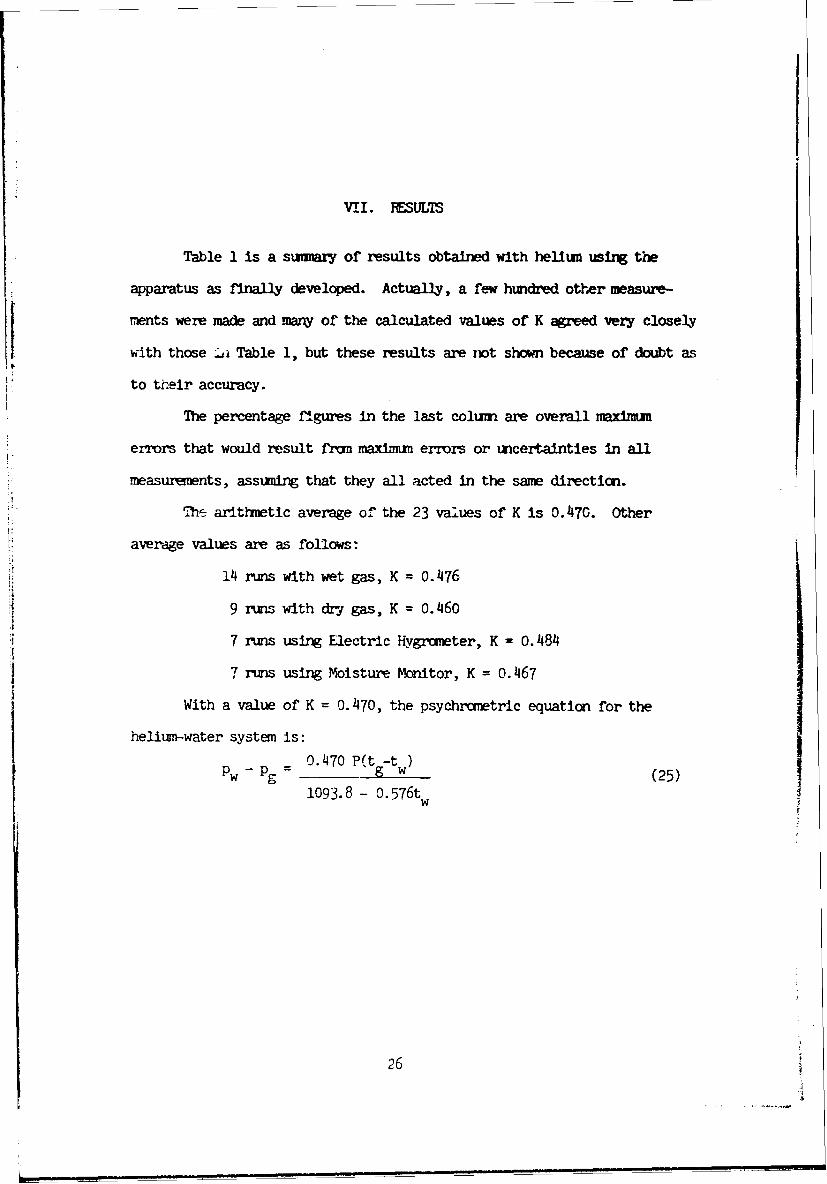
Table I is a sumnax-y of results obtained with helium using the
apparatus as finally developed. Actually, a few hundred other measure-
ments were made and many of the calculated values of K agreed very closely
with those .La Table 1, but these results are rot shown because of doubt as
to their accuracy.
The percentage figures in the last column are overall maxiumn
errors that would result frmn maxiLmum. errors or uncertainties in all
measurxnts, assuming that they all acted in the same direction.
The arithmetic average of the 23 values of K is 0.470. Other
average values are as follows:
14 runs with wet gas, K = 0.476
9 rum with dry gas, K = 0. 460
7 runs using Electric Hygrometer, K = 0.484
7 runs using Moisture Monitor, K = 0.467
With a value of K = 0.1470, the psychrometric equation for the
helium-water system is:
-p Ps 0.1470 P(t -tW (25)1093.8 - 0.576t
6w
26
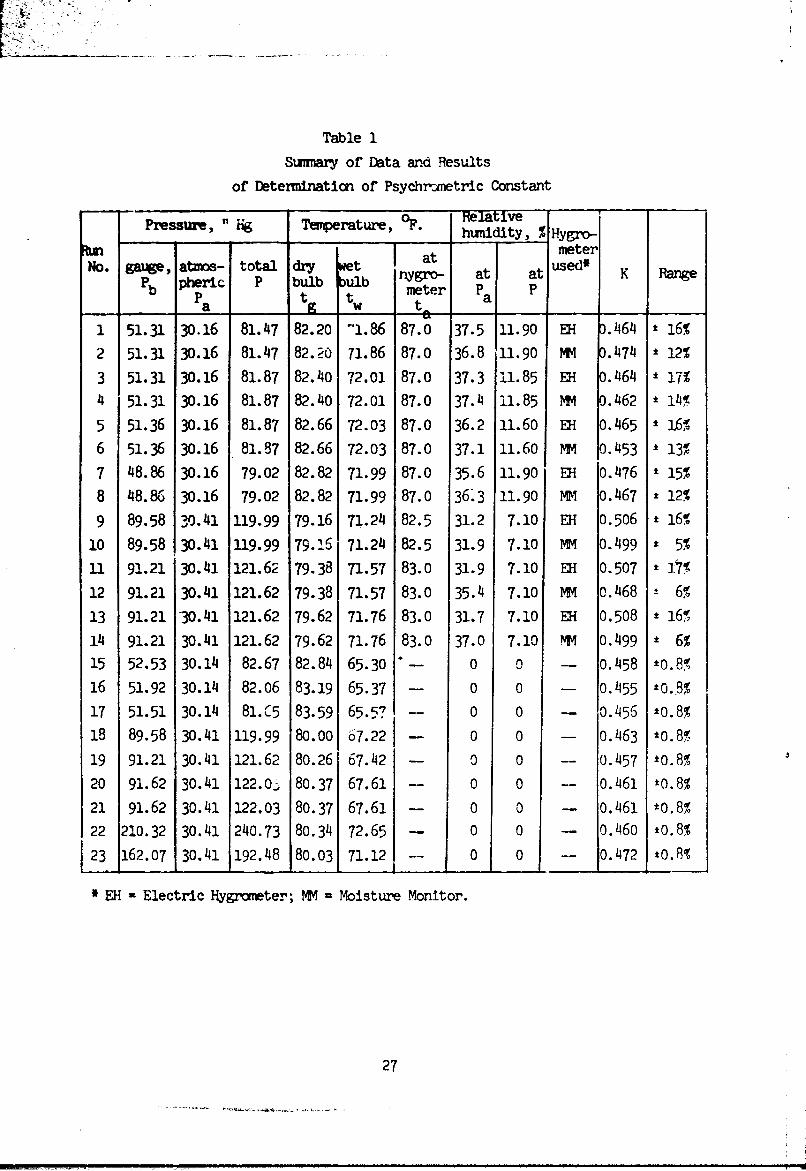
Table I
Sumnary of Data and Results
of Determination of Psychrometric Constant
Pressure, " Temperature, OF. Relative•et huwidity, % Hyg•r-
•tm atmeter
No. gauge, arms- total dry t at usrPb pheric P bulb ulb nygro- at at K Range
- - meter Pa Pa ag tw t1 51.31 30.16 81.47 82.20 -1.86 87.0 37.5 11.90 El 3.464 t 16%
2 51.31 30.16 81.47 82.20 71.86 87.0 36.8 11.90 MM D.474 * 12%
3 51.31 30.16 81.87 82.40 72.01 87.0 37.3 i1.85 EH 0.464 t 17%
4 51.31 30.16 81.87 82.40 72.01 87.0 37.4 11.85 MM o.462 t 14%
5 51.36 30.16 81.87 82.66 72.03 87.0 36.2 11.60 EH 0.465 t 16%
6 51.36 30.16 81.87 82.66 72.03 87.0 37.1 11.60 MM 0.453 13%
7 48.86 30.16 79.02 82.82 71.99 87.0 35.6 11.90 EH 0.476 ± 15%
8 48.86 30.16 79.02 82.82 71.99 87.0 36.3 11.90 MM 0.467 * 12%
9 89.58 3%0.41 119.99 79.16 71.24 82.5 31.2 7.10 EH 0.506 16%
10 89.58 30.41 119.99 79.16 71.24 82.5 31.9 7.10 MM 0.499 t 5%
11 91.21 30.41 121.62 79.38 71.57 83.0 31.9 7.10 EH 0.507 ± J.7%
12 91.21 30.141 121.62 79.38 71.57 83.0 35.14 7.10 MM 0.1468 ± 6%
13 91.21 30.41 121.62 79.62 71.76 83.0 31.7 7.10 EH 0.508 ± 16%
14 91.21 30.41 121.62 79.62 71.76 83.0 37.0 7.10 MM 0.499 ± 6%15 52.53 30.14 82.67 82.84 65.30 "-- 0 0 - 0.458 ±0.8%
16 51.92 30.14 82.06 83.19 65.37 - 0 0 - 0.455 to0.8%
17 51.51 30.14 81.C5 83.59 65.57 0 0 - 0.456 *0.8%
18 89.58 30.41 119.99 80.00 67.22 - 0 0 - 0.463 *0.8%
19 91.21 30.41 121.62 80.26 67.42 - 0 0 -- 0.457 t0.8%
20 91.62 30.41 122.0. 80.37 67.61 -- 0 0 o- 0.461 t0.8%
21 91.62 30.41 122.03 80.37 67.61 -- 0 0 - 0.1461 t0.8%
22 210.32 30.41 240.73 80.34 72.65 - 0 0 -- 0.460 ±0.8%
23 162.07 30.141 192.48 80.03 71.12 -- 0 0 -- 0.472 10.8%
SEH = Electric Hygrometer; MM = Moisture Monitor.
27
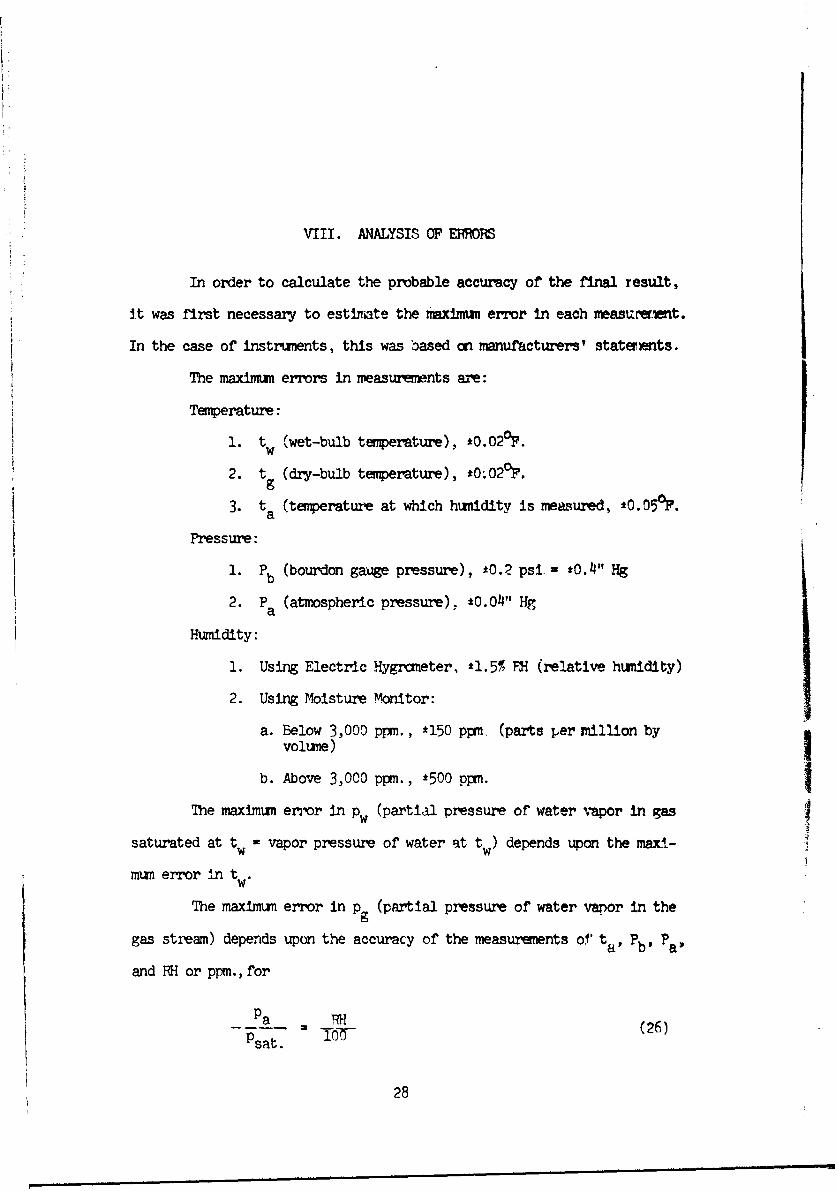
VIII. ANALYSIS OF EBRRRS
In order to calculate the probable accuracy of the final result,
It was first necessary to estimate the maximun error in each measurerent.
In the case of instrwments, this was loased on manufacturers' staterents.
The maximum errors in measurements are:
Temperature:
1. tw (wet-bulb teperature). t0.020P.
2. t (dry-bulb temperature), *0;020F.g
3. ta (temperature at which humidity is measured, t0.050?.
Pressure:
1. Pb (bourdon gauge pressure), ±0.2 psi.- o0.4" Hg
2. P (atmospheric pressure), ±0.04" Hga
Humidity:
1. Using Electric Hygrcmeter, t1.5% FP (relative humidity)
2. Using Moisture Monitor:
a. Below 3,000 ppm., t150 ppm. (parts per million byvolume)
b. Above 3,000 ppm., t500 ppm.
The maximum error in pw (partial pressure of water vrapor in gas
saturated at tw, vapor pressure of water at tw) depends upon the maxi-
mun error in t.w
The maximum error in Pg (partial pressure of water vapor in the
gas stream) depends upon the accuracy of the measurements of ta, Pb' Pa'
and RH or ppm., for
Pa (26)-psat ." 10 2
28
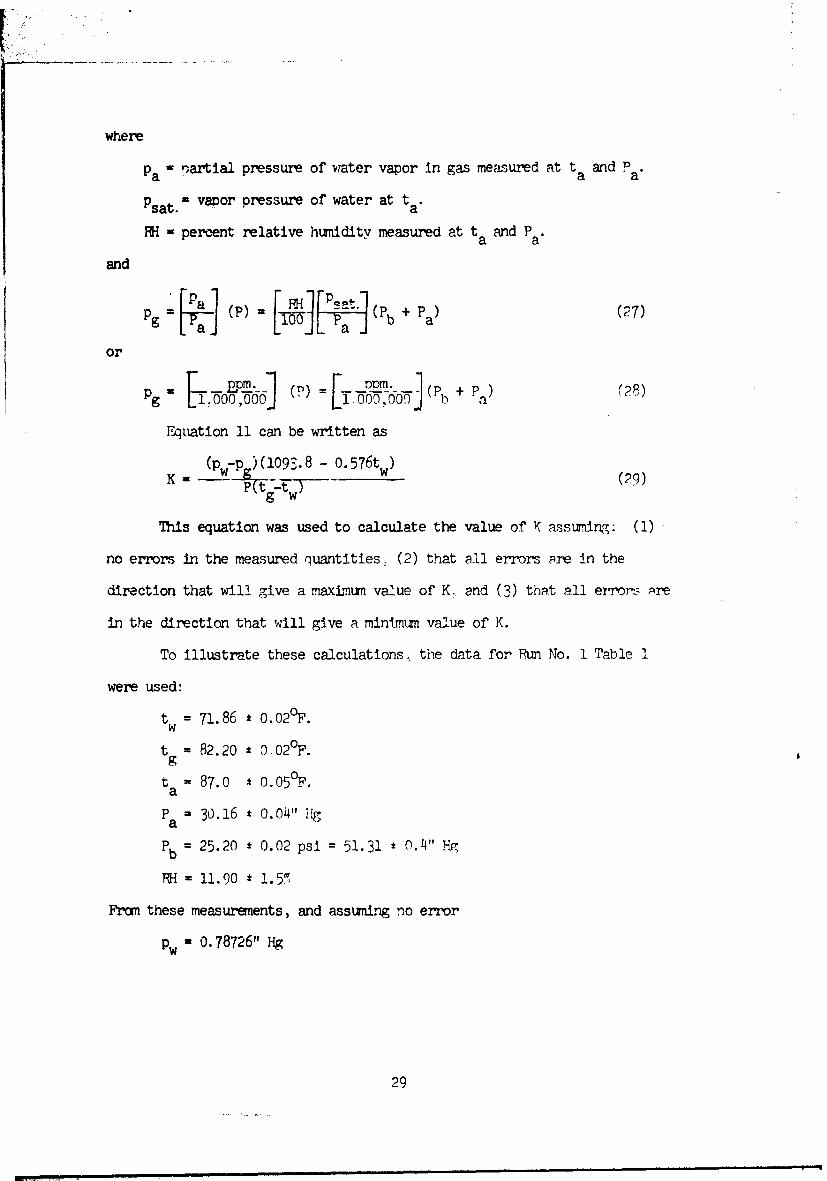
where
Pa= partial pressure of water vapor in gas measured at ta and P a'
Psat.s vapor pressure of water at ta
R= percent relative humidity measured at ta and Pa*
and
Pg (P) [ (Pb + Pa) (27)
or
P9 P L1 -• -J ( = (:O-)0 OO0 (Pb + Pa)
Equation 11 can be written as
(pw-p) (1093. 8 - 0.576tw)K = -- w(29)
g w
This equation was used to calculate the value of K assu.riinr: (1)
no errors in the measured quantities: (2) that all errors are in the
direction that will give a maxinum value of K. and (3) that all eqmo• are
in the direction that will give a minimum value of K.
To illustrate these calculations., the data for RPn No. 1 Table 1
were used:
t = 71.86 , 0.020 F.
t = 82.20 a 0 02°F.g
t = 87.0 0 o.050 F.
P = 30.16 a 0.04" lig
Pb = 25.20 a 0.02 psi = 51.31 t 0.44" H7
RH a 11.90 1 1.5%
Fran these measurements, and assuming no error
Pw- 0.78726" Hg
29
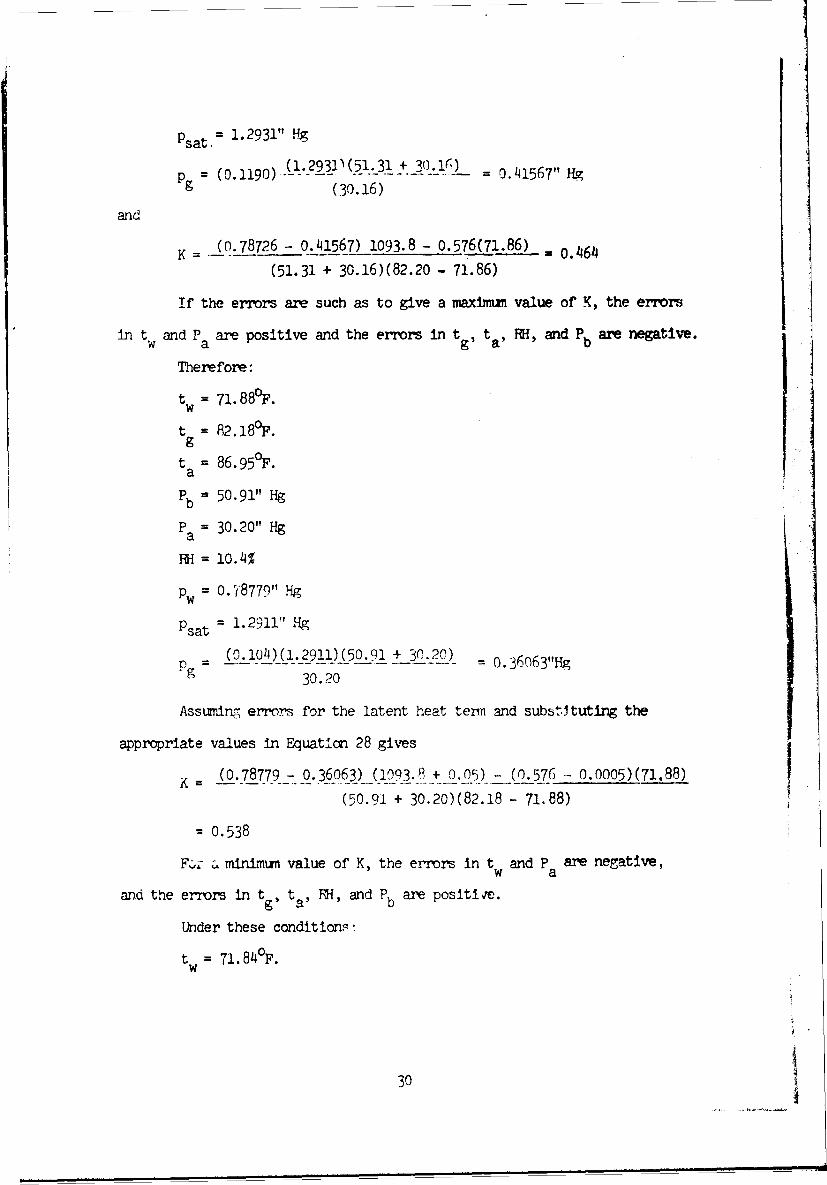
Psat.= 1.2931" HgPg = (0.1190) -(1"2931) (51 _31 + 30.i,) = 0.4156 " Hg
(30.16)
and
K = (0.78726 - 0.41567) 1093.8 - 0.576(71.86) - 0.464
(51.31 + 30.16)(82.20 - 71.86)
If the errors are such as to give a maximum value of K, the errors
in tw and Pa are positive and the errors in tg, t aRH, and Pb are negative.
Therefore:
tw = 71.880F.
t = 82.180F.g
t = 86.950F.
Pb= 50.91" Hg
P = 30.20" Hga
RH = 10.4%
Pw = 0.78779" Hg
Psat = 1. 2911" Hg
(0.104)(l.2911)(50.91 + 30.20) 1.63gg -30.20
Assuming errors for the latent heat term and substItuting the
appropriate values in Equation 28 gives
(o.78779 - 0.36063) (1093.8 + 0.05) - (0.576 - 0.0005)(71.88)(50.91 + 30.20)(82.18 - 71,88)
- 0.538
F&1- .minimun value of K, the errors in t and P are negative,w a
and the errors in tg, ta, RH, and Pb are positime.
Under these conditions :
t= 71.840F.
30
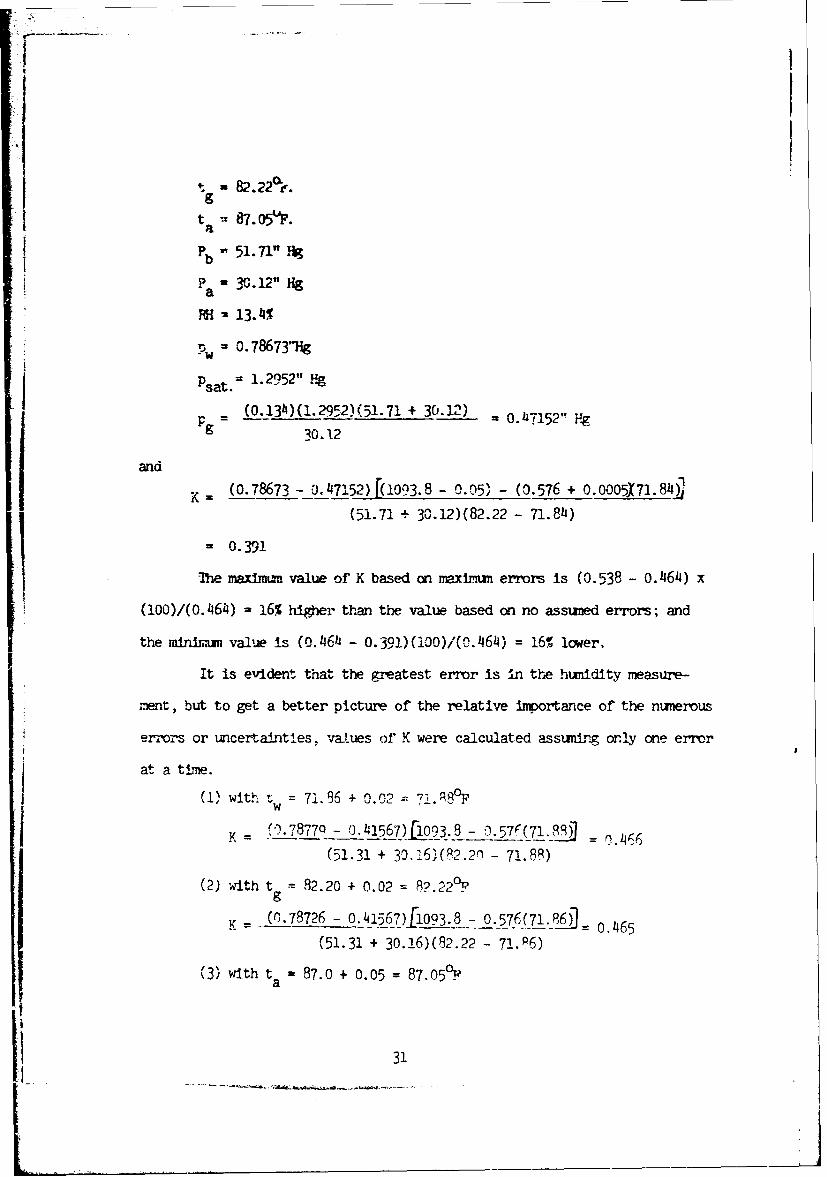
tg=82. 22"ie
ta 87.o5u.aPb 51.n" Hg
p 30.12" Hga
RH 13.14%
pw = 0. 78673"Hg
Psat. = 1.29052" Hgjg = (0.134)(1.2952)(51.71 + 30.12) = 0.)7152" FZ
Pg = 30.1!2
and
K (0.78673 - 0.o47152) [(1093.8 - 0.05) - (0.576 + 0.Q005X71.84,)(51.71 + 30.12)(82.22 - 71.8h)
= 0.391
The maximu= value of K based on meximum errors is (0.538 - 0.464) x
(i00)/(0. 464) = 16% higher than the value based on no assuned errors; and
the minimum value is (0.46h - 0.391)(100)/(0.464) = 16% lower.
It is evident that the greatest error is in the humidity measure-
ment, but to get a better picture of the relative importance of the numerous
errors or uncertainties, v•lues of K were calculated assuming only one error
4 at a time.
(11) with t = 71.86 + 0.02 = 7,.A8°P
"1 78779 - 0.41567)193.-.57€(7189)310= '*7 (1_q9 ... 0.466
(51.31 + 30. -6,(P2.20 - 71.88)
(2) with tg = 82.20 + 0.02 = 8?.220 F(0-872 -0.41567)1U093.8 - 0.576(71.86) 0.465
(51.31 + 30.16)(92.22 - 7!.P6)
(3) with t - 87.0 + 0.05 = 87.05H'a
31
Pg = (0.1190)(1.295 2)(51.31 + 30.16) = 0.41634" Hg9 (30.16)
K = (0.79726- 0.41634) !093.9 - 0.576(71.96 2 463
(51.31 + 30.16)(82.20 - 71.86)
(4) with Pb = 51.31 + 0.4 = 51.71" Hg
pg (0.1190) (1.2931)(51.71 + 30.16) = 0.41771" HF(30.16)
(0.78726 - 0.41771) 13093.8 - 0.576(71.86j = 0.459(51.71 + 30.16)(92.20 - 71.86)
(5) with Pa = 30.16 + 0.04 = 30.20" Hg
pg = (0.1190) (1.2931)(51.31 + 30.20) = 0.41532t Hig
K =(0.7872_6 ;- 0.41532)1093.8 - 0.576(71.86g _ 0.464
(51.31 + 30.20)(82.22 71.6)
(6) with i = 11.90 + 1.5 - 13.40%
pg (0.1340) A!.2931)(51.3' + 30.16) 0.46806" Hg(30.16)
(0.78726 0._46806) U093.8 - 0.576(71.863 0.399(51.31 + 30.16)(82.20 - 71.86)
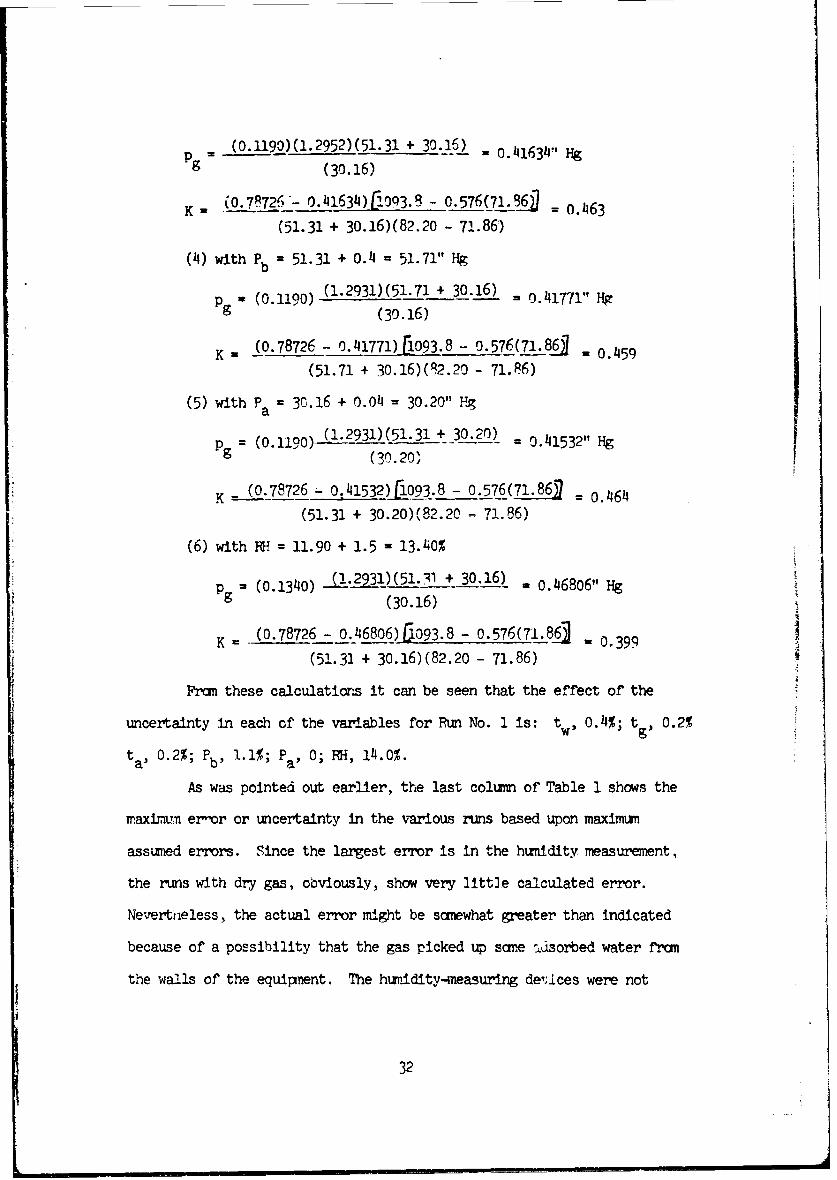
Fran these calculatiorus it can be seen that the effect of the
uncertainty in each of the variables for Run No. 1 is: tw, 0.4%; tg, 0.2%
ta, 0.2%; Pb' 1.1%; Pa' 0; RH, 14.0%.
As was pointed out earlier, the last column of Table 1 shows the
maxii~m', er-,or or uncertainty in the various runs based upon maximum
assuned errors. Since the largest error is in the humidity measurement,
the runs with dry gas, obviously, show very little calculated error.
Nevertlieless, the actual error might be somewhat greater than indicated
because of a possibility that the gas picked up saoe adsorbed water fram
the walls of the equipnent. The hunidity-measuring de,.ices were not
32
sufficiently accurate to rResure this. and an esttmate "muld - nemeanir-
less. Therefore no attelrt was made to account for it in the error
analysis.
Although Table I shows the maxi•rm erryrs thlat m•;ght result unde-
the most unfavorable conditions. Table 2 shows that the actual rariatimos
f'Yxm the average are much sialler, as would be expecte& since the error
in any measurement is not likeky to be the maxiimin and the probablilty is
that scme errors would cancel others.
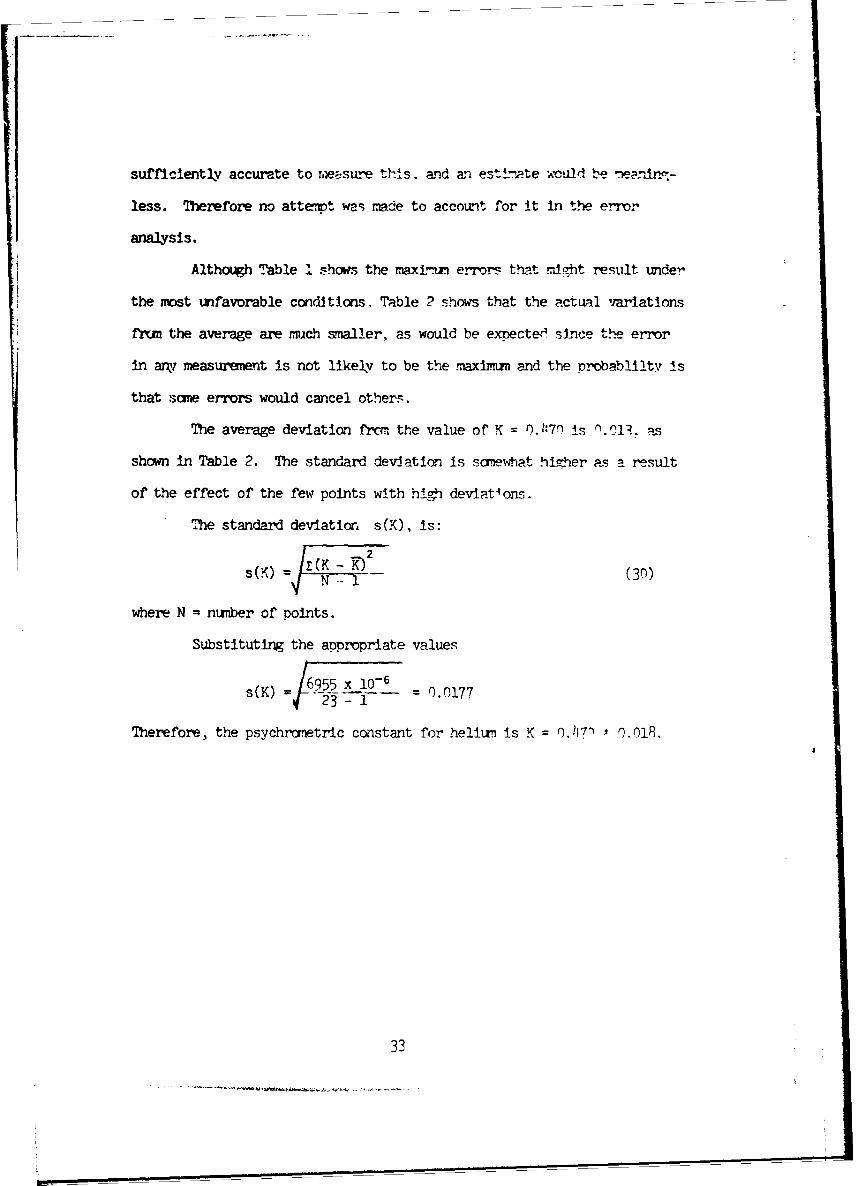
The average deviation firm. the value of K = 0.17) is r1. Ol.as
shown in Table 2. The standard deviation is somewhat hizher as a result
of the effect of the few points with high deviations.
The standard deviation, s(K), is:
s(K) =1•(K7- -)
N- i (30)
where N - nunber of points.
Substituting the appropriate values
s(K = 1- = 0.0177s(K) =F 5ý5(
Therefore, the psychranmetric constant for helim is K = r.47' ) 0.018.
33
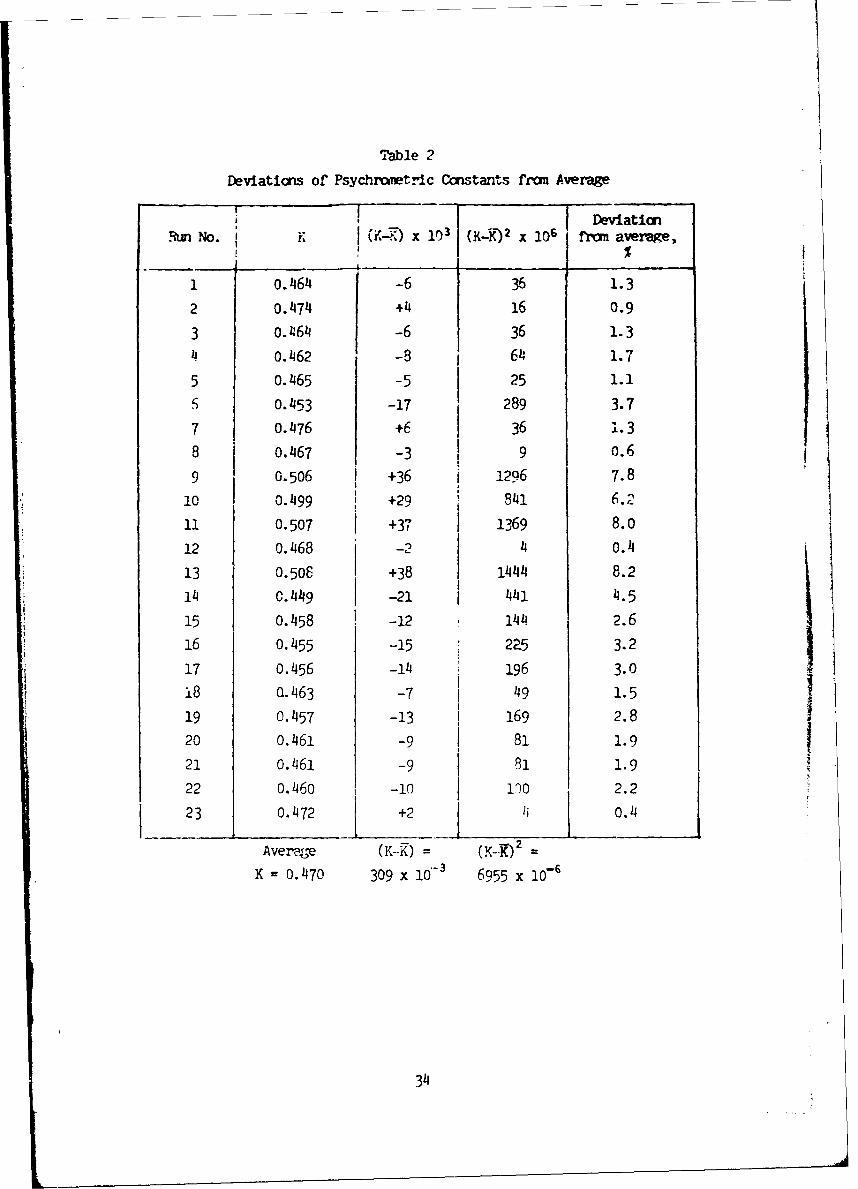
Table 2
Deviations of Psychmnetric Constants from Average
i I Deviation.Run No. K. F (K-') x I03 (y-:K-) 2 x IDS !'m average,
1 o.1464 -6 36 1.3
2 0.1474 +4 16 0.9
3 0.1464 -6 36 1.3
0.462 -8 614 1.7
5 0.1465 -5 25 1.1
5 0.453 -17 289 3.7
7 0.1476 +6 36 1. 3
8 0.467 -3 9 0.6
9 0.506 +36 1 1296 7.8
10 o 0.499 +29 841 6.2
ii 0.507 +37 1369 8.0
12 0.468 -2 4 0.4
13 0.50C +38 1444 8.2
14 C.1449 -21 441 4.5
15 o.1458 -12 144 2.6
16 0.1455 -15 22-5 3.2
17 0.1456 -14 196 3.0
i8 Q.1463 -7 149 1.5
19 0.1457 -13 169 2.82i20 0. 461 -0 81 1. 921 0.461 -9 81 1. 922 0. 460 -10 110 2.2
23 0.472 +24 I 0.4
Average (K--K) - (K-K-) 2 -
K = 0.470 309 x 10'- 6955 x 10-6
34
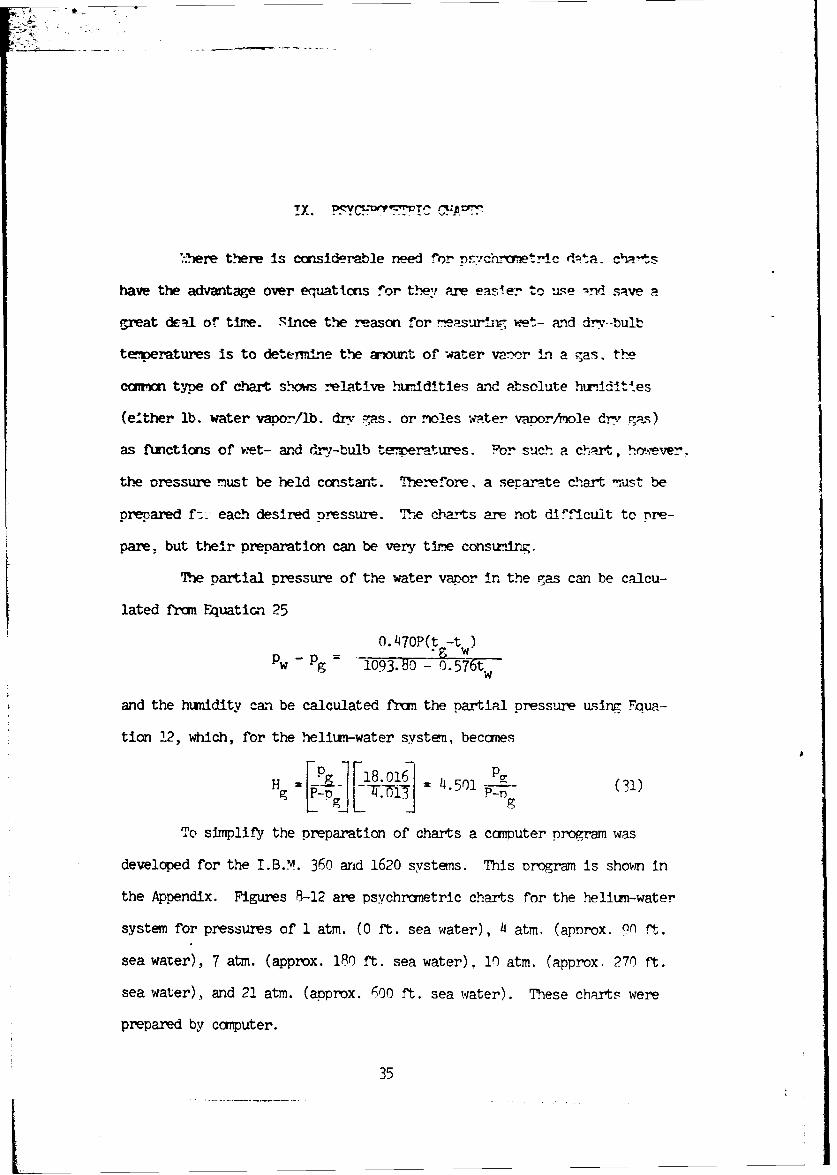
ix. .PFT•__"n'_FTW.Y =C.'CFV..-
-•ere there is considerable need for D•cnhc-ietr-c drta. cha-ts
have the advantage over equations for t6hey are easter to L-e -nd save a
great dEal ofr ti e. .Since the reason for .easurl.-7 wet- and dv--bulb
te-•eatures is to determine the amount of -water va-wor Ln a gas. the
common type of chart s.ms relative htiid!ties and Pbselute hun.ndit1es
(either lb. water vapor/lb. dv -,as. or -toles water vanor/hole d&7., s)
as functions of wet- and d1ry-bulb teC.-eeratures. For such a chart, hymever.
the pressure must be held constant. T_.ne.*refore, a serarste c•hat nust be
orepared fx_ each desired 3ressure. T.he charts are not dirf.icult to iwe-
pare. but their preparation can be very time consur.ng.
The partial pressure of the water vapor In the gras can be calcu-
lated fran Equation 25
0.470P(t -tw)
Pw - P 1093. 0-O.57w
and the humidity can be calculated fran the partial pressure usinr: Fqua-
tion 12, which, for the heliun-water svstLn, becomes
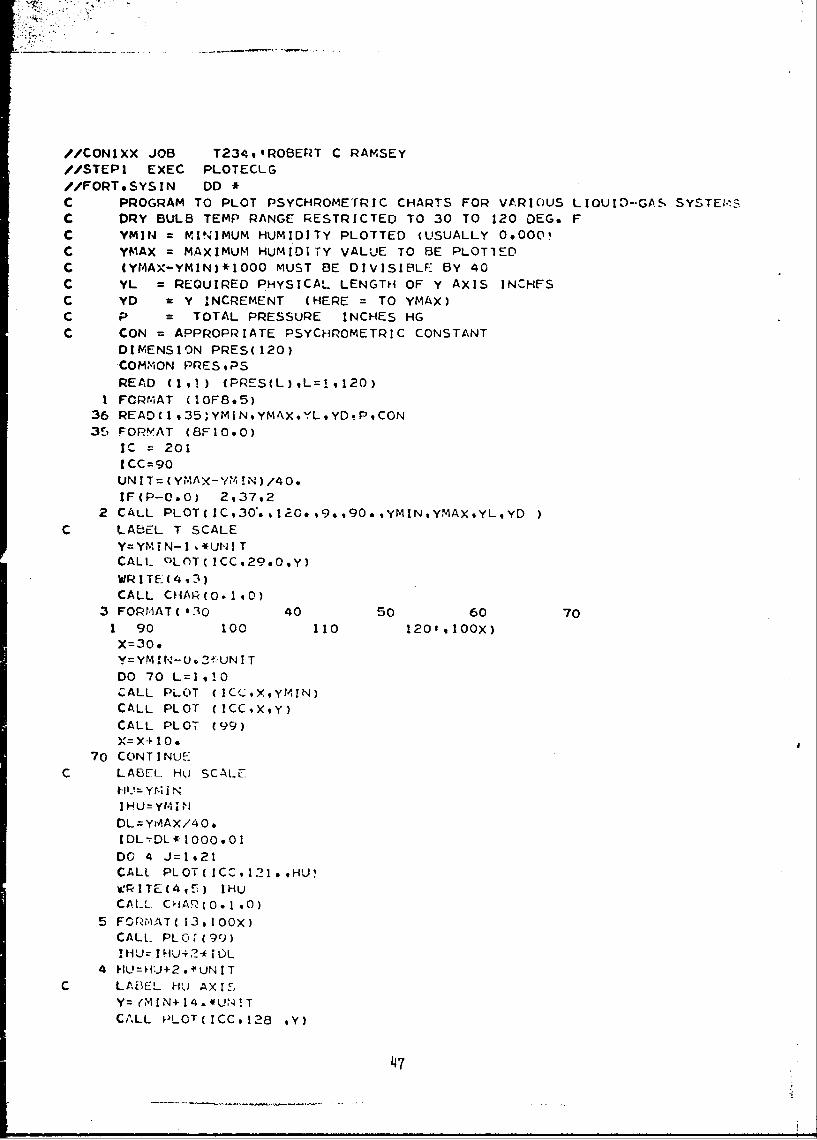
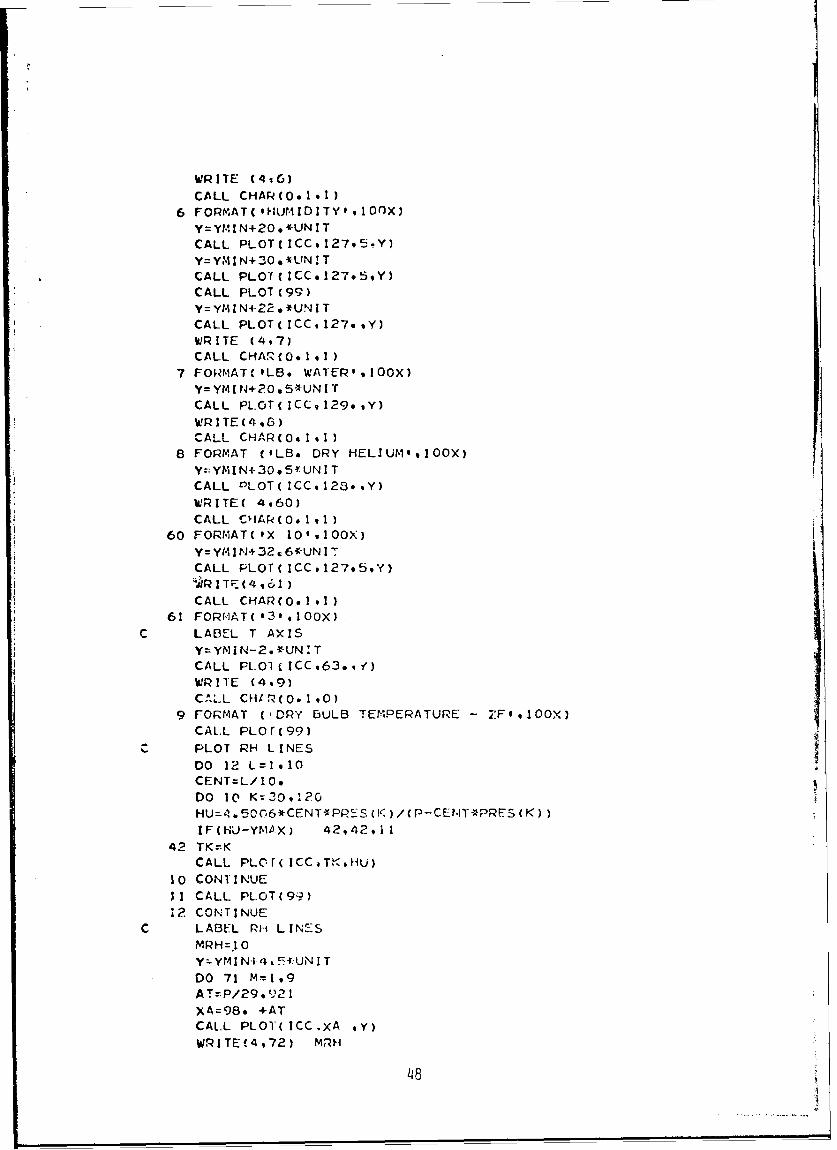
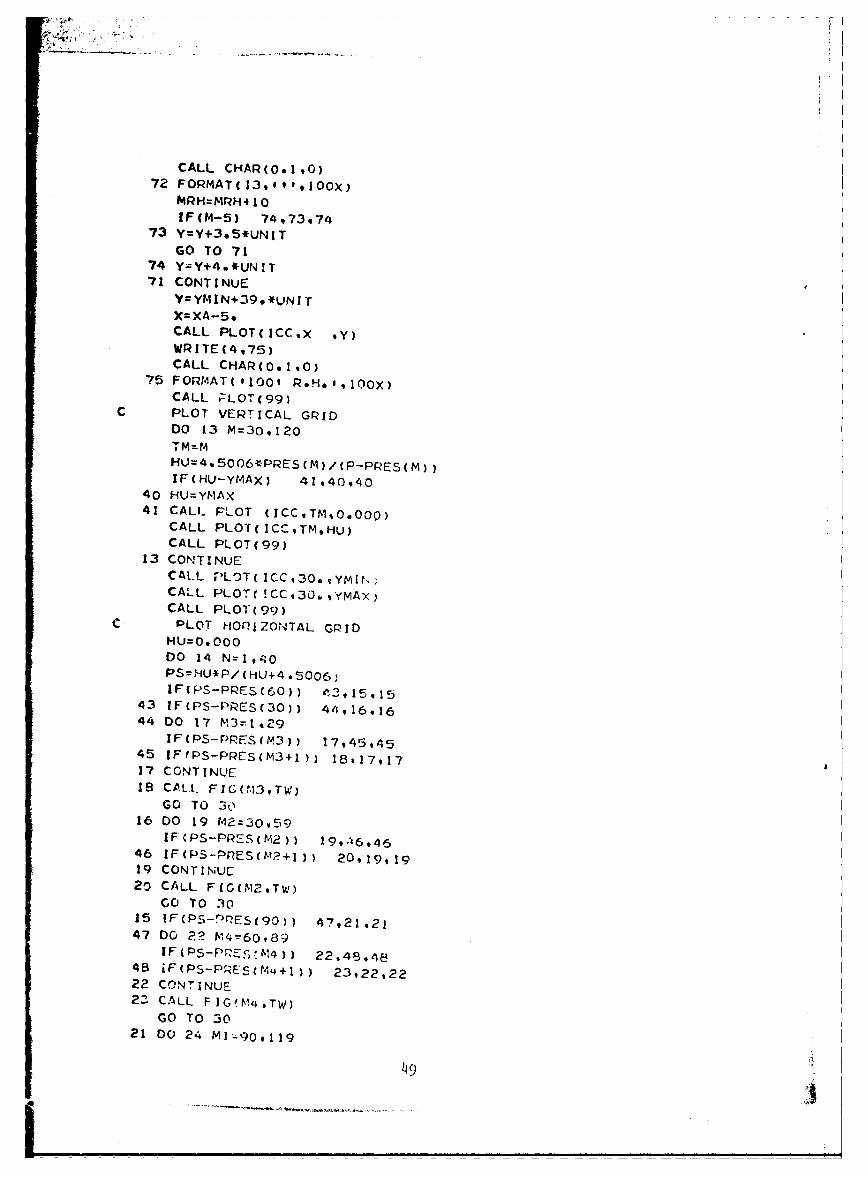
the o~jL -= .501_L] 4lo simplify th reparation of charts a computer program was
developed for the I.B.M. 360 and 1620 systems. This program is shown in
the Appendix. Figures 8-12 are psychrcmetric charts for the helium-water
system for pressures of 1 atm. (0 ft. sea water), 4 atm. (apnrox. (Y) ft.
sea water), 7 atm. (approx. 180 ft. sea water), 10 atm. (approx. 270 ft.
sea water), and 21 atm. (approx. 600 ft. sea water). These charts were
prepared by computer.
35
IF'. NWET Et1JIJOTV L6. OP 'X
I - o tw LO 0 2 W w U cu to a - f: rfJ D 09r UCU 0 IV r, In cu QU 0) N. wD 9 ru 0) w w 1- Ml
CI`2 m~ wU IN CU CU CU .
II
4-4. Ii /I I i
I__ _ _ _ I-~ AI' 1% 4 4
_ Y
141 1
-L6
La
06
-Jw %
gz - 7 Y
U) Ld > 36
10. LIRTERI1L.1[Jb. LB. DRY tliELIUIf 'AI
0 DCu ~ c w Cri UD 21 ci W ti m C3 0 D ej -1 crw La. to~ in I.D 2L f l - 2- e- m C) fl) cu Cdi ca
00- I I-
rLJ
Lic- cr:A
-t-
Li m.J C O I JC-
V x m
Li-T____________ ' L*1
m ce-__-I_
I j U)37
U * t--ltjs. i.-.A ,* V)$'~- -
LO. URTERltut1oIQITY LB. DRY tIELIUfl x 103
Go ~~ LD 1 fu a m w au oh CD W 3, cu 0
2- m m m en M 0c7Nf I
CT3~
crcc
C138t~r uj
M~tiLOI. UPIEIR --- x 03-L.DRY ii(LI-fl
crC)
~i
LI)
U) )
CL - - m co~
[ ~~~c CE Cl . ___________________________________________
LB. DRY HEfJQ
u S c 0 (D W :r ciJ 0 M~ WD~ ~
_ _ _ _ cu u
LiL
Li
ILJ~
'r LO J
"r Lip)
CID0zr
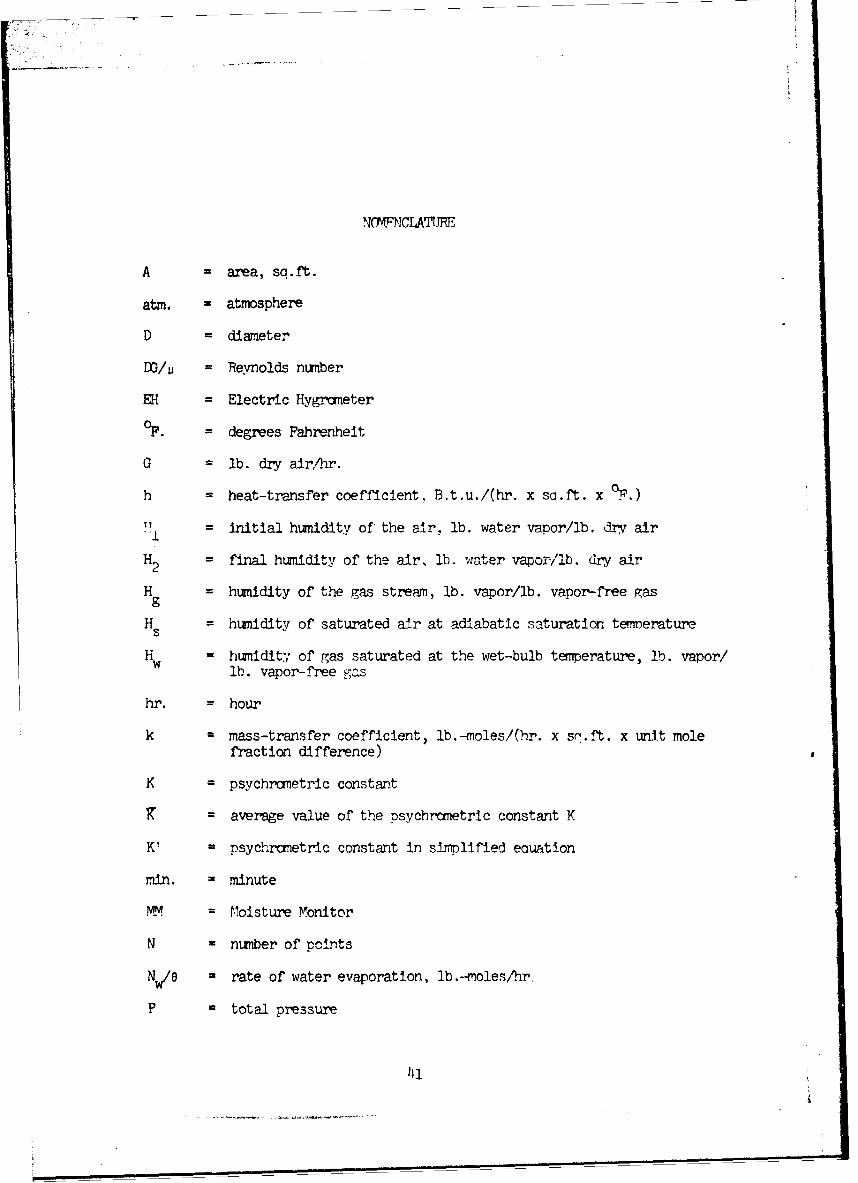
NOWPI'CLATURE
A = area, sq.ft.
atm. = atmosphere
D = diameter
DG/U = Reynolds number
EH = Electric Hygrometer
'F. = degrees Fahrenheit
G = lb. dry air/hr.
h = heat-transfer coefficient, B.t.u./(hr. x sa.ft. x oF.)
= initial humidity of the air, lb. water vapor/lb. dry air
H = final humidity of the air, lb. Wvater vapor/lb. dry air2
H = humidity of the gas stream, lb. vapor/lb. vapor-free gasg
H = humidity of saturated air at adiabatic saturation temoeratures
H = humidity of gas saturated at the wet-bulb temperature, lb. vapor/lb. vapor-free gas
hr. = hour
k mass-transfer coefficient, lb.-moles/(hr. x sp'.ft. x unit molefraction difference)
K = psychrometric constant
x average value of the psychrcmetric constant K
K = psychrcmetric constant in simplified eauation
min. = minute
MM = Moisture Monitor
N = number of points
NOi - rate of water evaporation, lb.-moles/hr.
P = total pressure
•Ii 1
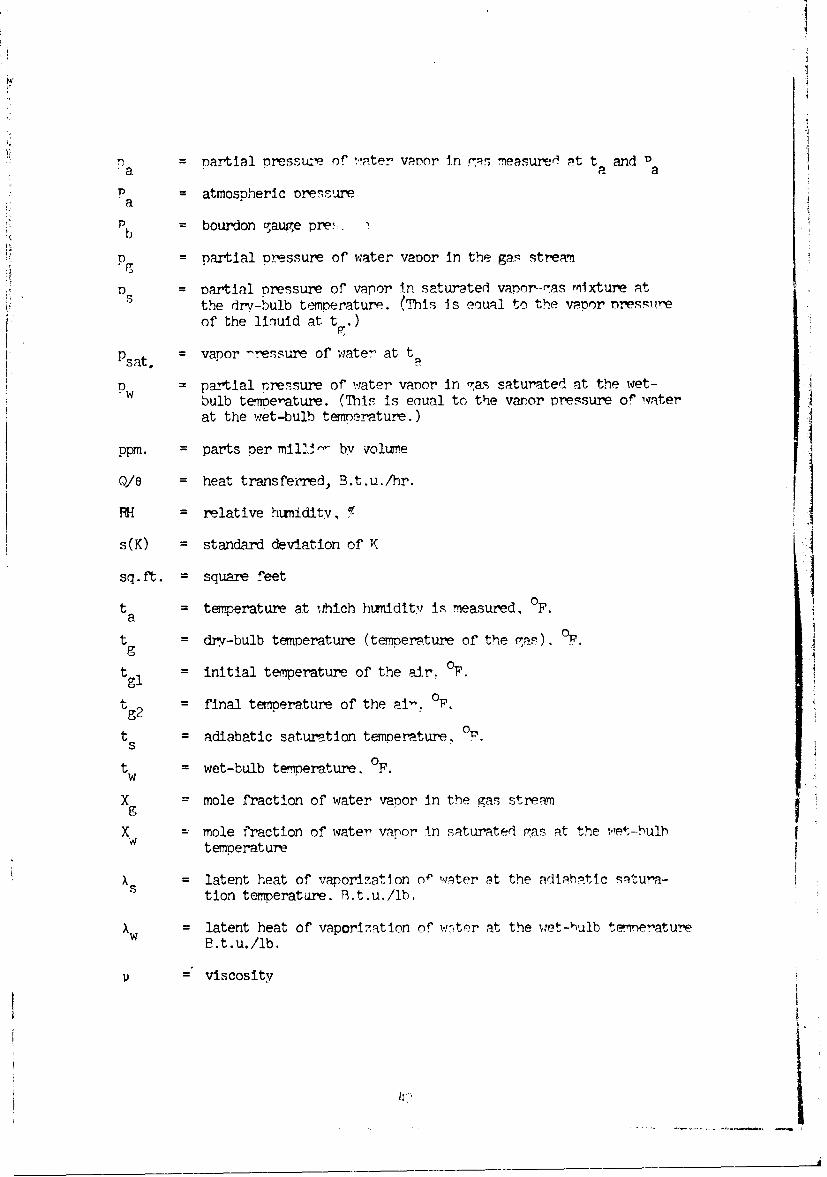
a nartial pressure of water vaDor in • measureer nt t and"8a a1
P atmospheric oreisurea
Pb bourdon c.auge pre-!.b
Po = partial pressure of water vapor in the gas stream
= partial oressure of vapor In saturated vanoro-ras miixture atthe dr•,-bulb temperature.. (This is eaual to the vwoor nres!,uieof the liiuid at t..)
Psat, = vapor -re.-sure of water at t= partial rressure of water vanor in -as saturated at the wet-
bulb temoe-ature. (This is eaual to the vanor pre-ssure of waterat the wet-bulb temnerature.)
ppm. = parts per mill!'- by volune
0/0 = heat transferred, B.t.u./hr.
R = relative humidity, • [!
s(K) = standard deviation of K
sq.ft. = square feet
t = temperature at vhich humidity is measured, OF.a
t = drv-bulb temperature (temperature of the gas). P.g
tgjl = initial temperature of the air. °F,
tg2 = final temperature of the ai-. °P,
t = adiabatic saturation temperature., Ps
t = wet-bulb temperature. OF.w
X = mole fraction of water vapor in the gas stream
X W ' mole fraction of water vapor In satunated pas at the wet-bulbtemperature
= latent heat of vaporization of witer Pt the adiabatic situra-tion temperature. B.t.u./lb.
S= latent heat of vaporization of w-, ter at the wet-bulb temnerature
B.t.u./lb.
= viscosity
11p
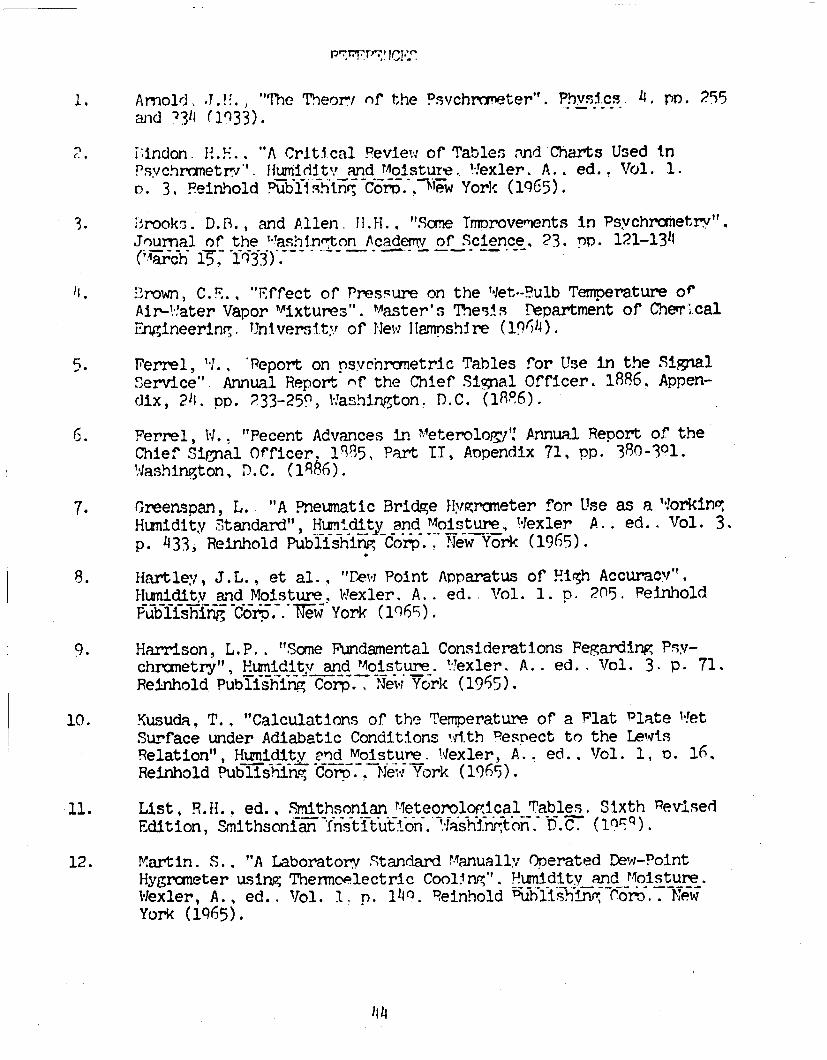
pr-7PI IC:F.I.7
1. Arnold. .!F.., "The Theor' of the Psvchrar-eter". Phvyj.ics 14, PT. 255wad 3311 (133).
. ilndon. H.!".. A Critcal Revie. of Tables qnd Charts Used in1,io j. 1. H AC Ica eit
Psychrametr-'". lftunidltv and M~oisture, .'exier. A.. ed. Vol. 1.n. 3, Reinhold ,ubll.htnrCorp.. -- ew York (1q65).
3. Brook.,. D.B., and Allen. 1.H., "Some Twmprovements in Psychrometrv".
Journal of the 1.ashin•rton Acadewv of Science., 23. np. 121-1311
j. Btrown, C.F., "Effect of Pressure on the Wet-Pulb Temperature ofAir-.'fater Vapor M•ixtures". Master's Thesis Department of Che'rrcalFngineering. TUnlversItv ofI New 11amnshire (196/4).
5. Perrel, W., *Peport on psvchranetric Tables for Use in the SignalService" Annual Report nf the Chief Signal Officer. 1886. Appen-dix, 211, pp. 233-259, Washington. D.C. (1A96).
6. Ferrel, W.. "Pecent Advances in NeterololJ" Annual Report or theChief Sipnal Officer. qI15, Part IT, Anpendix 71, pp. 380-301.W:ashington, D.C. (18•6).
7. Greenspan, L. "A Pneunatic Bridge yImrcmeter for Use as a ':forkinoHunidity Standard", Hidity and Moisture, Wexler A.. ed.. Vol. 3.p. 433, Reinhold Publishing, Corp. New York (1969).
8. Hartley, J.L., et al., "Tew Point Apparatus of High Accuracy".Humidity and Moisture. Wexler. A.. ed. Vol. 1. p. 205. FeinholdPub-lishing, "Cr.-. w York (1065).
9. Harrison, L.P.. "Some Fundamental Considerations PegardIrnv Psv-chrometry", Hutndity and Moisture. Wexler. A.. ed.. Vol. 3. P. 71.Reinhold Publishing Corp.. New York (1965).
10. Kusuda. T., "Calculations of the Temperature of a Plat Plate W.etSurface under Adiabatic Conditions with vesnect to the LewisRelation", Hfikdlity ond Moisture. Wexler, A.. ed.. Vol. 1, o. 16,Reinhold Publishing Coro..-New Y-rk (1965).
11. List, R.Hf.. ed., Smithsonian Meteoro1oo.ical Tables. Sixth PevisedEdition, Smithsonian-nsti-t'uton. 'as-hnton. D.). (10c,).
12. Martin, S.. "A Laboratory Standard .anually: Operated Dew-PointHygrometer using Thennoelectric Cool1ng,". Humidity and Moisture.Wexler, A., ed.. Vol. 1. p. 1110. Reinhold Oublishinm, Coro.. NewYork (1Q65).
44
S' • ~ j
13. Monteith. J.L., *Error and Accuricv in Tnermocouple Psychrayet-v,Proceedqngs of the Phvsical Society London Vol. 67, 3-B, p. 217,
i4. Wentzel, J.D., "An Instrument for the Measurement of the Humidityof Air", ASHRAE Journral_, 3, p. 67 (November 1961).
15. Wexler, A., et al., "The NBS Standard Hygrc-etry". Hniiidity andMoisture, Wexler, A., ed., Vol. 3, pp. 389, 539-656, -ei-61iPublishing Corp., New York (1965).
16. Wylie, R.H., et al., "The Basic Process of the Dew-Point Hygro-meter", Humikdity and Moisture. Wexler, A.. ed.. Vol. 1, p. 125,Reinhold Publishing Corn.. New York (1965).
L7. Zimmerman, O.T., and Lavine, I., "Psychrometric Tables and Charts".2nd edition, Industrial Pesearch Service Inc.. Dover. N.11. (lQ64).
!15

APPEnDIX
4
//CONIXX JOB T234,.ROBERT C RAMSEY//STEP1 EXEC PLOTECLG//FORT.SYSIN DD *
C PROGRAM TO PLOT PSYCHROMETRIC CHARTS FOR VARIOUS LIQUID-GAS SYSTEr.zS
C DRY BULB TEMP RANGE RESTRICTED TO 30 TO 120 DEG. FC YMIN = MINIMUM HUMIDITY PLOTTED (USUALLY 0.000'C YMAX = MAXIMUM HUMIDITY VALUE TO BE PLOTIEDC (YMAX-YMIN)*I000 MUST BE DIVISIBLE BY 40C YL = REOUIRED PHYSICAL LENGTH OF Y AXIS INCHFSC YD = Y INCREMENT (HERE = TO YMAX)C P = TOTAL PRESSURE INCHES HGC CON = APPROPRIATE PSYCHROMETRIC CONSTANT
DIMENSION PRES(120)COMMON PRESPS
READ (1,1) (PRES(L),L=1,120)
I FORMAT (IOF8.5)36 READ(1,35;YMINYMAXYLYDiP,CON35 FOP.AT (8F!0,0)
IC = 201ICC=90UNIT=(YMAX-YM !N)/40,IF(P-O0,) 2937,2
2 CALL PLOT(IC,30",,120.,9,,90 0,YMINYMAXYLYD
C LABEL T SCALEY=YMiN- I ,-*UNI TCALL uL0T(ICC,29o,0Y)
WRITE(4,3)CALL CHAR(O,1,O)
3 FORMATC#O3 40 50 60 70
1 90 100 110 1201,lOOX)X=300Y= YM I r-U0 3ý UN I T
DO 70 L=z,!OCALL PLOT (ICC,X,YMIN)CALL PLOT (ICCXY)
CALL PLOT (99)X=X+ 10.
70 CONTINUEC LAEL-. Hu' SCALE
Ht-I.= yMI iN
I HU= YM A NDL=YMAX/40,IDL-DL* 1000601
DO 4 J=1,21CALL PLOT(ICC,121,,HU%W.•I TE (4q,-) IHU
CALL CHA(0.l.0)5 F0RMAT(13,IO0X)
CALL PLO f (99)!HU= IHU42- IOL
4 HUH=J+2. * UN I TC LABEL H.) AXIS
Y= (M I N+ 14. *UN! TCALL P)LOT(ICC,128 ,y)
47
WRITE (416)CALL CHAP(Oolol)
6 FORMAT C HUtiIDITY., lO0X)y=YMIN+20**UN ITCALL PLOTCICC9127o~iY)Y=YM4IN+30 **UN ITCALL PLOf(ICCo127*59Y)CALL PLOT(99)Y=Y?-IN4r22.*U-NITCALL PLOTCICC912799Y)WRITE (497)CALL CRA!R(0.1,I)
7 FORMAT('LB * WATER',vlIOOX)Y=Ymir4+20.5*uNI T
CALL PL.OT(ICC9129*9Y)WPITE(4 ,&)CALL CHARCO.1,1)
8 FORMAT COL.Bo DRY HELlUmo*100X)Yr:YMINA-3095*UNI TCALL 0LOT(ICCsI23.,Y)WRITE( 4,60)
CALL CIAk(0#191)60 FORMATC'X 1O'.100X)
Y=Yi4IN+32c6*UN 1 7CALL PLO'TCICC#127*S,Y)
CALL CHARCO..1.1)61 FORIrIAT'139o100X)
C LABEL T AXISY:-YMIN-2. *UN:TCALL PL-01( ICC963. ,y)WPITE (4%9)C!,LL CHifRCO.IqO)
9 FOfRMAT ('DRY BULB TEMPERATURE - 'F',10OOXCAL.L PLor(99)
c PLOT RH LINES
D0 12 L=1.1OCENT=L/109DO 1C' K=309120HUm. 5006*CENT*PP'S (K)/(P-CENT*PRTS (K))IFCHU-YMJAX) 42,42,11
42 TK=KCALL PLOf( I CC*T1,To Hu)
10 CONTINUE11 CALL PLOT(9ý?)12 CONTINUE
C LABEL PH LINESMRH=JOY:-YMI N-q1 t.F- KUN I TDO 71 M=199ATrP/29*92 1XA=98o +ATCALL PLOT( ICC XA q Y)WRITE(4,72) MPH
48i
CALL CHAP(0*1,O,72 FORMATCI3v..'.oO00X
P4RH=MRH4 10IF(M-5) 749739741
73 Y=Y+3*5*UNIT
GO TO 7174 Y=Y+4.*UNIT71 CONTINUE
Y:lYMIN+39.**JNITJX=XA-5*CALL PLOTCICC,X %Y)WRITE(4*75)CALL CHAR(0.1,O)
75 FORMATC.1001 ReH*1,100X)CALL ;:LOTC99)
C PLOT VERTICAL GRIDD0 13 M=30,120
HU=A 5 006*PRESCM)/(P...PPES(M))IF(HU-YMAX) 41940940
40 HU=YMAX41 CALL PLOT (ICCoTMO.0oo,
CALL PLOTcICCTMHU,CALL PL01c99)
13 CONTINUECALL "LOT( ICCi30s vYMINkCALL PLOT( !CC,30.,1YMAX,CALL PLOT (99)
c PLOT HVIOIZ0NTAL GRIDHU=0, 000DO 14 N=I#,4'PS=HU*P/ (HU+4 .5006!IF(PS-PRESc6o)) 0,3915,15
43 IF(PS-PRES(30)) 449,16q1644 D0 17 M3=1*29
IF(PS-PRES(M3,) 17,4594545 IF(PS-PPES(M3+1)) 18*1791717 CONTINUE18 CALL. F I G-013 # W,
GO TO 3016 DO 19 M2=30V59
IFWS5-PPEScM2)) 199,'6*4646 IF(P5-PRES(M2+1,, 20919,1919 CONTINUC20 CALL FIG(M29TW)
Go To 3015 1F(PS-PQrE~t9o,) 47,21,2147 DO, P? M4=60t89
48 iF(P5-P.Esc(m4+1)) 23,22,2222 CONTINUE231 CALL FIGII'M4,TW)
GO TO 3021 00 24 M1-.qO,119
49I
WFPS-pprý5SMW) 24,49,4949 1 F(PS-TRES(04!+ 1) 25924,24
24 CON !,NUE25 CALL FIG (MlTW)
GO TO 30
30 1 F-(TVf-.30.@O) 50955955
50 TW=30oo55 CALL PLOT (ICCs120siHU)
CALL PLOT (ICCsTvislU)CALL PLOT(99)HU = HU-4UNIT
14 CONTiNUE
CALL. PLOT (ICC9l20oYMAX)
CALL PLOT (ICC,30.,yMAX)KCtL: PLOT(99)
C PLOT wB LINES
WRITE (39DO)38 FOR)MAT ~2OXPLOTT ING WET BU'LB LINES *99* *
KOLJNT -2DO 26 NTW=30*120,2KOUNT=KOUNT+2
28 TW=NI-WHLU4 o50064PPES (Nl W P'-pPEScNTw))IF (HU-'YuAx )53,53,52
53 fWjU-HLUCALL PLoT cC!CCTwHu)
DO 29 JJ=1441
IFCHu-0*00) 31,62,6262 PSD=HU*-P/ 0 U+4 o5006)
TDB=TW+(lO9368-0.576*Tw)*(PF<EýS(NTW)--PSD)/(CON *p)
1FCTD6;-!20 2 54.31,31U54 CALL PLOT ( ICC, TDB,H-U)
MU=HvJ-UN i T29 C 0N T1NU E
31 CALL PL.OT (99)I I=NT~.!I F (I I-9J) 76,76,26
76 IFC(KOUN' -10) 26.27,2626 CONT INuE,
C WRITE WET 6ULL TEkrP ZFY=YMIN-1 5.:J*U-NI TCALL PLOI(ICCi&r0.7.y)WRITE (4977)CALL CHAR(O.1*0)
77 FORMAT('WT'lOl~0X,
Y=YMIrN+I7.3*UNI TCALL PLcY7CICC,64o79Y)
WRI1TE (4 ,783CALL CHARý,o I,O)
78 FCR~MA-(ic1J!A3,&oGx)
CALL. ri'LOT (I CC,70 4 y)
6R I TE C4s,79)
50
CALL CH'ARC0.IO)79 FOR1MATCOTEMP*0,100X)
Y=YM1N420**UNITCALL Pl-OT(ICCv7'4.7oY)WRITE (4980)CALL CHAR(O.1*O)
so FORMAT(lZFlvIOOX)CALL PLOT (99)
C WPITE NAME PLATEy=YMItN+24q 5*UNITCALL PLOT(ICC,3lo5tY)CALL PLOTcICC98Ci.5,%V)Y=YMIN+36**UNITCALL PLOT(ICC,80.5,Y)CAL'- PLOT(YCC931*5tY)Y= YA IN4-24 o 5*UNI TCALL PLOTCICC931*5,Y)CALL PLOT(99)Y=YM IN.4-2"* q5*UN I TCALL PLOTU(CC*938,5%Y)bJRITE(4*81)CALL CHAIR(0*190)
81 FORMAT('SLOPED LINES WET BULB TEMP. L-iNESlIO0X)
Y=YhIN+27o5*UNITCALL PLOr(ICC941*5,Y)gR ITE(4 ,C2)
CALL CHA,-(0o.It)82 FOR1MAT.'e LINES = RELATIVE HUI-ArrTTY',%1OX)
I AT:±P/29, 9205IFT=( TAT-I )*30Y=YMIN+20.5*UN1TCALL PLOT (ICCq4l.,Y)
WRIrEC4,E33) IFTCnLL CVHA7ZO.1,O)
83 FORIAAT( rAPPPOXIMATELY 1%1394 FT. SEAW,,ATER' l.,-OXlyYMYIN+2C).5*IJNI TCALL PLO':( ICCo39* o )WRITE (4184) TATCALL CHARO.I90)
64 F0FZ!,T( 'ABSOLUTE PRESSI)RE - 14130' ATMOSPl:::RQES' I OX)Y=YM'IN+3Oo5*UNI TCALL PLOT(ICC,4495,Y)WRITE (4vSS)CALL CHAR(Oo1,O)
85 FORIIATC 'HELiUM - WATER SYSTE-M1,1OOX)Y=.YMIN4-32*5*UN!TTCALL PLOTC(ICCv35ssY)WP I TE(4 106)CALL CHAP(Oa?2,O)
86 FORMiAT ( IPZYC. 0ROMET;U C. CHART* 9 1 OO IYr; (1-11N-2 96*UNI T
CALL F*LOrI-(CC,23.6.YlC ALL PLO'. CI CC i'.33 v4 4Y)VYY Yr-!IN+~42.6*UNi F
CALL PLOT(ICC1 133*4oYY)CALL PLOTCICC*2:3*6sYY)CALL PLO'TCICC*23o6oY)CALL PLOT(99)GO TO 34
C, LABEL WET BULB LINES27 X=TW-2o
Y=HUU+1.*UNITCALL PLOT(ICCoX*Y)WRITE(4433) II
F ~CALL CHAR (0. 1,0)35 FOPMAT(13,1O0X)
CALL PLOT(99)XX=TW-095YY=H1UU+0*4f*UNICCALL PLOT(ICC,TW,HUV)CALL PL0T(ICC,XX,,yy:CALL PLOTc99)KOUNT=0GO TO26
34 CALL PLOT(7)GO TO 36
37 CALL PLOTC 100)STOPENDSUB3ROUTINE FIG(MMiTW)DIMENSION~ PRES( 120)COMMON P7-ESiPSTW=MM,DEL=ýPS-PRESMMi~))/(PRES(MM+1)FPRES(MM),TW= TW+OELjiRET URN
EN5D
0
0
Oo-4ro-oa'u-N 0@0* *eoremo n 0
O04m-MOM00000
1 0MOOM000 006
000%ow-0000
00qi~o n0 0 -0 00
04 O % t- r() 44 4
V400MOO0GOO04 w00
"NCMOq)w- 0 0 a0 0 0400-.- ' N 0 -~ - -'3 4r C)j " 0' -(7 (%GA'%'00'4 N Nm0 ' -) ' '0N 100 N C)4 00' N N C)wN
* 0 0 0 0n ý -0 6 6 % 0 .0 o0
m Cc0oa0'0'OOOON0 C0
0 0~ 0' '-t" 0'0' 000 V 0 - 0 0'N - 0 r- r -N N 0
0,00.v 06 0 0
0, 1 N - 0 0000 0 000 0
tr r 0jc -0 rOU- -~0 r) 0 *- 0 000-4Ninx'0OmON0'00000
0696 6 0 000 Q 4.4;
),0'O0'N ai0 0 000O'-c N 00'0 in - oc p664
r- 40'U 0 Ow 0 '0 0- 0' -U4 0U00--N -'-0'-MNNN
0 0 0OON J000000
M q 040'- - 0 0~ 040 00 c 0>~ 0 oil N40)no-mI'0-
I nDo04 000 0C 0
' 4 1-C' N \00 0 0 0 N0 4-0 0 )CJ0
*N-4000'U~' 0-0
00- JOO ~'U53
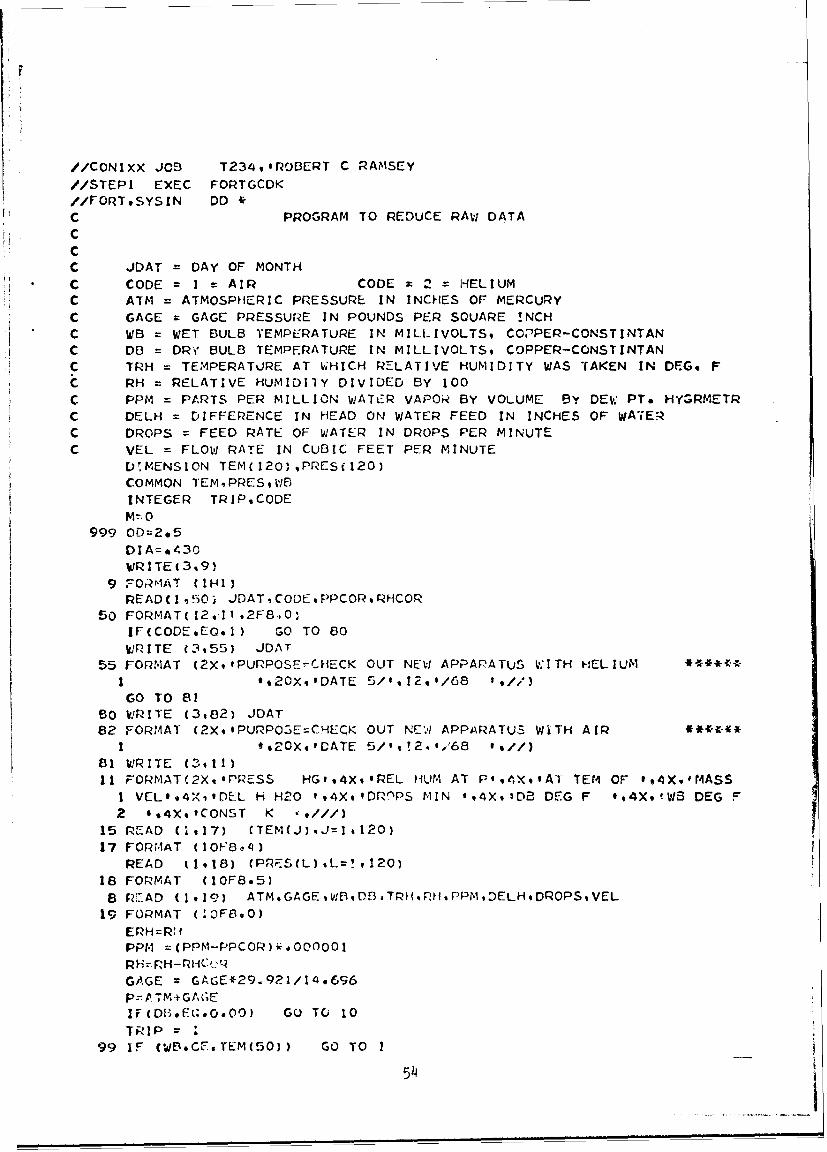
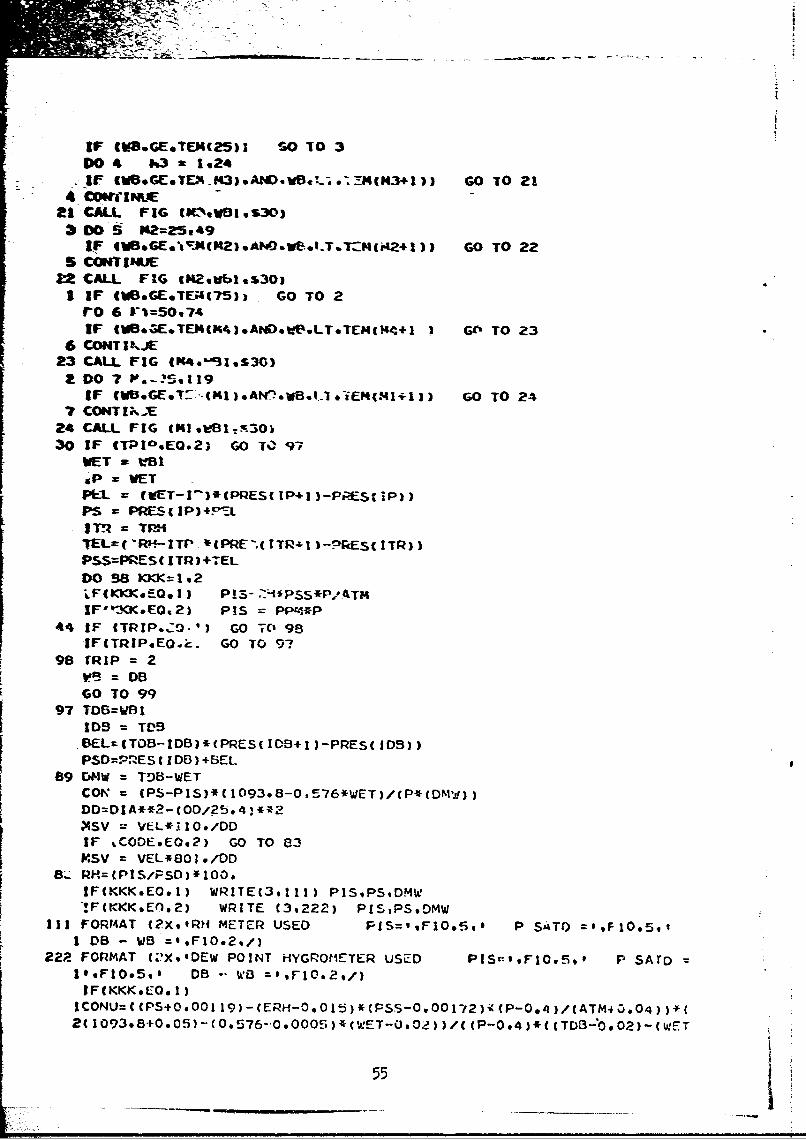
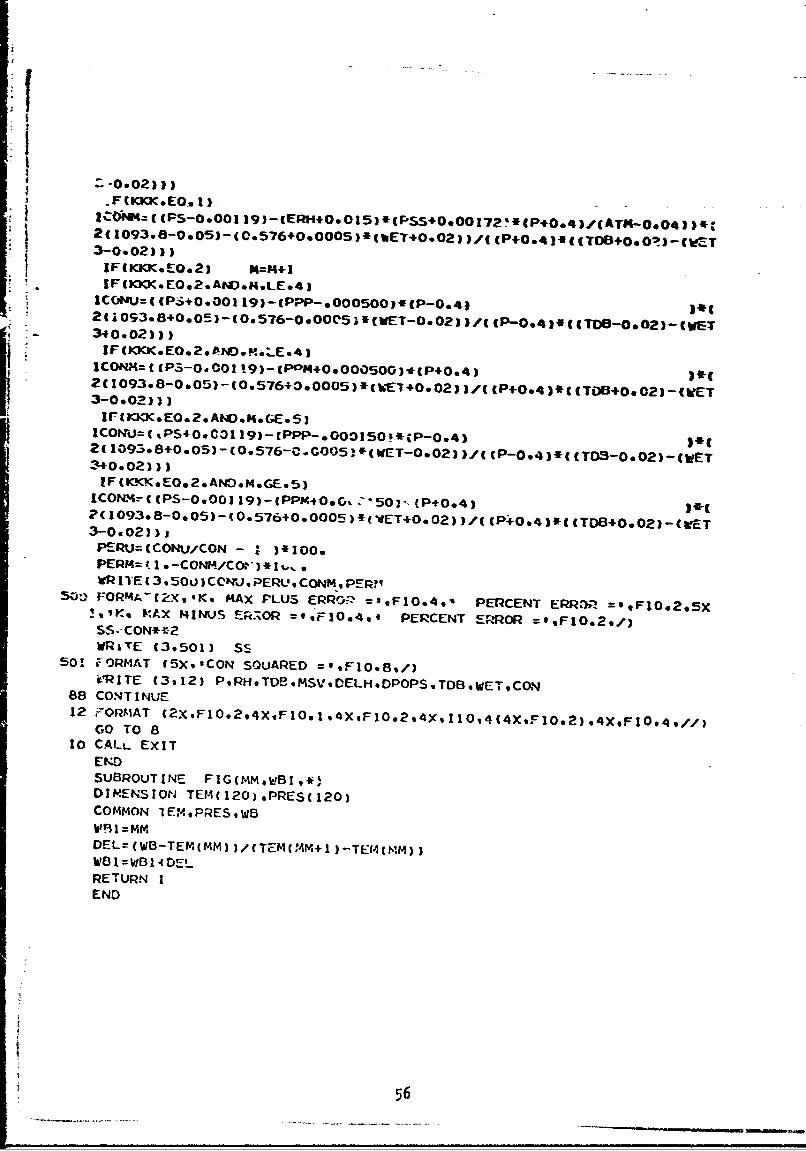
//CONIXX JC5 T234,,ROBERT C RAMSEY
//STEPI EXEC FORTGCDK//FORToSYSIN DD *
C PROGRAM TO REDUCE RAW DATA
CC
C JDAT = DAY OF MONTH
C CODE = I = AIR CODE = = HELIUMC ATM = ATMOSPHERIC PRESSURE IN INCHES OF MERCURY
C GAGE = GAGE PRESSURE IN POUNDS PER SOUARE !NCHC WB = WET BULB TEMPERATURE IN MILLIVOLTS, COPPER-CONSTINTAN
C DO = DRY BULB TEMPERATURE IN MILLIVOLTS. COPPER-CONSTINTAN
C IPH = TEMPERATJRE AT WHICH RELATIVE HUMIDITY WAS "AKEN IN DEG. FC RH RELATIVE HUMIDITY DIVIDED BY 100
C PPM = PARTS PER MILLION WATER VAPOk BY VOLUME BY DEw PT. HYGRMvETR
C DELH = DIFFERENCE IN HEAD ON WATER FEED IN INCHES OF WATER
C DROPS = FEED RATE OF WATER IN DROPS PER MINUTE
C VEL = FLOW RATE IN CUBIC FEET PER MINUTE
D'iMENSION TEM(120),PRES(120)COMMON TEMiPRESoWB
INTEGER TRIPsCODE
m=0999 0D=2.5
DIA=.430WRITE(3,9)
9 .- ORAT (IHI)READ(!i50i JDATiCODEPPCORiRHCOR
50 FORMAT(l2,91 ,2F8,,O:IF(CODE.EIoQ.) GO TO 80
WRITE (3,55) JDAT
55 FORMAT (2XIPURPOSE-CHECK OUT NEW APPAPATUS tITH H'ELIUMI *,20XqlDATE 5/lI2,'/68 I,//)
GO TO 81
80 WRITE (3,82) JDAT
82 FORM4AT (2XsPURPO3E=CHECK OUT NE;,/ APPARATUS WiTH AIR
I oZOX.4'DATE 5/',t24','68 I$//)
81 WRITE (3,11)11 FORMATC2XoPRESS HGU,4XtREL HUM AT P',xtXAT TEM OF fs4XtMASS
I VELO4'4X^'DEL H H20 t,4X,'DrP"PS MIN ',4Xo3D8 DEG F *o4X.9W3 DEG F
2 o,4X,'CONST K *,///)15 READ (I117) (TEM(J),J=I,120)
17 FORMAT (IOF8a4)READ t1918) (PRES(L),L=!,12O)
18 FORMAT (10F8.5)
8 PEAD (,191) ATMGAGEV,WB.D0TRHRPHPPM,DELH,DROPSVEL
19 FORMAT (0F80)
ERH=R: IPPM (Ppm-PPCOp)i.Oooo01
GAGE = GAGE*29.921/I4o696P: 4. TM-+GAG;E
IF CDHO ,E:,0O,00) GO TO 10TklP = 1 TRIP
99 IF cwB.CFTEM(50)) GO TO I
54
IF tv8*GEoTE14c25ii SO TO 3004 o%3 a 124IF (V8.GE.TEM.U43).AtD.v8.!--.-.;.14(M3,1)) GO TO 21
*C0WfI MA21 CALL FIG tNZaV8IS3O,
31 00 !5 M22Z5.49IF 4~G.M)AOw.~~Mj21) GO TO 22
Z~2 CALL FIG tHZ2.wblss30jI IF t£B*GlETEj4c75)) GO TO 2
1-0 6 rl=50.74IF (W8.%-vE.TEMCM4I.At0.We.LT.TEx(14+1 )GO' TO 23
6 COHTIfJE23 CALL FIG (K4.'-919S30)
2 DO 7 P-'.1IF (V.~T-(1.N.BI~E(4+) GO TO 24
7 CONTI;t.X24 CALL FIG (f4Jst!B81?'3o)
3o IF (TPI0 .EO.2) GO T,) 97WET a V81I
sP= WETPLL = fWET-I-)*(PflES(1P41)-Pi:WStiP))P:S = PRE-'-cIP45'~oL
IT1= TrmTEL-f *- R-ITP * CPRE C tTR-& I -. ES I TR))PSS=PRESC ITR)+TEL
DO S8 KKK=1.2
IF'*3<K.EO.2) P Is= pq*44 IF tTRIP*ZQ-') GO TO 98
IF(TRIPoEQ.i-. GO TO 9798 TRIP =Z
GO TO 9997 TOB=WB1
-OEL=CTOB-I0B)'IPRESC 108+1)-PRESC 15))
89 DW =TD8-WET
8-'RH=CPISFSD)*100.lF(KKK*EO.U) WRITEC39111) PIS,PSDMW'!F(tKKK.En.2) WRITE C3o222) Pl5,PS*0MW
III FORMAT (?X*,RHi METER USED PIS=',F1O*5vf P SATO) '9F 10.5.'1 0B - WB =IoF1O*2,/)
22P- FORMAT C 'X , IDEW PO INT HYGROMiETER USED PIS~l9FlO.5*l P SArDz1**FlO.5,' DB -- W =.,FLO.2q1)IF(KKKoEO. 1)
RCONUC(PS+OeOO11)-(ERH7-OeO105)*CPSS-O.OO12)/C (P-O4)*(ATD34-0, 02)-(WE
55
z -0002) 3.F(KKK*Eo_.lj
* 3-0.02)))jF(KKcK*EO.2, HM4+1lF (K K.EO.2%AN.14.LEs4)
ICO~iu=c (PS+0.O1 19)-(Ppp-.000500,f(P-O.4,* ~2 (i093s8+0e05)-(0.576-0.0OC53*(W~ET...0.2) )'c P-O.4)*CCToo-0*2)-CE~T
340.02mj
1CONX=( (P3-0.001 !9)-CPOM40.000500)*CPO.4)
lFlIJKM&E~o2eANV.MeGEe5)ICOlJU=( PS+0.031 19)-(PPP-.O0O15 0,*CP-0. 4 3 c
1C0N!=(tPS-0eO0I 19)-cPPMgOeG,. So501c P+O@4,
3-0.02))jPE-RU=(CONU,'CON )4100.PERM=~ 1 I o-C0NM,'CO.'-)* I ,,WR ITE( 3 v50U) CChrU sPEpU, CO.M, PER?'
500~ FORMA-(2XsvKv MAX PLUS ERrio:- =$.F1O%4ql PERCENT ERR,)v =soFlO.2s5X!.'I~, MAX MINUS EkR;0R =qtF1O*4q4 PERCENT ERROR =vFIO*29/)SS-- CON**2WRiTE (3.501) ScS
50! ý-ORMAT (5X9'CON SOUARED =6.FIO.8%/'VYRITE (3*12) P*HTeM~DL*DOST~WI*O
88 CONTINUE12 FO0RMAT C2XF1O.2.4XFJO.1 .4XFIO.2.4XsI1Os4c4Xtc-lO.
2 ) 4X.FlO.4,/,)GO TO 8
10 CALt- EXITENDSUBROUTINE FIGCMMoWB1,*!DIMENSION TEM(120)*PRESc 120)COMMON IEM*PPES,wBW'131=MmDEL=(WB-TEM(MM) )/(TEM(MM+1 )-TE1MCMM))WBIB= WB 14DELRETURN IEND
i5

0000000000000---10f-0-OOOO0000000cVI
I') ~ ~ ~ ~ s e 04 Ca. 0N-N01 )' )V 0 E)0C )0 NC 04- )
'0VI4N 000F)I04I0-C'NC%.1 Ohc- J-4wVo sa * .* a a
333 * * 00.0000000.ooo- 00c
0 0__ N -vO -0 -nI .a - 0
0* a * & * 4 e a
0N0m100000000NVDI0COh04ICC)I-n--00000004M N 0. F) Ma v h 0 N % %r m Oh '3 0 VI n) W 0 -Oh - -(U f-: IM*)-0n0r %-Co00a 0 *T 0 -* * - - - - 00000~h)~tf
*00000VI0I-00100)0--.-M3fl'3oh -UCo0 OQC'0a n 00 NO O 10 N0' f- 4W-- 0 M) 0) 0) to oi C M -c ~ 00 0 0.1r- N m n0
VI n) - -at)ý a- N -C '0 C lC '00 a W' 'r- 01Z N 0 C% _n C- z Z) '200'-
000000000000 -00ozaf)C'C'0'00000 tflOOCO 0
VII' 0 0IV N Oh m 4 0 0' 0 0 )% 0I 4 0 0I- - 0) N n- n -; 0 c*~~~~ 54000a .SS 00 N'~ 4c 40 C' N C : "-i-o a aa aa .a
in 0I 0SO 0000 0~ r- CN0 0 C 0 -Mr r T0.
00 0 0 000) -) - -UC 0000 VC% r 0 , 00 !I- -Z 0
N0Oh40 '0c--t0'4flf4N on0'coc-( c -M * e * a 6* I
0%-N 100nO t-M\!M n NM F)'01 W Z3-i InC% Lf) r- Z N N '1(U'
00 0 W U W I h10C'0 (U -. CO (
000 0 0 0 0 0 0 0 0 0 0 0 n 'T 0 0 0. N- QU 0 0 0 .0 0 L')0 %D %3 ') '00 0-0 )N 4 0 m 0' (U 0 N r- 0 4: C' M) r- Oh0 C0 oz -0-. l 4C
e 0iý0 0 M ) ) ) )0000 r
57 a44
00 a0 1)C 00 0
00.00000000
000000000.0
00 000-00000
00 000
OOOOCOO0
000 ~00ooo 00000000000
0000000030
4 faIr)t1 r) gC~ .*
00N0 oo 0 Q 00 Q 0N*- )MV 0 -0 C)**
Nf n- c) f- r- r- n o
C) f) 00'0'2'30
-*' ~ U4 Ire, 00 0 0% 0
-4 --1- - -. - 0
n0 r. ) C) r, rl -) n' 0
N~fl-r-r-58
Uwamifted
m ciy t.naatý DOCUMENT CONTROL DATA.- RA Dof q5*sile.1 beak of SI OstW -4C Noecn AC*I4 ... isas zmI be ac a acnemd A V e 0-1;rveti s fWossi55
1. OUVIOMATING &CTIVITY -CORPSOW1I "AWW) ZRPR TUtT ~SII&II
Ehz eireef and Des1p and Analysis Labarator-yUcasfe
Ihkiversity of New Hmrvshijr~sýGOU '',X. RIEWOT TITL9
PSYCHRAWUVIC PiP_1)F?=E (F I= %Mh5WATEP V~PMR N=7 "JI
4. C04 .CRPTIV9 OE 1p 1upit Ebliwdf.IFinal ITpOit Februiary 19,67 - At~t :19685~AUT14001112 (FARI mý. dmi.~ di*JOL 5SR1 -,WF
Oswald T. Ziprmanzu and Icbeezt C. Raey
NZOT A974L TOTAL NO Or PGCES ?h. -40. or REFS
Aigut 1968 IT 17~Oft. CONTRSACT ON GRANT 1%0ý 90. OR*GC-AORS REPORT NU.DERISD
C~IRNOO2~I67- -01&-(3 ITech!1Jci-i 7enort %1. l'36k. PROJECT 54O.
C. ~~~~S!! 0..Eft REPORT 1OS f fltorsamy .. l&*.Md
IS. DOSTRISUTION STATEMIENT
Distribution -of this docuxnmt is unililiited.
1t, SUP1LEMENTARsY .C11ES 12. SPO"SOINGC NILIAq* ACTI-.ITY
Office of Naval 'PesearchDent. ef' the ýCavy
_______________________________ '~ashir4ton, D3. C. 20360IS. ABSTRACT
4hen gas that is not saturated with water is p~assed over a wetted surface, thesuraface teq~erature %%ill drop because of evaporn-tion of water. This drop i'l tE-iuer-.ature (often called the wet-bulb depression) together wi4th the temp~erature of thegas stream gives a measure of the huiiidity of the gas. For manky years, psychrcinetersbased on this phena-non have been used very successfully for measuring the hirnidityof air under the usual conditions of temerature and Dressure encountered by mostpecple on earth.
In recent years ,ýwith man' s increasing interest; in exploring the ocean atgreater and greater de~ths, it was found necessary to renlace the nitrogen of thenormal atmosphere with hellun to provide a breathing g-as for those living at ambient
I ocean pressure. This led to a need for a knowledge of the psychracietr'ic piopertiesof helitm at pressures up to several hundred pounds per square'inch.
This investigation has resulted in: (1) the development of an~ 1im~rOved'psychro-meter, (2) the de-velopment of a psychranetric equation for the helium-water vaporsystem, and (3) the development of a cciputer pmro~am which makes it possible toprint out psychrcwtric charts for any ocean depth.
FORM..47 (PAGE 1)S/N 010O.807.0 Seurity Classification
$ec€ity Cla*% Hica'-tion
KTW LINK A L-KK a LIN- C
R1OL OT ROLE. ST ROugE Ut
Helium-water vapor
Wet- and Dry-Bub Temperatures
psychunetric Propenies
Psyduaretry
r, ::-
FORM BAK
DD I ov.11473 ACK unclassified(PAGE 2) Secutity Classification
Recommended