This chapter provides an overview of nonprofit organizations in the state of New Jersey.
New Jersey is the eleventh most populated state in the United States. The United States 2012 Cen-
sus estimated the New Jersey population at 8,821,155. New Jersey is located in the Northern U.S.,
and borders metropolitan New York, and Philadelphia, Pennsylvania. The report data examines the
service program areas served by nonprofit organizations, their program scope, governance, leader-
ship, and funding, sources, and nonprofit sector trends. The findings suggest that nonprofit agen-
cies in New Jersey will need to develop more formative strategies in order to remain financially
viable.
Research Report #7
March 2013
New Jersey Nonprofit Organizations: History and
Current Status
Ronald Quincy, Ph.D.
Svetlana Spiegel, Ph.D.
Tara Hixon, MSW
Bella Lu, MSW
Rachel Ludeke, LSW
Rutgers School of Social Work
Center for Nonprofit Management and Governance

1
Defining the Nonprofit Sector:
Comparing the US and New
Jersey
There are currently over 1.6
million nonprofit organizations
(NPOs) in the United States, with New
Jersey accounting for approximately
28,000 organization, which accounts
for a 24% increase since 2000
(Blackwood, Roeger & Pettijohn,
2012) . With such an increase comes
the need to offset the costs to employ-
ing full-time staff members. The non-
profit sector impacts the United State’s
national economy by employing more
than 9% of the US workforce through
1.4 million organizations. Additional-
ly, the nonprofit sector produces 11%
of the nation’s gross domestic product,
generating 8.3% of the nation’s wages
and salaries. Nonprofits manage $1.4
trillion in annual revenues and $3 tril-
lion of the nation’s total.
The impact of a sluggish econ-
omy has affected nonprofits, as 33% of
organizations report reductions in
their workforces. According to data
collected by Hager, Rooney, & Pollack
at The Center for Philanthropy at Indi-
ana University (2002), a third of pri-
vate charitable donations are received
by congregations and other religious
faith-based organizations. This sector
received 2.5 times more than any other
nonprofit sector, with educational or-
ganizational organizations receiving
the 2nd largest share of contributions
(13.2%). Human service organizations
only received 8.9 of all charitable con-
tributions. Cultural arts and children &
family service organizations have ex-
perienced the greatest losses. With the
increased demand for human service
organizations as a result of the reces-
sion, nonprofits must do more, with
fewer resources. Increased burnout is
one of the effects of the downsized
staff to assist with delivery of services
to clients.
Overall, the economy has
forced many nonprofit organizations
to make tough decisions in order to
continue operating. Many are looking
for answers as to what they can do to
ride out the economy. The Center for
Nonprofits, in New Jersey, released its
annual trends and outlook for the non-
profit sector in New Jersey (2012). The
study conducted surveyed 249 non-
profit agencies in the state in 2011 in
order to conduct a longitudinal study
that reflected their growths and chal-
lenges in 2012. Overwhelmingly, three
quarters (75%) of those surveyed re-
ported an increase in the demand of
services, but 54% of those surveyed
also reported that a previous funding
source lowered its overall contribution
to the agency or denied funding for the
year due to economic concerns. It is
clear that nonprofit agencies, in New
Jersey and nationally, need to consider
other ways of fundraising, collabora-
tion, and even mergers/acquisitions in
order to stay financially viable.
Methods
In September 2010, the Center
for Nonprofit Management and Gov-
ernance, School of Social Work, Rut-
gers University, begun a state-wide
research project examining the struc-
ture and functioning of nonprofit or-
ganizations in New Jersey. The goal of
the project was to improve transparen-
cy and awareness of the accomplish-
ments and challenges faced by non-
profits in New Jersey. The findings will
allow the nonprofit sector to learn
about other organizations in New Jer-
sey, and may allow donors and re-
source centers to better customize their
funding and technical assistance ser-
vices.
The first wave of data collec-
tion began in September 2010 and was
concluded in December 2010. Letters
were mailed to approximately 8,000
nonprofit organizations inviting them
to participate in an online research
project. Executive directors, CEO or
other authorized staff were asked to
complete the survey. We received 268
responses as a result of this effort. The
second wave of data collection has be-
gun in February 2011 and was con-
cluded in July 2011. This wave has tar-
geted organizations reporting $100,000
or more in revenues; because such or-
ganizations were underrepresented in
the first wave of data collection. We
received 255 responses as a result of
this effort.
The present report is based on
a sample of 404 fully completed sur-
veys. The remaining surveys contain
partial data only; therefore, they were
not included in this report. The data
collected was analyzed using SPSS.
The data set included both quantitative
and qualitative responses. The infor-
mation presented in this report is not
all-inclusive – additional data exists in
the survey, and will be used for future
reports and publications.
Results
Description of Participating
Organizations
The majority of the participat-
ing nonprofit organizations (93%) re-
ported having Federal 501(c) (3) tax
exemption status. Many organizations
(42%) also reported having the State of
New Jersey nonprofit tax exemption.
Only a small minority (2%) reported
not being a tax-exempt organization,
or being a faith-based organization
that is not required to receive a tax-
exempt determination (4%). Organiza-
tions were asked to report their prima-
ry purpose or mission. Below is a com-
plete description of the reported pri-
2
mary purpose or mission of the non-
profits surveyed.
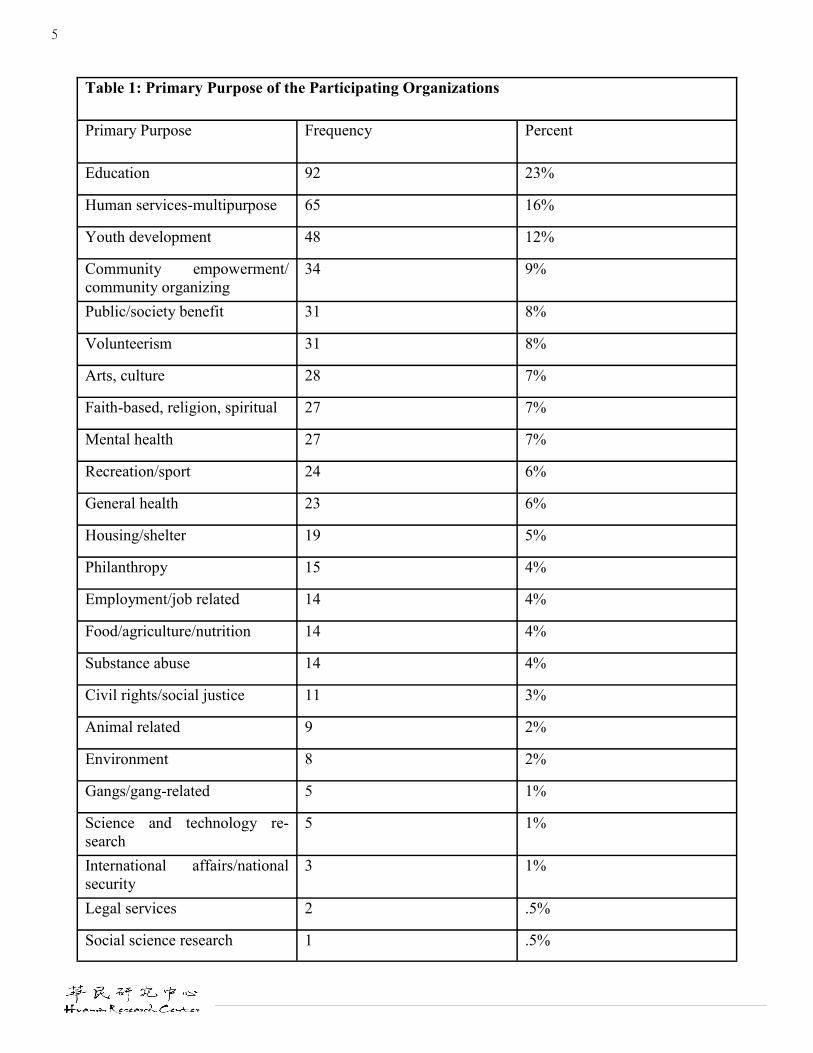
The most commonly reported pur-
pose was education; followed by mul-
tipurpose human services; youth de-
velopment; community empowerment;
public/society benefit; volunteerism;
arts and culture, faith-based, and men-
tal health. Organizations were able to
report more than one primary purpose
or mission, of which additional areas
were covered such as public interest,
charitable foundations, and public in-
terest think-tanks.
Information about the Clients Served
Participants were asked to re-
port the number of clients served an-
nually by their organization. The mean
number of clients served was 7,568;
with a median of 500; and a mode of
500. Additionally, participants were
asked to report the type of geographic
area they primarily served. The majori-
ty of the organizations reported serv-
ing suburban areas; about a third re-
ported serving urban areas; and only
13% reported serving rural areas. Fur-
thermore, organizations were asked to
report the estimated percentage of cli-
ents by gender, age, and race/ethnicity.
On average, organizations reported
serving slightly more females than
males (52% and 48% respectively). The
age groups of 5-12; 13-18; and 31-45
were served most frequently. On aver-
age, about 50% of the clients served
were White; 25% were African-
American; 15% were Hispanic; and the
rest were clients of other races, such as
Native-Americans and Asians.
Governance
Participants were asked who
provides governance to their organiza-
tion. Most respondents indicated that
governance is provided primarily by a
board of directors or trustees. Some
organizations reported that govern-
ance is provided primarily by an exec-
utive committee of the board; still oth-
ers indicated that governance is pro-
vided by the founder of the organiza-
tion; or another source. These results
are summed in Table 2.
Participants were also asked to
report the average percentage of board
members by gender, age, and race/
ethnicity. Results indicated that the
percentage of male and female board
members was roughly equal. Most
board members were ages 46 to 60;
followed by 31 to 45; and 61 to 75.
Noteworthy, board members ages 18-
30, as well as 76 and older, appeared to
be a small minority among the partici-
pating organizations. Finally, when
members race/ethnicity was consid-
ered, the majority of the board mem-
bers were White; followed by African-
Americans; and Hispanics. Other races
accounted for a small minority of the
members. These results show that
most boards are still relatively homog-
enous in terms of racial and ethnic
composition. The small percentage of
Hispanic/Latino board members is
particularly alarming.
Participants were asked about
their opinion on the importance of di-
versity among the board members. On
a scale of 1 to 5 (1=not important at all;
5=very important), the average score
was 3.35; with a median of 4 and a
mode of 5. While most respondents
provided scores of 4 and 5 (21% and
30% respectively), as many as 20% pro-
vided a score of 1, indicating that
board diversity was not important at
all. Participants were also asked to
report whether or not their organiza-
tion had a resolution or a policy state-
ment on the importance of diversity on
the board. Only about one third of the
respondents (34%) reported having
such a statement/policy. These results
further indicate that having a diverse
board of directors is not considered to
be a priority among many organiza-
tions.
Participants were then to re-
port whether board members partici-
pate in a variety of fundraising activi-
ties. Respondents reported that board
members participated in events plan-
ning (85%); outreach to donors (79%);
and serving on a fundraising com-
mittee (78%). Lastly, participants were
asked who was responsible for recruit-
ing and mentoring new board mem-
bers. Most respondents indicated that
this was the responsibility of a specific
board committee, or the president/
CEO/executive director of the organi-
zation. A smaller percentage of re-
spondents indicated that recruiting
and mentoring board members was
the responsibility of the board’s chair;
the founder of the organization; or key
donors.
Succession Planning
Participants were asked about
succession planning practices in their
organization. More than half of the
respondents indicated that they had a
succession plan for the board of direc-
tors, as well as for the president, the
CEO, or the executive director. About
40% reported having a succession plan
for the program director. Succession
plans for the COO/ CFO and the
founder of the organization were re-
ported less frequently. Overall, about
70% of the participating organizations
reported a succession plan for at least
one of the above mentioned function-
alities. It should be noted, however, for
some organizations certain functionali-
ties (i.e. COO/CFO) were reported as
not applicable.
Staffing Patterns
Participants were asked to re-
port the number of full-time, paid, em-
ployees in their organizations. The av-
erage number of such employees was
24; however, the median was 1, and
the mode was 0. Fully 47% of the par-
ticipating organizations reported hav-
3
ing 0 full-time, paid, employees. These
results indicate that while some organ-
izations had very large paid staff,
many had a limited number of paid
employees; or no paid employees at
all.
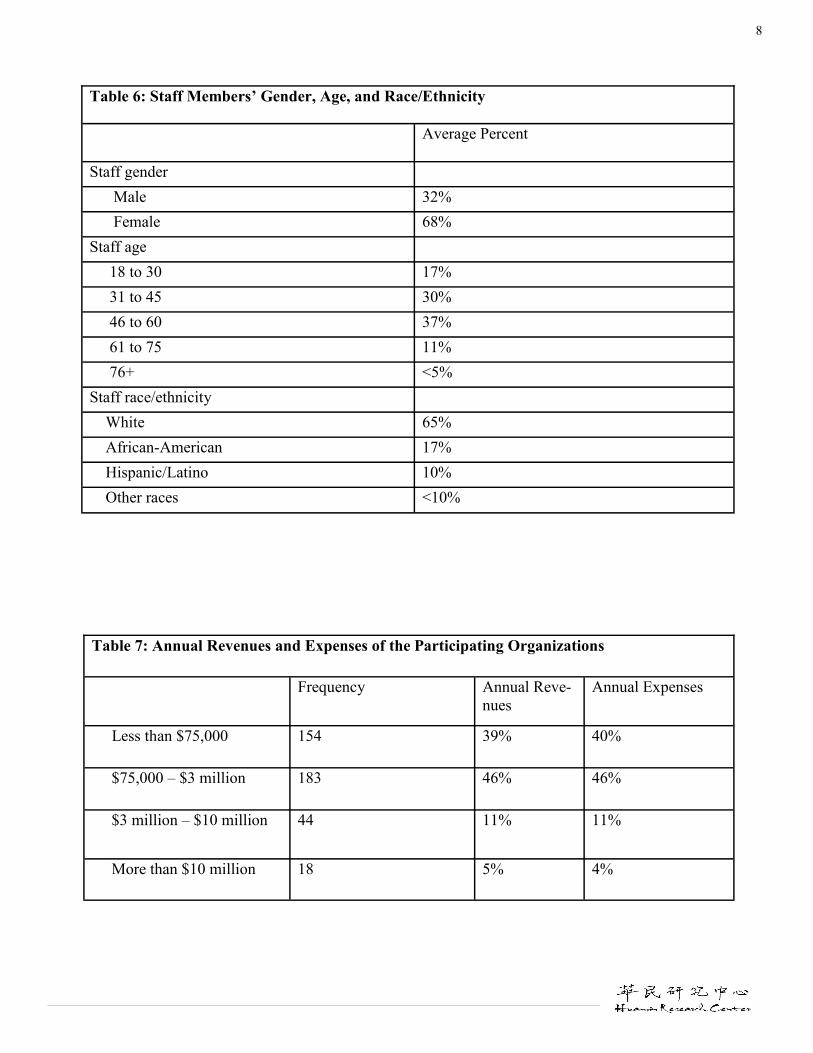
Participants were also asked to
report the average percentage of staff
by gender, age, and race/ethnicity. On
average, female employees were some-
what more prevalent than male em-
ployees. The most prevalent age group
was 46-60; followed by 31-45; and 18-
29. Staff over the age of 75 accounted
for a very small proportion of the em-
ployees. The majorities of the employ-
ees were Whites; followed by African-
Americans; and Hispanics. Other racial
groups accounted for a small percent-
age of the employees.
Respondents were asked about
the importance of diversity among the
staff members. On a scale of 1 (1=not
important at all; 5=very important) to
5, the average score was 3.35; with a
median of 4; and a mode of
5.Approximately 20% of the respond-
ents indicated that diversity among the
staff members was not important at all,
in their opinion. Noteworthy, these
responses were similar to those pro-
vided previously on the importance of
diversity among the members of the
board.
Participants were asked to re-
port the average annual turnover rate
among the staff. The average turnover
rate reported was approximately 10%.
Furthermore, participants were asked
to report whether or not staff reduc-
tions were made in the past 12 months,
and if so, what kind of considerations
influenced the choice of the positions
eliminated. Interestingly, the majority
of the respondents (74%) indicated that
no staff reductions were made in their
organization in the past 12 months.
Those reporting making staff reduc-
tions indicated that “program priori-
ties” was the most prominent consid-
eration in making such decisions.
Funding and Revenue
Participants were asked to re-
port the annual revenue of their organ-
ization in the most recent fiscal year.
The most common category reported
was $75,000 to $3 million (46%); fol-
lowed by less than $75,000 (39%). A
relatively small percentage of the par-
ticipating organizations reported hav-
ing revenues of $3 million or more.
Participants were also asked to report
the annual expenses of their organiza-
tion in the most recent fiscal year. The
most commonly reported category was
$75,000 to $3 million (46%); followed
by less than $75,000 (40%). As ex-
pected, only a small number reported
having more than $3 million worth of
expenses. These results are summa-
rized in Table 7.
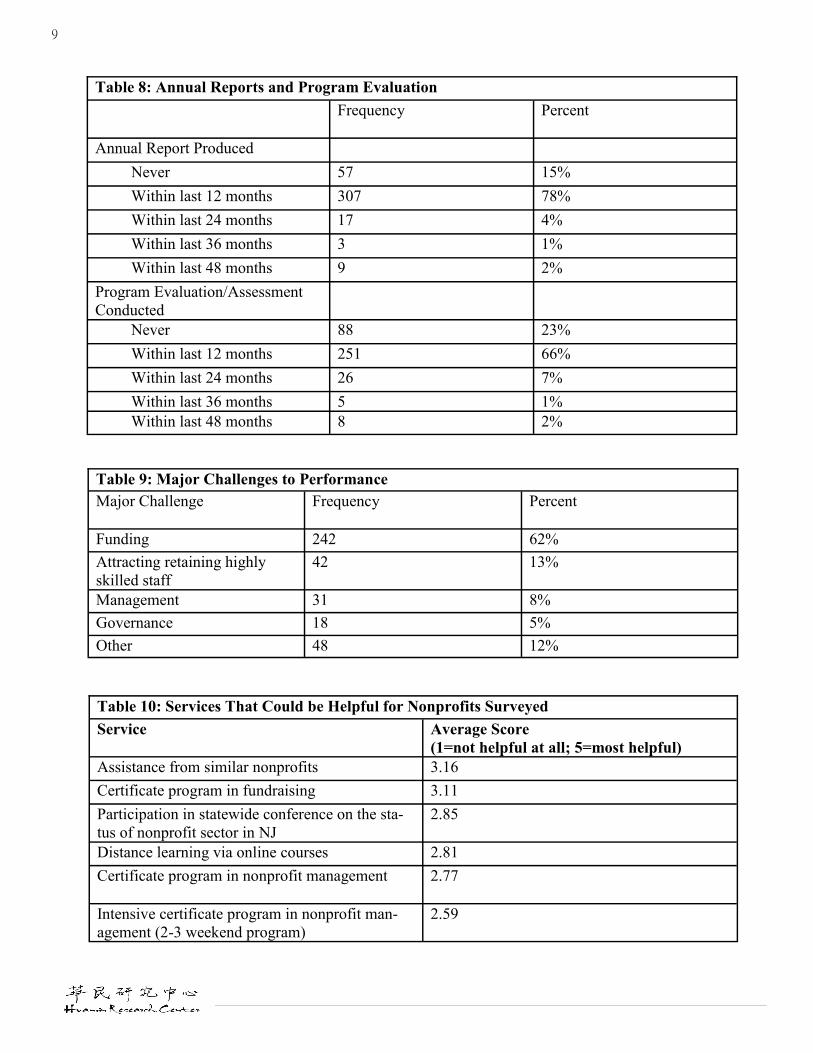
Operations and Effectiveness
Participants were asked when
the organization’s most recent annual
report was produced. The majority of
the respondents indicated that an an-
nual report was produced in the past
12 months. Noteworthy, about 15% of
the respondents indicated that their
organization has never produced an
annual report. Next, participants were
asked when the most recent program
evaluation, or an assessment of pro-
gram outcomes, was conducted.
Again, the majority of the respondents
indicated that an evaluation was con-
ducted in the past 12 months. None-
theless, more than 20% of the respond-
ents reported that a program evalua-
tion has never been conducted in their
organization. Participants were asked
to indicate who typically conducts a
program evaluation in their organiza-
tion. Among those conducting an eval-
uation, most reported that it was con-
ducted by internal program managers.
Noteworthy, only a small minority
indicated that evaluations were con-
ducted by external consultants.
Major Challenges to Performance
Participants were asked to re-
port the major challenges to successful
performance in their organization. The
majority of the respondents named
“funding” as the major challenge to
successful performance; followed by
“attracting and retaining highly skilled
staff”; “management”; and
“governance”.
Helpful Services
Finally, participants were
asked to report whether or not specific
training/education services could be
helpful to their organization. On a
scale of 1 to 5 (1=not helpful at all;
5=most helpful), the service that has
received the highest score was
“assistance from similar nonprofit or-
ganizations”; followed by “obtaining a
certificate program in fundraising”;
and “participation in a statewide con-
ference on the status of nonprofit sec-
tor in New Jersey”. The full descrip-
tion of services is presented in Table
10.
Overall, the nonprofit organi-
zations that were surveyed reported
both substantial growth and declines
in their service provision. These agen-
cies are seeking ways to stay active
while dealing with a tough and unfor-
giving economy. The road ahead for
the nonprofit sector in New Jersey and
the United States will have to shift to
include innovative ways to build sup-
port, sustain funding, and strengthen
board management and governance.
The ability for smaller nonprofit agen-
cies to compete with larger, well-
established nonprofit agencies will
depend on education and retention of
senior level staff while also reflecting
the growing diversity in New Jersey.
4
Discussion Challenges with Data Collection and
Data Analysis
We have encountered several
challenges during the data collection
process. The most significant challenge
was calculating the response rate for
the survey. Participating organizations
were selected from a list of 47,000 non-
profits registered with the IRS in the
state of New Jersey. Nonetheless, the
accuracy of the list used remains un-
known. For instance, some of the regis-
tered organizations may no longer be
in existence; while others may have
changed their location. The letters of
invitation were mailed to the address-
es listed on the form; however, we are
unable to assess how many operative
organizations had received it. There-
fore, the response rate for this survey
is unknown.
In addition, we encountered
several challenges with data analysis.
First, approximately 100 participants
did not complete the full survey. In
many instances, only a few questions
were completed, while the majority of
the survey was left blank. Partial sur-
veys were excluded from this analysis;
however, they may be included in fu-
ture reports. Furthermore, some partic-
ipants chose not to respond to certain
questions on the survey. Therefore,
results presented in this report are
based on the number of available re-
sponses for each question. The survey
also did not account completely for
smaller, newly formed nonprofit agen-
cies whose revenue is under $100,000
per year since it was difficult to focus
the scope of those agencies.
Conclusion Nonprofit organizations in
New Jersey are struggling amid a
tough economy and it is from the sur-
vey conducted that alternate strategies
will need to be utilized to ensure the
longevity of the agencies surveyed.
Succession planning, program evalua-
tion, and education were some of the
areas where improvement can be
made to these respective agencies. The
role of the Center for Nonprofit Man-
agement and Governance at the Rut-
gers University School of Social Work,
is to ensure that the nonprofit sector in
New Jersey has the tools necessary
remain a viable force.
5
Table 1: Primary Purpose of the Participating Organizations
Primary Purpose
Frequency Percent
Education 92 23%
Human services-multipurpose 65 16%
Youth development 48 12%
Community empowerment/
community organizing
34 9%
Public/society benefit 31 8%
Volunteerism 31 8%
Arts, culture 28 7%
Faith-based, religion, spiritual 27 7%
Mental health 27 7%
Recreation/sport 24 6%
General health 23 6%
Housing/shelter 19 5%
Philanthropy 15 4%
Employment/job related 14 4%
Food/agriculture/nutrition 14 4%
Substance abuse 14 4%
Civil rights/social justice 11 3%
Animal related 9 2%
Environment 8 2%
Gangs/gang-related 5 1%
Science and technology re-
search
5 1%
International affairs/national
security
3 1%
Legal services 2 .5%
Social science research 1 .5%

6
Table 2: Provision of Governance to the Organization
Provision of Governance Frequency Percent
Board of directors/trustees 294 73%
Executive committee of board 52 13%
Founder of the organization 41 10%
Other 16 4%
Table 3: Gender, Age, and Race/Ethnicity of the Board Members
Average Percent
Board members’ gender
Male 52%
Female 48%
Board members’ age
18 to 30 <5%
31 to 45 25%
46 to 60 48%
61 to 75 21%
76+ <5%
Board members’ race/ethnicity
White 78%
African-American 14%
Hispanic/Latino 4%
Other races <5%

7
Table 4: Board Members’ Fundraising Responsibilities: Recruitment and Mentoring of
Board Members
Frequency
Percent
Board Members` Fundraising Re-
sponsibilities
Event planning activities 333 85%
Outreach to donors 306 79%
Fundraising committees 310 79%
Recruitment and Mentoring of
Members
Board committee 204 52%
President/CEO/executive director
198 50%
Board chair 85 22%
Founder of the organization 57 14%
Key donors 10 3%
Table 5: Presence of Succession Plans for Key Stakeholders
Presence of Succession Plan Frequency Percent
Board of directors 207 58%
President/CEO/executive di-
rector
178 52%
Program director 97 42%
COO/ CFO 57 28%
Founder of the organization 43 26%
8
Table 6: Staff Members’ Gender, Age, and Race/Ethnicity
Average Percent
Staff gender
Male 32%
Female 68%
Staff age
18 to 30 17%
31 to 45 30%
46 to 60 37%
61 to 75 11%
76+ <5%
Staff race/ethnicity
White 65%
African-American 17%
Hispanic/Latino 10%
Other races <10%
Table 7: Annual Revenues and Expenses of the Participating Organizations
Frequency
Annual Reve-
nues
Annual Expenses
Less than $75,000 154 39% 40%
$75,000 – $3 million 183 46% 46%
$3 million – $10 million 44 11% 11%
More than $10 million 18 5% 4%
9
Table 8: Annual Reports and Program Evaluation
Frequency
Percent
Annual Report Produced
Never 57 15%
Within last 12 months 307 78%
Within last 24 months 17 4%
Within last 36 months 3 1%
Within last 48 months 9 2%
Program Evaluation/Assessment
Conducted
Never 88 23%
Within last 12 months 251 66%
Within last 24 months 26 7%
Within last 36 months 5 1%
Within last 48 months 8 2%
Table 9: Major Challenges to Performance
Major Challenge Frequency Percent
Funding 242 62%
Attracting retaining highly
skilled staff
42 13%
Management 31 8%
Governance 18 5%
Other 48 12%
Table 10: Services That Could be Helpful for Nonprofits Surveyed
Service
Average Score (1=not helpful at all; 5=most helpful)
Assistance from similar nonprofits 3.16
Certificate program in fundraising 3.11
Participation in statewide conference on the sta-
tus of nonprofit sector in NJ
2.85
Distance learning via online courses 2.81
Certificate program in nonprofit management 2.77
Intensive certificate program in nonprofit man-
agement (2-3 weekend program)
2.59

10
References
Blackwood, A.S., Roeger, K. L., & Pettijohn, S.L. (2012). The nonprofit sector in brief: Public
charities, giving, and volunteering, 2012. Urban Institute Center on Nonprofits and
Philanthropy, 1-7.
Center for Nonprofits (2012). New Jersey nonprofits: Trends and Outlook, March 2012, pp. 1-11.
Haeger, M., Rooney, P. & Pollack, T. (2002). How fundraising is carried out in US nonprofit
organizations. International Journal of Nonprofit and Voluntary Sector Marketing, 7,(4), 311-324.
Rutgers, The State University of New Jersey
School of Social Work
390 George Street, Room 503
New Brunswick, NJ 08901
848-932-5383, ext. 25383
socialwork.rutgers.edu/huamin
Recommended