March 19, 2015
2015
Investor day
2015-19 Strategic Plan New foundations for growth

Enel Group
Investor Relations
2015 Investor day
Agenda
1
2014 main developments Francesco Starace CEO
FY 2014 results Alberto De Paoli CFO
2015-2019 strategic plan Francesco Starace CEO
2015-2019 key financial figures Alberto De Paoli CFO
Closing remarks Francesco Starace CEO
Enel Group
Investor Relations
2
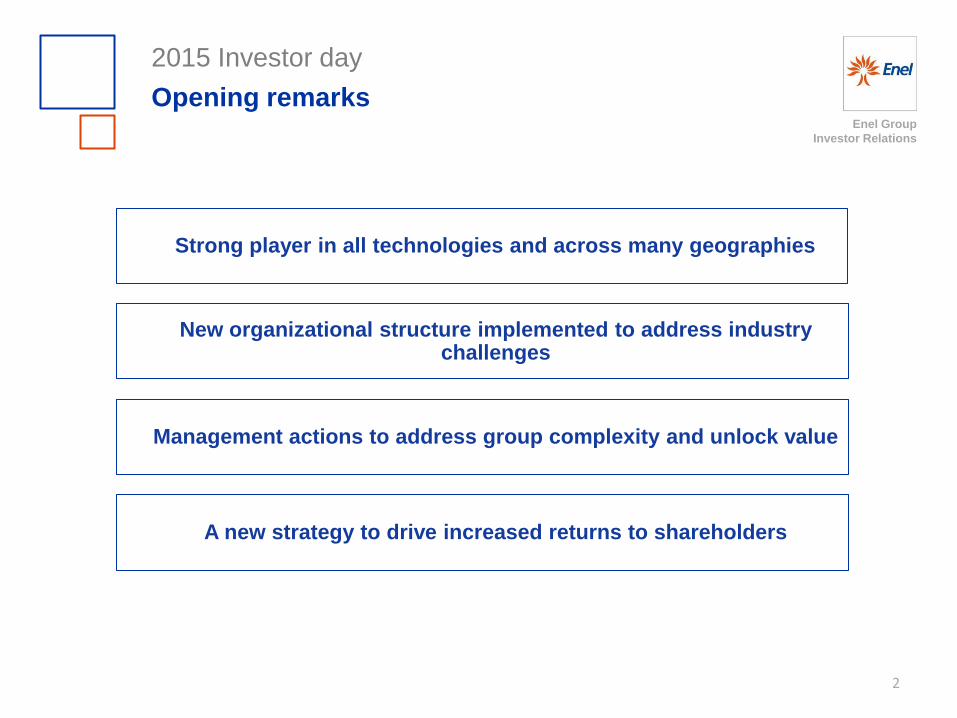
Strong player in all technologies and across many geographies
2015 Investor day
Opening remarks
New organizational structure implemented to address industry challenges
Management actions to address group complexity and unlock value
A new strategy to drive increased returns to shareholders
Enel Group
Investor Relations
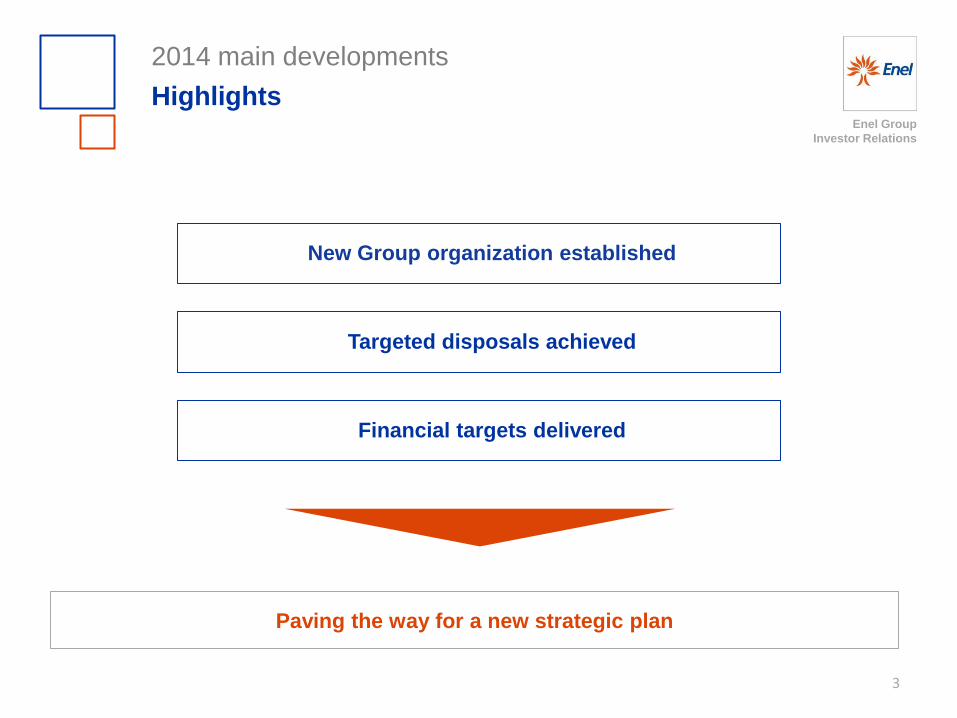
2014 main developments
Highlights
3
New Group organization established
Paving the way for a new strategic plan
Targeted disposals achieved
Financial targets delivered

Enel Group
Investor Relations
2014 main developments
New Group organization established
4
Complex organization
Latam - Iberia different strategic challenges
Fragmented approach to innovation
Multiple decision making centers for capital allocation
Structurally integrated group with focus on synergies
Separation of Endesa and Enersis
New focus on emerging businesses
Global business lines
Challenges Solutions implemented

Enel Group
Investor Relations
2014 main developments
New Group organization established
5
Global
Generation
Global
Infrastructures
& Networks
Renewable
Energies
Upstream
Gas
Global
Trading
Italy
Iberia
Latam
East Europe
Global Business Lines
Re
gio
ns
Simple and focused organization
Customers
Local stakeholders
Regulation
Revenues
Cash flow
EBITDA
Best practices
implementation
Efficiencies in capex &
opex
Capital allocation
EBITDA

Enel Group
Investor Relations
2014 main developments
New Group organization established
6
Listed companies
Unlisted companies
Enel
Enel Iberoamérica
100%
Endesa
Enel Latinoamerica
Enersis
92.06%
100%
20.3%
40.32%
Enel
100%
Endesa
60.62%1
Enersis
70.14%
Enel Iberoamérica
1. Of which 40.32% owned through Enel Latinoamerica, 100% controlled by Enel Iberoamérica
Structure in line with market fundamentals

Enel Group
Investor Relations
2014 main developments
Targeted disposals achieved
7
Proceeds achieved with a different mix of assets
2014 Disposals (€bn)
Sale of 22% Endesa 3.1
Renewables 0.5
Other assets 0.3
Total proceeds 3.9
Target 4
Minorities buy-out and other operations (€bn)
Minorities buy-out Latam -0.6
4.8% of Enersis1 -0.7
Extraordinary dividend Endesa releverage -0.5
Other -0.4
Total -2.2
1. Indirect acquisition via extraordinary dividend from Endesa

Enel Group
Investor Relations
2014 main developments
Financial targets delivered
8
Commitment met despite challenging market conditions
Net ordinary income
Net debt
Recurring EBITDA
Dividend per share
3 €bn
37.41 €bn
15.5 €bn
Actual 2014
0.14 €/sh
3 €bn
372 €bn
15.5 €bn
Targets
≥ 0.13 €/sh
1. Excluding net debt of asset held for sale (0.6 €bn of Slovenske Elektrarne)
2. Target disclosed in March 2014

Enel Group
Investor Relations
2015 Investor day
Agenda
9
2014 main developments Francesco Starace CEO
FY 2014 results Alberto De Paoli CFO
2015-2019 strategic plan Francesco Starace CEO
2015-2019 key financial figures Alberto De Paoli CFO
Closing remarks Francesco Starace CEO

Enel Group
Investor Relations
3,119 2,994
FY 2013 FY 2014
FY 2014 results
Consolidated results (€mn)
10
Revenues Recurring EBITDA1
Net debt3 Group net ordinary income2
-4% -2%
-4%
78,663 75,791
FY 2013 FY 2014
15,769
15,502
FY 2013 FY 2014
39,706
37,383
FY 2013 FY 2014
-6%
1. Excluding capital gains and losses equal to 922 €mn in 2013 and 255 €mn in 2014
2. Excluding extraordinary items equal to +116 € mn in 2013 and -2,477 €mn in 2014
3. Excluding net debt of asset held for sale (+10 €mn in 2013 and -620€mn mainly for Slovenske Elektrarne in 2014)

Enel Group
Investor Relations
FY 2014 results
Group recurring EBITDA (€mn)
11 1. Generation&Energy Management (GEM), Market, Infrastructures and Networks
2. Holding and Services
-1.7%
15,769
+215 -34 -352
-89 +35 -42 15,502
2013 Italy Iberia Latam East Europe
Renewables H&S 2014 1 2

Enel Group
Investor Relations
~7%
~34%
~47%
~12%
FY 2014 results
Group recurring EBITDA analysis (€mn)
12
70% EBITDA from regulated and quasi-regulated businesses
By business
Networks
Generation3 Renewables
Retail
Regulated and quasi-regulated4
15.5 40%
8% 20%
20%
12%
East Europe
1,204
Italy2
6,173
Renewables
1,815
Iberia
3,203
Latam
3,091
By responsibility
15.51
3. Including retail in Iberia
4. Networks, generation with long term PPA (power purchase agreement),
renewables with PPA and generation in the Iberian islands
1. Including Holding and Services (16 €mn)
2. GEM, Market, Infrastructures and Networks

Enel Group
Investor Relations
FY 2014 results
From EBITDA to Group net income (€mn)
13 1. Including accruals to bad debt provisions
2. Including equity income for -35€mn
15,757 -6,243
-6,427
3,087 -3,165
+850 -255 517
Reported EBITDA
D&A Impairment EBIT Net financial expenses
Income taxes Minorities Group net Income
Goodwill imp.
-891
2
1

Enel Group
Investor Relations
FY 2014 results
From Net Income to Net Ordinary Income (€mn)
14
517
+4,062 -1,392
-193 2,994
Group net income
Impairment on net income
Taxes: extraordinary
items
Capital gain Group net ordinary income
2,142
1,460
180
162 EGP
Generation
Italy
East
Europe
Hydro
Aysen
118 Other
1
1. Impairment on net income for ~4.1 €bn derives from: total impairment of ~6,4 €bn, other impairment on equity investments for ~0.2 €bn, lower taxes for
~-1,5 €bn and impairment pertaining to non-controlling interests for ~-1,0 €bn.
Enel Group
Investor Relations
27%
15% 38%
14% 4%
2%
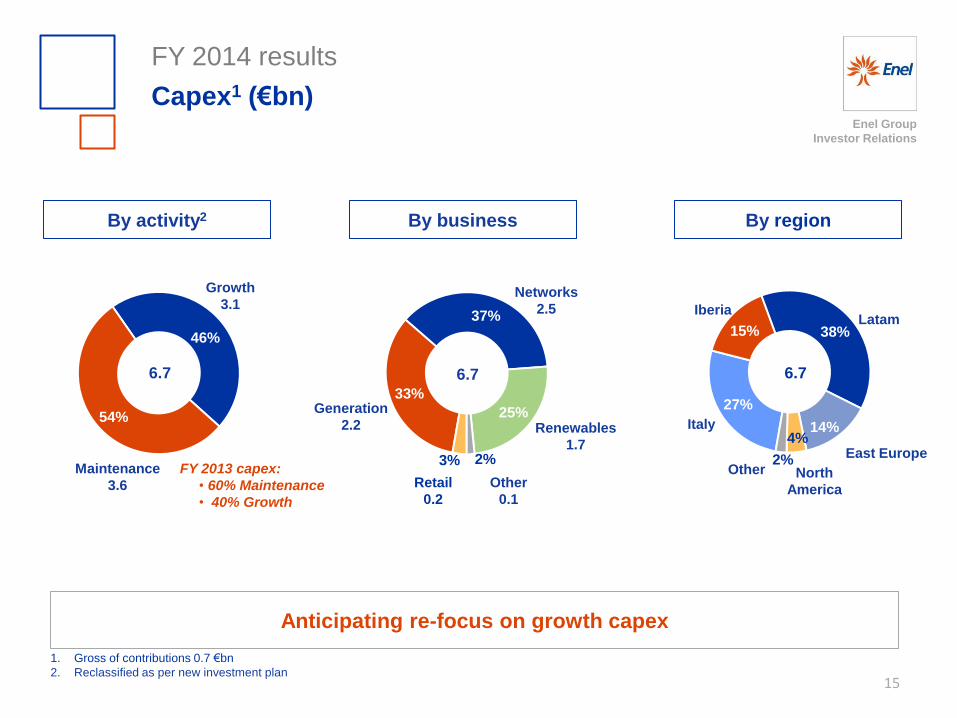
FY 2014 results
Capex1 (€bn)
15
1. Gross of contributions 0.7 €bn
2. Reclassified as per new investment plan
Anticipating re-focus on growth capex
33%
37%
25%
2% 3%
By activity2 By business
46%
54%
Maintenance
3.6
Growth
3.1
6.7 6.7
Networks
2.5
Generation
2.2 Renewables
1.7
Other
0.1
Retail
0.2
By region
FY 2013 capex:
• 60% Maintenance
• 40% Growth
6.7
Iberia Latam
East Europe
North
America
Italy
Other

Enel Group
Investor Relations
FY 2014 results
Net free cash flow (€mn)
16
1.1 €bn of net free cash flow delivered
1. Accruals, releases, utilizations of provisions in EBITDA (i.e. personnel related and risks and charges). It includes bad debt provision accruals equal to 749 €mn
2. Funds from operations after working capital change
3. Gross of contributions
15,502 - 1,974 +506 -1,396
- 2,730
9,908 - 6,701
3,207 -2,068
1,139
Recurring EBITDA
Provisions Working capital
change and other
Income taxes paid
Financial expenses
FFO Gross capex Free cash flow
Net dividend paid
Net free cash flow
1 2 3
Net
Capex
6,038
Enel Group
Investor Relations
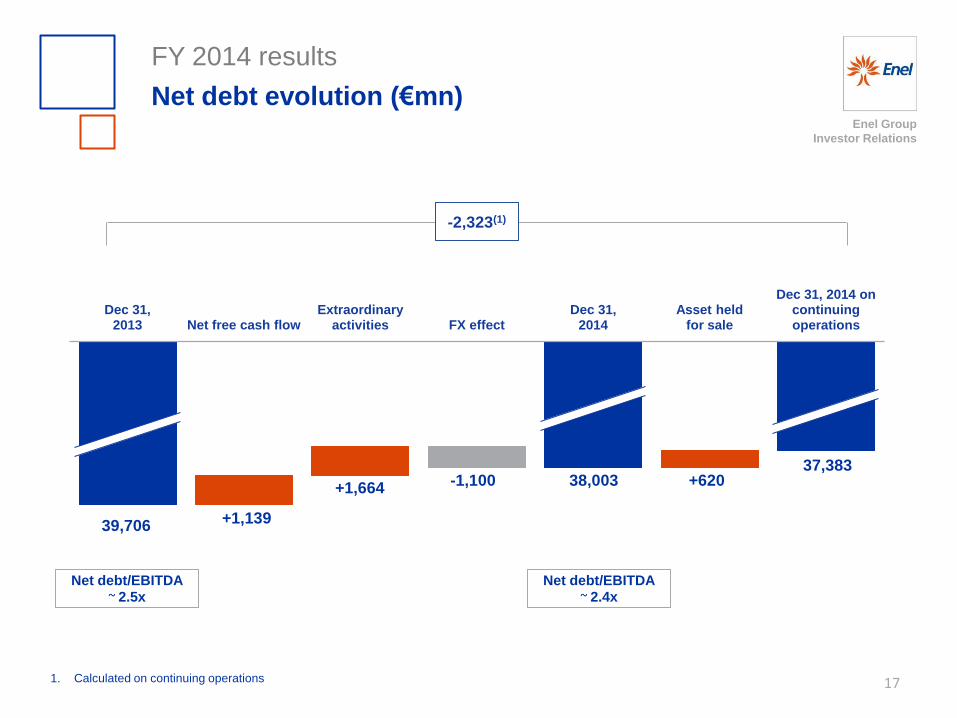
FY 2014 results
Net debt evolution (€mn)
17 1. Calculated on continuing operations
Dec 31, 2013 Net free cash flow
Extraordinary activities FX effect
Dec 31, 2014
Asset held for sale
Dec 31, 2014 on continuing operations
39,706 +1,139
+1,664 -1,100 38,003 +620
37,383
Net debt/EBITDA ~ 2.5x
Net debt/EBITDA ~ 2.4x
-2,323(1)

Enel Group
Investor Relations
2015 Investor day
Agenda
18
2014 main developments Francesco Starace CEO
FY 2014 results Alberto De Paoli CFO
2015-2019 strategic plan Francesco Starace CEO
2015-2019 key financial figures Alberto De Paoli CFO
Closing remarks Francesco Starace CEO

Enel Group
Investor Relations
2015-2019 strategic plan
Enel today
19
Best positioned to capture opportunities
61 mn end users
37 mn smart meters
40 €bn RAB
Leading network operator
56 mn power customers 5 mn gas customers
Leading retail business
9.6 GW installed
Leading renewable operator
Balanced generation portfolio
86 GW installed
31% 7% 5%
17%
18%
22%
Coal
Oil & Gas
Hydro1
Renewables
Nuclear
CCGT ~96 GW
1. Including EGP Hydro operations

Enel Group
Investor Relations
2015-2019 strategic plan
Enel today1
20
Global diversified player
Capacity: 2.1 GW
North America
Capacity: 17.4 GW
End users: 14.4 mn
Latin America
Capacity: 0.8GW
Mexico & Central America
Countries of presence2
Capacity: 66.5 GW
End users: 45.8 mn
Europe
Capacity: 0.1 GW
Africa
Capacity: 9.1 GW
Russia
1. Data as of 31st December 2014
2. Presence with operational assets

Enel Group
Investor Relations
2015-2019 strategic plan
Key global themes in the utility sector
21
Enel well positioned in this context
Demand growth in emerging countries
Technology evolution in mature countries
Technology evolution in renewables
Capex driven towards infrastructure expansion and upgrade
Grid digital transformation and new business models in customer
interaction
Increased penetration in world’s energy mix

Enel Group
Investor Relations
2015-2019 strategic plan
Key global themes in the utility sector: emerging
countries
22
Key growth drivers
6.3 bn people will live in urban areas from 3.9
bn of today by 2050
Electricity consumption per capita
expected to increase by 30% by 2030
800 million people will get into the “middle
class” segment by 2030
1.5 bn people in Africa, Latam and Asia will
gain access to electricity by 2030
1. 2014 data
2. East Africa, Middle East, Asia-Pacific
3. Including renewables and conventional generation
Enel positioning1
Countries of
presence
Countries of
interest
End users: ~ 15 mn
Installed capacity: ~ 27 GW
Areas under
screening2
Strategic Pipeline: ~ 20 GW3

Enel Group
Investor Relations
2015-2019 strategic plan
Key global themes in the industry: mature countries
23 Enel elaboration on “Beyond the storm –value growth in the EU power sector ” McKinsey & Company, December 2014
1 Calculated on EBIT
2 Energy efficiency, distributed generation
New business opportunities
> 80% digitalized
Enel positioning
Free Power & Gas customers: ~22 mn
End users : ~ 46 mn
Large scale innovation in infrastructure
(storage, electric vehicles, smart grids)
Market integration through storage diffusion
Active customer and new home services
Innovation tech. for integrated energy services
Market value1
(€bn)
20 28
14
2020
42
2013
27
7
T&D
New Downstream2
15
Enel Group
Investor Relations
2015-2019 strategic plan
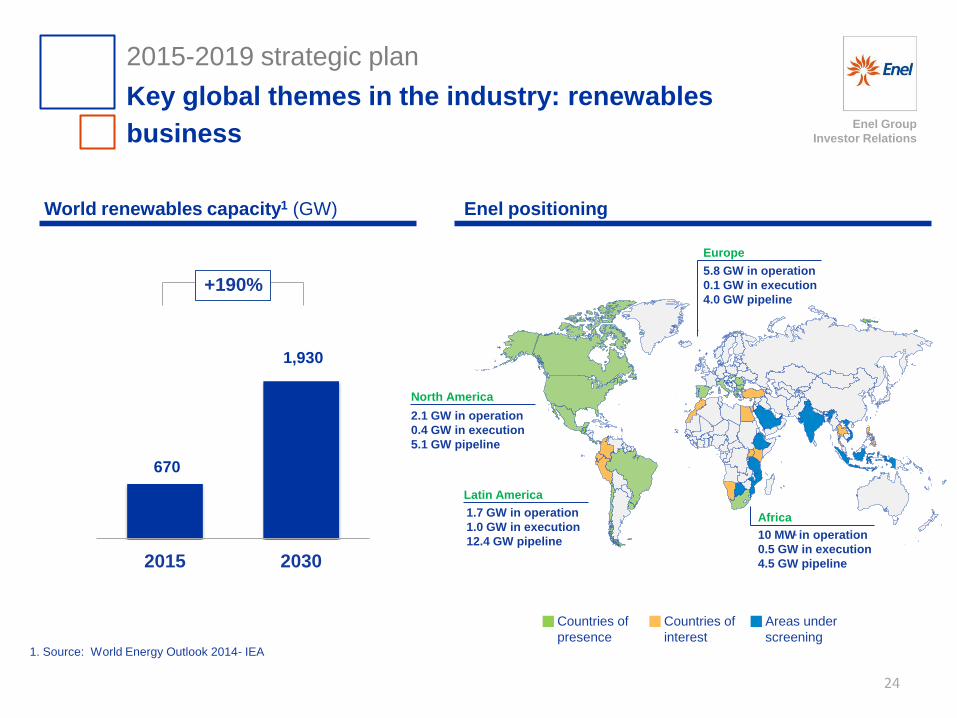
Key global themes in the industry: renewables
business
24
World renewables capacity1 (GW) Enel positioning
1. Source: World Energy Outlook 2014- IEA
+190%
670
1,930
2015 2030
Countries of
presence
Countries of
interest
Areas under
screening
2.1 GW in operation
0.4 GW in execution
5.1 GW pipeline
North America
1.7 GW in operation
1.0 GW in execution
12.4 GW pipeline
Latin America
5.8 GW in operation
0.1 GW in execution
4.0 GW pipeline
Europe
10 MW in operation
0.5 GW in execution
4.5 GW pipeline
Africa
Enel Group
Investor Relations
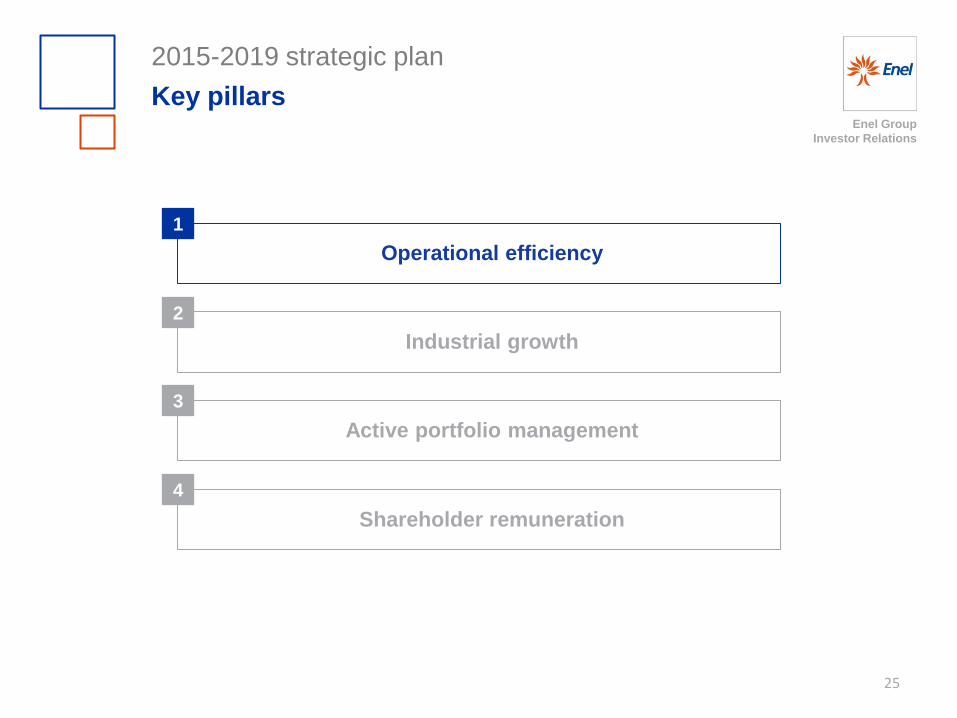
2015-2019 strategic plan
Key pillars
25
Operational efficiency
Industrial growth
Active portfolio management
Shareholder remuneration
1
2
3
4

Enel Group
Investor Relations
2015-2019 strategic plan
Operational efficiency (€bn)
26
Opex1
Maintenance capex2
1. Total fixed costs in nominal terms (net of capitalizations). Reclassified as per new strategic plan criteria
2. Gross capex. Reclassified as per new strategic plan criteria
3. Net of perimeter effect
Leverage on new
organizational structure:
integration and technology
sharing
Distribution and Generation:
best practice sharing and
capital allocation
optimization
Efficiency focus and optimization of maintenance capex
9.9 9.2 9.2
2014 2016 2019
3
-7%
3.6
3.2 3.0
2014 2016 2019
-10%
13.5
12.4 12.2
2014 2016 2019
-8%
Cash costs
3 3
3

Enel Group
Investor Relations
2015-2019 strategic plan
Operational efficiency: focus on opex1
27
44.6 41.3
2019 2014
-7%
76.0 70.0
2019 2014
-8%
58.5 51.7
2019 2014
-12%
Renewables
Networks
Conventional Generation
k€/MW
€/end user
k€/MW
• Capacity shut down for ca. 13 GW2
• Profitability assessment of each power plant
• Workforce redeployment to increase efficiency
• Leverage global procurement
• Network digitalization
• Centralized planning
• Workforce management using mobile devices
• Leverage global procurement
Pursuing efficiency across all the businesses
• Economies of scale
• O&M best practice standardization
• Maintenance contract optimization
1. In nominal terms
2. Cumulative 2014-19
24% 21%
2014
-10%
2019
Staff % of Total
Fixed Costs • Cost Reduction for Holding and Country
Services via in-sourcing and headcount
reduction

Enel Group
Investor Relations
2015-2019 strategic plan
Operational efficiency: focus on maintenance
capex (€bn)
28
Maintenance capex1
1. Gross Capex.
2. Previous Plan (16.6 €bn) + contributions (2.0 €bn) + reclassification as per new plan criteria (-1.3 €bn)
3. Reclassified as per new plan criteria
Optimizing maintenance capex through global integration
4.4
3.8
Previous New
-14%
11.0
9.8
Previous New
17.32
15.7
Previous Plan 2014-18
New Plan 2015-19
-9%
Conventional Generation
Networks3
-11%

Enel Group
Investor Relations
2015-2019 strategic plan
Key pillars
29
Operational efficiency
Industrial growth
Active portfolio management
Shareholder remuneration
1
2
3
4
Enel Group
Investor Relations
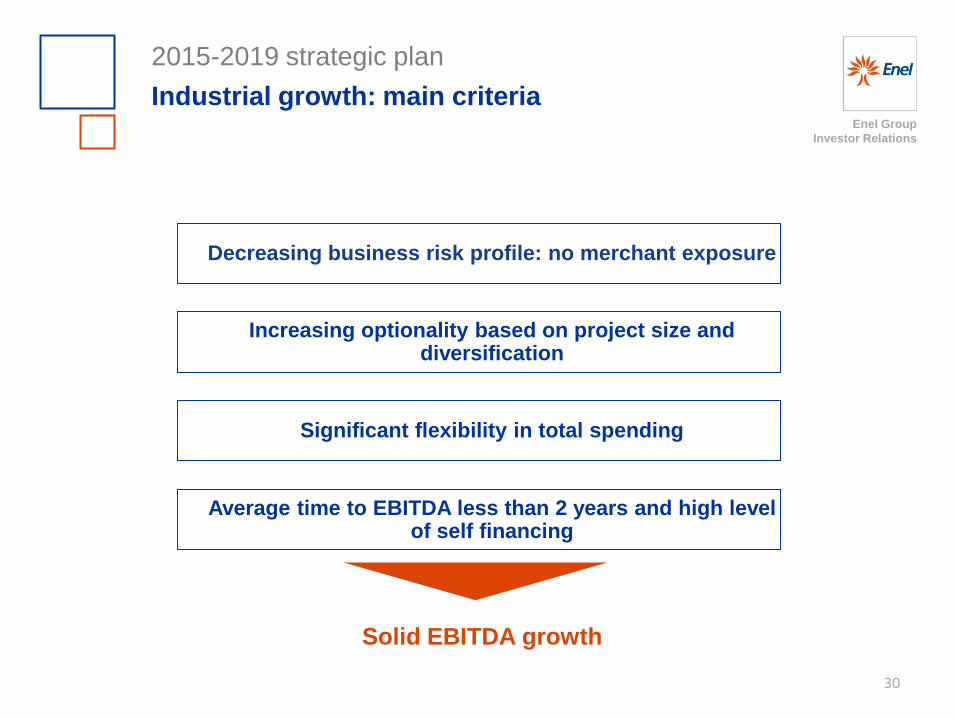
2015-2019 strategic plan
Industrial growth: main criteria
30
Solid EBITDA growth
Decreasing business risk profile: no merchant exposure
Increasing optionality based on project size and diversification
Significant flexibility in total spending
Average time to EBITDA less than 2 years and high level of self financing

Enel Group
Investor Relations
17.3 15.7
12.4 18.3
Previous plan 2014-18 New Plan 2015-19
Maintenance Growth
2015-2019 strategic plan
Industrial growth (€bn)
31
+6 €bn of growth capex vs previous plan
Capex plan1
58%
42%
Previous Plan
New Plan
46% 54%
Maintenance
17.3
Growth
12.4
Maintenance
15.7
Growth
18.3
29.7
34.0
-9%
+48%
34.0
29.7
2
2
1. Gross of contributions (2.9 €bn in previous plan and 2.6 €bn in new plan)
2. Reclassification as per new plan criteria

Enel Group
Investor Relations
2015-2019 strategic plan
Industrial growth (€bn)
32
1. Gross Capex
2. Networks, generation with long term PPA (power purchase agreement), renewables with PPA and generation in the Iberian islands
3. Mainly Egypt, South Africa, Morocco, Turkey
Accelerating high quality growth and value creation
Growth capex by Business1
2%
20%
30% 48%
Renewables
Networks
18.3
Generation Retail
Spread over WACC
min 200 bps
Average time to EBITDA
< 2 years
Regulated
and quasi-regulated2
7%
11%
9%
18%
49%
6%
Growth capex by Geography1
18.3
Iberia
Latam Italy
North
America Rest of
Europe
RoW3

Enel Group
Investor Relations
2015-2019 strategic plan
Industrial growth: EBITDA (€bn)
Solid and reliable growth
90% of additional EBITDA in
regulated and quasi
regulated activities
~ 1 €bn EBITDA growth at
2016 from projects under
execution
~ 2.4 €bn EBITDA growth in
2019
33
15% 9%
29%
47%
~6.7
Renewables
Networks
Generation Retail
Growth EBITDA
Additional growth EBITDA by business
(cumulative 2015-19)
0.4
1.3
2.4
2015 2017 2019 2015-19
6.7

Enel Group
Investor Relations
Networks
+3.6 mn end users +11 mn smart meters
End users (mn)
2015-2019 Strategic Plan
Industrial growth
34
Retail
+4.5 mn new customers in power & gas free market
Conventional generation
+720 MW in Latam
0.7GW under construction at 2019
61 65
2014 2019
Renewables
+7.1 GW
21.5 26.0
2014 2019
Free Customer base (mn)
Total 2019 Capacity: 71 GW Total 2019 Capacity: 16 GW3
32% 16%
4%
20% 17%
11%
Coal
Oil & Gas
Hydro2 Renewables
Nuclear
CCGT
~87 GW1
31% 7% 5%
17%
18% 22%
Coal
Oil & Gas
Hydro2 Renewables
Nuclear
CCGT ~96 GW
2014 2019
1. Net of assets held for sale
2. Including EGP Hydro operations
3. Net of disposals.
Smart meters (mn)
37
48

Enel Group
Investor Relations
Spread over WACC2 200/300 bps Growth EBITDA in 2019 ~0.8 €bn
2015-2019 strategic plan
Industrial growth: networks (€bn)
Stable returns over 40 €bn
RAB
Strong focus on new
technologies in Europe
+11 mn smart meters
installed
40% decrease of average
interruptions in Latam
35 1. Gross Capex
2. Regulated WACC
Average time to EBITDA
< 2 years
Growth capex1 by project Growth capex1 by region
RoW
Latam
Iberia
Italy
4% 22%
37% 37%
5.4
17%
11%
40%
26%
6%
Commercial
losses Latam
Quality
New connections
Smart Grids
Smart Meters
5.4

Enel Group
Investor Relations
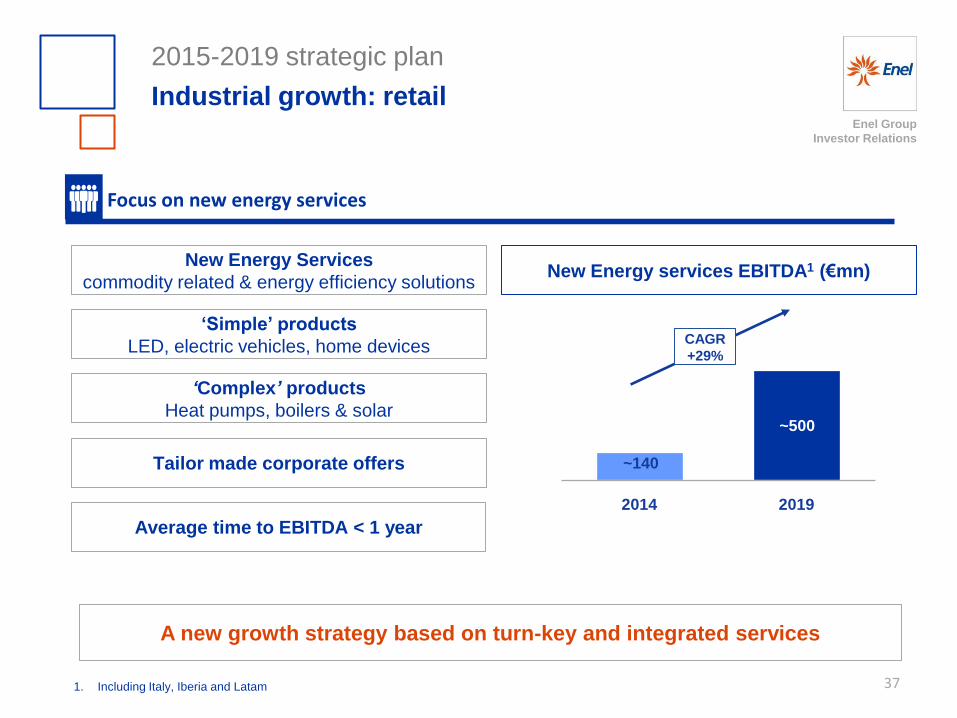
2015-2019 strategic plan
Industrial growth: retail
36
3.5 4.0
1.2
1.7
2014 2019
5.5 8.0
11.3
12.0
2014 2019
Gas customers (mn) Power customers (mn)
5.7
4.7
+19% +21%
Focus on free market
Iberia
Italy 20.0
16.8
26mn total free market customers by 2019 in Italy and Iberia
Cross selling and anti-churn
actions
Innovation of new energy
service offerings
Digitalization, big data as
enabler of new home
products and services
Enel Group
Investor Relations
2015-2019 strategic plan
Industrial growth: retail
37
Focus on new energy services
A new growth strategy based on turn-key and integrated services
New Energy services EBITDA1 (€mn)
~140
~500
2014 2019
New Energy Services
commodity related & energy efficiency solutions
‘Simple’ products
LED, electric vehicles, home devices
‘Complex’ products
Heat pumps, boilers & solar
Tailor made corporate offers
CAGR
+29%
Average time to EBITDA < 1 year
1. Including Italy, Iberia and Latam

Enel Group
Investor Relations
2015-2019 strategic plan
Industrial growth: renewables
38
Leverage sector growth
trends
Predictable cash-flows
Diversification reduces
risk profile
Close to 50% of additional
capacity addressed
Spread over WACC 200/300 bps Growth EBITDA in 2019 ~1€bn
Average time to EBITDA
< 2 years
13% 21%
38% 6%
22% 7.1 GW
Rest of
Latam
Europe
Brazil
Chile
Mexico
North
America
New
countries
Additional capacity Growth capex 1
13% 15%
47% 6%
19% 8.8 €bn
Rest of
Latam
Europe
Brazil
Chile
Mexico
North
America
New
countries
1. Gross Capex
Enel Group
Investor Relations
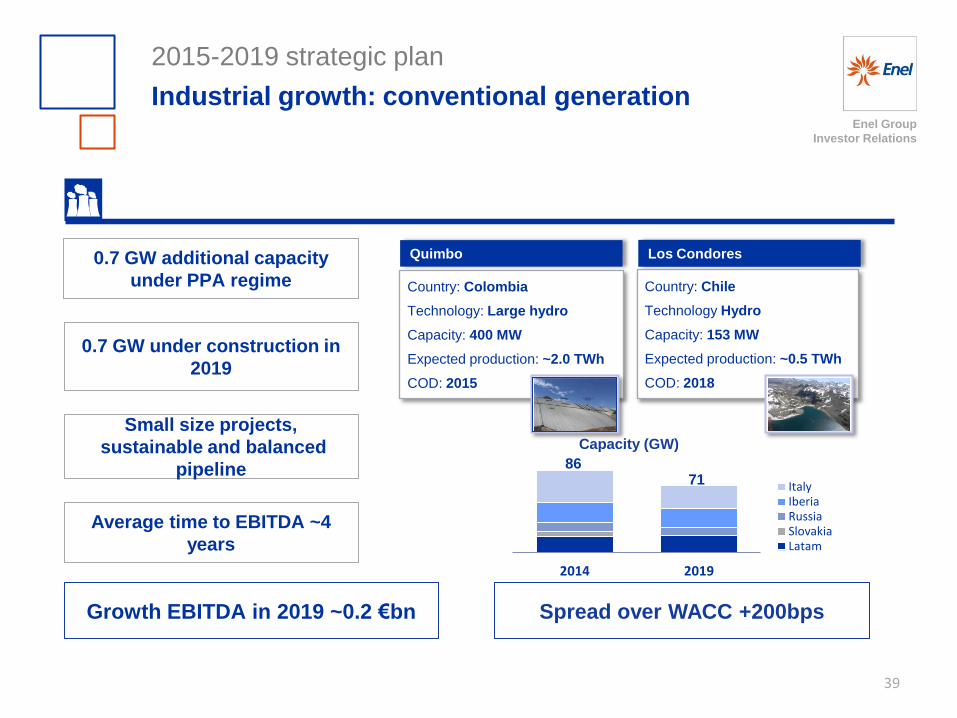
2015-2019 strategic plan
Industrial growth: conventional generation
39
Quimbo
Country: Chile
Technology Hydro
Capacity: 153 MW
Expected production: ~0.5 TWh
COD: 2018
Country: Colombia
Technology: Large hydro
Capacity: 400 MW
Expected production: ~2.0 TWh
COD: 2015
Los Condores
Spread over WACC +200bps
0.7 GW additional capacity
under PPA regime
Growth EBITDA in 2019 ~0.2 €bn
2014 2019
Italy Iberia Russia Slovakia Latam
86 71
Small size projects,
sustainable and balanced
pipeline
0.7 GW under construction in
2019
Average time to EBITDA ~4
years
Capacity (GW)

Enel Group
Investor Relations
2015-2019 strategic plan
Key pillars
40
Operational efficiency
Industrial growth
Active portfolio management
Shareholder remuneration
1
2
3
4

Enel Group
Investor Relations
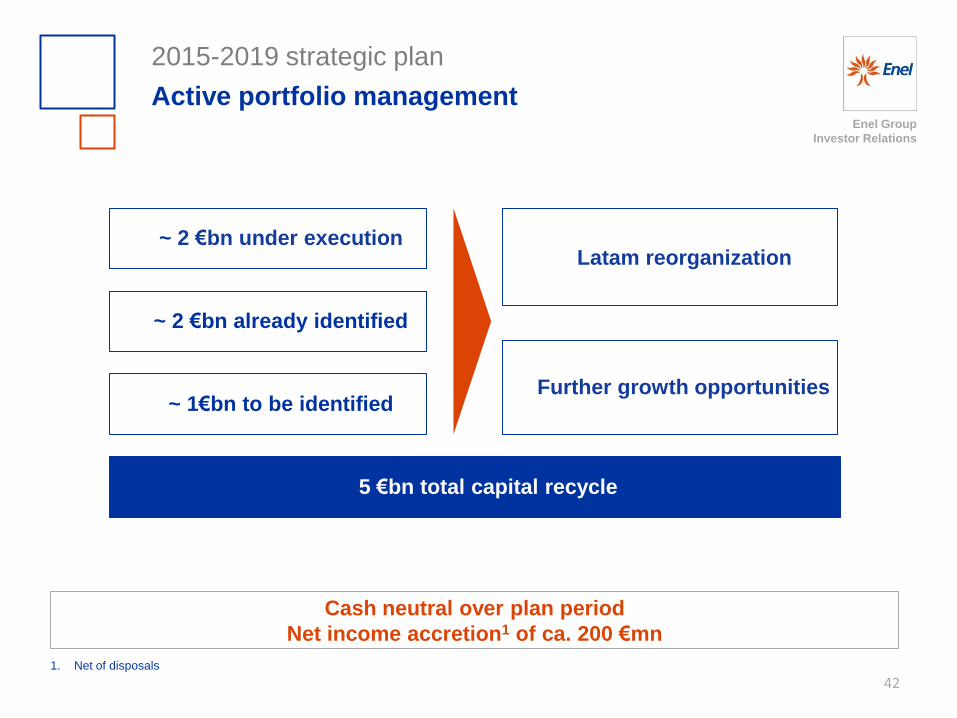
2015-2019 strategic plan
Active portfolio management
41
~5% of total group invested capital
All assets under ongoing review
Capital recycling to drive higher returns
Providing additional resources to fuel growth
Consistency with the strategic plan
Enel Group
Investor Relations
2015-2019 strategic plan
Active portfolio management
42
Cash neutral over plan period
Net income accretion1 of ca. 200 €mn
~ 2 €bn under execution
~ 2 €bn already identified
~ 1€bn to be identified Further growth opportunities
Latam reorganization
5 €bn total capital recycle
1. Net of disposals

Enel Group
Investor Relations
2015-2019 strategic plan
Key pillars
43
Operational efficiency
Industrial growth
Active portfolio management
Shareholder remuneration
1
2
3
4
Enel Group
Investor Relations
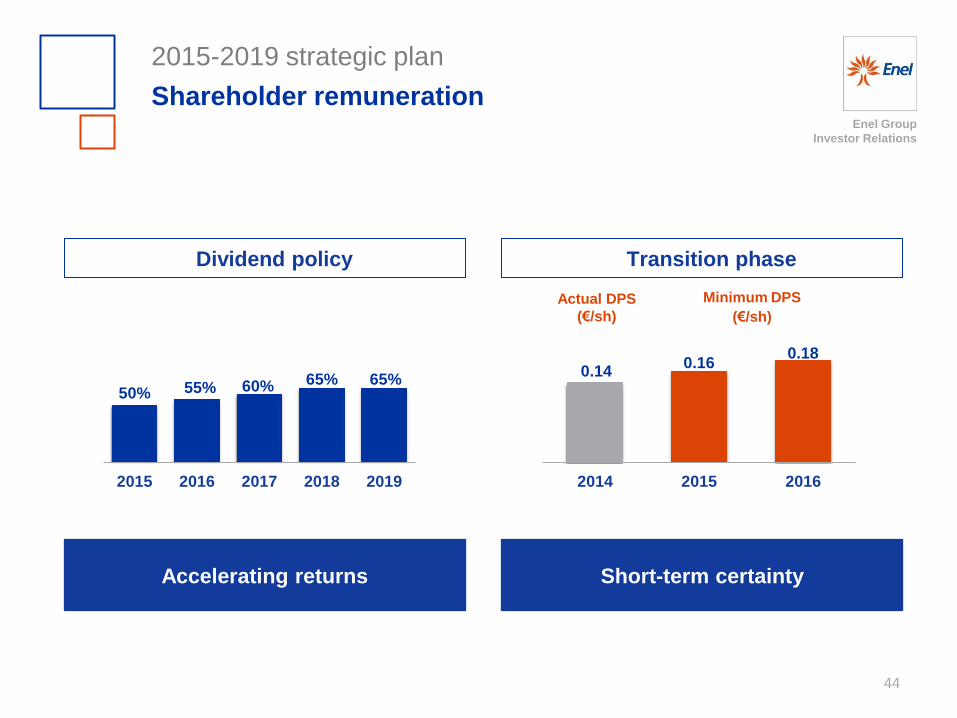
0.14 0.16
0.18
2014 2015 2016
50% 55% 60% 65% 65%
2015 2016 2017 2018 2019
2015-2019 strategic plan
Shareholder remuneration
44
Transition phase
Minimum DPS
(€/sh)
Dividend policy
Accelerating returns Short-term certainty
Actual DPS
(€/sh)

Enel Group
Investor Relations
2015 Investor day
Agenda
45
2014 main developments Francesco Starace CEO
FY 2014 results Alberto De Paoli CFO
2015-2019 strategic plan Francesco Starace CEO
2015-2019 key financial figures Alberto De Paoli CFO
Closing remarks Francesco Starace CEO
Enel Group
Investor Relations
2015-2019 key financial figures
Introduction
46
EBITDA and Net income evolution
Financial plan and strategy
Focus on cash flow generation
1
2
3

Enel Group
Investor Relations
2015-2019 key financial figures
EBITDA evolution (€bn)
47
15.5
~+2.4 ~+1 ~-0.7
~-0.5 ~-0.7 ~17
FY 2014 Growth Efficiency Regulatory Scenario Disposals FY 2019E
+10%

Enel Group
Investor Relations
2015-2019 key financial figures
EBITDA evolution (€bn)
Decreasing business risk profile
48
7%
34%
47%
12%
9%
31%
45%
15%
~70%
Regulated and
quasi-regulated
~75%
Regulated and
quasi-regulated
Networks
Renewables
Retail
Generation2
Regulated and quasi-
regulated
15.51 ~171
1. Including Holding and Services
2. Including retail in Iberia
2014 2019
40%
20% 20%
8%
12%
35%
21% 25%
4%
15%
Latam
East Europe
Italy
Iberia
15.51 ~171 Renewables
Enel Group
Investor Relations
∆
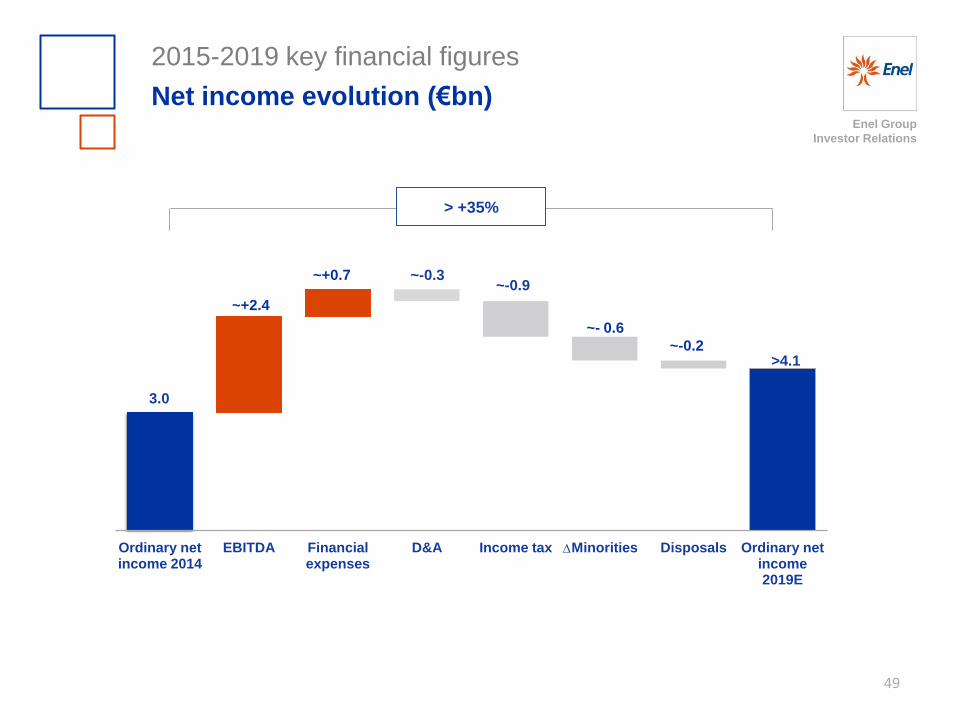
2015-2019 key financial figures
Net income evolution (€bn)
49
Ordinary net income 2014
EBITDA Financial expenses
D&A Income tax Minorities Disposals Ordinary net income 2019E
> +35%
>4.1 ~-0.2
3.0
~+2.4
~+0.7 ~-0.3 ~-0.9
~- 0.6

Enel Group
Investor Relations
2015-2019 key financial figures
Financial plan and strategy
50
Target of ca. 20% reduction in financial expenses on debt by 2019
Actions completed
Repayment of 4.3 €bn debt at maturity
Liability management
Bond Tender/Exchange (~2.2 €bn)
Committed revolving credit line renegotiation
(~11.6 €bn)
Pre-hedge operations (~4 - 5€bn)
Total annual savings vs 2014 >300 €mn
Further actions
Further repayment of debt at maturity
with excess cash
Further liability management actions
Additional pre-hedge operations to catch
opportunities in low yield environment
Debt maturity extension
Optimized mix of fixed and floating
of the next bond issuances

Enel Group
Investor Relations
2015-2019 key financial figures
Financial plan and strategy
51
37.4 39.2 38.6 36.3
6.5 4.5 4.5 4.7
13.1 8.1 6.1 5.7
2014 2015 2016 2019
Gross and Net Debt (€bn)
-10.3
6.5%
5.4% 5.1%
5.0%
0.0%
1.0%
2.0%
3.0%
4.0%
5.0%
6.0%
2014 2015 2016 2019
Net Financial expenses on Debt (€bn)
-20%1
Net financial exp.
2.4x 2.1x Net debt/EBITDA
2.8 2.6 2.5 2.3
57.0 51.8 49.2
46.7
Financial receivables
Net debt
Cash Cost of gross debt
Cost of net debt
1. On interest expenses on debt

Enel Group
Investor Relations
2015-2019 key financial figures
Growth plan funding (€bn)
52
Additional
Investments
Growth capex
previous
plan
12.4
18.3
Growth
capex new
plan
~2.52
~6 ~1.5
~1.5
Efficiencies on opex
Efficiencies
on maintenance capex
25% self-financing1
1. Self financing on additional investments (EBITDA net of taxes)
2. Post tax
~12 Savings on financial
expenses
Additional growth fully funded by efficiencies and cash flow
Enel Group
Investor Relations
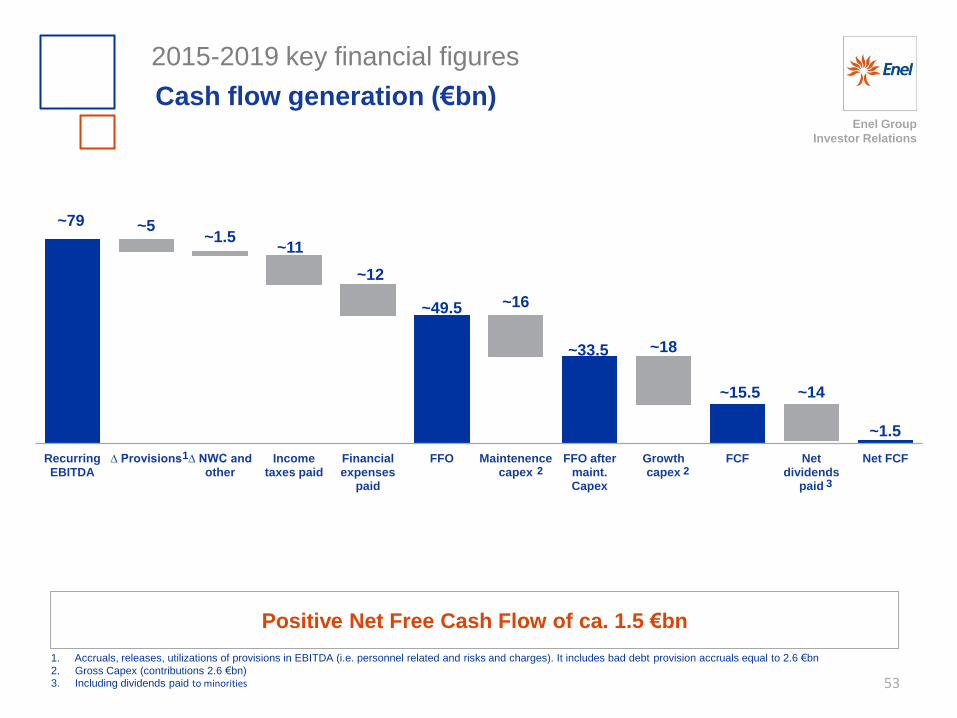
~79 ~5 ~1.5
~11
~12
~49.5 ~16
~33.5 ~18
~15.5 ~14
~1.5
Recurring EBITDA
∆ Provisions ∆ NWC and other
Income taxes paid
Financial expenses
paid
FFO Maintenence capex
FFO after maint. Capex
Growth capex
FCF Net dividends
paid
Net FCF
3 2 2
1
2015-2019 key financial figures
Cash flow generation (€bn)
1. Accruals, releases, utilizations of provisions in EBITDA (i.e. personnel related and risks and charges). It includes bad debt provision accruals equal to 2.6 €bn
2. Gross Capex (contributions 2.6 €bn) 3. Including dividends paid to minorities 53
Positive Net Free Cash Flow of ca. 1.5 €bn

Enel Group
Investor Relations
2015 Investor day
Agenda
54
2014 main developments Francesco Starace CEO
FY 2014 results Alberto De Paoli CFO
2015-2019 strategic plan Francesco Starace CEO
2015-2019 key financial figures Alberto De Paoli CFO
Closing remarks Francesco Starace CEO

Enel Group
Investor Relations
Free cash flow generation of 15.5 €bn
Growth EBITDA of 2.4 €bn in 2019: +10% vs 2014
Efficiency – ~5 €bn over the plan
Attractive return to shareholders – Target payout 65%
Plan delivers
2015 Investor day
Closing remarks
55

Enel Group
Investor Relations
56
2015 Investor day
Closing remarks
Net ordinary income
Minimun DPS
Recurring EBITDA
Pay-out
~3.0
0.16 €/sh
~15.0
2015
50%
~ 3.1
0.18 €/sh
~15.0
2016
55%
~3.4
~15.6
2017
60%
~+10%
~+17%
~+3%
CAGR (%)
2015-19
+7%
FFO/Net Debt 21% 24% 27% ~+9%
2015-19 Strategic plan
annexes
57
Enel Group
Investor Relations
7
9
11
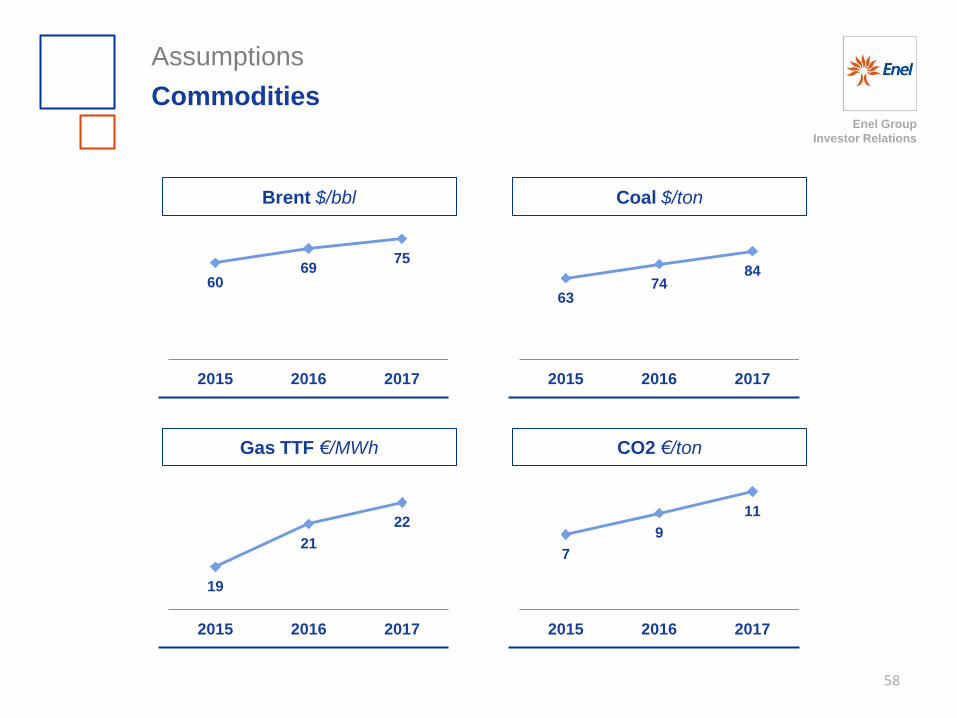
2015 2016 2017
63 74
84
2015 2016 2017
Assumptions
Commodities
60 69
75
2015 2016 2017
Brent $/bbl Coal $/ton
19
21
22
2015 2016 2017
Gas TTF €/MWh CO2 €/ton
58

Enel Group
Investor Relations
Assumptions
Macroeconomics
1. Argentina, Brazil, Chile (CIS), Colombia, Peru .GDP weighted by real levels
2. Argentina, Brazil, Chile (CIS), Colombia, Peru. Average growth weighted by Enel’s production
1.4% 1.6% 1.8%
0.6%
1.1% 1.3%
1.9% 3.2%
3.4%
2015 2016 2017
Spain Italy Latam
2.5% 2.0% 1.8%
0.8% 1.0% 1.2%
4.5% 4.6% 4.1%
2015 2016 2017
Spain Italy Latam
1.13
1.17
1.22
2015 2016 2017
GDP Electricity demand (yoy) FX - €/$
1 2
59
47
52
55
2015 2016 2017
Power Prices ITA €/Mwh Power Prices Spain €/Mwh
46
52
57
2015 2016 2017

Enel Group
Investor Relations
Focus on efficiency (€bn)
Strategic plan 2015-19
1.Total Fixed Costs (net of Capitalizations)
+0.5
+0.7 -0.2 -1.1
-0.5
9.2
9.7
9.9
2019 Disposals 2019 Efficiency FX Growth CPI 2014
3.8 2.7
Conventional
generation
2019 2014
0.7 1.2
Renewables
2019 2014
3.6 3.4
Networks
2019 2014
4.1 3.6 Retail, services
and other
2019 2014
CAGR
-2.6%
-1%
11.5%
-6.4%
Opex evolution1 Opex by business
60
Enel Group
Investor Relations
2015-2019 strategic plan
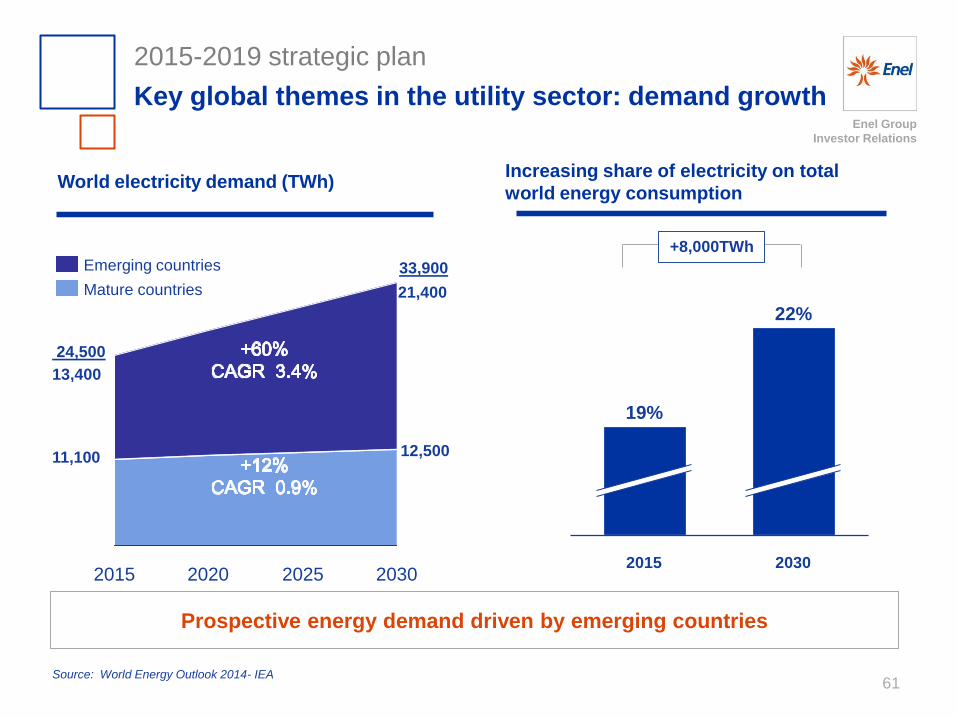
Key global themes in the utility sector: demand growth
61 Source: World Energy Outlook 2014- IEA
2030 2015
19%
22%
Increasing share of electricity on total
world energy consumption
+8,000TWh
Prospective energy demand driven by emerging countries
World electricity demand (TWh)
13,400
11,100
+60%
+12%
(’15-’30)
24,500
2025 2020 2030 2015
Mature countries
Emerging countries
21,400
12,500
33,900

Enel Group
Investor Relations
Strategic plan 2015-19: focus on divisions
Italian operations: targets1
62
Conventional generation Networks Retail
1. Gross of disposals 2. Gross Capex 3. Including Services
2015 2017 2016 2015 2017 2016
~3.7
~0.8
~1.2
~5.93
~3.4
~0.6
~1.3
~5.23
~3.4
~0.9
~1.3
~5.63
~1.3
~0.3
~0.2
~1.83
~1.4
~0.2
~0.1
~1.83
~1.3
~0.2
~0.1
~1.63
Capex2 (€bn) EBITDA (€bn)

Enel Group
Investor Relations
Strategic plan 2015-19: focus on divisions
Iberia: targets1
63
1. Gross of disposals
2. Gross Capex
3. Including Services
~1.03 ~1.13
~3.13 ~3.23
2015 2017 2016 2015 2017 2016
~1.13
~3.13
Capex2 (€bn) EBITDA (€bn)
Networks Conventional generation and Retail
~1.3 ~1.4 ~1.4
~1.8 ~1.7 ~1.8
~0.4 ~0.5 ~0.4
~0.6 ~0.7 ~0.7

Enel Group
Investor Relations
Strategic plan 2015-19: focus on divisions
Latam: targets1
64
1. Gross of disposals
2. Gross Capex
3. Including Services
~2.13
~1.73
~3.73
~4.33
2015 2017 2016 2015 2017 2016
~1.83
~4.23
Capex2 (€bn) EBITDA (€bn)
Networks Conventional generation
~2.1 ~2.5 ~2.5
~1.6 ~1.7 ~1.8
~1.0 ~0.8 ~0.7
~1.1 ~1.0 ~1.0

Enel Group
Investor Relations
Strategic plan 2015-19: focus on divisions
East Europe operations: targets1, 2
65
~0.3 ~0.3
~0.5
~0.6
2015 2017 2016 2015 2017 2016
~0.3
~0.6
1. Net of assets held for sale
2. Gross of disposals
3. Gross Capex
Capex3 (€bn) EBITDA (€bn)

Enel Group
Investor Relations
Strategic plan 2015-19: focus on divisions
Renewables: targets1
66 1. Net of disposals 2. Gross Capex
~2.1 ~1.9
~2.1
2015 2017 2016
~1.8
~2.1 ~2.0
2015 2017 2016
Capex2 (€bn) EBITDA (€bn)
Enel Group
Investor Relations
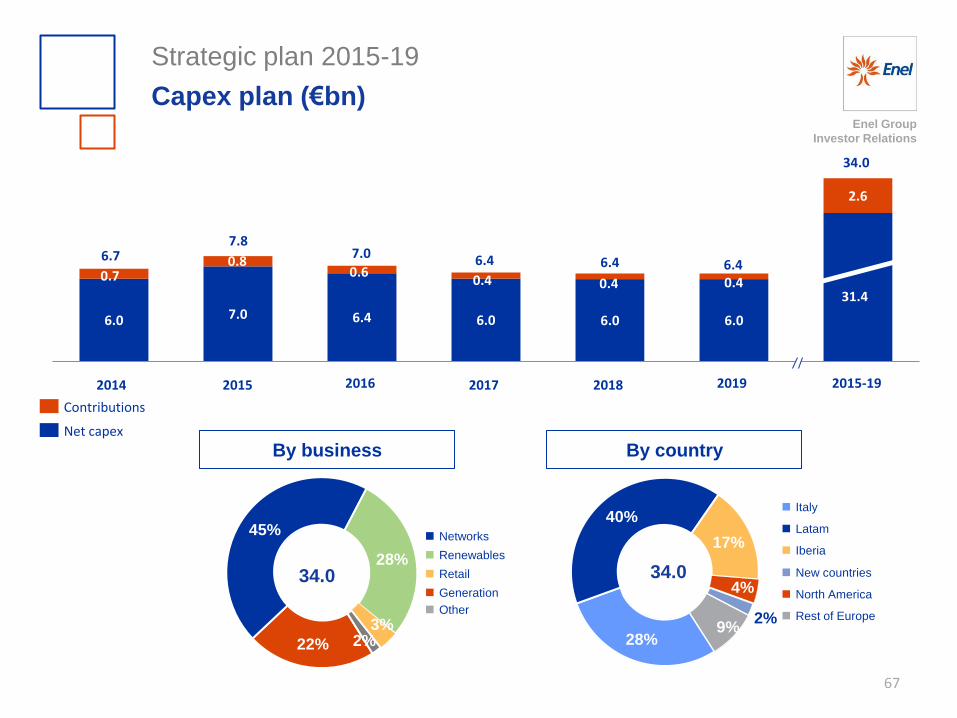
Capex plan (€bn)
6.0 7.0 6.4 6.0 6.0 6.0
2.6
2018
6.4
0.4 0.4 6.4
2019
31.4
34.0
2015-19
0.7
6.7
2014
7.8
2015
0.6 0.8
7.0
2016
0.4
2017
6.4
Net capex
Contributions
Strategic plan 2015-19
67
28%
40%
17%
4%
2% 9%
34.0
22%
45%
28%
3% 2%
34.0
By business By country
Networks
Renewables
Retail
Generation
Other
Latam
Italy
Iberia
New countries
North America
Rest of Europe

Enel Group
Investor Relations
CO2 specific emissions performance and target of reduction (gCO2/kWheq.)
Carbon Neutrality
-35% -32%
-15%
396
68
618
465
418 396 395
1990 2007 2012 2013 2014 2020 2050
<380
Strategic plan 2015-19
New CO2 reduction Target

FY 2014 results
annexes
Enel Group
Investor Relations
1. 2013 restated due to the application of IFRS 11
2. Continuing operations & including third parties
3. Excluding capital gains, losses and one-off items
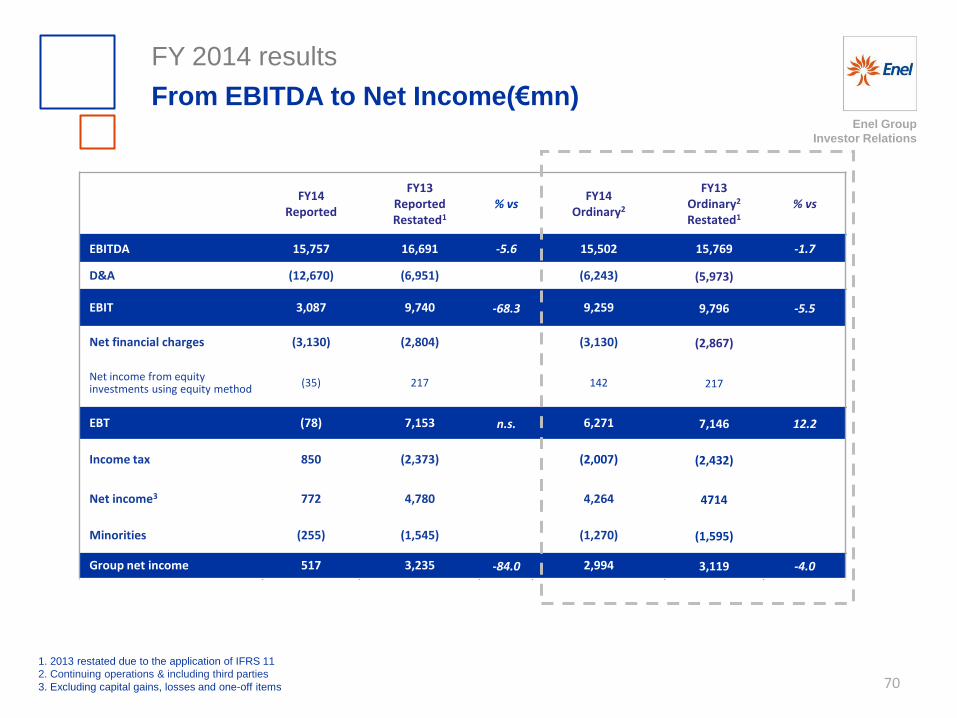
FY14 Reported
FY13 Reported Restated1
% vs FY14
Ordinary2
FY13 Ordinary2 Restated1
% vs
EBITDA 15,757 16,691 -5.6 15,502 15,769 -1.7
D&A (12,670) (6,951) (6,243) (5,973)
EBIT 3,087 9,740 -68.3 9,259 9,796 -5.5
Net financial charges (3,130) (2,804) (3,130) (2,867)
Net income from equity investments using equity method
(35) 217 142 217
EBT (78) 7,153 n.s. 6,271 7,146 12.2
Income tax 850 (2,373) (2,007) (2,432)
Net income3 772 4,780 4,264 4714
Minorities (255) (1,545) (1,270) (1,595)
Group net income 517 3,235 -84.0 2,994 3,119 -4.0
FY 2014 results
From EBITDA to Net Income(€mn)
70

Enel Group
Investor Relations
FY 2014 results
Focus on taxes (€mn)
71
-850
+1,392
+1,465 2,007 -366
-243
+747 +77
Income Taxes 2014
Tax credit on extraordinary
items
Impairment impact and
capital gains
Ordinary taxes
Deferred Taxes (RHT)
Deferred taxes - tax
reform LATAM
Deferred taxes - tax
reform Spain
Other Pro-forma taxes 2014
2,222
Ordinary items Extraordinary items
Proforma tax rate equal to 33.7%
Enel Group
Investor Relations
FY 2014 results
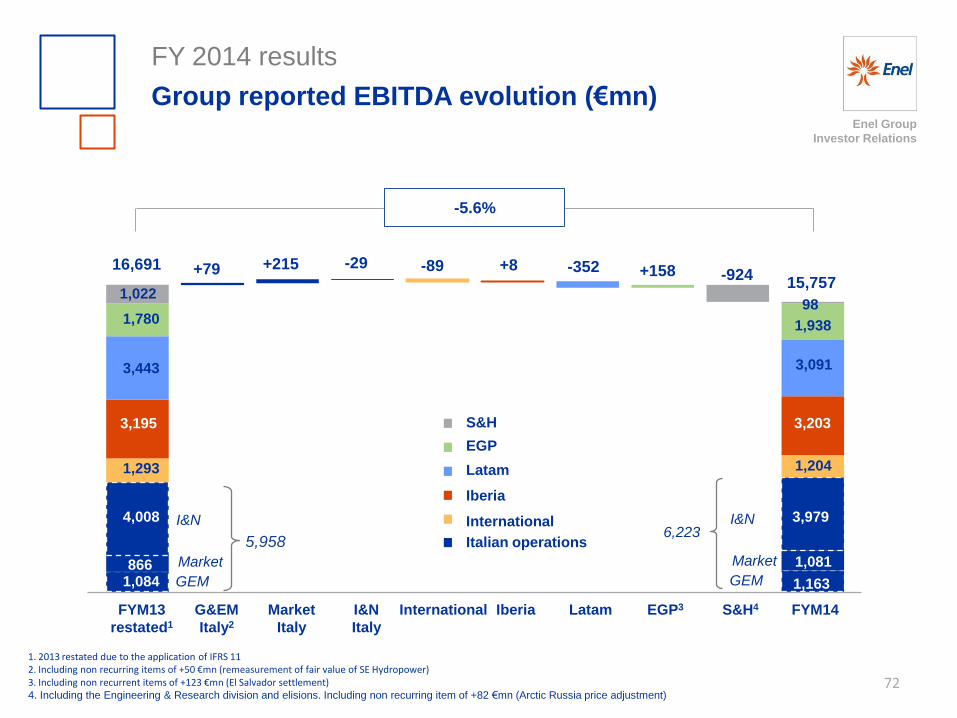
Group reported EBITDA evolution (€mn)
72
16,691 15,757
FYM13
restated1
G&EM
Italy2
Market
Italy
I&N
Italy
Iberia S&H4 FYM14 International EGP3
S&H
Italian operations
Iberia
International
EGP
+79 -29 -89 +8 -352 +158
4,008 3,979
1,293 1,204
3,443 3,091
1,084 1,163
866
1,780
1,081
6,223
1,938
98 1,022
+215
I&N
Latam
Latam
3,195 3,203
-924
-5.6%
Market
GEM
5,958
I&N
Market
GEM
1. 2013 restated due to the application of IFRS 11 2. Including non recurring items of +50 €mn (remeasurement of fair value of SE Hydropower) 3. Including non recurrent items of +123 €mn (El Salvador settlement) 4. Including the Engineering & Research division and elisions. Including non recurring item of +82 €mn (Arctic Russia price adjustment)

Enel Group
Investor Relations
FY 2014 results: EBITDA evolution
G&EM Italy (€mn)
73
Generation margin
FY14 Gas margin
Other2 FY13 restated1
+170 1,163 -19
1,084 -72
1. Due to the application of IFRS 11 2. Including non recurring item of +50 €mn remeasurement of fair value of SE Hydropower
+7.3%

Enel Group
Investor Relations
FY 2014 results: EBITDA evolution
Market Italy (€mn)
74
-24
Regulated market
FY14 Free market
+239 1,081
FY13 restated
866
+24.8%

Enel Group
Investor Relations
FY 2014 results: EBITDA evolution
Infrastructure & Networks Italy (€mn)
75
-235
Connection
fees FY14 Energy
margin
4,008 -103
Other
3,979 +309
FY13
restated
-0.7%
Enel Group
Investor Relations
FY 2014 results: EBITDA evolution
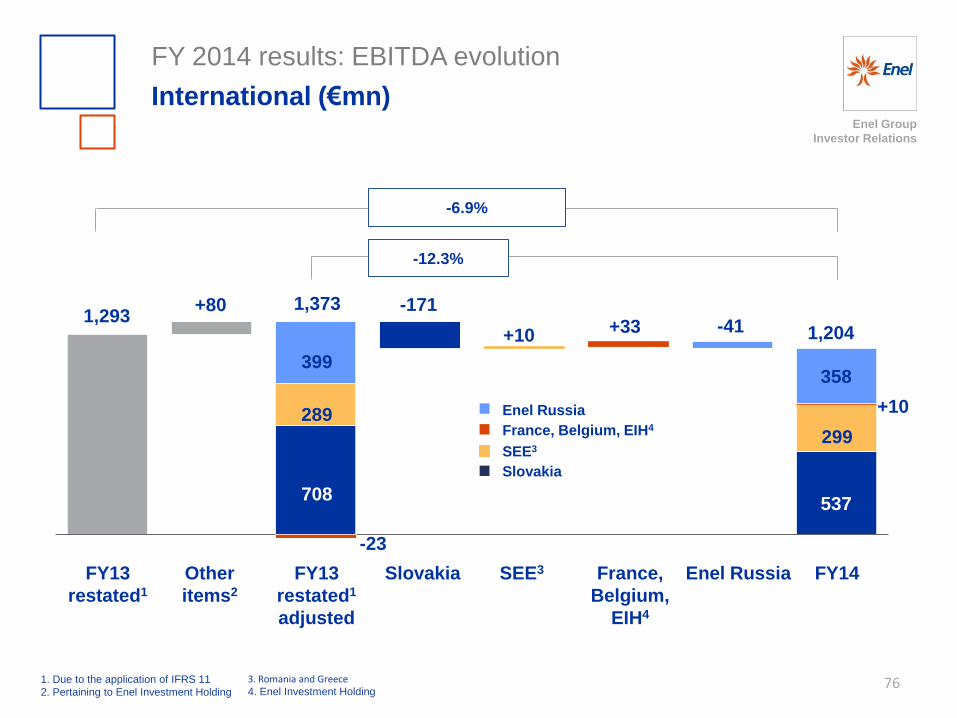
International (€mn)
76
1,293 +10
+80 +33 1,204 -41
FY13
restated1
Enel Russia SEE3 Slovakia France,
Belgium,
EIH4
SEE3
France, Belgium, EIH4
Slovakia
Enel Russia
FY14
1. Due to the application of IFRS 11
2. Pertaining to Enel Investment Holding
289
358
708
299
+10
399
537
Other
items2
FY13
restated1
adjusted
1,373 -171
-23
3. Romania and Greece 4. Enel Investment Holding
-6.9%
-12.3%

Enel Group
Investor Relations
FY 2014 results: EBITDA evolution
Iberia1 (€mn)
77 1. Enel GAAP
2. Due to the application of IFRS 11
3,203 3,195
FY13
restated2
Liberalized
business
Regulated
business
FY14
-95 +212 -109
Other
+0.3%
Enel Group
Investor Relations
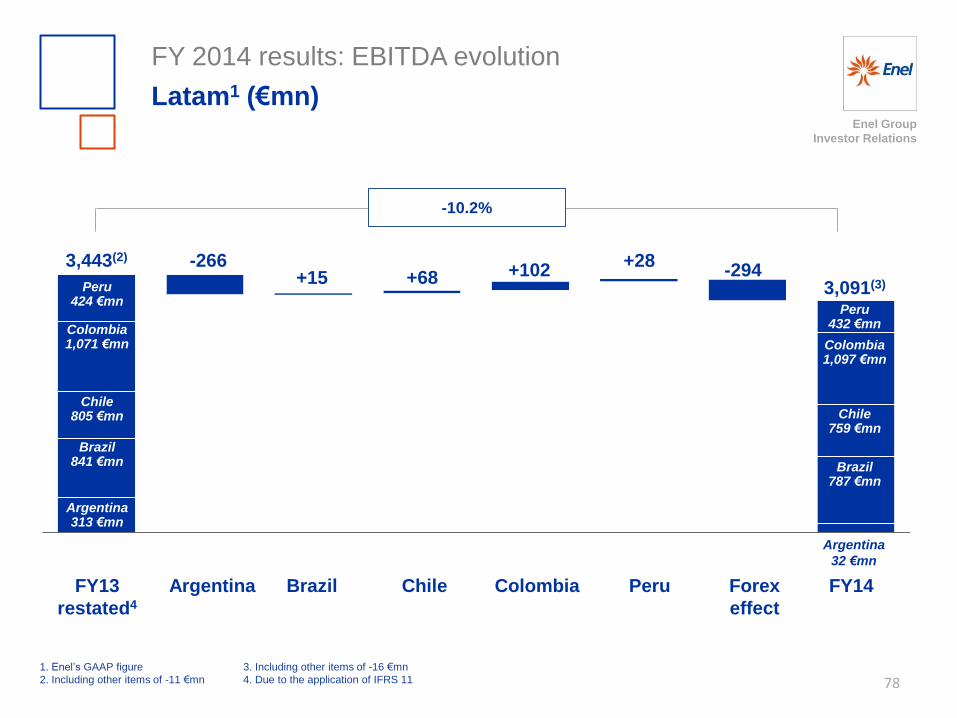
FY 2014 results: EBITDA evolution
Latam1 (€mn)
78 1. Enel’s GAAP figure
2. Including other items of -11 €mn
3. Including other items of -16 €mn
4. Due to the application of IFRS 11
3,091(3)
3,443(2)
FY13
restated4
Argentina Brazil
FY14
+15 +68 +102
Chile
+28
Colombia
Peru
-266
Forex
effect
-294
Argentina 313 €mn
Brazil 841 €mn
Chile 805 €mn
Colombia 1,071 €mn
Peru 424 €mn
Brazil 787 €mn
Chile 759 €mn
Colombia 1,097 €mn
Peru 432 €mn
Argentina
32 €mn
-10.2%

Enel Group
Investor Relations
FY 2014 results: EBITDA evolution
Renewables (€mn)
79 1. Due to the application of IFRS 11 2. Non recurrent items of +123 €mn (El Salvador settlement)
Europe FY14 Recurring
North America
Latin America
+6 -1
Europe
Latin America
North America
+30 1,815
1,331
203
1,337
202
276 246
1,780
FY13 restated1
+123 +1,938
Non recurring2
FY14
+8.9%
+2.0%

Enel Group
Investor Relations
FY 2014 results: EBITDA evolution
Other1 (€mn)
80
+1,022 -42 -882
+98
FY13 Services FY14 Other
1. Including Services & Holding, Engineering & Research, upstream gas and nuclear activities
n.s.

Enel Group
Investor Relations
81
Italy Spain Latam
Unhedged
Hedged Average price €/MWh
Forward sales
75%
35%
2015 2016
95%
5%
2015 2016
55.2 47.4 57.6 56.2 70.1 72.3
75% 65%
2015 2016
FY 2014 results

Enel Group
Investor Relations
Financial annexes: FY 2014
From Gross Debt to Net Debt (€mn)
82
48,655
8,377
6,561
13,088
37,383
Gross Debt 2014 Financial receivables Cash and cash equivalent Net Financial Position
57,032
Long-term debt
Short-term debt
-1.7% -38.2% +69.3% Change YoY
%
58,047 -10,611
(o.w. TD -3,177) -7,730 FY13
-5.9%
39,706
-1,174
Tariff deficit

Enel Group
Investor Relations
Financial annexes: FY 2014
Gross debt maturity profile and structure (FY 2014)
83
77%
23% 30%
70%
35%
39% 8%
7%
7%
3%
1%
65%
16%
10%
7%
2%
Debt maturity Interest rate composition
Third party debt composition Currency composition1
Maturity
> 2017
Maturity
< 2017
Floating
Fixed +
Hedged
EUR
USD
GBP
Other
Latam
currencies
1. Long term only
Enel
EFI Latam
Renewables
Italy
Iberia
East Europe

Enel Group
Investor Relations
84
Third Parties view
Financial annexes: FY 2014
Debt Structure by Instrument 2014
Debt by instrument Enel Spa EFI Italy Iberia Latam Renewables
Eastern
Europe
& Other
Total
Bonds 19.65 19.91 - 0.15 3.82 - 0.27 43.80
Bank Loans - - 3.66 0.50 0.39 2.90 0.40 7.85
Tax Partnership - - - - - 0.79 - 0.79
Other Loans - - - 0.56 0.57 0.21 - 1.34
Other short term debt 0.43 - 0.10 0.06 - 0.03 0.03 0.65
Commercial Paper - 2.40 - 0.20 - - - 2.60
Gross debt 20.08 22.31 3.76 1.47 4.78 3.93 0.70 57.03
Financial Receivables - - -1.26 -0.53 -0.67 -0.42 -0.22 -3.10
Tariff Deficit - - - -1.17 - - - -1.17
Other short term financial
receivables -0.67 - -1.35 -0.02 -0.05 -0.19 -0.01
-2.29
Cash -6.97 -1.01 -0.18 -0.65 -2.31 -0.33 -1.64 -13.09
Net Debt 12.44 21.30 0.97 -0.90 1.75 2.99 -1.17 37.38

Enel Group
Investor Relations
85
FY 2014
~26.5
Cash
Long term committed
credit lines1 ~13.4
~13.1
< 12m 2016 2017 2018 2019 After 2019
~8.4 ~5.8 ~4.9 ~7.2 ~4.9
~25.8
~3.3
~5.1
Short term
Long term
1. Lines with maturities after December 2015 (including 9.4 €bn revolving forward start credit facility)
Financial annexes
Debt maturity coverage

Enel Group
Investor Relations
FY13 restated
FY14 % €mn
39,706
52,832
92,538
37,383
51,145
88,528
-5.9
-3.2
-4.3
Net financial debt
Shareholders’ equity
Net capital employed
FY 2014
Balance sheet
86

Enel Group
Investor Relations
% €mn
Revenues
EBITDA
EBIT
Capex
Headcount
-0.8
+7.3
n.s.
-8.9
-5.5
FY14
22,606
1,163
(1,539)
285
5,314
FY13 restated
22,798
1,084
493
313
5,621
FY 2014
Generation & Energy Management - Italy
87
Enel Group
Investor Relations
Revenues
EBITDA
EBIT
Capex
Headcount
-10.0
+24.8
+25.7
+12.1
-1.5
15,226
1,081
455
111
3,633
16,921
866
362
99
3,687
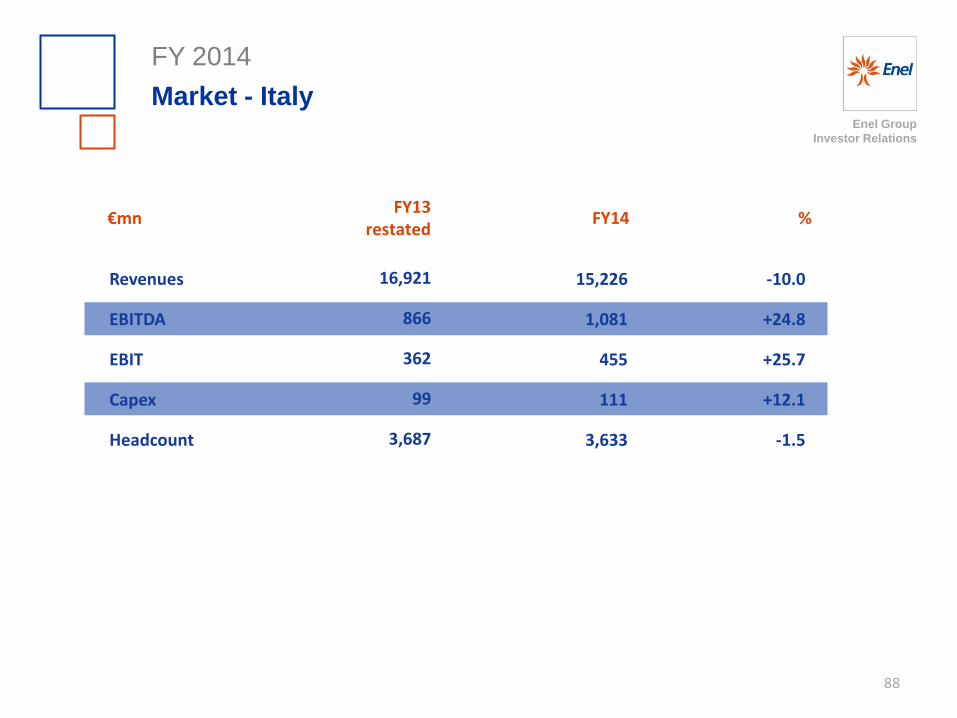
% €mn FY14 FY13
restated
FY 2014
Market - Italy
88

Enel Group
Investor Relations
% €mn
Revenues
EBITDA
EBIT
Capex
Headcount
-4.3
-0.7
-2.8
-4,8
-1.6
7,366
3,979
2,943
996
17,398
7,698
4,008
3,028
1,046
17,689
FY14 FY13
restated
FY 2014
Infrastructure & Network - Italy
89
Enel Group
Investor Relations
Revenues
EBITDA
EBIT
Capex
Headcount
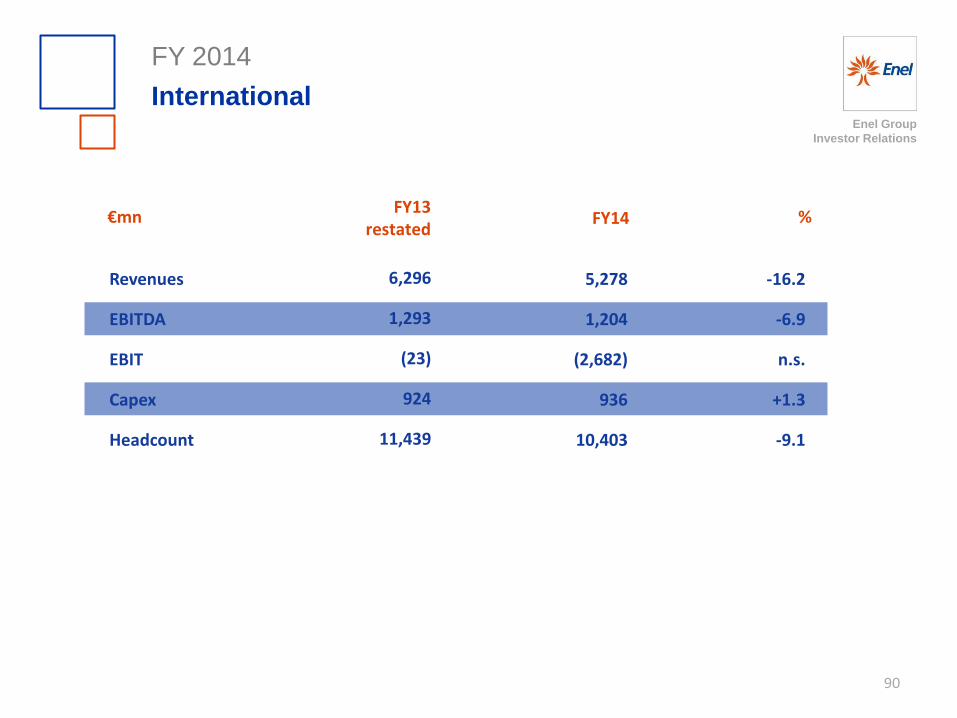
-16.2
-6.9
n.s.
+1.3
-9.1
% €mn
5,278
1,204
(2,682)
936
10,403
6,296
1,293
(23)
924
11,439
FY14 FY13
restated
FY 2014
International
90

Enel Group
Investor Relations
Revenues
EBITDA
EBIT
Capex
Headcount
-1.1
+0.3
-10.3
+17.5
-4.0
% €mn
20,900
3,203
1,240
993
10,500
21,123
3,195
1,382
845
10,933
FY14 FY13
restated
FY 2014
Iberia
91

Enel Group
Investor Relations
Revenues
EBITDA
EBIT
Capex
Headcount
+1.0
-10.2
-35,1
+22.4
+6.0
% €mn
9,647
3,091
1,549
1,609
12,301
9,551
3,443
2,385
1,315
11,608
FY14 FY13
restated
FY 2014
Latam
92

Enel Group
Investor Relations
Revenues
EBITDA
EBIT
Capex
Headcount
+5.5
+8.9
-6.7
+28.1
+4.0
% €mn
2,921
1,938
1,124
1,658
3,609
2,769
1,780
1,205
1,294
3,469
FY14 FY13
restated
FY 2014
Renewables
93
Enel Group
Investor Relations
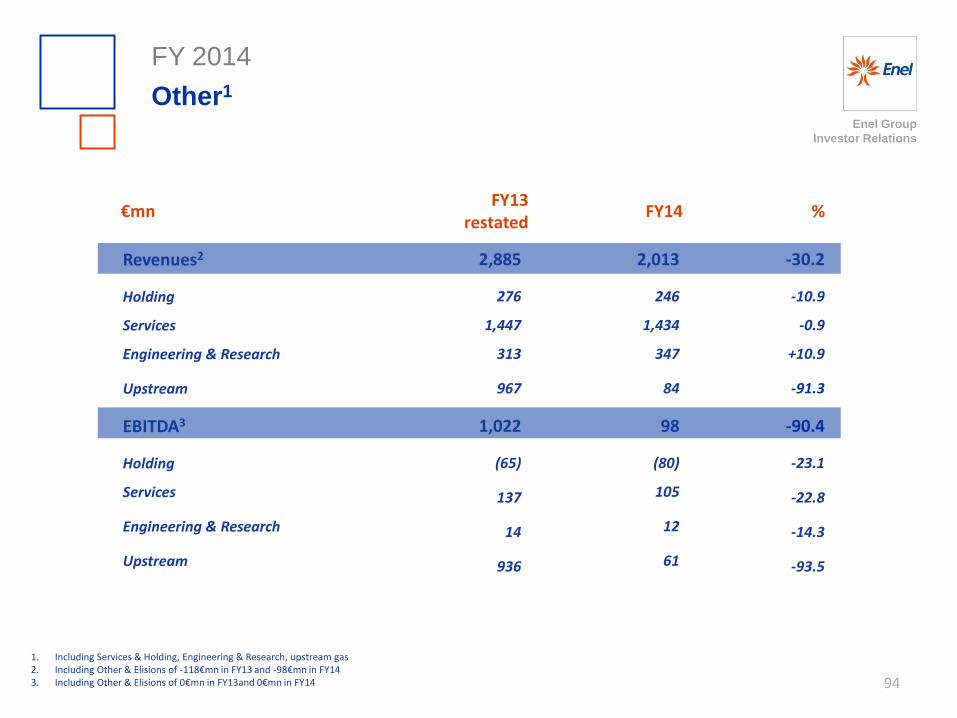
FY14 % €mn
Revenues2
Holding
Services
Engineering & Research
Upstream
EBITDA3
Holding
Services
Engineering & Research
Upstream
FY13 restated
1. Including Services & Holding, Engineering & Research, upstream gas 2. Including Other & Elisions of -118€mn in FY13 and -98€mn in FY14 3. Including Other & Elisions of 0€mn in FY13and 0€mn in FY14
2,885
276
1,447
313
967
1,022
(65)
137
14
936
2,013
246
1,434
347
84
98
(80)
105
12
61
-30.2
-10.9
-0.9
+10.9
-91.3
-90.4
-23.1
-22.8
-14.3
-93.5
FY 2014
Other1
94

Enel Group
Investor Relations
EBIT2
Holding
Services & other
Engineering & Research
Upstream
Capex
Holding
Services & other
Engineering & Research
Upstream
Headcount
Holding
Services & other
Engineering & Research
Upstream
FY14 % €mn FY13
restated
1. Including Services & Holding, Engineering & Research, upstream gas 2. Including Other & Elisions of 0€mn in FY13 and 0€mn in FY14
908
(74)
37
9
936
84
13
60
3
8
5,803
789
3,865
1,190
52
(3)
(92)
21
8
60
113
11
88
2
12
5,896
791
3,803
1,161
48
-100.3
-24.3
-41.7
-11.1
-93.6
+34.5
-15.4
+46.7
-33.3
+50.0
-1.6
+0.3
-1.6
-2.4
-7.7
FY 2014
Other1 - Continued
95

Enel Group
Investor Relations
313 285 99 111
1,046 996
924 936
845 993
1,315 1,609
1,294
1,658 84
113
S&H
EGP
Latam
Iberia
International
I&N
Market
GEM
2
FY13 FY14
5,920
1. Continuing operations, gross of contributions 2. Including Services & Holding, Engineering & Research, upstream gas
6,701
+28.1%
+22.4%
+17.5%
+1.3%
-4.8%
+12.1% -8.9%
FY 2014
Capex by business area (€mn)1
96
+34.5%
+13.2%

Operational annexes

Enel Group
Investor Relations
CCGT
Oil & gas Coal
Nuclear
Other renewables
Hydro
25.8% 26.2%
6.6% 7.3%
14.4% 13.8%
28.8% 29.0%
14.0% 13.2%
10.4% 10.5%
283.1 281.8 32.5% 32.1%
9.4% 9.7%
47.3% 49.2%
10.1% 8.6% 0.7% 0.4%
71.8 71.2
23.5% 24.3%
5.7% 6.5%
19.2% 18.5%
22.6% 22.1%
15.3% 14.7%
13.7% 13.9%
211.3 210.6
FY13 restated
FY14
FY13 restated
FY14
FY14
Operational annexes
Production mix (TWh)
98
Group production mix
+0.5%
+0.8%
+0.3%
Italy
Other
countries
FY13 restated

Enel Group
Investor Relations
-
4,968
Other ren.
1,662
1,793
28
847
2,809
7,149
MW Hydro
12,698
4,764
2,329
19
9,843
29,653
Nuclear
-
3,318
1,814
-
-
5,132
Coal
6,486
5,306
797
836
17,048
Oil & gas ST/OCGT
10,778
2,923
-
-
2,642
21,018
Iberia
Centrel
Italy
SEE
Americas
TOTAL
CCGT
5,199
5,445
-
406(2)
4,253
16,112
1. Including Group renewable capacity 2. 3. Including 406 MW of installed capacity in Belgium
- - - 3,623 4,675 Russia 809
TOTAL
36,823
23,549
1,272
20.383
9,107
96,112
FY2014 Group total net installed capacity1
Breakdown by source and location
99
10 - - - - Other countries
(South Africa) - 10
Enel Group
Investor Relations
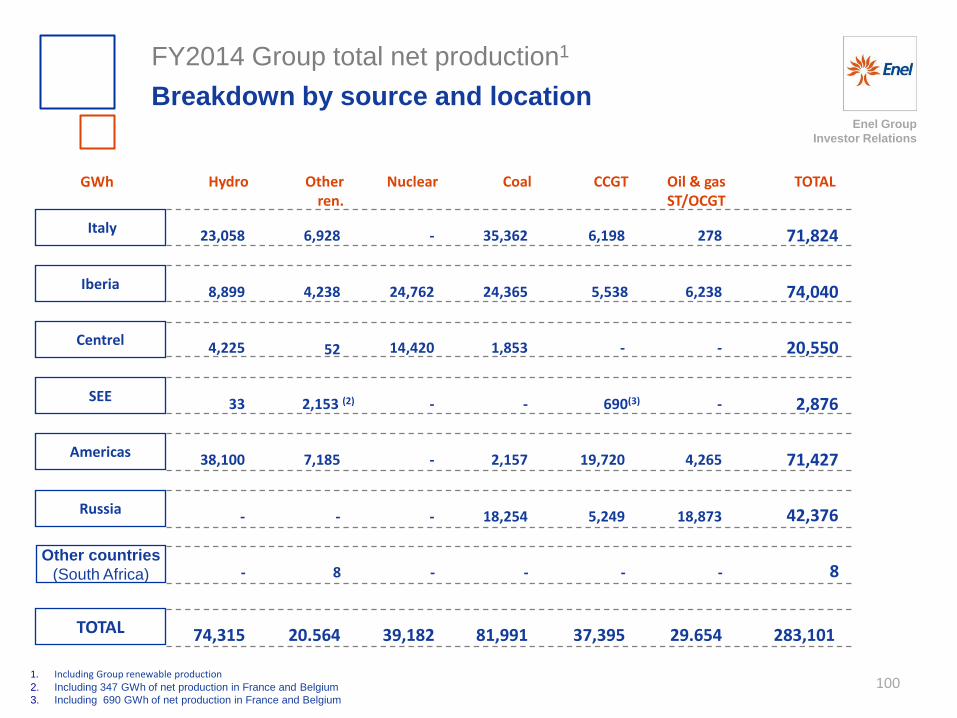
GWh Hydro Nuclear Coal Oil & gas ST/OCGT
Iberia
Centrel
Italy
SEE
Americas
TOTAL
CCGT
1. Including Group renewable production 2. Including 347 GWh of net production in France and Belgium
3. Including 690 GWh of net production in France and Belgium
Russia
TOTAL Other ren.
-
20,550
6,928
4,238
52
2,153 (2)
7,185
20.564
23,058
8,899
4,225
33
38,100
74,315
-
24,762
14,420
-
-
39,182
35,362
24,365
1,853
2,157
81,991
278
6,238
-
-
4,265
29.654
6,198
5,538
-
690(3)
19,720
37,395
- - - 18,254 18,873 5,249
71,824
74,040
2,876
71,427
42,376
283,101
FY2014 Group total net production1
Breakdown by source and location
100
Other countries
(South Africa) 8 - - - - - 8

Enel Group
Investor Relations
Geothermal MW Wind Other TOTAL Hydro
1,665
761
-
72
1,574
732
318
2,624 833
3,202
829
5,696
298
137
28
473
Latam
Europe
North America
TOTAL
5,835
1,698
2,083
9,626
FY2014 Enel Green Power net installed capacity:
Breakdown by source and location
101
- - - 10 Other countries
(South Africa) 10
Enel Group
Investor Relations
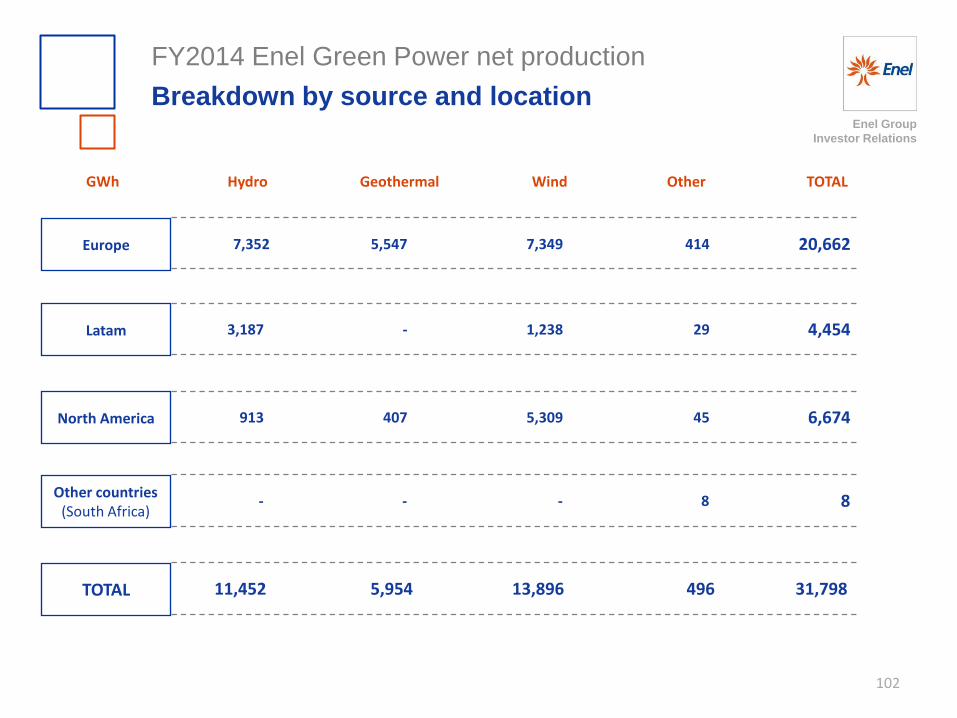
Hydro Wind Other TOTAL Geothermal GWh
Latam
Europe
North America
TOTAL
5,309
5,547
-
407
7,352
3,187
913
11,452 5,954
7,349
1,238
13,896
414
29
45
496
20,662
4,454
6,674
31,798
FY2014 Enel Green Power net production
Breakdown by source and location
102
Other countries (South Africa)
- - - 8 8

Enel Group
Investor Relations
Investor Relations Team ([email protected])
Visit our website at:
www.enel.com (Investor Relations)
Tel. +39 06 8305 7975
Contact us
103

Enel Group
Investor Relations
This presentation contains certain forward-looking statements that reflect the Company’s management’s current views with respect to future events and financial and operational performance of the Company and its subsidiaries. These forward-looking statements are based on Enel S.p.A.’s current expectations and projections about future events. Because these forward-looking statements are subject to risks and uncertainties, actual future results or performance may differ materially from those expressed in or implied by these statements due to any number of different factors, many of which are beyond the ability of Enel S.p.A. to control or estimate precisely, including changes in the regulatory environment, future market developments, fluctuations in the price and availability of fuel and other risks. You are cautioned not to place undue reliance on the forward-looking statements contained herein, which are made only as of the date of this presentation. Enel S.p.A. does not undertake any obligation to publicly release any updates or revisions to any forward-looking statements to reflect events or circumstances after the date of this presentation. This presentation does not constitute a recommendation regarding the securities of the Company. This presentation does not contain an offer to sell or a solicitation of any offer to buy any securities issued by Enel S.p.A. or any of its subsidiaries.
Pursuant to art. 154-BIS, par. 2, of the Unified Financial Act of February 24, 1998, the executive in charge of preparing the corporate accounting documents at Enel, Alberto De Paoli, declares that the accounting information contained herein correspond to document results, books and accounting records.
Disclaimer
104
Recommended