New Evidence on Trade and Employment
Margaret McMillanTufts University and NBER
ĺñigo VerduzcoHarvard University
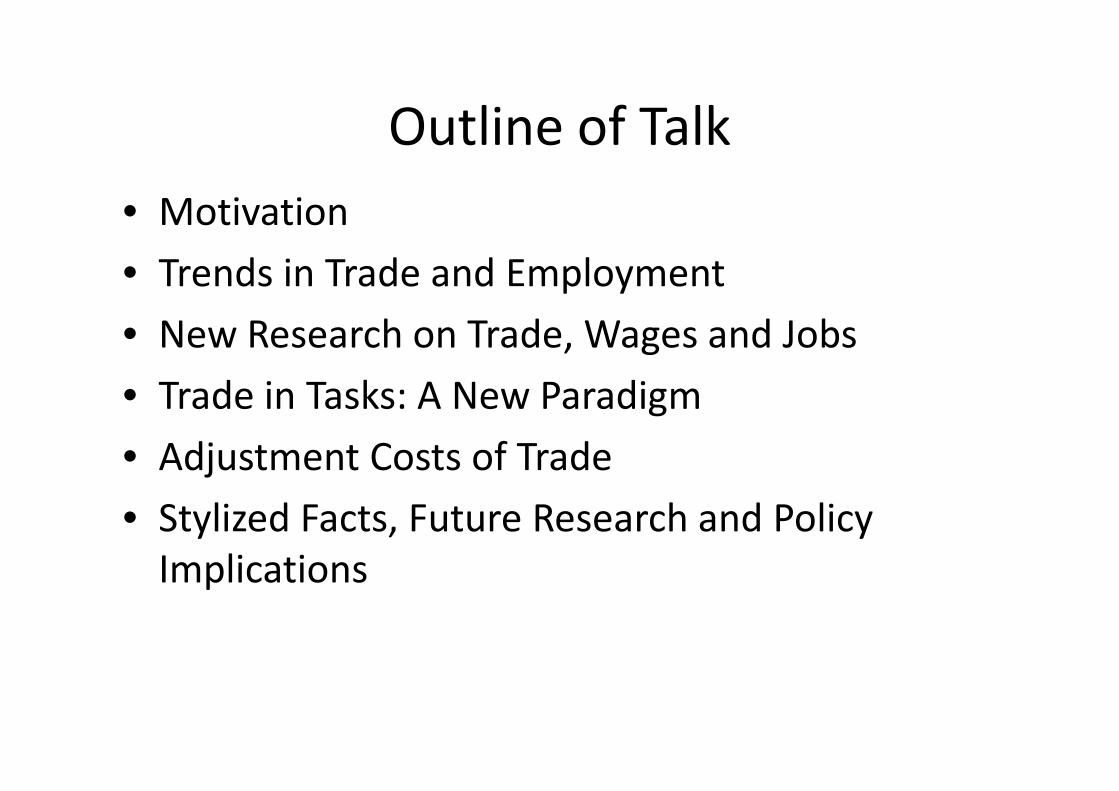
Outline of Talk
• Motivation
• Trends in Trade and Employment
• New Research on Trade, Wages and Jobs
• Trade in Tasks: A New Paradigm• Trade in Tasks: A New Paradigm
• Adjustment Costs of Trade
• Stylized Facts, Future Research and Policy Implications

Trade Liberalization Is Disappointing
• Hoekman and Winters (2005)
• Pavcnik and Goldberg (2004, 2007)
• Harrison (2008)
• Rodrik and Rosenzweig (2009)• Rodrik and Rosenzweig (2009)

But Problems with Existing Research
• Partial Equilibrium
• Few studies at the individual level
• Need to examine “Trade in tasks”
• Trade’s effect at the occupational level
• Heterogneous firms, heterogenous outcomes
• Identification is still an issue
• Data is incomplete

Our Goal in This Paper
• Use new data to examine correlations between trade and employment in developing countries
• Describe most recent work on trade and labor • Describe most recent work on trade and labor market outcomes
• Based on most recent evidence– Stylized facts
– Directions for future research
– Policy implications

Trade and Employment: Aggregate Trends

Huge Tariff Reductions in Developing Countries
Region
Change (1980-2005)
1980 1985 1990 1995 2000 2005 Percentage points
East Asia & Pacific 31.9 24.3 25.2 24.8 13.2 9.0 -22.8
Europe & Central Asia 44.0 26.0 18.2 18.2 8.8 6.2 -37.8
Latin American & the Caribbean 37.9 35.6 23.6 23.6 10.6 8.0 -30.0
Middle East & North Africa 25.1 20.5 22.9 22.9 22.4 11.7 -13.4
Mean Tariffs (%)
Middle East & North Africa 25.1 20.5 22.9 22.9 22.4 11.7 -13.4
South Asia 63.0 62.9 57.9 57.9 25.1 14.9 -48.2
Sub-Saharan Africa* 28.3 28.7 25.2 25.2 14.1 12.7 -15.6
All Developing, Average 38.4 33.0 28.8 28.8 15.7 10.4 -28.0
Non-OECD, Non-Developing 18.2 11.2 13.2 13.2 9.6 7.3 -10.9
OECD, Non-Developing 9.2 7.9 7.8 7.8 3.7 3.5 -5.7
All Non-Developing, Average 13.7 9.5 10.5 10.5 6.7 5.4 -8.3
* Madagascar w as excluded from the sample due to inconsistencies in the data.
Source: Authors' calculations based on data from Economic Freedom of the World (2009)
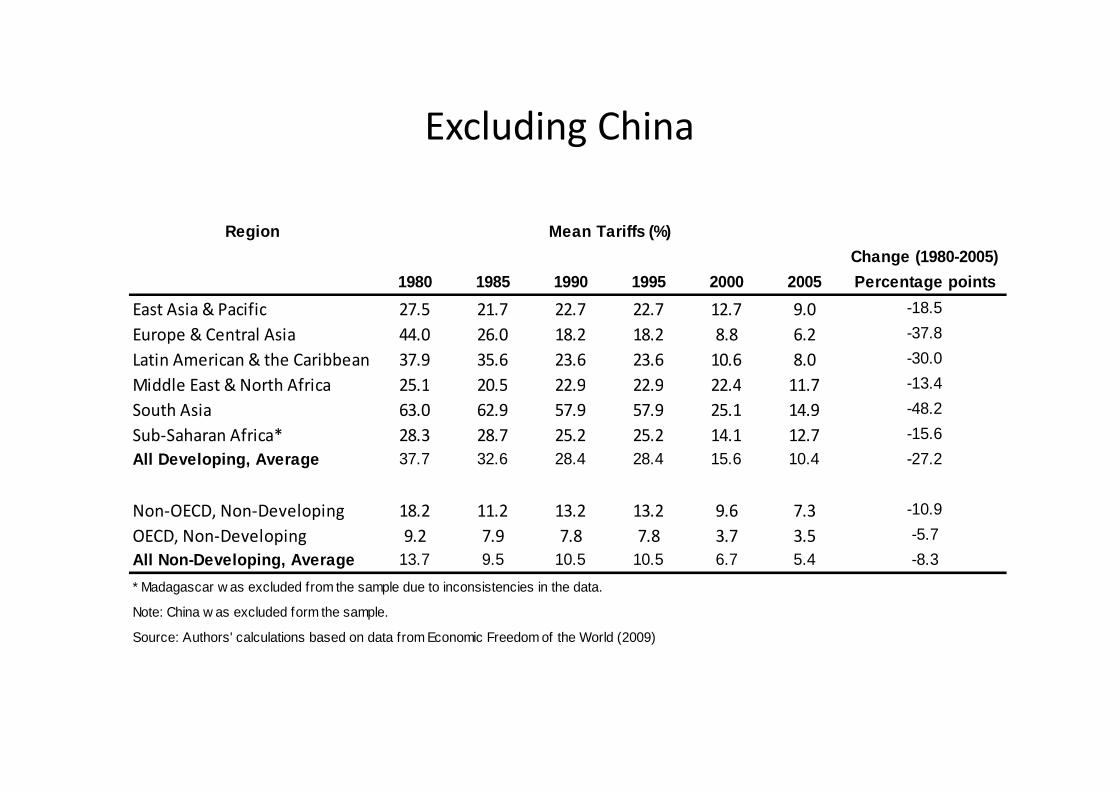
Excluding China
Region
Change (1980-2005)
1980 1985 1990 1995 2000 2005 Percentage points
East Asia & Pacific 27.5 21.7 22.7 22.7 12.7 9.0 -18.5
Europe & Central Asia 44.0 26.0 18.2 18.2 8.8 6.2 -37.8
Latin American & the Caribbean 37.9 35.6 23.6 23.6 10.6 8.0 -30.0
Middle East & North Africa 25.1 20.5 22.9 22.9 22.4 11.7 -13.4
Mean Tariffs (%)
South Asia 63.0 62.9 57.9 57.9 25.1 14.9 -48.2
Sub-Saharan Africa* 28.3 28.7 25.2 25.2 14.1 12.7 -15.6
All Developing, Average 37.7 32.6 28.4 28.4 15.6 10.4 -27.2
Non-OECD, Non-Developing 18.2 11.2 13.2 13.2 9.6 7.3 -10.9
OECD, Non-Developing 9.2 7.9 7.8 7.8 3.7 3.5 -5.7
All Non-Developing, Average 13.7 9.5 10.5 10.5 6.7 5.4 -8.3
* Madagascar w as excluded from the sample due to inconsistencies in the data.
Note: China w as excluded form the sample.
Source: Authors' calculations based on data from Economic Freedom of the World (2009)
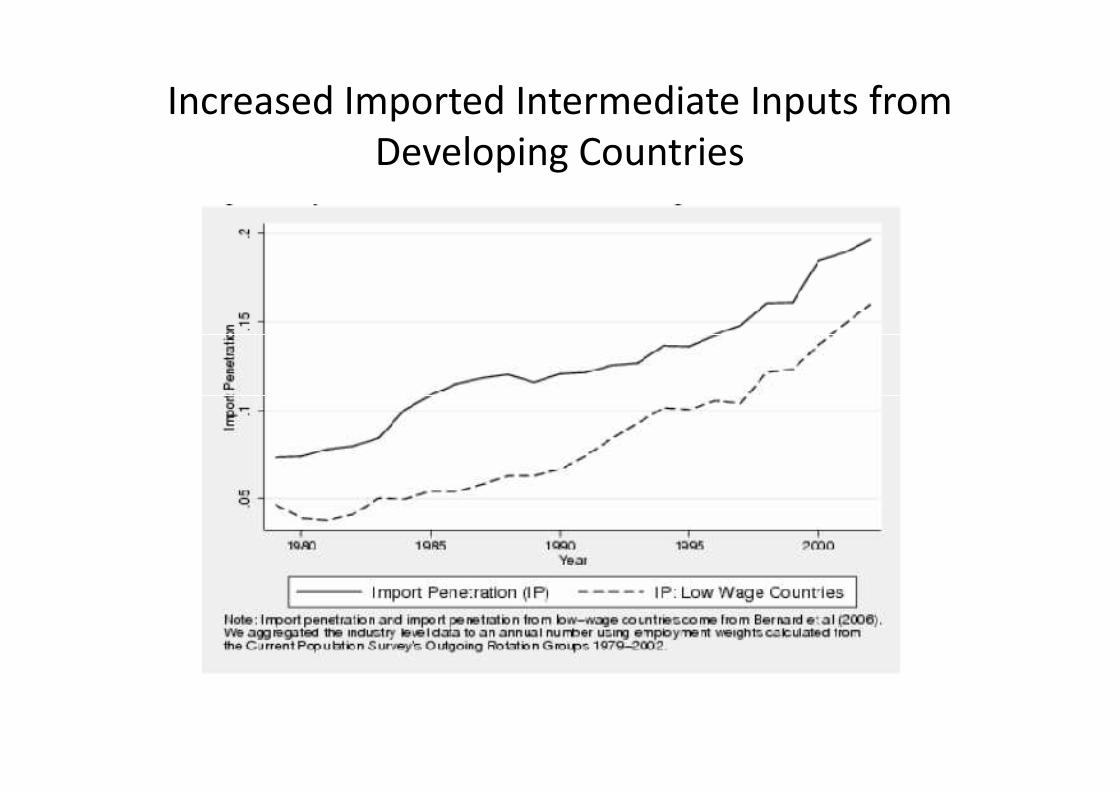
Increased Imported Intermediate Inputs from Developing Countries

Increased Production Offshoring

Industrial Employment Shifts to Developing Countries
Region
1980 1985 1990 1995 2000 2005 Avg.
East Asia & Pacific 26,834 32,635 59,527 64,747 55,254 69,356 51,392
Europe & Central Asia 6,067 5,678 11,125 24,205 21,006 17,646 14,288
Latin American & the Caribbean 9,605 10,374 8,297 7,525 8,598 9,438 8,973
Middle East & North Africa 2,363 2,526 2,749 3,273 2,250 2,125 2,547
South Asia 7,866 7,671 9,236 10,986 8,928 8,180 8,811
Employment ('000 workers)
South Asia 7,866 7,671 9,236 10,986 8,928 8,180 8,811
Sub-Saharan Africa* 2,653 2,427 2,539 2,915 1,764 1,531 2,305
Total, Developing 55,388 61,310 93,472 113,651 97,799 108,275 88,316
Non-OECD, Non-Developing 1,844 2,058 2,636 2,178 1,902 1,642 2,043
OECD, Non-Developing 59,370 54,362 56,576 58,731 60,715 52,334 57,015
Total, Non-Developing 61,214 56,420 59,212 60,909 62,616 53,975 59,058
* Madagascar w as excluded from the sample due to inconsistencies in the data.
Note: Data for South Asia in 2005 is not available; used data for 2004 instead
Source: Authors' calculations based on data from UNIDO's INDSTAT2 2009
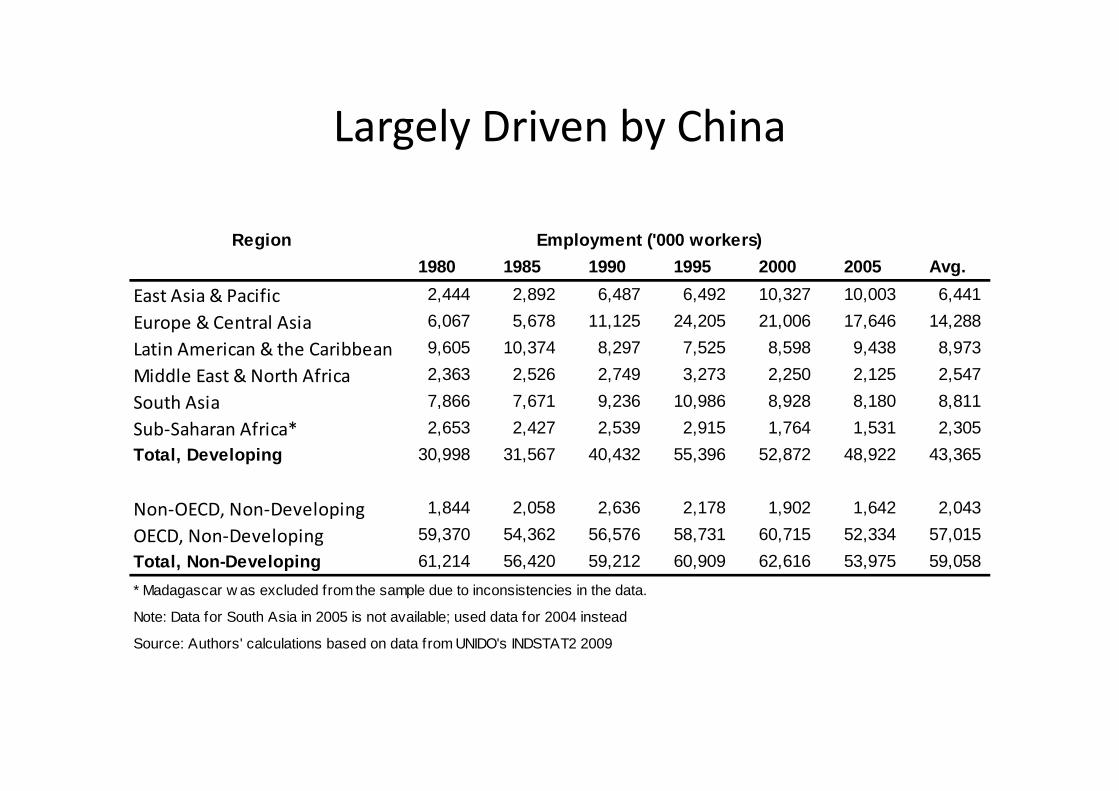
Largely Driven by China
Region
1980 1985 1990 1995 2000 2005 Avg.
East Asia & Pacific 2,444 2,892 6,487 6,492 10,327 10,003 6,441
Europe & Central Asia 6,067 5,678 11,125 24,205 21,006 17,646 14,288
Latin American & the Caribbean 9,605 10,374 8,297 7,525 8,598 9,438 8,973
Middle East & North Africa 2,363 2,526 2,749 3,273 2,250 2,125 2,547
South Asia 7,866 7,671 9,236 10,986 8,928 8,180 8,811
Employment ('000 workers)
South Asia 7,866 7,671 9,236 10,986 8,928 8,180 8,811
Sub-Saharan Africa* 2,653 2,427 2,539 2,915 1,764 1,531 2,305
Total, Developing 30,998 31,567 40,432 55,396 52,872 48,922 43,365
Non-OECD, Non-Developing 1,844 2,058 2,636 2,178 1,902 1,642 2,043
OECD, Non-Developing 59,370 54,362 56,576 58,731 60,715 52,334 57,015
Total, Non-Developing 61,214 56,420 59,212 60,909 62,616 53,975 59,058
* Madagascar w as excluded from the sample due to inconsistencies in the data.
Note: Data for South Asia in 2005 is not available; used data for 2004 instead
Source: Authors' calculations based on data from UNIDO's INDSTAT2 2009

Short Run Correlations between Trade and Employment
ALB DZADZA
ARGBGDBOL BOLBOL BWA
BGRCAFCAFCAF
CHLCHL
CHL
CHL
COL
COLCOL
COLCRICRI ECUECUECU
EGY
EGY
GTMHTI
HND
IDNIDN
IRN
IRN
IRN
IRNIRN
IRN
JAMJAM JAMJOR KENKENMWI MWI
MYS
MYS
MYS
MYS
MYSMUSMUSMUSMEX
MEX
MAR
MARMAR NIC
PAKPAK
PANPERPOL
ROMSEN SENZAF
ZAF
LKA LKA
LKA
LKASYR
SYR
SYRSYRTZA
TZATUN
TURTUR
TUR
TUR
URY
URYURY
URYVEN
VEN
ZWE ZWEZWE0
200
400
Fiv
e ye
ar le
vel c
hang
e in
em
ploy
men
tN
o. o
f wor
kers
(th
ousa
nds)
Non High Income CountriesTrade Liberalization and Employment
DZA
ARGARG ARG
COLCOL IDN
PHL
PHLPOL
ZAFZAF ZAF
SYRURYVEN
-400
-200
Fiv
e ye
ar le
vel c
hang
e in
em
ploy
men
tN
o. o
f wor
kers
(th
ousa
nds)
-20 -15 -10 -5 0 5Five year level change in tariffs
(Percentagepoints)
Fitted line
Sources: UNIDO INDSTAT2 (2009); Economic Freedom of the World(2009)

Short Run Correlations between Trade and Employment (includes China)
CHN
CHN
1000
020
000
3000
0
Fiv
e ye
ar le
vel c
hang
e in
em
ploy
men
tN
o. o
f wor
kers
(th
ousa
nds)
Non High Income CountriesTrade Liberalization and Employment
ALB DZADZADZAARG ARGARG ARGARGBGD BGDBGDBOLBOLBOL BWABWABRA BRABRA BRABGR BGRCAFCAFCAFCHL CHLCHL CHLCHLCHL
CHN CHN
CHN
COLCOLCOLCOL COLCRI CRICRI ECUECUECU ECUEGYEGYGTMHTI HND INDIND INDIND IDNIDN IDNIDNIDN IDNIRNIRN IRNIRNIRN IRNJAMJAMJAMJOR KENKENKENMWIMWIMWIMYSMYSMYSMYSMYSMYSMUSMUS MUSMUSMUSMEX MEXMEXMAR MARMAR MARMAR NICNGAPAKPAK PAN PERPER PERPHLPHL PHLPHLPOLPOLPOLPOL ROMROMROM
RUSRUSSENSENSEN ZAF ZAFZAFZAFZAFLKA LKALKALKA SYRSYRSYRSYRTZATZATUNTUNTUR TURTURTURUGAUKR UKRURYURYURY URYVENVENVNMZWEZWEZWE
-100
000
1000
0
Fiv
e ye
ar le
vel c
hang
e in
em
ploy
men
tN
o. o
f wor
kers
(th
ousa
nds)
-80 -60 -40 -20 0 20Five year level change in tariffs
(Percentagepoints)
Fitted line
Sources: UNIDO INDSTAT2 (2009); Economic Freedom of the World(2009)

Long Run Correlations between Trade and Employment
ALBBOL CMRCAFCHL
COLECUEGYSLV ETHFJIGHAGTM HTI HND
IRN
JAMJOR KENLVALSOLTUMWI
MYS
MUS
MEXMAR
NPL NICNGAPAK
PAN PRYPHL SENZAF
LKA
SYRTZA
THA
UGAURY VENZWE050
010
00
Long
diff
. lev
el c
hang
e in
em
ploy
men
tN
o. o
f wor
kers
(th
ousa
nds)
Non High Income CountriesTrade Liberalization and Employment
ARG
POL
ZAFSYR
UKR
-150
0-10
00-5
00
Long
diff
. lev
el c
hang
e in
em
ploy
men
tN
o. o
f wor
kers
(th
ousa
nds)
-40 -30 -20 -10 0Long diff. level change in tariffs
(Percentagepoints)
Fitted line
Sources: UNIDO INDSTAT2 (2009); Economic Freedom of the World(2009)

Long Run Correlations between Trade and Employment (includes China)
BGDBRA
CHN
IND
IDN
IRNMYS
MEXMARPAKPER LKA
THA TUNTUR
2000
4000
6000
Long
diff
. lev
el c
hang
e in
em
ploy
men
tN
o. o
f wor
kers
(th
ousa
nds)
Non High Income CountriesTrade Liberalization and Employment
ALB DZAARG
BOL BWABGR
CMRCAFCHLCOLCRI CIVECUEGYSLV ETHFJIGHAGTM HTI HNDIRN
JAM JOR KENLVALSOLTUMWIMUSMEXMAR NPL NICNGAPAKPAN PNGPRYPHL
POLROM
RUS
SEN ZAFSYRTZATHA TUNTUR UGA
UKRURY VENZWE
-400
0-20
000
Long
diff
. lev
el c
hang
e in
em
ploy
men
tN
o. o
f wor
kers
(th
ousa
nds)
-60 -40 -20 0 20Long diff. level change in tariffs
(Percentagepoints)
Fitted line
Sources: UNIDO INDSTAT2 (2009); Economic Freedom of the World(2009)

Selected Recent Empirical Evidence on Trade, Wages and JobsWages and Jobs

South Africa
• Unemployment close to 40%
• Dramatic Post-Apartheid Trade Reform
• Even more trade liberalization required [Dunne and Edwards (2006), Edwards and [Dunne and Edwards (2006), Edwards and Lawrence (2006)]
• Import penetration responsible for job losses [Rodrik, (2006)]

Vietnam
• Trade liberalization associated with increases in real wages [Edmonds and Pavcnik (2006)]
• Trade liberalization associated with reductions in child labor [Edmonds and Pavcnik (2006)]in child labor [Edmonds and Pavcnik (2006)]
• Trade reform increased employment [Kien and Ho (2008)]
• Inequality in Vietnam has fallen though authors do not relate to trade [McCaig et al, 2009]

United States
• Import penetration is associated with a reallocation of labor from manufacturing to services so no net effect on overall employment
• Workers who move from manufacturing to • Workers who move from manufacturing to services suffer large wage declines
• Economy-wide, import penetration has put downward pressure on wages at the occupational level
Ebenstein et al (2009)

Trade and Inequality
• Within country inequality has increased but there is no robust relationship between trade liberalization and increased inequality [Goldberg and Pavcnik, (2007)][Goldberg and Pavcnik, (2007)]
• Trade liberalization may improve allocative efficiency but a lot depends on the institutional setting [Helpman and Itskhoki, (2009)]

Trade in Tasks: A New Paradigm
“the nature of trade has changed. For centuries, trade largely entailed and exchange of complete goods. Now it increasingly involves bits of value being added in many different locations, or what might be called trade in tasks… But globalization of or what might be called trade in tasks… But globalization of production and the evolving international division of labor suggest the need for a new paradigm, one that puts task
trade at center stage.”
Grossman and Rossi-Hansberg (2008)

Evidence on Services Offshoring
• Service trade doubled between 1992 and 2002 [Jensen and Kletzer, (2005)]
• Most recent estimates by Blinder and Krueger (2009) indicate that roughly 25% of all U.S. jobs are offshorableindicate that roughly 25% of all U.S. jobs are offshorable
• Empirical evidence on the effects of offshoring on labor market oucomes is mixed
• Research primarily focused on developed countries

Services Offshoring has Negligible Effects
• Amiti and Wei (2005a) – United States
• Amiti and Wei (2005b) – United States• Amiti and Wei (2005b) – United States
• Liu and Trefler (2008)

Services Offshoring has Significant Effects
• Scholler (2007) – Germany
• Falk and Wolfmayr (2008) – Austria, Finland, • Falk and Wolfmayr (2008) – Austria, Finland, Germany, Italy and the Netherlands
Evidence on Production Offshoring
• Evidence on offshoring and domestic employment mixed
• Again most of the evidence is for developed • Again most of the evidence is for developed countries
• Although there is a large literature on the effects of FDI on labor market outcomes in developing countries which mostly find positive effects
Production Offshoring Increases Domestic Employment
• Slaughter (2003)
• Borga (2005)• Borga (2005)
• Desai et al (2005)
• Mankiw and Swagel (2006)

Production Offshoring Decreases Domestic Employment
• Brainard and Riker (2001)
• Hanson, Mataloni and Slaughter (2003)
• Harrison and McMillan (2007)
• Harrison, McMillan and Null (2007)
• Muendler (2009)
Reconciling the Different Findings
• Harrison and McMillan (2009) show that the impact of production offshoring on domestic employment depends on:– Whether firms are vertically or horizontally
integrated; horizontally integrated firms tend to substitute foreign for domestic labor while the two integrated; horizontally integrated firms tend to substitute foreign for domestic labor while the two types of labor are complementary for vertically integrated firms
– The destination of the offshoring matters; for firms that offshore to low wage countries domestic and foreign workers are substitutes while workers in the US and other high income countries tend to be complements.

Adjustment Costs: Recent Evidence
• Bergin, Feenstra and Hanson (2009) find that offshoring to Mexico increases job insecurity in Mexico
• Krishna and Senses (2009) find that trade • Krishna and Senses (2009) find that trade reform increases income volatility in the U.S.
• Artuc and McLaren (2009) and Casacubertaand Gandelman (2009) show that adjustment costs associated with trade reform are high in Turkey and Uruguay

Stylized Facts
1. Unemployment in developing countries has increased.
2. Measured in real USD, wages in developing countries have fallen.
3. Employment in the industrial sector of developing countries has stagnated or declined since 1995 with the exception of has stagnated or declined since 1995 with the exception of East Asia and the Pacific.
4. Aggressive trade liberalization by developing countries does not appear to be responsible for these aggregate trends.
5. The geographic concentration of industrial employment has shifted to developing countries.
6. This shift is largely due to China.
Policy Implications
1. Decisions to further liberalize trade should proceed with caution.
2. Policies similar to the United States’ Trade Adjustment Assistance program should be considered for countries where adjustment costs to trade appear to be high.
3. Policies designed to help displaced workers should be targeted at 3. Policies designed to help displaced workers should be targeted at occupations, not industries.
4. Policymakers should consider “soft” industrial policies that increase workers skills rather than protecting them through tariffs.
5. Policymakers should focus more on labor market conditions in China given the size of China’s industrial workforce.
6. Sub-Saharan African countries should do more to make sure they benefit from Chinese investment.

Directions for Future Research
1. Research on the general equilibrium effects of trade in developing countries is urgently needed.
2. Research on job creation in developing countries is urgently needed.
3. Researchers need better data.3. Researchers need better data.
4. We know very little about the effects of offshoring by developing countries.
5. Since the adjustment costs of trade appear to be high, more work identifying these and ways to minimize these is warranted.
6. Botswana!
Recommended