NEW APPLICATION OF INFRARED SPECTROSCOPY
IN MEDICAL DIAGNOSIS
Prof. János Mink
Department of Molecular SpectroscopyInstitute of Structural Chemistry
Chemical Research Center of theHungarian Academy of Sciences
H-1025-BudapestPusztaszeri str. 59-67.
Chemical Research Center of HAS Department of Molecular Spectroscopy
Laboratories: Infrared and Raman Spectroscopic Lab. ESR Spectroscopic Lab. NMR Spectroscopic Lab. Laser Spectroscopic Lab.
Professors: László Biczók Gábor Keresztury János Mink Lászó Nemes Antal Rockenbauer Tamás Vidóczy
28 – 16 young scientists / PhD students
University of Pannonia (Veszprém)
Research group: 5 (4) PhD / young scientists
PhD School: Material Science and Technology
Infrared and Raman Laboratory
Budapest: 2 FT-Raman systems FTIR Microscope with FPA detector (micro ATR) FTIR Microscope 2 FTIR spectrometer (ATR) FTIR emission system FTIR-GC system
Veszprém: FTIR research grade 2 FTIR routine Far-IR system Open-path FTIR
13 spectrometer
Extended Collaborations
Surface study: ATR; IRRAS; DRIFTS; EMISSION; LB-films; coatings; polymer surfaces; dispersed
catalysts; archeological samples Analytical studies: HPLC-FTIR; GC-FTIR;TLC-Raman Environmental studies: atmospheric pollutants;
aerosol-microscopy Theoretical studies: DFT; ab initio; Chemometrsics;
etc. Medical applications: human hair and skin
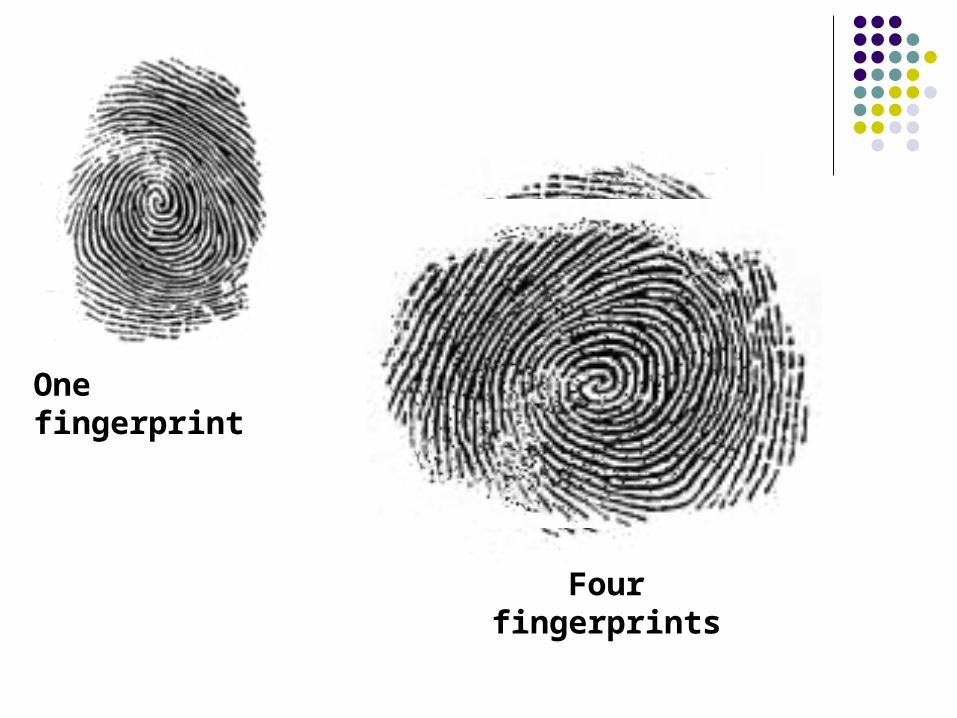
One fingerprint
Four fingerprints
Discovery of the spectral effects
Hair: Narcotics in hair Effects of bleaching Effects of UV-radiation
Skin: Moisture content Lipid content Effects of cosmetics
(Literature)
Unexpected spectral differences
Spectral parameters
• Band position
• Band intensities
• Band widths
• Spectral subtraction
• First derivative
• Second derivative
• Band deconvolution
Statistical data processing
• artificial neural network (ANN),• principal component analysis (PCA) and factor analysis (FA),• principal component regression (PCR),• partial minimum squares (PMS),• Cluster analysis (CA),• generic algorithms (GA).
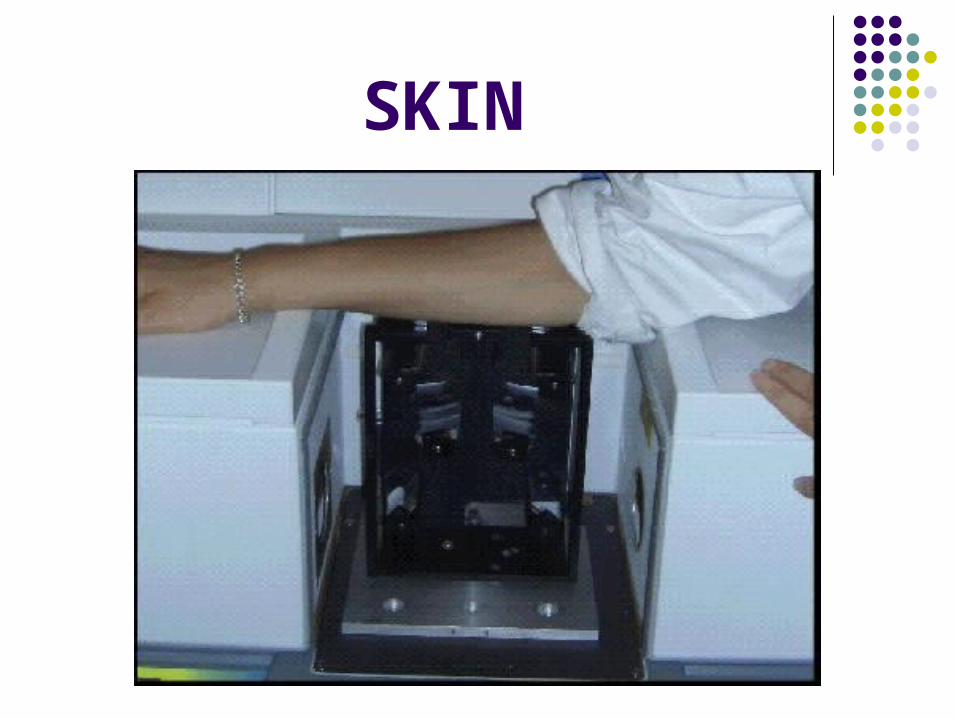
SKIN
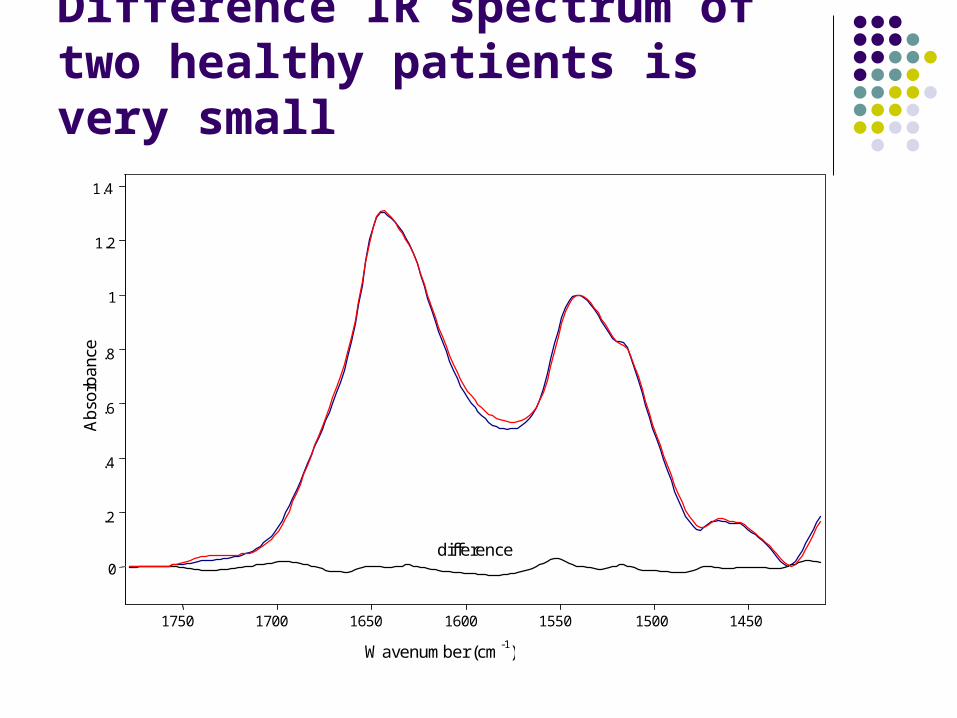
Difference IR spectrum of two healthy patients is very small
0
.2
.4
.6
.8
1
1.2
1.4
Abs
orba
nce
1750 1700 1650 1600 1550 1500 1450 Wavenumber (cm-1)
difference
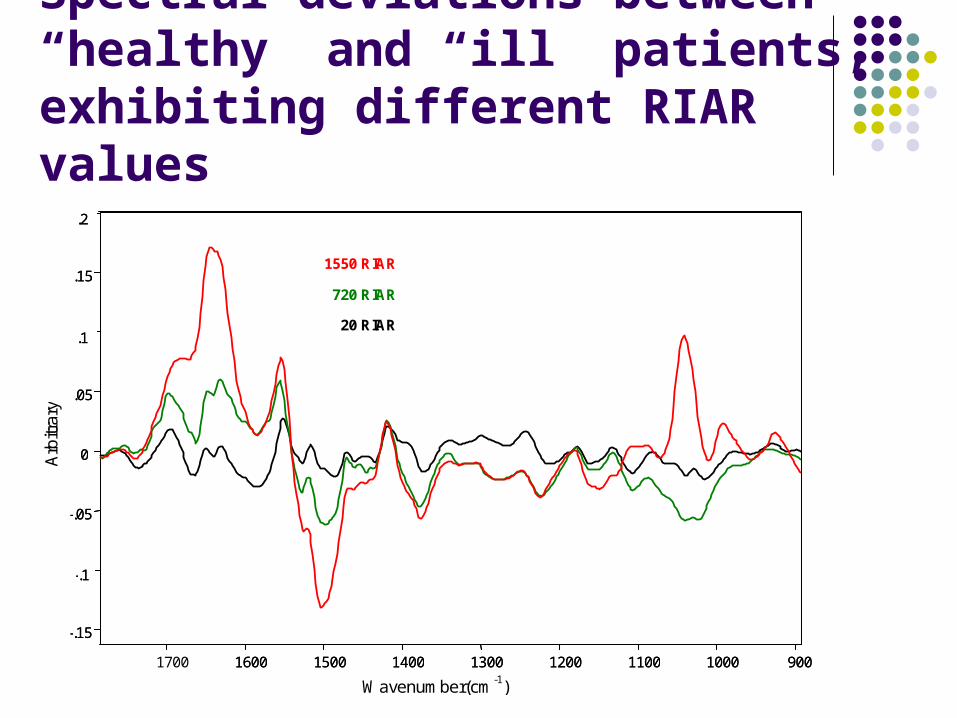
Spectral deviations between “healthy” and “ill” patients, exhibiting different RIAR values
- .15
- .1
- .05
0
.05
.1
.15
.2
Arb
itrar
y
1700 1600 1500 1400 1300 1200 1100 1000 900
Wavenumber(cm-1)
1550 RIAR 720 RIAR 20 RIAR
- .15
- .1
- .05
0
.05
.1
.15
.2
1600 1500 1400 1300 1200 1100 1000 900
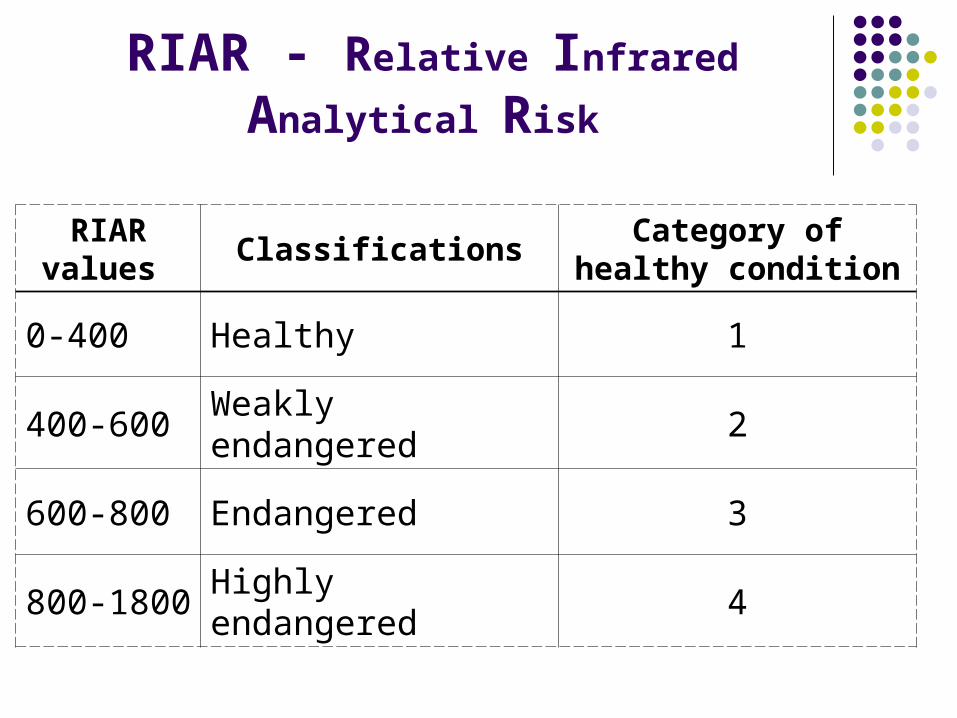
RIAR - Relative Infrared Analytical Risk
RIAR values
ClassificationsCategory of healthy
condition
0-400 Healthy 1
400-600 Weakly endangered 2
600-800 Endangered 3
800-1800 Highly endangered 4
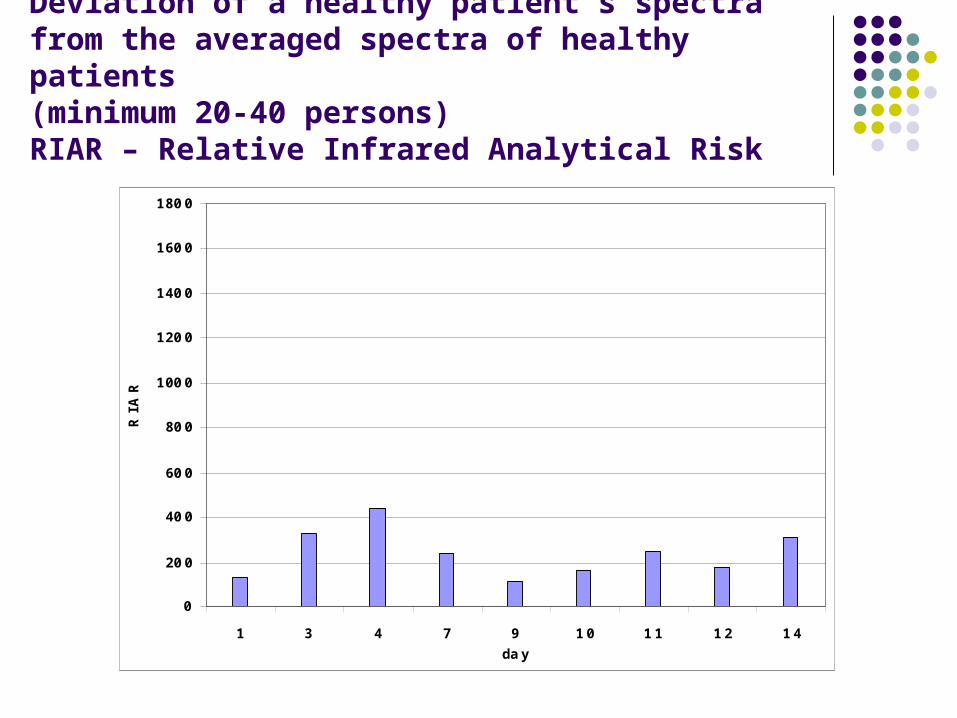
Deviation of a healthy patient’s spectra from the averaged spectra of healthy patients (minimum 20-40 persons) RIAR – Relative Infrared Analytical Risk
Ara nk a
0
20 0
40 0
60 0
80 0
100 0
120 0
140 0
160 0
180 0
1 3 4 7 9 1 0 1 1 1 2 1 4da y
RIA
R
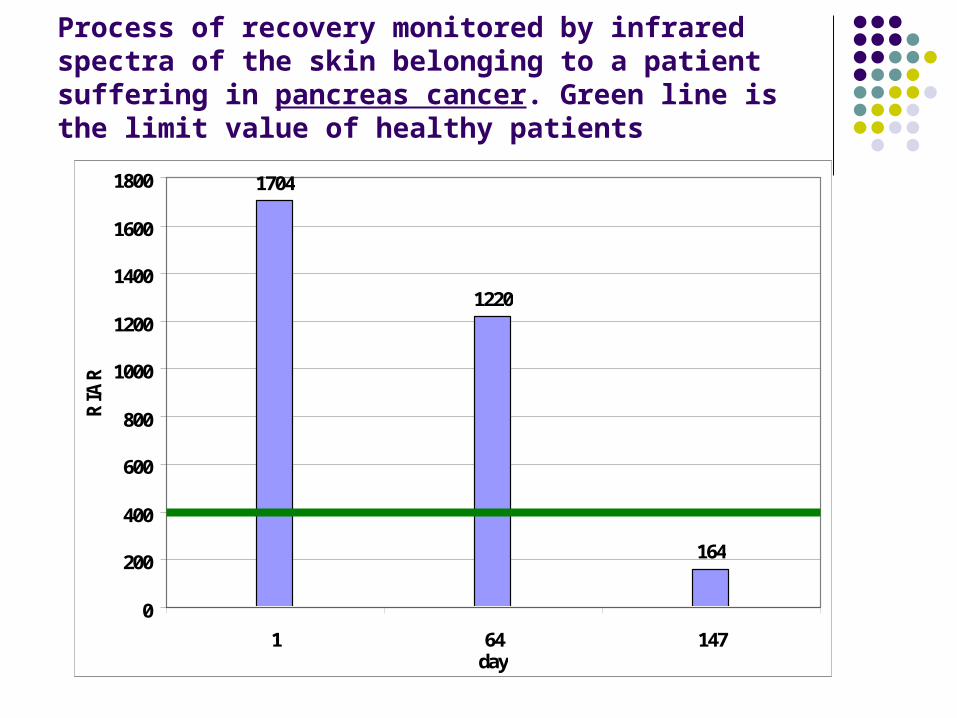
Process of recovery monitored by infrared spectra of the skin belonging to a patient suffering in pancreas cancer. Green line is the limit value of healthy patients
1704
1220
164
0
200
400
600
800
1000
1200
1400
1600
1800
1 64 147day
RIA
R
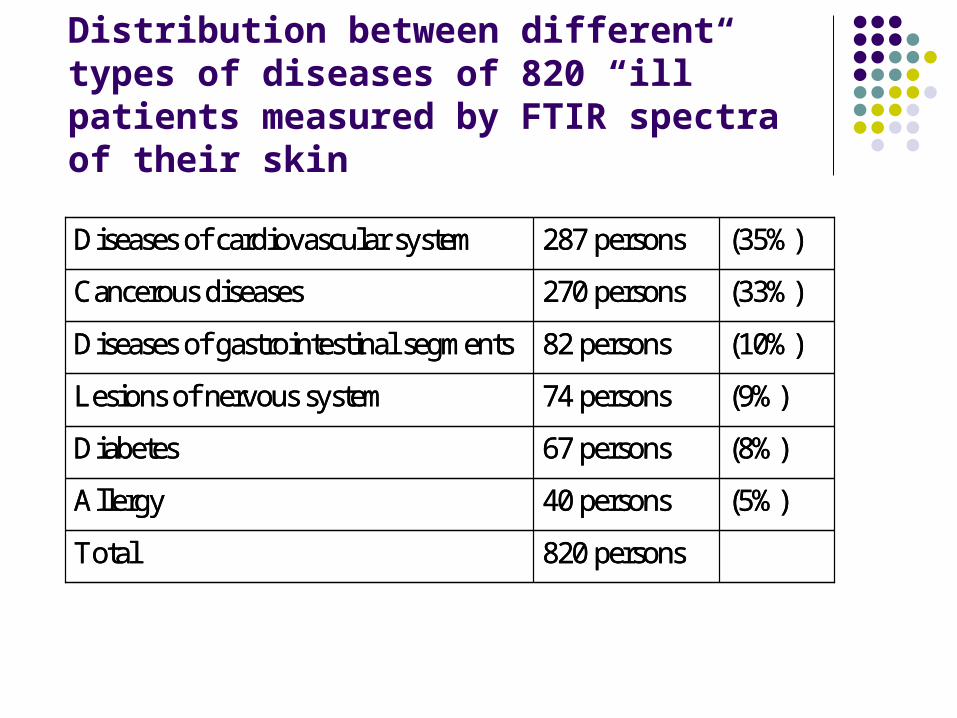
Distribution between different types of diseases of 820 “ill” patients measured by FTIR spectra of their skin
820 personsTotal
(5%)40 personsAllergy
(8%)67 personsDiabetes
(9%)74 personsLesions of nervous system
(10%)82 personsDiseases of gastrointestinal segments
(33%)270 personsCancerous diseases
(35%)287 personsDiseases of cardiovascular system
820 personsTotal
(5%)40 personsAllergy
(8%)67 personsDiabetes
(9%)74 personsLesions of nervous system
(10%)82 personsDiseases of gastrointestinal segments
(33%)270 personsCancerous diseases
(35%)287 personsDiseases of cardiovascular system
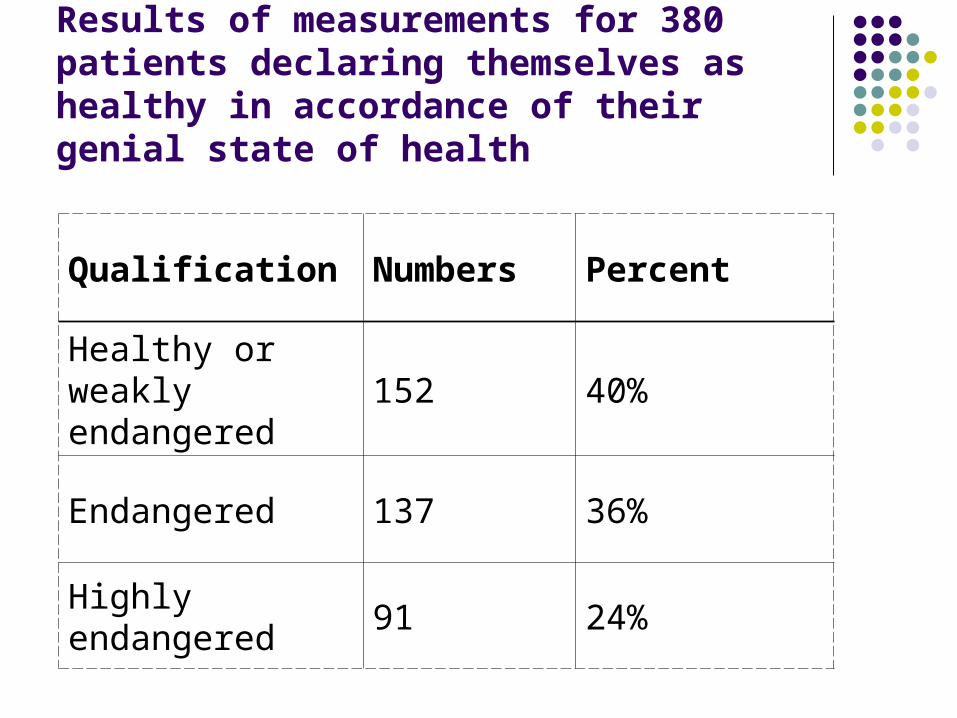
Results of measurements for 380 patients declaring themselves as healthy in accordance of their genial state of health
Qualification Numbers Percent
Healthy or weakly endangered
152 40%
Endangered 137 36%
Highly endangered
91 24%
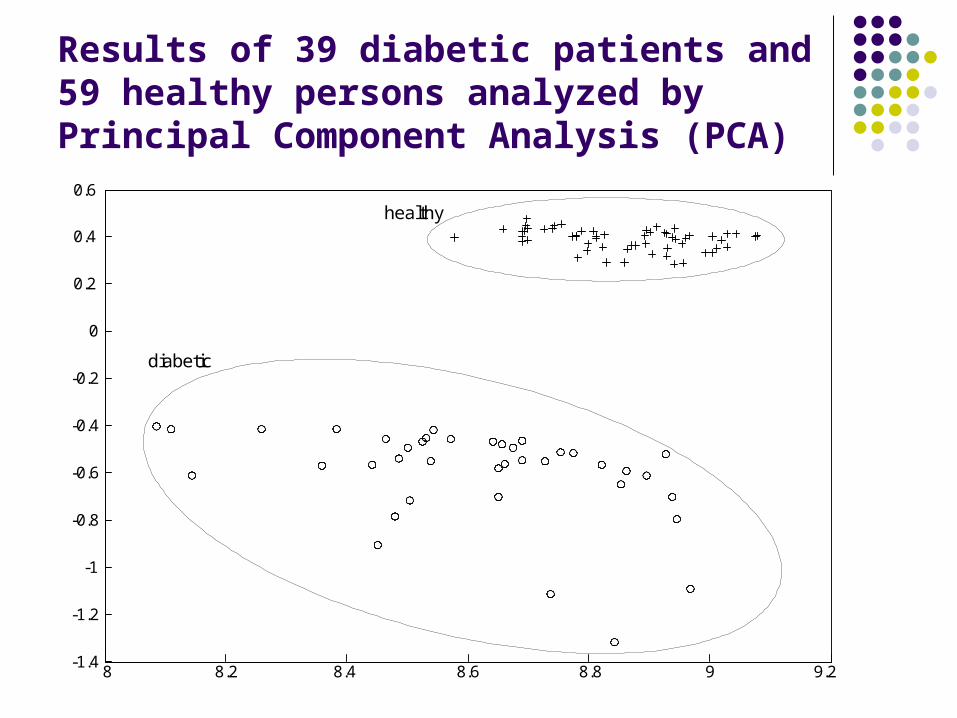
Results of 39 diabetic patients and 59 healthy persons analyzed by Principal Component Analysis (PCA)
8 8.2 8.4 8.6 8.8 9 9.2-1.4
-1.2
-1
-0.8
-0.6
-0.4
-0.2
0
0.2
0.4
0.6
diabetic
healthy
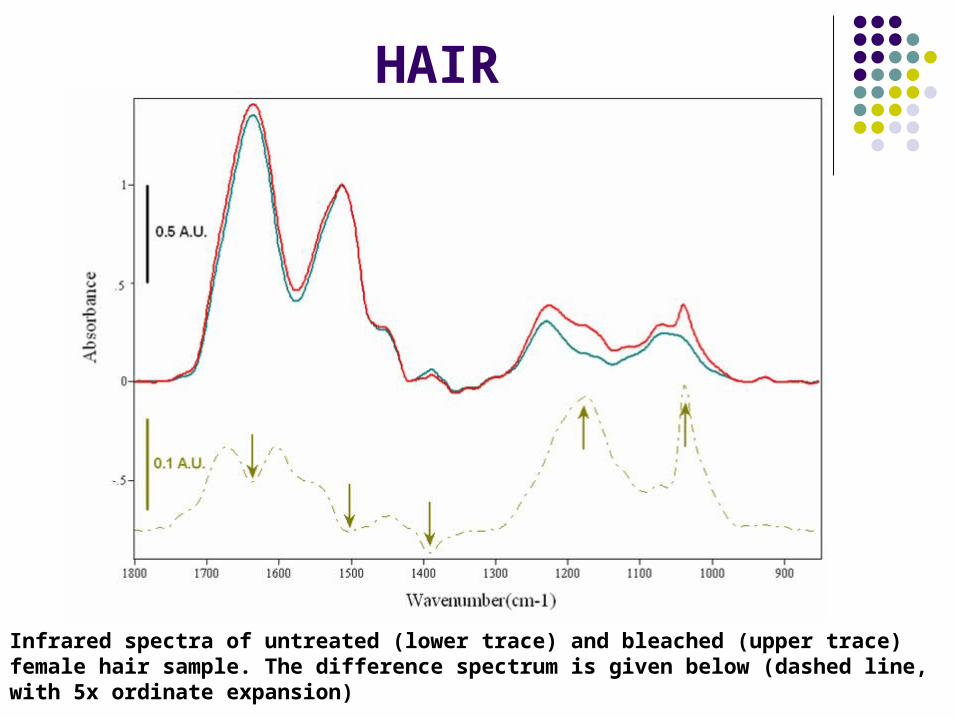
HAIR
Infrared spectra of untreated (lower trace) and bleached (upper trace) female hair sample. The difference spectrum is given below (dashed line, with 5x ordinate expansion)
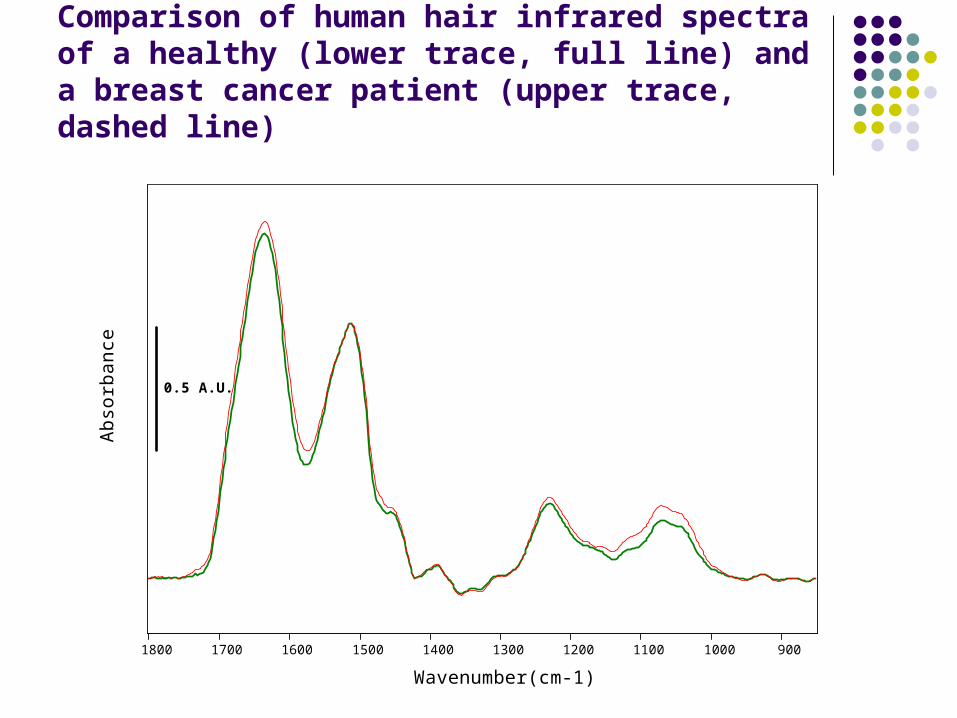
Comparison of human hair infrared spectra of a healthy (lower trace, full line) and a breast cancer patient (upper trace, dashed line)
1800 1700 1600 1500 1400 1300 1200 1100 1000 900
Wavenumber(cm-1)
Abs
orba
nce
0.5 A.U.
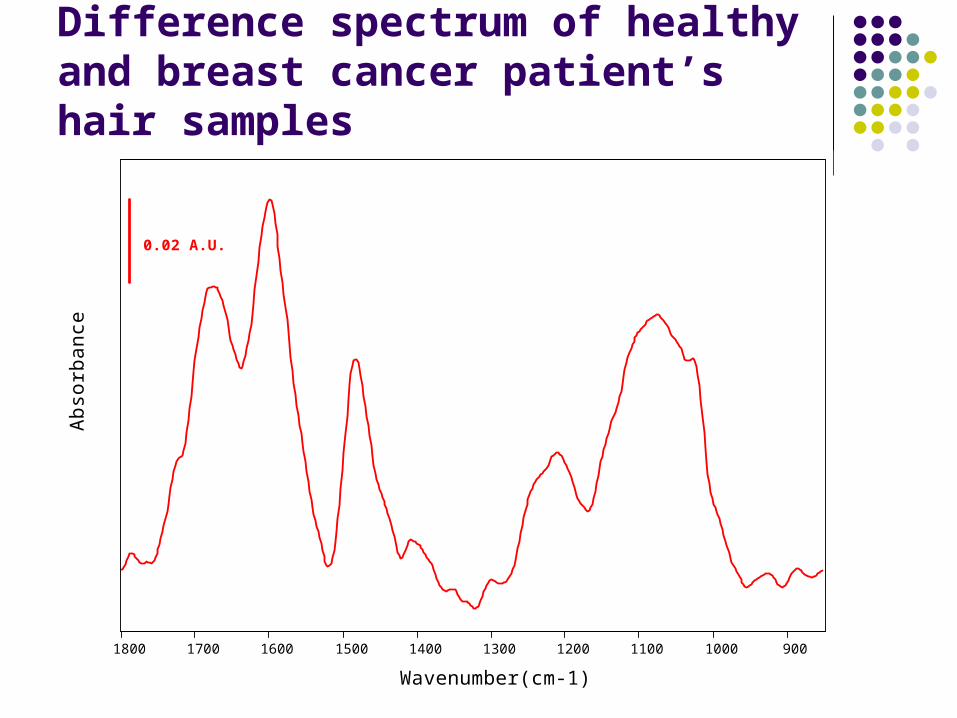
Difference spectrum of healthy and breast cancer patient’s hair samples
1800 1700 1600 1500 1400 1300 1200 1100 1000 900
Wavenumber(cm-1)
Abs
orba
nce
0.02 A.U.
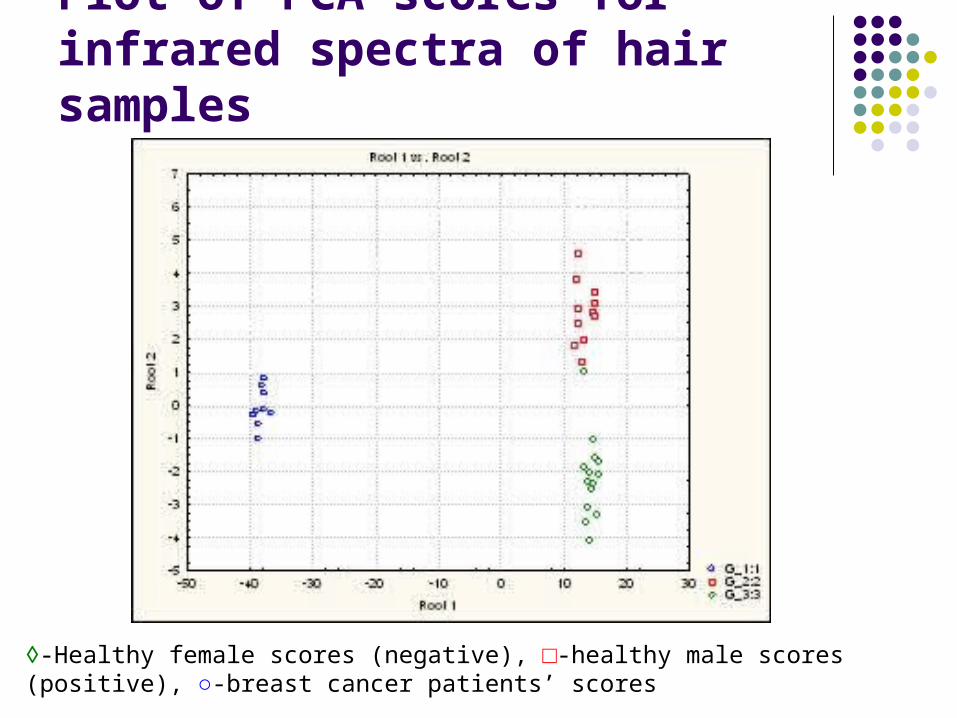
Plot of PCA scores for infrared spectra of hair samples
◊-Healthy female scores (negative), □-healthy male scores (positive), ○-breast cancer patients’ scores
Partners
• Stockholm University (Electron Microscopy)
• Institute für Innovative Diagnostik (Ulm)
• Municipal Clinic (XVI District, Budapest)
• LaborTrading Ltd./Varian (Instrumentation)
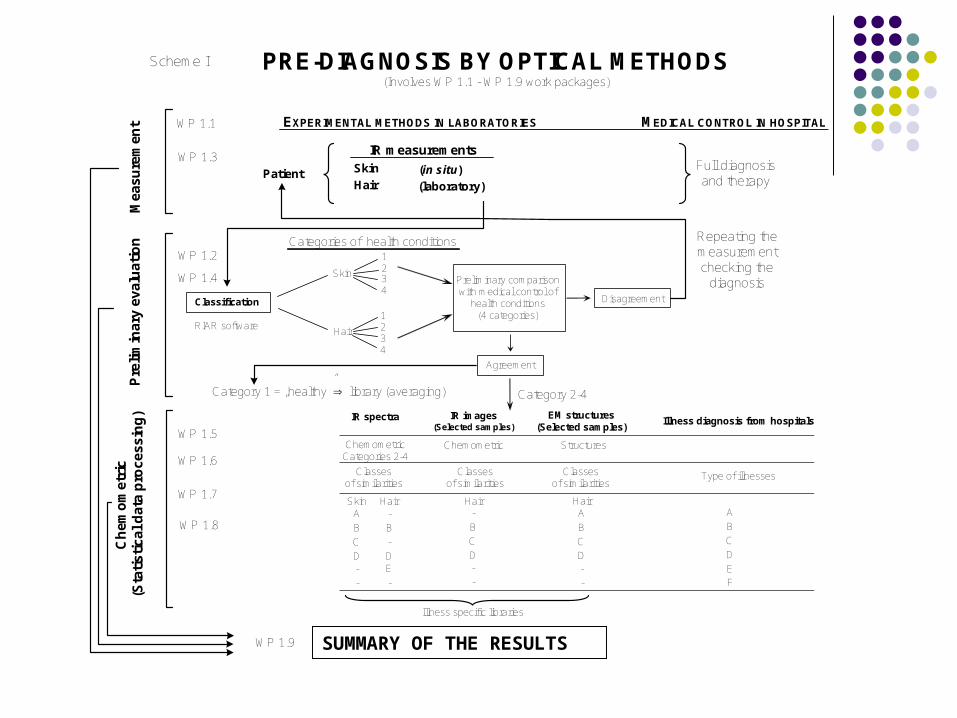
PRE-DIAGNOSIS BY OPTICAL METHODS
EXPERIMENTAL METHODS IN LABORATORIES
Full diagnosisand therapy
Patient
RIAR software
Skin
Hair
12
Categories of health conditions
1234
Category 2-4
Pre
limin
ary
eval
uat
ion
Ch
emo
met
ric
(Sta
tist
ical
dat
a p
roce
ssin
g)
Mea
sure
men
t MEDICAL CONTROL IN HOSPITAL
Repeating themeasurementchecking the
diagnosis
Classification
Preliminary comparisonwith medical control of
health conditions(4 categories)
Disagreement
34
Agreement
Category 1 = „healthy” library (averaging)
IR measurementsSkin (in situ)Hair (laboratory)
IR spectra IR images(Selected samples)
EM structures(Selected samples)
Illness diagnosis from hospitals
ChemometricCategories 2-4
Classesof similarities
Chemometric Structures
Classesof similarities
Classesof similarities
Type of illnesses
A
B
C
D-
-
-
B
C
D-
-
A
C
D-
-
B
Illness specific libraries
A
B
C
D
EF
Skin Hair-
-
DE
-
B
Hair Hair
Scheme I
(Involves WP 1.1 - WP 1.9 work packages)
WP 1.1
WP 1.3
WP 1.2
WP 1.4
WP 1.5
WP 1.6
WP 1.7
WP 1.8
SUMMARY OF THE TWO YEARS RESULTSWP 1.9 SUMMARY OF THE RESULTS
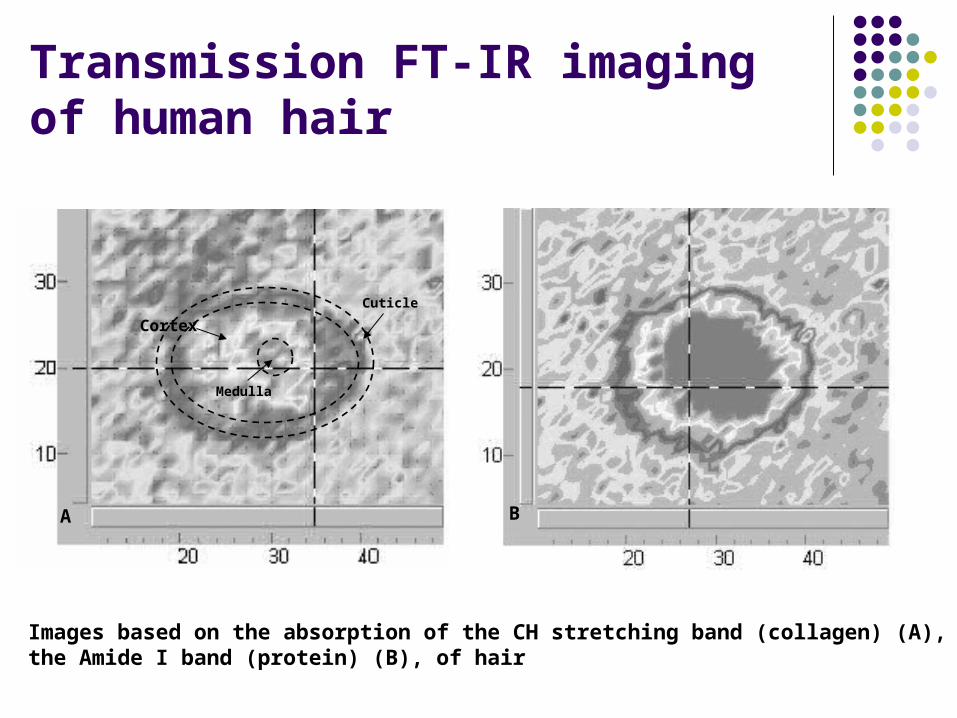
Transmission FT-IR imaging of human hair
Cuticle
Cortex
Medulla
A B
Images based on the absorption of the CH stretching band (collagen) (A), the Amide I band (protein) (B), of hair
ADVANTAGES
Detection (health condition) Prevention (early diagnosis) Monitoring Diagnosis (under investigation)
CHALLANGING
Simple methods Quick measurement (hair: ~1 min, skin: ~ ½ min)
Not invasive and painless Relative cheap Screening test in mass measures Patients showed very positive attitudes
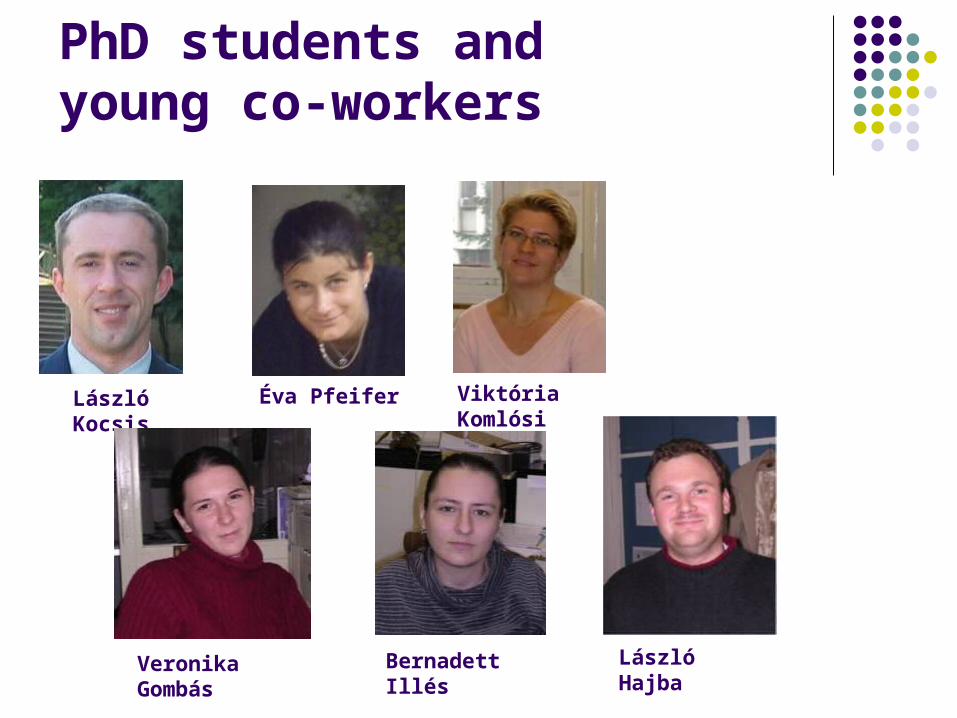
PhD students and young co-workers
László Kocsis Éva Pfeifer Viktória Komlósi
Bernadett Illés László HajbaVeronika Gombás
Csaba Németh Dr. Károly Héberger
Katalin Módly
Zsuzsanna Kovács
Dr. Gábor Keresztury
Dr. Judith Mihály Dr. Zoltán Bacsik
Co-workers

It was my great pleasure to be with you:
Thanks for Jenny, Carolyn, Jennifer, Kevin, Imre, Glenn, Chris, Mark, George, Baijn and Sam
Special thanks for April H. Foley, Ambassador of
United States

Thanks for your kind attention!!!
Recommended