doi:10.1093/brain/awh683 Brain (2006), 129, 243–255
Neuropathology of fragile X-associatedtremor/ataxia syndrome (FXTAS)
C. M. Greco,1 R. F. Berman,6 R. M. Martin,6 F. Tassone,5,7 P. H. Schwartz,10 A. Chang,11 B. D. Trapp,11
C. Iwahashi,7 J. Brunberg,2 J. Grigsby,8 D. Hessl,3,4 E. J. Becker,7 J. Papazian,5 M. A. Leehey,9
R. J. Hagerman4,5 and P. J. Hagerman5,7
Departments of 1Pathology, 2Radiology, 3Psychiatry and Behavioral Sciences, 4Pediatrics and 5MIND Institute,University of California, Davis, Medical Center, Sacramento, CA, 6Departments of Neurosurgery and 7Biochemistry andMolecular Medicine, University of California, Davis, School of Medicine, Davis, CA, Departments of 8Medicine and9Neurology, University of Colorado Health Sciences Center, Denver, CO, 10Children’s Hospital of Orange CountyResearch Institute, Orange, CA and 11Department of Neurosciences, Lerner Research Institute, Cleveland ClinicFoundation, Cleveland, OH, USA
Correspondence to: Paul J. Hagerman, MD, PhD, Department of Biochemistry and Molecular Medicine,University of California, Davis, School of Medicine, One Shields Avenue, Davis, CA, USAE-mail: [email protected]
Fragile X-associated tremor/ataxia syndrome (FXTAS) is an adult-onset neurodegenerative disorder thataffects carriers, principally males, of premutation alleles (55–200 CGG repeats) of the fragile X mental retarda-tion 1 (FMR1) gene. Clinical features of FXTAS include progressive intention tremor and gait ataxia, accom-panied by characteristic white matter abnormalities on MRI. The neuropathological hallmark of FXTAS is anintranuclear inclusion, present in both neurons and astrocytes throughout the CNS. Prior to the current work,the nature of the associations between inclusion loads and molecular measures (e.g. CGG repeat) was notdefined. Post-mortem brain and spinal cord tissue has been examined for gross and microscopic pathology ina series of 11 FXTAS cases (males, age 67–87 years at the time of death). Quantitative counts of inclusionnumbers were performed in various brain regions in both neurons and astrocytes. Inclusion counts werecompared with specific molecular (CGG repeat, FMR1 mRNA level) and clinical (age of onset, age ofdeath) parameters. In the current series, the three most prominent neuropathological characteristics are(i) significant cerebral and cerebellar white matter disease, (ii) associated astrocytic pathology with dramat-ically enlarged inclusion-bearing astrocytes prominent in cerebral white matter and (iii) the presence of intra-nuclear inclusions in both brain and spinal cord. The pattern of white matter pathology is distinct from thatassociated with hypertensive vascular disease and other diseases of white matter. Spongiosis was present in themiddle cerebellar peduncles in seven of the eight cases in which those tissues were available for study. There isinclusion formation in cranial nerve nucleus XII and in autonomic neurons of the spinal cord. The most strikingfinding is the highly significant association between the number of CGG repeats and the numbers of intranuc-lear inclusions in both neurons and astrocytes, indicating that the CGG repeat is a powerful predictor ofneurological involvement in males, both clinically (age of death) and neuropathologically (number of inclusions).
Keywords: trinucleotide repeat; dementia; RNA toxicity; Parkinson; FMR1
Abbreviations: FXTAS = fragile X-associated tremor/ataxia syndrome; GFAP = glial fibrillary acidic protein;MCPs = middle cerebellar peduncles; ROIs = regions of interest
Received July 14, 2005. Revised October 5, 2005. Accepted October 6, 2005. Advance Access published on December 5, 2005
IntroductionFragile X-associated tremor/ataxia syndrome (FXTAS) is a
recently discovered disorder that affects more than one-
third of older adult male carriers of premutation alleles
(55–200 CGG repeats) of the fragile X mental retardation 1
(FMR1) gene (Hagerman et al., 2001; Berry-Kravis et al., 2003;
Jacquemont et al., 2003, 2004b; Leehey et al., 2003; Hagerman
# The Author (2005). Published by Oxford University Press on behalf of the Guarantors of Brain. All rights reserved. For Permissions, please email: [email protected]
Dow
nloaded from https://academ
ic.oup.com/brain/article/129/1/243/311853 by guest on 15 D
ecember 2021
and Hagerman, 2004). Some female carriers also develop
FXTAS (Hagerman et al., 2004; Zuhlke et al., 2004;
Berry-Kravis et al., 2005; Jacquemont et al., 2005), although
with much lower incidence than males (Berry-Kravis et al.,
2003; Jacquemont et al., 2004b). In addition to the core fea-
tures of progressive intention tremor and gait ataxia, affected
individuals commonly have parkinsonism, autonomic dys-
function, cognitive decline, emotional problems including
disinhibition and apathy, and peripheral neuropathy
(Jacquemont et al., 2003, 2004a; Bacalman et al., 2005).
MRI findings include global brain atrophy and white matter
alterations manifested as increased T2 signal intensity in the
subcortical regions and in middle cerebellar peduncles
(MCPs) (Brunberg et al., 2002), consistent with a previous
report of spongiosis in the deep cerebellar white matter
(Greco et al., 2002).
Based on a carrier frequency of �1 in 800 carrier males and
1 in 260 carrier females in the general population (Rousseau
et al., 1995; Dombrowski et al., 2002), it is likely that as many
as 1 in 3000 males will have a lifetime risk of developing
FXTAS. Thus, FXTAS could be a common single-gene
cause of tremor, ataxia and cognitive decline among older
adults (Hagerman and Hagerman, 2004; Jacquemont et al.,
2004b). How the clinical and neuropathological features of
FXTAS correlate with the size of the CGG repeat within the
premutation range is unknown. Such knowledge would
improve our understanding of the disease mechanism and
provide better estimates of disease prevalence and severity
within the general population.
We previously reported neuropathological findings in four
males who died with FXTAS (Greco et al., 2002). Those find-
ings included eosinophilic intranuclear inclusions in neurons
and astrocytes throughout the cortex and in deep cerebellar
nuclei, but not in Purkinje cells of the cerebellum. The inclu-
sions appear as well-delineated, eosinophilic, 2–5 micron
spheres that are PAS, silver, tau and synuclein negative,
and ubiquitin and aB-crystallin positive (Greco et al.,
2002; Iwahashi et al., 2005). To provide a more systematic
evaluation of the neuropathological changes in FXTAS and, in
particular, to assess the variation in number and distribution
of the intranuclear inclusions, we have analysed an additional
seven cases of FXTAS post-mortem. The results of this ana-
lysis confirm the major histological features of the white mat-
ter disease, and establish the presence of inclusions as an
essentially constant feature of FXTAS in males. Furthermore,
within the current cases, there are highly significant associ-
ations between CGG repeat length and both the number of
inclusions and the age of death.
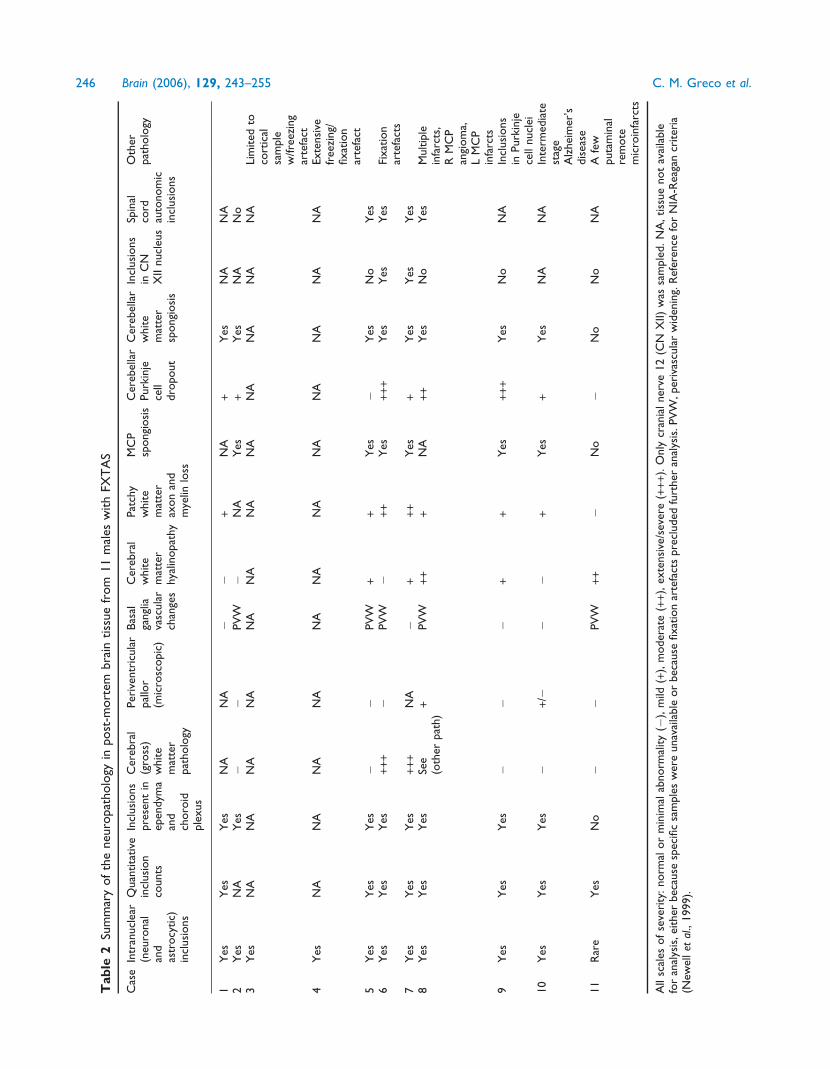
Clinical and neuropathological summariesof the current seriesKey clinical features of all 11 cases analysed to date are presen-
ted in Table 1; the corresponding neuropathological features
are presented in Table 2. Cases 1–4 have been presented pre-
viously (Greco et al., 2002). The cases were all identified as
grandfathers of children with fragile X syndrome. Two cases
(10 and 11) are noteworthy for unusual features of involve-
ment. For Case 10, with the most rapid decline to dementia of
all of the patients in the current series, neuropathological
examination revealed neurofibrillary tangles and neuritic pla-
ques in numbers and distribution consistent with a diagnosis
of intermediate stage Alzheimer’s disease (NIA-Reagan cri-
teria; Newell et al., 1999), in addition to his diagnosis of
FXTAS, as reported previously (Mothersead et al., 2005).
This patient demonstrated significant muscle weakness, mus-
cle atrophy and shortness of breath in the late stages of his
disease, and became obtunded and died from aspiration
pneumonia after choking on liquids. Case 11, with the smal-
lest CGG expansion (65 repeats, determined after death) of
this series (Table 1), displayed a very mild phenotype without
noticeable tremor. From a clinical perspective, it would have
been difficult to make a diagnosis of FXTAS in this case, since
no MRI was performed before death, and since neurological
symptoms (ataxia) appeared only within 1 year of death.
Neuropathological features were also quite mild (Table 2),
and although several inclusions were observed in a manual
scan of hippocampal neurons, they were quite rare (<1%) and
were absent in the astrocytic population. There was no sub-
cortical white matter pathology, nor was there spongiosis in
the MCP or deep cerebellar white matter.
MethodsPathologyAutopsiesBrain autopsies of Cases 5–11 were performed in a standard fashion
and in accordance with University of California, Davis, IRB approved
protocols. Autopsies of Cases 1–4 were reported in Greco et al.
(2002). In most cases, one-half of the fresh brain was cut in coronal
sections and frozen at �70�C, with the remaining half fixed in 10%
formalin. In some cases, the entire brainstem and cerebellum were
fixed in formalin for post-mortem MRI studies. After 2 weeks of
formalin fixation, hemispheres were cut into 1 cm coronal sections.
The brains were routinely sampled to include cerebral cortex, basal
ganglia, hippocampus, midbrain, pons, middle cerebellar peduncles,
medulla and cerebellum.
Histology and immunochemistryTissue blocks were processed for paraffin embedding in a
standard fashion. Staining using haematoxylin and eosin (H&E),
and luxol fast blue counterstained with periodic acid-Schiff
(myelin), were performed according to the standard methods.
Staining with silver (modified Bielschowsky) stain for axons was
performed on selected cases (Greco et al., 2002). Immunocytochem-
ical staining using anti-ubiquitin, anti-glial fibrillary acidic protein
(anti-GFAP), anti-CD68 (KP-1; Dako, Carpenteria, CA, USA),
anti-LCA (CD-45; DakoCytomation, Denmark) and anti-
neurofilament (Dako) antibodies was performed using methods
reported previously (Greco et al., 2002). Dual-label (MBP/ubiquitin)
biquitin) immunostaining was performed using the avidin–biotin
procedure, with anti-myelin basic protein antibody (SM 194;
244 Brain (2006), 129, 243–255 C. M. Greco et al.
Dow
nloaded from https://academ
ic.oup.com/brain/article/129/1/243/311853 by guest on 15 D
ecember 2021
Tab
le1
Clin
ical
and
mole
cula
rpro
file
sof
the
elev
enca
ses
des
crib
edin
the
curr
ent
study
12
34
56
7*
89
10
11
Age
of
dea
th70
78
69
84
67
77
76
75
81
67
87
Age
of
trem
or
onse
t67
Pre
sent
None
70
55
64
None
72
77
61
None
Age
of
atax
iaonse
t60
65
64
70
48
65
70
72
65
63
86
Age
of
cane/
wal
ker
use
63
NA
Nev
er82:C
ane
83:W
alke
r58:C
ane
70:C
ane
71:W
alke
r73:C
ane
74:W
alke
r73:W
alke
r75:C
ane
77:W
alke
r64:C
ane
65:W
alke
r86:C
ane
86:W
alke
rA
geof
whee
lchai
ruse
65.5
NA
Nev
er83
60
71
75
Nev
er78
65
Nev
er
FXT
AS
stag
e6
NA
36
56
65
56
NA
Cogn
itiv
edefi
cits
Dem
entia
Mem
ory
loss
Mem
ory
loss
Mem
ory
loss
Mem
ory
loss
Dem
entia
Dem
entia
Mem
ory
loss
Dem
entia
Dem
entia
Word
retr
ieva
ldiffi
cultie
sSe
nso
ry/m
oto
rdys
funct
ion
LEw
eakn
ess
NA
LEw
eakn
ess
LEw
eakn
ess
LEw
eakn
ess
&se
nso
rylo
ss
LEw
eakn
ess
LEw
eakn
ess
&se
nso
rylo
ss
None
None
LEse
nso
rylo
ssR
tLE
senso
rylo
ss(p
ost
-CV
A)
Par
kinso
nis
mN
AC
ogw
hee
ling
None
Res
ting
trem
or,
bra
dyk
ines
ia,
stiff
nes
s,hyp
om
imia
NA
Res
ting
trem
or
Mas
ked
faci
esN
one
None
None
None
MR
Ifindin
gsN
AM
ildC
CA
(on
CT
)M
CP+
;C
CA
;W
MD
CC
A(o
nC
T)
NA
MC
P+
;C
CA
;W
MD
MC
P+
NA
due
topac
emak
erM
CP+
;C
CA
;W
MD
MC
P+
;C
CA
;W
MD
NA
Em
otional
sym
pto
ms
Dep
ress
ion
NA
Dep
ress
ion,
ange
routb
urs
ts,
anxie
ty
NA
Dep
ress
ion,
anxie
tyA
nge
routb
urs
tsN
AN
AD
epre
ssio
n,
mood
inst
abili
ty,
psy
chotic
epis
odes
Dep
ress
ion,
anxie
ty,
ange
routb
urs
ts
None
Dys
phag
iaY
YN
YN
YN
NA
NY
NA
Hyp
erte
nsi
on
NN
AY
NY
YY
NY
YY
Inco
ntinen
ceY
NA
NN
YY
NN
YY
YIm
pote
nce
YN
AN
NN
AY
NN
YN
NA
Oth
erm
edic
alis
sues
Typ
eII
DM
;C
AD
;C
OPD
;M
IN
AC
olo
nca
;C
HF
Mitra
lva
lve
repla
cem
ent;
pac
emak
er
Bla
dder
ca;
pro
stat
eca
;C
AD
;at
rial
fib;C
VA
RA
;C
HF;
angi
opla
sty
&st
ent
CH
F;si
cksi
nus
syndro
me;
MI·
2tr
iple
byp
ass;
pac
emak
er
Pac
emak
er;
CH
FT
riple
byp
ass;
dea
fnes
sin
Lea
r;m
alig
nan
tta
chyc
ardia
;A
S
Nose
ble
eds;
poly
ps;
pro
stat
ecto
my
CV
A;
hyp
oth
yroid
;B
PH
;ost
eoar
thri
tis;
DV
T;ir
rita
ble
bla
dder
CG
Gre
pea
ts113
80
80
71
105
77
88
92
88
93
65
FMR1
mR
NA
(SEM
)3.8
(0.1
3)
NA
NA
NA
6.7
2(0
.92)
3.8
7(0
.58)
7.0
(0.4
7)
2.2
7(0
.45)
4.1
3(0
.49)
3.4
6(0
.29)
NA
%FM
RP
62
NA
NA
NA
63
74
68
89
73
89
NA
NA=
notav
aila
ble
;WM
D=
white
mat
ter
dis
ease
;CC
A=
cort
ical
and
cere
bel
lar
atro
phy;
LE=
low
erex
trem
ity;
RA=
rheu
mat
oid
arth
ritis;
OS=
ost
eoar
thri
tis;
DM=
dia
bet
esm
ellit
us;
ca=
cance
r;C
HF=
conge
stiv
ehea
rtfa
ilure
;MI=
myo
card
iali
nfa
rction;C
OPD
=ch
ronic
obst
ruct
ive
pulm
onar
ydis
ease
;CA
D=
coro
nar
yar
tery
dis
ease
;AS=
aort
icst
enosi
s;C
VA=
cere
bra
lvas
cula
rac
ciden
t;D
VT=
dee
pve
inth
rom
bosi
s;B
PH=
ben
ign
pro
stat
ichyp
ertr
ophy.
FXT
AS
stag
e:st
ages
0/1
,unin
volv
ed/e
quiv
oca
linvo
lvem
ent;
stag
e2,d
efinite
trem
or
or
atax
ianotin
terf
erin
gw
ith
AD
Ls;s
tage
3,t
rem
or
or
atax
iain
terf
erin
gw
ith
AD
Ls;s
tage
4,u
seofa
cane
or
wal
ker;
stag
e5,u
seofa
whee
lchai
r;st
age
6,b
edri
dden
(Bac
alm
anetal
.,2005).
*Bro
ther
of
Cas
e6.
Neuropathology of FXTAS Brain (2006), 129, 243–255 245
Dow
nloaded from https://academ
ic.oup.com/brain/article/129/1/243/311853 by guest on 15 D
ecember 2021
Tab
le2
Sum
mar
yof
the
neu
ropat
holo
gyin
post
-mort
embra
intiss
ue
from
11
mal
esw
ith
FXT
AS
Cas
eIn
tran
ucl
ear
(neu
ronal
and
astr
ocy
tic)
incl
usi
ons
Quan
tita
tive
incl
usi
on
counts
Incl
usi
ons
pre
sent
inep
endym
aan
dch
oro
idple
xus
Cer
ebra
l(g
ross
)w
hite
mat
ter
pat
holo
gy
Per
iven
tric
ula
rpal
lor
(mic
rosc
opic
)
Bas
alga
ngl
iava
scula
rch
ange
s
Cer
ebra
lw
hite
mat
ter
hya
linopat
hy
Pat
chy
white
mat
ter
axon
and
mye
linlo
ss
MC
Psp
ongi
osi
sC
ereb
ella
rPurk
inje
cell
dro
pout
Cer
ebel
lar
white
mat
ter
spongi
osi
s
Incl
usi
ons
inC
NX
IInucl
eus
Spin
alco
rdau
tonom
icin
clusi
ons
Oth
erpat
holo
gy
1Y
esY
esY
esN
AN
A�
�+
NA
+Y
esN
AN
A2
Yes
NA
Yes
��
PV
W�
NA
Yes
+Y
esN
AN
o3
Yes
NA
NA
NA
NA
NA
NA
NA
NA
NA
NA
NA
NA
Lim
ited
toco
rtic
alsa
mple
w/fre
ezin
gar
tefa
ct4
Yes
NA
NA
NA
NA
NA
NA
NA
NA
NA
NA
NA
NA
Exte
nsi
vefr
eezi
ng/
fixat
ion
arte
fact
5Y
esY
esY
es�
�PV
W+
+Y
es�
Yes
No
Yes
6Y
esY
esY
es+++
�PV
W�
++
Yes
+++
Yes
Yes
Yes
Fixat
ion
arte
fact
s7
Yes
Yes
Yes
+++
NA
�+
++
Yes
+Y
esY
esY
es8
Yes
Yes
Yes
See
(oth
erpat
h)+
PV
W++
+N
A++
Yes
No
Yes
Multip
lein
farc
ts,
RM
CP
angi
om
a,L
MC
Pin
farc
ts9
Yes
Yes
Yes
��
�+
+Y
es+++
Yes
No
NA
Incl
usi
ons
inPurk
inje
cell
nucl
ei10
Yes
Yes
Yes
�+
/��
�+
Yes
+Y
esN
AN
AIn
term
edia
test
age
Alz
hei
mer
’sdis
ease
11
Rar
eY
esN
o�
�PV
W++
�N
o�
No
No
NA
Afe
wputa
min
alre
mote
mic
roin
farc
ts
All
scal
esof
seve
rity
:norm
alor
min
imal
abnorm
ality
(�),
mild
(+),
moder
ate
(++
),ex
tensi
ve/s
ever
e(+++
).O
nly
cran
ialner
ve12
(CN
XII)
was
sam
ple
d.N
A,tiss
ue
not
avai
lable
for
anal
ysis
,ei
ther
bec
ause
spec
ific
sam
ple
sw
ere
unav
aila
ble
or
bec
ause
fixat
ion
arte
fact
spre
cluded
furt
her
anal
ysis
.PV
W,per
ivas
cula
rw
iden
ing.
Ref
eren
cefo
rN
IA-R
eaga
ncr
iter
ia(N
ewel
let
al.,
1999).
246 Brain (2006), 129, 243–255 C. M. Greco et al.
Dow
nloaded from https://academ
ic.oup.com/brain/article/129/1/243/311853 by guest on 15 D
ecember 2021
Sternberger Monoclonals, Baltimore, MD, USA) visualized with
DAB and the anti-ubiquitin antibody (Dako, Glostrup, Denmark)
visualized with Vector Nova Red Substrate (Vector Laboratories,
Burlingame, CA, USA). Appropriate positive and negative controls
were employed for each antibody.
Intranuclear inclusion and cell countsThe percentages of neurons and astrocytes harbouring intranuclear
inclusions were determined for frontal cortex, hippocampus and the
ventral pontine region. Tissue blocks of frontal cortex, hippocampus
and pons were obtained from 8 out of 11 male FXTAS patients
(Cases 3, 4 and 6 had fixation artefacts that precluded further
analysis of neuronal densities/inclusion counts) and 10 normal
(no neurological disease), age-matched control subjects (5 male
and 5 female). Control males were chosen to match the average
age of the carrier male group. Ages of the control males ranged
from 60 to 76 years. The analysis of cell counts and neuronal densities
utilized those cases that had sufficient tissue for serial sectioning
and were free of severe fixation artefacts that precluded stereological
evaluation. Control cases were extracted from the pathology files
at the University of California, Davis Medical Center Department
of Pathology, in accordance with a UC Davis approved IRB
protocol. Brain tissue samples were cut from the same region
and, to the extent possible, in the same orientation to facilitate
histological analyses. Tissue was paraffin embedded, sectioned at
10 mm and stained with H&E. Every fifth section was used for
histological analysis, for a total of three tissue sections for each
brain region.
Regions of interest (ROIs) were then outlined within the frontal
cortex, hippocampus and ventral pontine region using a Nikon E600
microscope; an unbiased and random sample of neurons and astro-
cytes within these ROIs was used to estimate the percentage of cells
with intranuclear inclusions. In the hippocampus, with well-defined
morphological boundaries, three ROIs were outlined (CA1, granule
cell layer and hilus). In the frontal cortex and ventral pontine region,
well-defined ROIs could not be generated using cytoarchitectonic
boundaries; therefore, ROIs were defined as a constant area within
cortical grey and white matter and in the pontine nuclei. The area of
the ROI outlined in the grey matter was set to 1.8 · 107 mm2, and
encompassed cortical layers II–VI, while an area of 1.2 · 107 mm2 was
used in the cortical white matter ROI. The pontine ROI was set to an
area of 4.0 · 106 mm2.
Cell identification within ROIs was carried out primarily on H&E
stained sections using standard morphological criteria. Neurons
were identified by their size; by large, centrally placed, round-to-
ovoid nuclei with dense heterochromatin and nucleoli; and by
their abundant cytoplasm. Astrocytes were identified by their irregu-
lar, ovoid nuclei with light euchromatin, their lack of nucleoli and
the absence of cytoplasm. In most cases, neuronal and astrocytic
nuclei were easily distinguished by the above criteria, with the
added feature of astrocyte location (perivascular or immediately
adjacent to neuronal cytoplasmic borders). In the small number
of instances where cortical granular neuronal nuclei might be of
the same size as astrocytic nuclei, and did not show nucleoli or
obvious cytoplasmic borders, we relied on the chromatin pattern
of the nucleus to distinguish between the cell types. These distinc-
tions were also verified in separate GFAP staining experiments.
Neurons bearing intranuclear inclusions were not otherwise struc-
turally altered. Astrocytic nuclei containing inclusions were increased
in size and showed a clear halo around the inclusion (Greco et al.,
2002). Oligodendroglial nuclei were distinguished as small, round,
hyperchromatic nuclei that showed neither nucleoli nor cytoplasm.
In addition to their diffuse distribution throughout white matter,
oligodendroglia can closely oppose neuronal cell bodies. Eosino-
philic intranuclear inclusions were identified as described previously
(Greco et al., 2002).
The optical fractionator probe in the Stereo Investigator software
(Microbrightfield, Inc., Williston, VT) was used to overlay sampling
grids across each ROI. Counting frames were then defined within the
sampling grids, and neurons and astrocytes with and without inclu-
sions that fell within the counting frames were counted using a ·100
oil immersion objective. Counting frames were set at 90 mm · 90 mm
except for the hippocampal granule cell layer where they were
50 mm · 50 mm due to the increased granule cell density. The
individual ratios of the number of neurons and astrocytes with
inclusions to the total sample of each were determined (i.e. number
with inclusions/total sample), and were then used to calculate the
percentage of each cell type with inclusions (Tables 3–5). In addition,
estimates of neuronal and astrocyte densities (cells/mm3) within
cortical ROIs were calculated from optical fractionator cell counts
and Cavalieri volume measurements.
Because generalized brain atrophy has been associated with
FXTAS, average cortical thickness was directly measured in the
grey matter of the frontal cortex using the distance measurement
functions of the Stereo Investigator software. Briefly, for each tissue
section, three distinct lines were drawn from and perpendicular to
the cortical surface, extending medially to the grey matter/white
matter interface. The average lengths (mm) of the lines were used
to estimate mean cortical thickness.
Statistical analysesEstimates of neuronal and astrocytic densities in cortex and cortical
grey matter thickness were compared between FXTAS patients
and controls by analysis of variance (SPSS Inc, Chicago, IL, USA).
Correlations were calculated between histological findings, mole-
cular measures (e.g. number of CGG repeats, levels of FMR1
mRNA and FMRP) and clinical findings (e.g. age of onset of ataxia,
age of death) using Spearman’s rho (SPSS). For multiple correla-
tions, the alpha levels for minimum statistical significance were
adjusted to reduce the possibility of type I errors (i.e. familywise
error rate) using Bonferroni’s correction (Curtin and Schulz, 1998),
with separate (familywise) groupings of histological, molecular and
clinical correlations. Molecular/inclusion correlations and statistical
analyses were performed separately for each brain region (i.e. frontal,
cortical grey, hippocampal CA1, etc.). The Benjamini–Hochberg
procedure was also used to control for false discovery rate
(Benjamini and Hochberg, 1995). With both procedures, adjusted
alpha levels ranged from 0.008 to 0.50 and yielded an identical set
of statistically significant correlations for the data presented in this
study.
Molecular measuresGenomic DNA and total RNA were isolated from peripheral blood
leucocytes obtained prior to death, and from post-mortem sections
of �500 mg of brain tissue using standard methods (Puregene and
Purescript Kits; Gentra Inc., Minneapolis, MN, USA). Southern blot-
and PCR-based genotyping, and FMR1 mRNA quantification, were
performed as described previously (Tassone et al., 2000b, 2004).
Immunocytochemical detection of FMRP was performed on
blood smears as described previously (Tassone et al., 1999).
Neuropathology of FXTAS Brain (2006), 129, 243–255 247
Dow
nloaded from https://academ
ic.oup.com/brain/article/129/1/243/311853 by guest on 15 D
ecember 2021
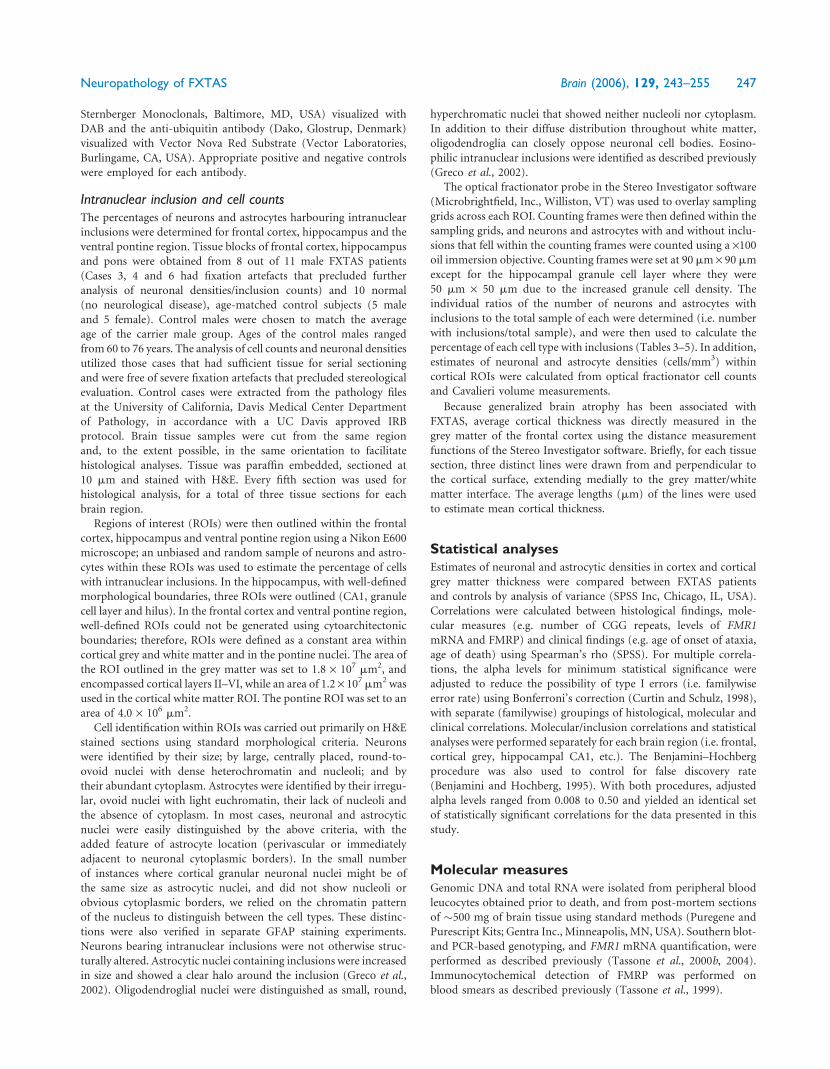
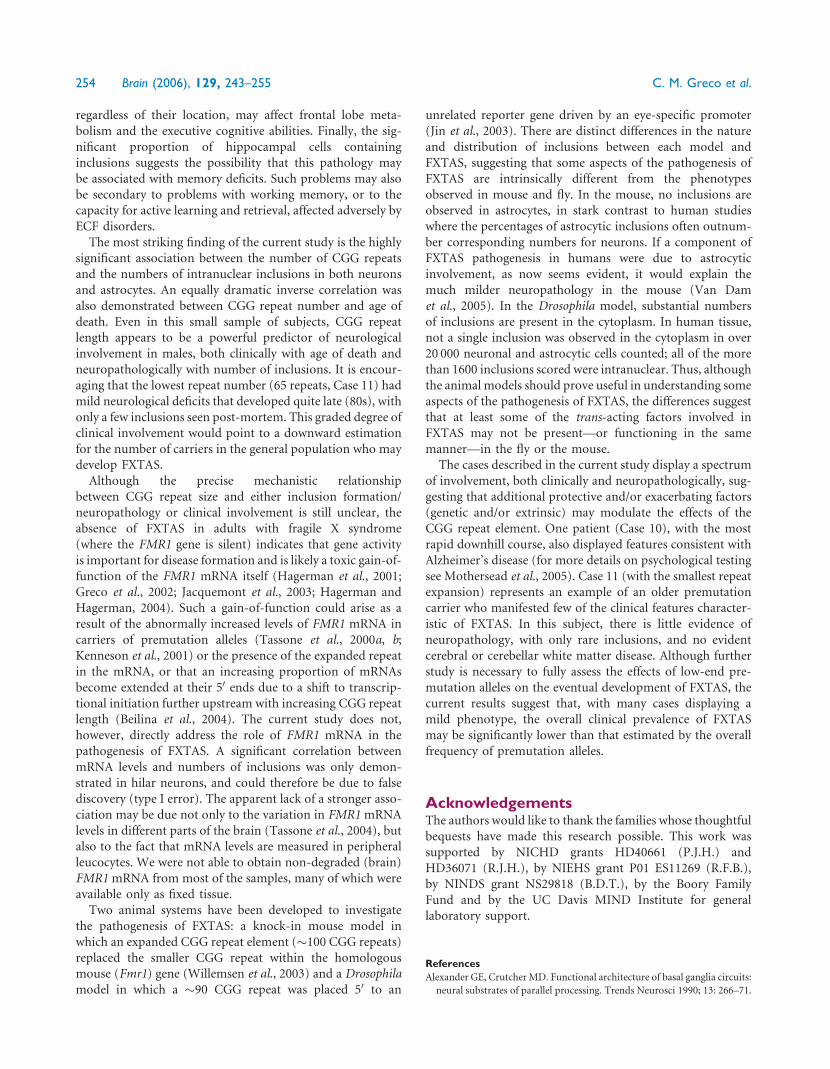
ResultsNeuropathological examination of 11 casesconfirms and further defines theprominent cortical and subcortical whitematter pathology associated with FXTASA prominent feature of the brains within this series was the
presence of white matter disease in broad distribution within
the cerebrum (Fig. 1) and cerebellum. On gross examination,
for those cases where intact hemispheres or whole brains were
available (Cases 1, 2 and 5–11), there was mild to moderate
cortical atrophy and ventriculomegaly. Brain weights were
within expected normal limits (1100–1700 g; average
1400 g), except for Case 6 (JS), where the weight was greatly
decreased due to preservation in a non-formalin fixative. One
case showed severe, gross white matter abnormalities (Case 7).
Microscopic examination of cerebral white matter showed
varying degrees of a similar pathological process in all cases
where this tissue was available (e.g. Figs 2 and 3) except for
Case 11, where only rare inclusions were observed. Of par-
ticular note was the presence of dramatically enlarged GFAP-
positive astrocytes in white matter. Other abnormal features
included variable degrees of spongiosis in subcortical and
deep white matter, with corresponding axonal loss on
Bielschowsky or neurofilament stain and myelin pallor on
LFB-PAS stain. Glial cell loss varied in degree of severity
with the above changes, and, uncommonly, axonal swellings
(best observed with neurofilament staining) were identified
(Fig. 4). Abnormal MCPs and deep cerebellar white matter
disease were present in all cases where these tissues were
available (except for Case 11), and demonstrated spongiosis
with rare axonal spheroids and myelin pallor on LFB-PAS
stain. Purkinje cell loss ranged from mild to severe, and
was accompanied by corresponding Bergmann gliosis;
cases showing moderate to severe loss of Purkinje cells
were considered abnormal for age.
The second prominent feature of the brains was the wide-
spread presence of intranuclear neuronal and astroglial inclu-
sions, as described previously (Greco et al., 2002). These were
seen diffusely in cortex, basal ganglia, thalamus, substantia
nigra, inferior olivary and dentate nuclei, generally sparing
only cerebellar Purkinje cells (rare Purkinje cell inclus-
ions were identified in Case 9). Importantly, inclusions
could not be found in the oligodendroglial population;
double-immunolabelled (MBP/ubiquitin) sections, for oligo-
dendroglia and inclusions, respectively, failed to detect any
inclusions in over 600 oligodendroglial nuclei counted
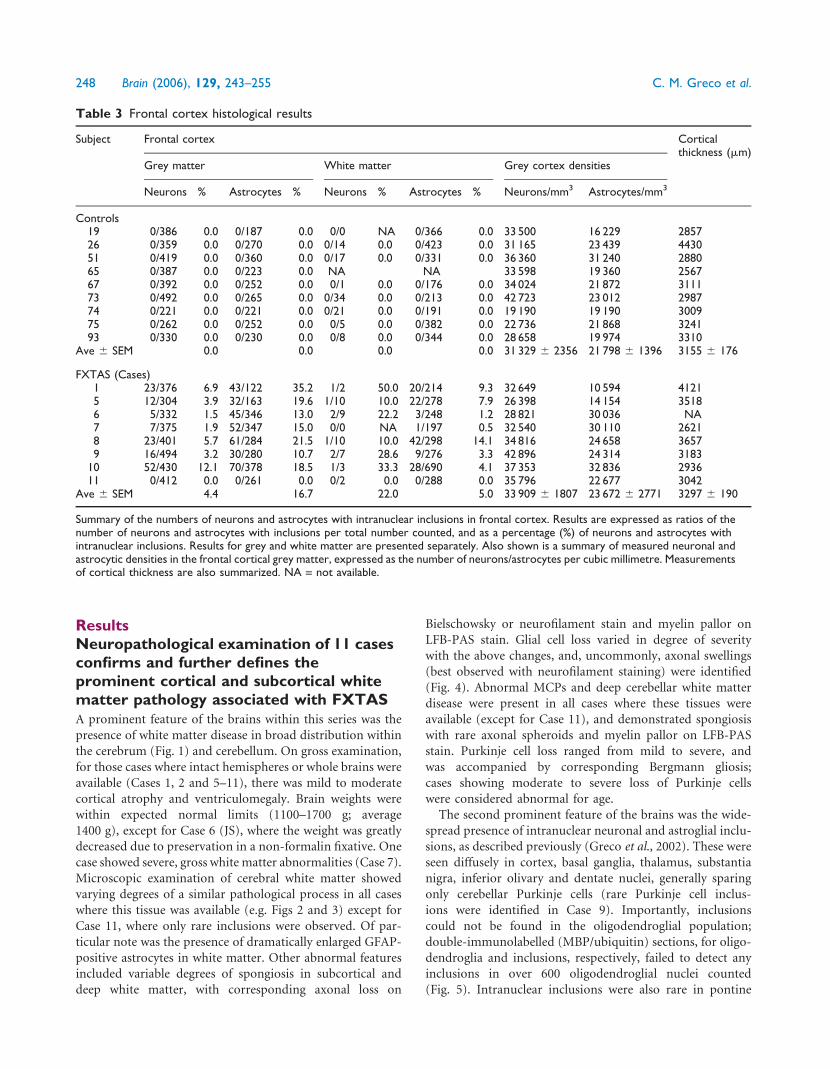
(Fig. 5). Intranuclear inclusions were also rare in pontine
Table 3 Frontal cortex histological results
Subject Frontal cortex Corticalthickness (mm)
Grey matter White matter Grey cortex densities
Neurons % Astrocytes % Neurons % Astrocytes % Neurons/mm3 Astrocytes/mm3
Controls19 0/386 0.0 0/187 0.0 0/0 NA 0/366 0.0 33 500 16 229 285726 0/359 0.0 0/270 0.0 0/14 0.0 0/423 0.0 31 165 23 439 443051 0/419 0.0 0/360 0.0 0/17 0.0 0/331 0.0 36 360 31 240 288065 0/387 0.0 0/223 0.0 NA NA 33 598 19 360 256767 0/392 0.0 0/252 0.0 0/1 0.0 0/176 0.0 34 024 21 872 311173 0/492 0.0 0/265 0.0 0/34 0.0 0/213 0.0 42 723 23 012 298774 0/221 0.0 0/221 0.0 0/21 0.0 0/191 0.0 19 190 19 190 300975 0/262 0.0 0/252 0.0 0/5 0.0 0/382 0.0 22 736 21 868 324193 0/330 0.0 0/230 0.0 0/8 0.0 0/344 0.0 28 658 19 974 3310
Ave 6 SEM 0.0 0.0 0.0 0.0 31 329 6 2356 21 798 6 1396 3155 6 176
FXTAS (Cases)1 23/376 6.9 43/122 35.2 1/2 50.0 20/214 9.3 32 649 10 594 41215 12/304 3.9 32/163 19.6 1/10 10.0 22/278 7.9 26 398 14 154 35186 5/332 1.5 45/346 13.0 2/9 22.2 3/248 1.2 28 821 30 036 NA7 7/375 1.9 52/347 15.0 0/0 NA 1/197 0.5 32 540 30 110 26218 23/401 5.7 61/284 21.5 1/10 10.0 42/298 14.1 34 816 24 658 36579 16/494 3.2 30/280 10.7 2/7 28.6 9/276 3.3 42 896 24 314 3183
10 52/430 12.1 70/378 18.5 1/3 33.3 28/690 4.1 37 353 32 836 293611 0/412 0.0 0/261 0.0 0/2 0.0 0/288 0.0 35 796 22 677 3042
Ave 6 SEM 4.4 16.7 22.0 5.0 33 909 6 1807 23 672 6 2771 3297 6 190
Summary of the numbers of neurons and astrocytes with intranuclear inclusions in frontal cortex. Results are expressed as ratios of thenumber of neurons and astrocytes with inclusions per total number counted, and as a percentage (%) of neurons and astrocytes withintranuclear inclusions. Results for grey and white matter are presented separately. Also shown is a summary of measured neuronal andastrocytic densities in the frontal cortical grey matter, expressed as the number of neurons/astrocytes per cubic millimetre. Measurementsof cortical thickness are also summarized. NA = not available.
248 Brain (2006), 129, 243–255 C. M. Greco et al.
Dow
nloaded from https://academ
ic.oup.com/brain/article/129/1/243/311853 by guest on 15 D
ecember 2021
Table 4 Hippocampal histological results
Subject Hippocampus
Pyramidal Granular cell layer Hilus
Neurons % Astrocytes % Neurons % Astrocytes % Neurons % Astrocytes %
Controls09 0/152 0.0 0/140 0.0 0/364 0.0 0/53 0.0 0/120 0.0 0/254 0.019 0/98 0.0 0/124 0.0 0/517 0.0 0/43 0.0 0/116 0.0 0/350 0.026 0/158 0.0 0/170 0.0 0/382 0.0 0/32 0.0 0/84 0.0 0/169 0.051 0/117 0.0 0/207 0.0 0/449 0.0 0/32 0.0 0/63 0.0 0/291 0.065 0/133 0.0 0/149 0.0 0/394 0.0 0/41 0.0 0/70 0.0 0/120 0.067 0/95 0.0 0/118 0.0 0/623 0.0 0/59 0.0 0/80 0.0 0/282 0.073 0/125 0.0 0/150 0.0 0/484 0.0 0/29 0.0 0/70 0.0 0/218 0.074 0/107 0.0 0/83 0.0 0/378 0.0 0/29 0.0 0/111 0.0 0/180 0.075 NA NA 0/276 0.0 0/38 0.0 0/75 0.0 0/384 0.093 NA NA NA NA 0/81 0.0 0/224 0.0
Average 0.0 0.0 0.0 0.0 0.0 0.0
FXTAS (Cases)1 29/152 19.1 24/74 32.4 44/594 7.4 12/28 42.9 8/91 8.8 49/186 26.35 13/80 16.3 4/51 7.8 7/354 2.0 5/16 31.3 7/73 9.6 67/163 41.16 5/81 6.2 8/157 5.1 8/1109 0.7 10/40 25.0 30/153 19.6 93/327 28.47 5/97 5.2 8/129 6.2 14/1002 1.4 5/23 21.7 2/72 2.8 53/217 24.48 19/131 14.5 27/272 9.9 11/675 1.6 24/55 43.6 27/126 21.4 116/403 28.8
10 17/180 9.4 11/101 10.9 13/834 1.6 8/37 21.6 24/115 20.9 124/253 49.011 0/158 0.0 0/127 0.0 0/651 0.0 0/43 0.0 0/209 0.0 0/278 0.0
Average 10.1 10.3 2.1 26.6 11.9 28.3
Number of neurons and astrocytes with intracellular inclusions in the CA1 pyramidal cell layer, granule cell layer and hilus. The numbers ofinclusions are expressed as a ratio of cells with inclusions per total number of cells counted, and also as percentage (%) of neurons andastrocytes with inclusions. NA = not available.
Table 5 Pontine nuclei histological results
Subject Neurons % Astrocytes %
Controls09 0/218 0.0 0/65 0.019 0/128 0.0 0/125 0.026 0/142 0.0 0/156 0.051 0/210 0.0 0/132 0.065 0/113 0.0 0/88 0.067 0/179 0.0 0/91 0.073 0/207 0.0 0/105 0.074 0/118 0.0 0/147 0.075 0/168 0.0 0/165 0.093 0/107 0.0 0/110 0.0
Average 0.0 0.0
FXTAS (Cases)1 0/166 0.0 15/160 9.45 1/104 1.0 25/106 23.66 0/235 0.0 26/132 19.77 0/104 0.0 32/136 23.58 0/219 0.0 41/128 32.09 0/197 0.0 12/72 16.7
Average 0.2 20.8
Number of neurons and astrocytes in the pons with intranuclearinclusions. Counts are expressed as number of cells withinclusions per total number of cells counted, and also asthe percentage (%) of cells with inclusions.
Fig. 1 Coronal section of formalin-fixed brain (Case 7). This caseshowed severely affected cerebral white matter both grossly andmicroscopically. Involvement appears as subcortical regions ofpale grey discolouration (arrows). These changes were presentthroughout the cerebral white matter. Note that periventricularwhite matter is spared.
Neuropathology of FXTAS Brain (2006), 129, 243–255 249
Dow
nloaded from https://academ
ic.oup.com/brain/article/129/1/243/311853 by guest on 15 D
ecember 2021
neurons, although they were frequently observed in pontine
astrocytes. Inclusions were easily identifiable in all cases
(Cases 1 through 10) except Case 11 (smallest CGG repeat
expansion), where only a few neuronal inclusions were detec-
ted by direct visualization of ubiquitin immunostained slides.
In Cases 1, 2 and 5–10, ependymal and choroid plexus nuclei
also showed intranuclear inclusions. Intranuclear inclusions
were identifiable in cranial nerve nucleus XII for Cases 6 and
7, 2 out of 6 of the cases where appropriate tissue was available
(Cases 5–9 and 11). In Cases 2 and 5–8, for which spinal cord
was available, astrocytic intranuclear inclusions were diffusely
present in all cases; intranuclear inclusions were identified in
autonomic neurons, but not motor neurons, in Cases 5–8
(4 out of 5 cases).
Histological (stereological) findingsestablish a relationship between CGGrepeat length and the numbers ofinclusions among cases of FXTASThe number of neurons and astrocytes with intranuclear
inclusions (actual counts and percentages) are presented in
Tables 3–5 for cerebral cortex, hippocampus and the ventral
pontine region, respectively. No inclusions in neurons or
astrocytes were observed for any of the control subjects,
and no inclusions were observed in the cytoplasm of neural
cells. Furthermore, no intranuclear inclusions were seen by
stereological analysis (H&E) for the subject with the lowest
CGG repeat expansion (Case 11; 65 CGG repeats). In general,
more intranuclear inclusions were observed in astrocytes than
in neurons (the hippocampal CA1 subregion was an excep-
tion), although there was a great deal of variability across
subjects. For example, as shown in Table 3, the mean per-
centage of neurons with inclusions for cortical grey matter
was 4.4% (range 0–12.1%), whereas 16.7% (range 0–35.2%)
of cortical astrocytes possessed inclusions.
Analysis of molecular correlation withinclusion countsA series of correlations (Spearman’s rho) were calculated
between histological findings and molecular measures (e.g
number of CGG repeats, levels of FMR1 mRNA and
FMRP). Representative plots from these correlations are dis-
played in Fig. 6. Significant correlations between the percent-
age of neurons with inclusions and the number of CGG
repeats were found for several brain regions, including cortical
grey matter (rho = 0.874, P = 0.005), CA1 pyramidal neurons
in hippocampus (rho = 0.929, P = 0.003) and hippocampal
granule cells (rho = 0.964, P < 0.001). Similar correlations
between the number of CGG repeats and the percentage of
astrocytes with inclusions were significant in the cortical grey
matter (rho = 0.886, P = 0.003), the CA1 subregion of the
hippocampus (rho = 0.893, P = 0.007) and the cortical white
matter (rho = 0.814, P = 0.01). Correlations between number
of inclusions and CGG repeats for the remaining brain regions
demonstrated similar trends, but, presumably due to the small
numbers of inclusions, did not reach statistical significance.
Significant inter-cell-type correlations were also observed
for the percentage of neurons versus astrocytes with inclu-
sions in cortical grey matter (rho = 0.786, P = 0.02), hilus
(rho = 0.821, P = 0.02) and in the CA1 region of the hippo-
campus (rho = 0.821, P = 0.02); the comparison only
approached significance in the granule cell layer (rho = 0.750,
P = 0.05).
Although there were apparent correlations between the
percentage of hilar neurons with inclusions and levels of
FMR1 mRNA (rho = �0.829, P = 0.04) and between the
percentage of inclusion-bearing hilar neurons and levels of
FMRP (rho = 0.812, P = 0.05), these correlations were no
longer statistically significant following correction for mul-
tiple comparisons. Correlations between percentage inclu-
sions and peripheral blood leucocyte FMR1 mRNA or
FMRP levels in the other brain regions were not statistically
significant. This last observation is not surprising in view of
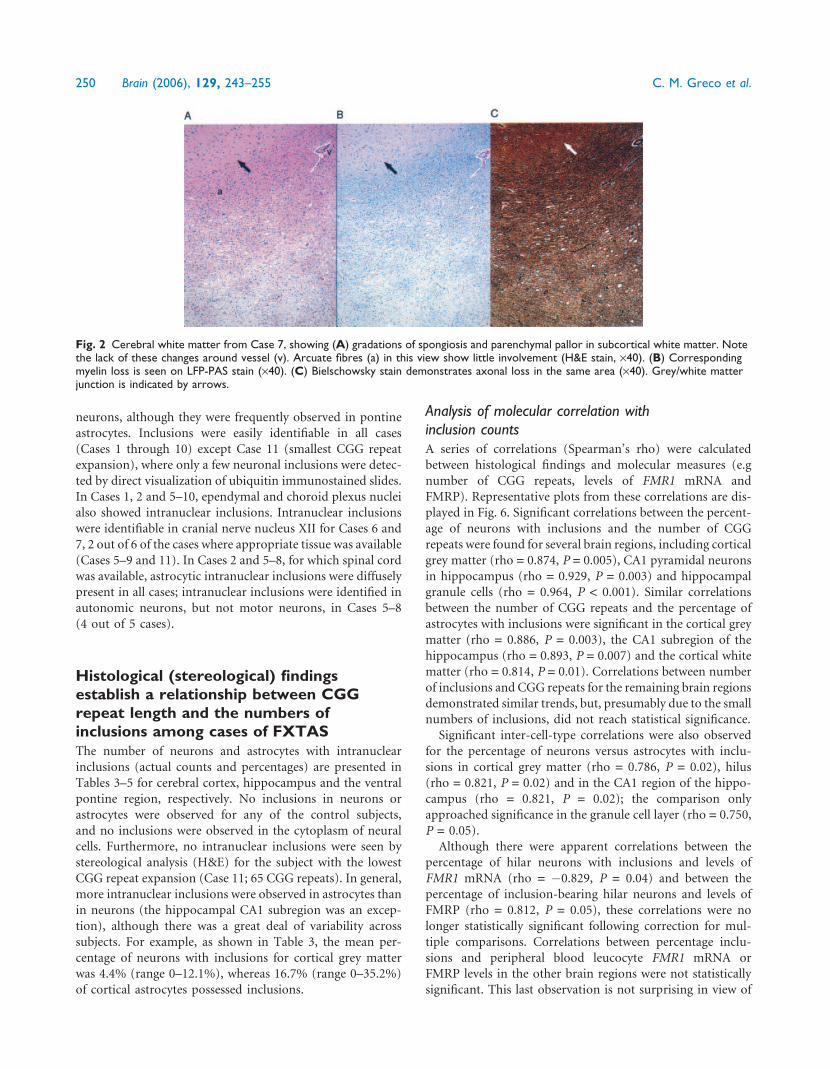
Fig. 2 Cerebral white matter from Case 7, showing (A) gradations of spongiosis and parenchymal pallor in subcortical white matter. Notethe lack of these changes around vessel (v). Arcuate fibres (a) in this view show little involvement (H&E stain, ·40). (B) Correspondingmyelin loss is seen on LFP-PAS stain (·40). (C) Bielschowsky stain demonstrates axonal loss in the same area (·40). Grey/white matterjunction is indicated by arrows.
250 Brain (2006), 129, 243–255 C. M. Greco et al.
Dow
nloaded from https://academ
ic.oup.com/brain/article/129/1/243/311853 by guest on 15 D
ecember 2021
the large differences between expression levels in brain and
blood, and the dramatic region-specific differences in FMR1
mRNA levels in brain (Tassone et al., 2004).
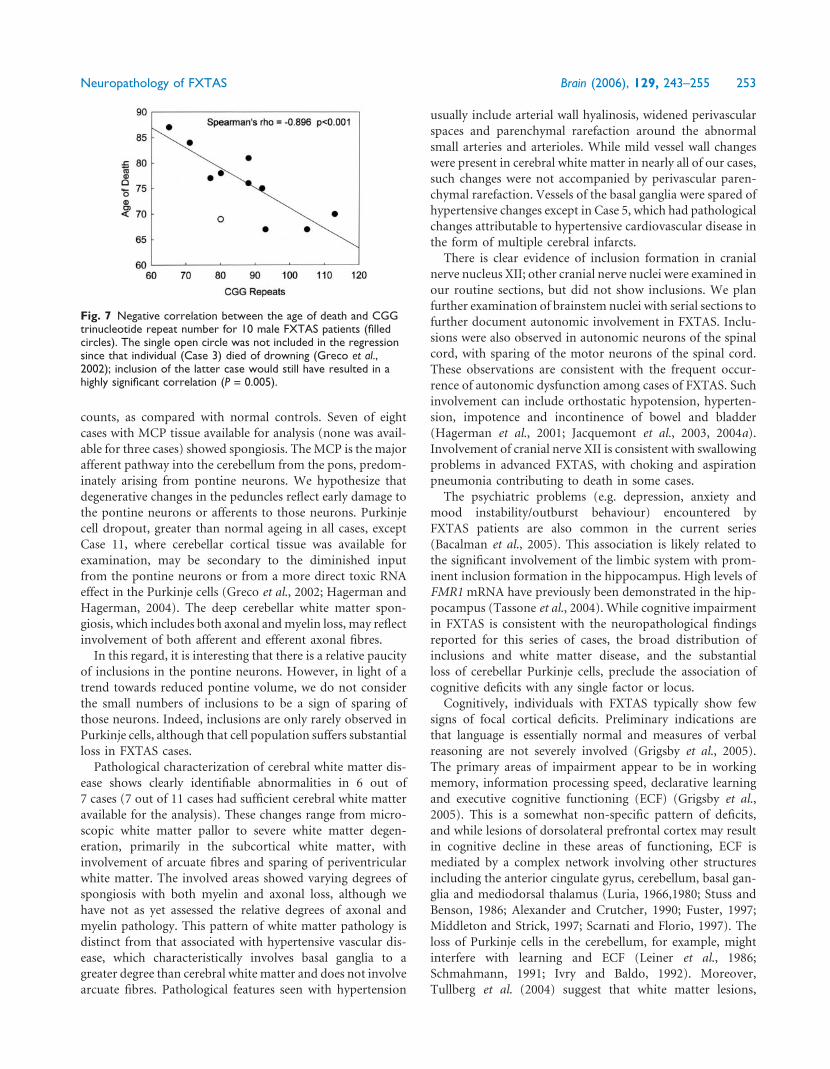
Analysis of clinical correlations with inclusion countsThe most striking clinical–molecular correlation (Fig. 7) is the
significant decrease in age of death with increasing CGG
repeat length (n = 10; rho =�0.896; P < 0.001). Age of tremor
onset was not significantly correlated with CGG repeat length,
and the initial negative correlation between age of ataxia and
CGG repeat length was not significant after correction for
multiple outcomes (rho = �0.663, P = 0.03). The correlation
between the age of onset of ataxia and age of death was sig-
nificant (rho = 0.747, P = 0.008), but not age of tremor onset
with age of death (rho = 0.739, P = 0.06). The following six
correlations were significant before, but not after, correction
for multiple outcomes was carried out: negative correlations
between the age of death and the percentages of inclusion-
bearing neurons in subregions of the hippocampus (granule
cell layer: rho =�0.793, P = 0.03; CA1: rho =�0.757, P = 0.05)
and frontal cortical grey matter (rho �0.826, P = 0.01) and
negative correlations between age of death and the percent-
ages of inclusion-bearing astrocytes in subregions of the hip-
pocampus (hilus: rho =�0.811, P = 0.03; CA1: rho =�0.793,
P = 0.03) and frontal cortical grey matter (rho = �0.802,
P = 0.02).
DiscussionThe current study provides a description of the degenerative
cerebral white matter disease that corresponds to previously
described MRI changes in FXTAS (Hagerman et al., 2001;
Brunberg et al., 2002; Jacquemont et al., 2003; Leehey et al.,
2003). Histological changes in cerebral white matter of indi-
viduals with FXTAS are distinct from those seen with isch-
aemia, hypertension, multiple sclerosis, gliosis associated with
chronic inflammatory diseases, and cerebral autosomal dom-
inant arteriopathy with subcortical infarcts and leucoenceph-
alopathy (CADASIL) (Kalimo et al., 1999). Given the patchy
loss of axons, myelin and attending glia in FXTAS, we pos-
tulate neuronal and/or glial dysfunction as causal or contrib-
utory in the face of normal cortical thickness and neuronal
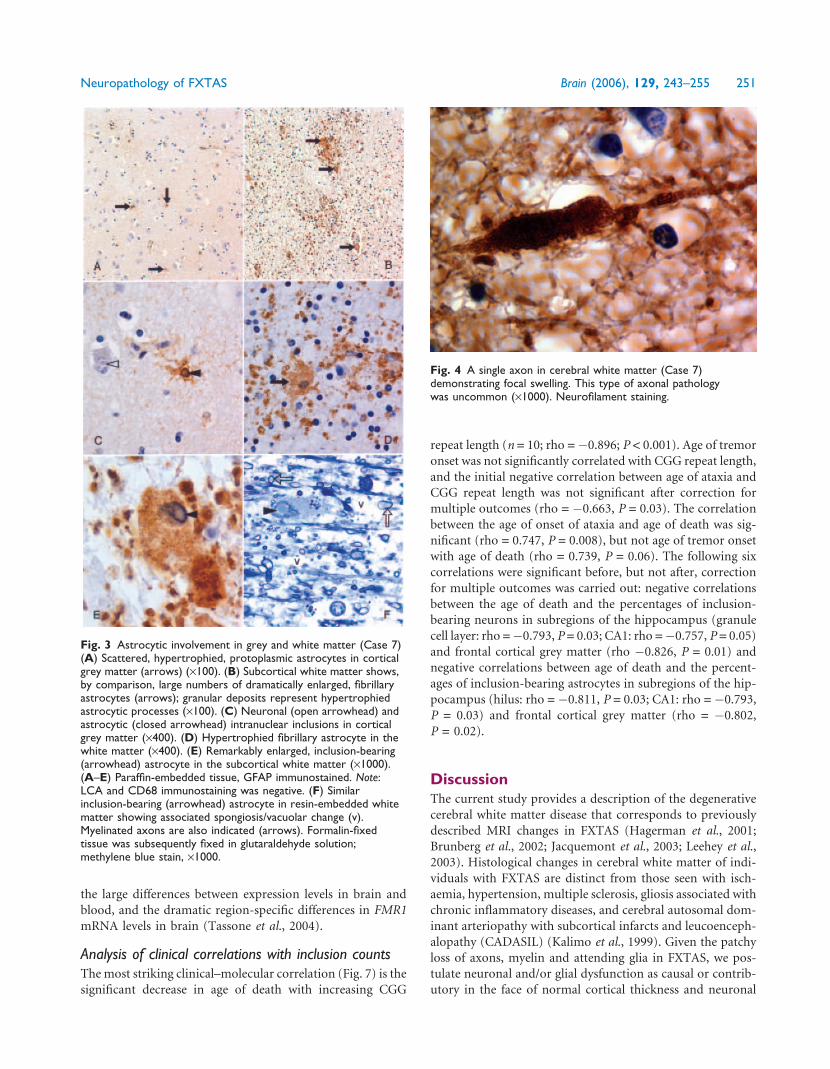
Fig. 3 Astrocytic involvement in grey and white matter (Case 7)(A) Scattered, hypertrophied, protoplasmic astrocytes in corticalgrey matter (arrows) (·100). (B) Subcortical white matter shows,by comparison, large numbers of dramatically enlarged, fibrillaryastrocytes (arrows); granular deposits represent hypertrophiedastrocytic processes (·100). (C) Neuronal (open arrowhead) andastrocytic (closed arrowhead) intranuclear inclusions in corticalgrey matter (·400). (D) Hypertrophied fibrillary astrocyte in thewhite matter (·400). (E) Remarkably enlarged, inclusion-bearing(arrowhead) astrocyte in the subcortical white matter (·1000).(A–E) Paraffin-embedded tissue, GFAP immunostained. Note:LCA and CD68 immunostaining was negative. (F) Similarinclusion-bearing (arrowhead) astrocyte in resin-embedded whitematter showing associated spongiosis/vacuolar change (v).Myelinated axons are also indicated (arrows). Formalin-fixedtissue was subsequently fixed in glutaraldehyde solution;methylene blue stain, ·1000.
Fig. 4 A single axon in cerebral white matter (Case 7)demonstrating focal swelling. This type of axonal pathologywas uncommon (·1000). Neurofilament staining.
Neuropathology of FXTAS Brain (2006), 129, 243–255 251
Dow
nloaded from https://academ
ic.oup.com/brain/article/129/1/243/311853 by guest on 15 D
ecember 2021
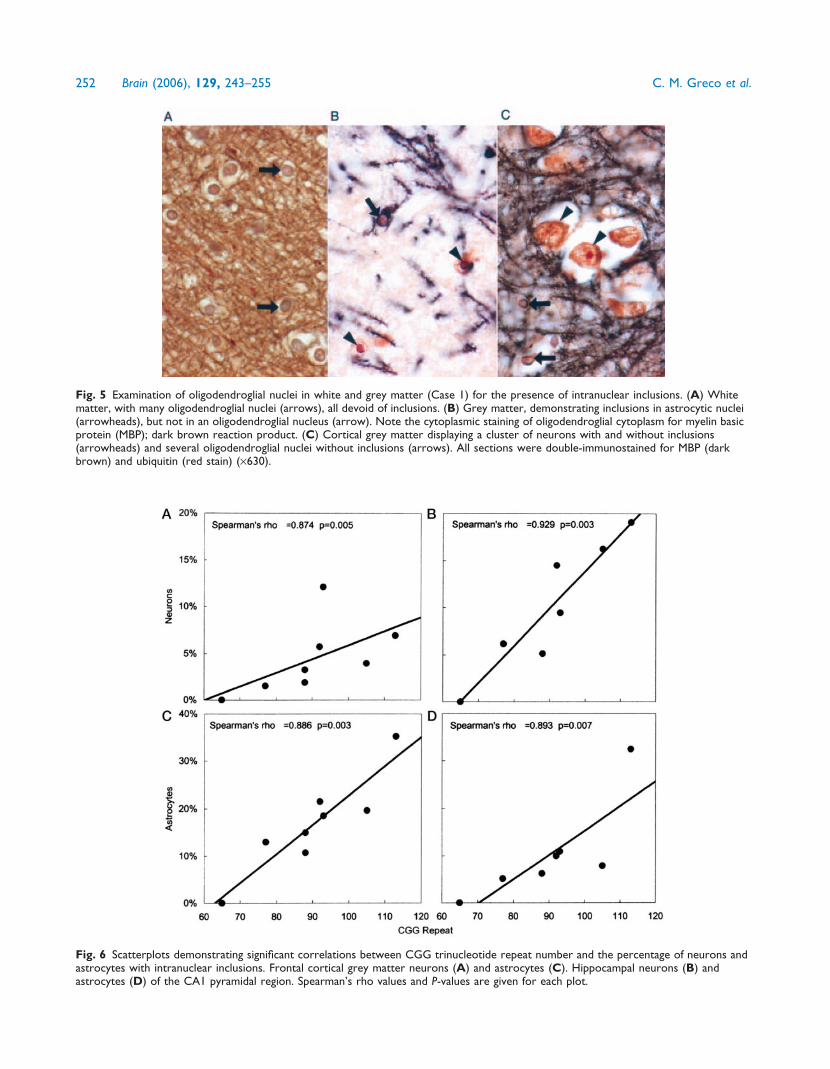
Fig. 5 Examination of oligodendroglial nuclei in white and grey matter (Case 1) for the presence of intranuclear inclusions. (A) Whitematter, with many oligodendroglial nuclei (arrows), all devoid of inclusions. (B) Grey matter, demonstrating inclusions in astrocytic nuclei(arrowheads), but not in an oligodendroglial nucleus (arrow). Note the cytoplasmic staining of oligodendroglial cytoplasm for myelin basicprotein (MBP); dark brown reaction product. (C) Cortical grey matter displaying a cluster of neurons with and without inclusions(arrowheads) and several oligodendroglial nuclei without inclusions (arrows). All sections were double-immunostained for MBP (darkbrown) and ubiquitin (red stain) (·630).
Fig. 6 Scatterplots demonstrating significant correlations between CGG trinucleotide repeat number and the percentage of neurons andastrocytes with intranuclear inclusions. Frontal cortical grey matter neurons (A) and astrocytes (C). Hippocampal neurons (B) andastrocytes (D) of the CA1 pyramidal region. Spearman’s rho values and P-values are given for each plot.
252 Brain (2006), 129, 243–255 C. M. Greco et al.
Dow
nloaded from https://academ
ic.oup.com/brain/article/129/1/243/311853 by guest on 15 D
ecember 2021
counts, as compared with normal controls. Seven of eight
cases with MCP tissue available for analysis (none was avail-
able for three cases) showed spongiosis. The MCP is the major
afferent pathway into the cerebellum from the pons, predom-
inately arising from pontine neurons. We hypothesize that
degenerative changes in the peduncles reflect early damage to
the pontine neurons or afferents to those neurons. Purkinje
cell dropout, greater than normal ageing in all cases, except
Case 11, where cerebellar cortical tissue was available for
examination, may be secondary to the diminished input
from the pontine neurons or from a more direct toxic RNA
effect in the Purkinje cells (Greco et al., 2002; Hagerman and
Hagerman, 2004). The deep cerebellar white matter spon-
giosis, which includes both axonal and myelin loss, may reflect
involvement of both afferent and efferent axonal fibres.
In this regard, it is interesting that there is a relative paucity
of inclusions in the pontine neurons. However, in light of a
trend towards reduced pontine volume, we do not consider
the small numbers of inclusions to be a sign of sparing of
those neurons. Indeed, inclusions are only rarely observed in
Purkinje cells, although that cell population suffers substantial
loss in FXTAS cases.
Pathological characterization of cerebral white matter dis-
ease shows clearly identifiable abnormalities in 6 out of
7 cases (7 out of 11 cases had sufficient cerebral white matter
available for the analysis). These changes range from micro-
scopic white matter pallor to severe white matter degen-
eration, primarily in the subcortical white matter, with
involvement of arcuate fibres and sparing of periventricular
white matter. The involved areas showed varying degrees of
spongiosis with both myelin and axonal loss, although we
have not as yet assessed the relative degrees of axonal and
myelin pathology. This pattern of white matter pathology is
distinct from that associated with hypertensive vascular dis-
ease, which characteristically involves basal ganglia to a
greater degree than cerebral white matter and does not involve
arcuate fibres. Pathological features seen with hypertension
usually include arterial wall hyalinosis, widened perivascular
spaces and parenchymal rarefaction around the abnormal
small arteries and arterioles. While mild vessel wall changes
were present in cerebral white matter in nearly all of our cases,
such changes were not accompanied by perivascular paren-
chymal rarefaction. Vessels of the basal ganglia were spared of
hypertensive changes except in Case 5, which had pathological
changes attributable to hypertensive cardiovascular disease in
the form of multiple cerebral infarcts.
There is clear evidence of inclusion formation in cranial
nerve nucleus XII; other cranial nerve nuclei were examined in
our routine sections, but did not show inclusions. We plan
further examination of brainstem nuclei with serial sections to
further document autonomic involvement in FXTAS. Inclu-
sions were also observed in autonomic neurons of the spinal
cord, with sparing of the motor neurons of the spinal cord.
These observations are consistent with the frequent occur-
rence of autonomic dysfunction among cases of FXTAS. Such
involvement can include orthostatic hypotension, hyperten-
sion, impotence and incontinence of bowel and bladder
(Hagerman et al., 2001; Jacquemont et al., 2003, 2004a).
Involvement of cranial nerve XII is consistent with swallowing
problems in advanced FXTAS, with choking and aspiration
pneumonia contributing to death in some cases.
The psychiatric problems (e.g. depression, anxiety and
mood instability/outburst behaviour) encountered by
FXTAS patients are also common in the current series
(Bacalman et al., 2005). This association is likely related to
the significant involvement of the limbic system with prom-
inent inclusion formation in the hippocampus. High levels of
FMR1 mRNA have previously been demonstrated in the hip-
pocampus (Tassone et al., 2004). While cognitive impairment
in FXTAS is consistent with the neuropathological findings
reported for this series of cases, the broad distribution of
inclusions and white matter disease, and the substantial
loss of cerebellar Purkinje cells, preclude the association of
cognitive deficits with any single factor or locus.
Cognitively, individuals with FXTAS typically show few
signs of focal cortical deficits. Preliminary indications are
that language is essentially normal and measures of verbal
reasoning are not severely involved (Grigsby et al., 2005).
The primary areas of impairment appear to be in working
memory, information processing speed, declarative learning
and executive cognitive functioning (ECF) (Grigsby et al.,
2005). This is a somewhat non-specific pattern of deficits,
and while lesions of dorsolateral prefrontal cortex may result
in cognitive decline in these areas of functioning, ECF is
mediated by a complex network involving other structures
including the anterior cingulate gyrus, cerebellum, basal gan-
glia and mediodorsal thalamus (Luria, 1966,1980; Stuss and
Benson, 1986; Alexander and Crutcher, 1990; Fuster, 1997;
Middleton and Strick, 1997; Scarnati and Florio, 1997). The
loss of Purkinje cells in the cerebellum, for example, might
interfere with learning and ECF (Leiner et al., 1986;
Schmahmann, 1991; Ivry and Baldo, 1992). Moreover,
Tullberg et al. (2004) suggest that white matter lesions,
Fig. 7 Negative correlation between the age of death and CGGtrinucleotide repeat number for 10 male FXTAS patients (filledcircles). The single open circle was not included in the regressionsince that individual (Case 3) died of drowning (Greco et al.,2002); inclusion of the latter case would still have resulted in ahighly significant correlation (P = 0.005).
Neuropathology of FXTAS Brain (2006), 129, 243–255 253
Dow
nloaded from https://academ
ic.oup.com/brain/article/129/1/243/311853 by guest on 15 D
ecember 2021
regardless of their location, may affect frontal lobe meta-
bolism and the executive cognitive abilities. Finally, the sig-
nificant proportion of hippocampal cells containing
inclusions suggests the possibility that this pathology may
be associated with memory deficits. Such problems may also
be secondary to problems with working memory, or to the
capacity for active learning and retrieval, affected adversely by
ECF disorders.
The most striking finding of the current study is the highly
significant association between the number of CGG repeats
and the numbers of intranuclear inclusions in both neurons
and astrocytes. An equally dramatic inverse correlation was
also demonstrated between CGG repeat number and age of
death. Even in this small sample of subjects, CGG repeat
length appears to be a powerful predictor of neurological
involvement in males, both clinically with age of death and
neuropathologically with number of inclusions. It is encour-
aging that the lowest repeat number (65 repeats, Case 11) had
mild neurological deficits that developed quite late (80s), with
only a few inclusions seen post-mortem. This graded degree of
clinical involvement would point to a downward estimation
for the number of carriers in the general population who may
develop FXTAS.
Although the precise mechanistic relationship
between CGG repeat size and either inclusion formation/
neuropathology or clinical involvement is still unclear, the
absence of FXTAS in adults with fragile X syndrome
(where the FMR1 gene is silent) indicates that gene activity
is important for disease formation and is likely a toxic gain-of-
function of the FMR1 mRNA itself (Hagerman et al., 2001;
Greco et al., 2002; Jacquemont et al., 2003; Hagerman and
Hagerman, 2004). Such a gain-of-function could arise as a
result of the abnormally increased levels of FMR1 mRNA in
carriers of premutation alleles (Tassone et al., 2000a, b;
Kenneson et al., 2001) or the presence of the expanded repeat
in the mRNA, or that an increasing proportion of mRNAs
become extended at their 50 ends due to a shift to transcrip-
tional initiation further upstream with increasing CGG repeat
length (Beilina et al., 2004). The current study does not,
however, directly address the role of FMR1 mRNA in the
pathogenesis of FXTAS. A significant correlation between
mRNA levels and numbers of inclusions was only demon-
strated in hilar neurons, and could therefore be due to false
discovery (type I error). The apparent lack of a stronger asso-
ciation may be due not only to the variation in FMR1 mRNA
levels in different parts of the brain (Tassone et al., 2004), but
also to the fact that mRNA levels are measured in peripheral
leucocytes. We were not able to obtain non-degraded (brain)
FMR1 mRNA from most of the samples, many of which were
available only as fixed tissue.
Two animal systems have been developed to investigate
the pathogenesis of FXTAS: a knock-in mouse model in
which an expanded CGG repeat element (�100 CGG repeats)
replaced the smaller CGG repeat within the homologous
mouse (Fmr1) gene (Willemsen et al., 2003) and a Drosophila
model in which a �90 CGG repeat was placed 50 to an
unrelated reporter gene driven by an eye-specific promoter
(Jin et al., 2003). There are distinct differences in the nature
and distribution of inclusions between each model and
FXTAS, suggesting that some aspects of the pathogenesis of
FXTAS are intrinsically different from the phenotypes
observed in mouse and fly. In the mouse, no inclusions are
observed in astrocytes, in stark contrast to human studies
where the percentages of astrocytic inclusions often outnum-
ber corresponding numbers for neurons. If a component of
FXTAS pathogenesis in humans were due to astrocytic
involvement, as now seems evident, it would explain the
much milder neuropathology in the mouse (Van Dam
et al., 2005). In the Drosophila model, substantial numbers
of inclusions are present in the cytoplasm. In human tissue,
not a single inclusion was observed in the cytoplasm in over
20 000 neuronal and astrocytic cells counted; all of the more
than 1600 inclusions scored were intranuclear. Thus, although
the animal models should prove useful in understanding some
aspects of the pathogenesis of FXTAS, the differences suggest
that at least some of the trans-acting factors involved in
FXTAS may not be present—or functioning in the same
manner—in the fly or the mouse.
The cases described in the current study display a spectrum
of involvement, both clinically and neuropathologically, sug-
gesting that additional protective and/or exacerbating factors
(genetic and/or extrinsic) may modulate the effects of the
CGG repeat element. One patient (Case 10), with the most
rapid downhill course, also displayed features consistent with
Alzheimer’s disease (for more details on psychological testing
see Mothersead et al., 2005). Case 11 (with the smallest repeat
expansion) represents an example of an older premutation
carrier who manifested few of the clinical features character-
istic of FXTAS. In this subject, there is little evidence of
neuropathology, with only rare inclusions, and no evident
cerebral or cerebellar white matter disease. Although further
study is necessary to fully assess the effects of low-end pre-
mutation alleles on the eventual development of FXTAS, the
current results suggest that, with many cases displaying a
mild phenotype, the overall clinical prevalence of FXTAS
may be significantly lower than that estimated by the overall
frequency of premutation alleles.
AcknowledgementsThe authors would like to thank the families whose thoughtful
bequests have made this research possible. This work was
supported by NICHD grants HD40661 (P.J.H.) and
HD36071 (R.J.H.), by NIEHS grant P01 ES11269 (R.F.B.),
by NINDS grant NS29818 (B.D.T.), by the Boory Family
Fund and by the UC Davis MIND Institute for general
laboratory support.
References
Alexander GE, Crutcher MD. Functional architecture of basal ganglia circuits:
neural substrates of parallel processing. Trends Neurosci 1990; 13: 266–71.
254 Brain (2006), 129, 243–255 C. M. Greco et al.
Dow
nloaded from https://academ
ic.oup.com/brain/article/129/1/243/311853 by guest on 15 D
ecember 2021
Bacalman S, Farzin F, Bourgeois J, Cogswell J, Goodlin-Jones B, Gane LW,
et al. Psychiatric phenotype of the fragile X-associated tremor/ataxia syn-
drome (FXTAS) in males: newly described fronto-subcortical dementia.
J Clin Psychiatry 2005. In press.
Beilina A, Tassone F, Schwartz PH, Sahota P, Hagerman PJ. Redistribution
of transcription start sites within the FMR1 promoter region with
expansion of the downstream CGG-repeat element. Hum Mol Genet
2004; 13: 543–9.
Benjamini Y, Hochberg Y. Controlling the false discovery rate: a practical and
powerful approach to multiple testing. J R Statist Soc 1995; 57 B: 289–300.
Berry-Kravis E, Lewin F, Wuu J, Leehey M, Hagerman R, Hagerman P, et al.
Tremor and ataxia in fragile X premutation carriers: blinded videotape
study. Ann Neurol 2003; 53: 616–23.
Berry-Kravis E, Potanos K, Weinberg D, Zhou L, Goetz CG. Fragile
X-zassociated tremor/ataxia syndrome in sisters related to X-
inactivation. Ann Neurol 2005; 57: 144–7.
Brunberg JA, Jacquemont S, Hagerman RJ, Berry-Kravis E, Grigsby J,
Leehey M, et al. Fragile X premutation carriers: characteristic MR
imaging findings in adult males with progressive cerebellar and cognitive
dysfunction. Am J Neurorad 2002; 23: 1757–66.
Curtin F, Schulz P. Multiple correlations and Bonferroni’s correction. Biol
Psychiatry 1998; 44: 775–7.
Dombrowski C, Levesque S, Morel ML, Rouillard P, Morgan K, Rousseau F.
Premutation and intermediate-size FMR1 alleles in 10572 males from the
general population: loss of an AGG interruption is a late event in the
generation of fragile X syndrome alleles. Hum Mol Genet 2002; 11: 371–8.
Fuster J. The prefrontal cortex: anatomy, physiology, and neuropsychology of
the frontal lobe. Philadelphia: Lippincott-Raven; 1997.
Greco C, Hagerman RJ, Tassone F, Chudley A, Del Bigio MR, Jacquemont S,
et al. Neuronal intranuclear inclusions in a new cerebellar tremor/ataxia
syndrome among fragile X carriers. Brain 2002; 125: 1760–71.
Grigsby J, Brega AG, Jacquemont S, Loesch DZ, Leehey MA, Goodrich GK,
et al. Impairment in the cognitive functioning of men with Fragile X
Tremor-Ataxia Syndrome (FXTAS). J Neurol Sci 2005. In press.
Hagerman PJ, Hagerman RJ. The fragile-X premutation: a maturing perspect-
ive. Am J Hum Genet 2004; 74: 805–16.
Hagerman RJ, Leehey M, Heinrichs W, Tassone F, Wilson R, Hills J, et al.
Intention tremor, parkinsonism, and generalized brain atrophy in male
carriers of fragile X. Neurology 2001; 57: 127–30.
Hagerman RJ, Leavitt BR, Farzin F, Jacquemont S, Greco CM, Brunberg JA,
et al. Fragile-X-associated tremor/ataxia syndrome (FXTAS) in
females with the FMR1 premutation. Am J Hum Genet 2004; 74:
1051–6.
Ivry RB, Baldo JV. Is the cerebellum involved in learning and cognition? Curr
Opin Neurobiol 1992; 2: 212–6.
Iwahashi CK, Yasui DH, An H-J, Greco CM, Tassone F, Nannen K, et al.
Protein composition of the intranuclear inclusions of FXTAS. Brain 2005,
Advance Access published October 24, 2005, doi:10.1093/brain/awh650.
Jacquemont S, Hagerman RJ, Leehey M, Grigsby J, Zhang L, Brunberg JA, et al.
Fragile X premutation tremor/ataxia syndrome: molecular, clinical, and
neuroimaging correlates. Am J Hum Genet 2003; 72: 869–78.
Jacquemont S, Farzin F, Hall D, Leehey M, Tassone F, Gane L, et al. Aging in
individuals with the FMR1 mutation. Am J Ment Retard 2004a; 109:
154–64.
Jacquemont S, Hagerman RJ, Leehey MA, Hall DA, Levine RA, Brunberg JA,
et al. Penetrance of the fragile X-associated tremor/ataxia syndrome in a
premutation carrier population. JAMA 2004b; 291: 460–9.
Jacquemont S, Orrico A, Galli L, Sahota PK, Brunberg JA, Anichini C, et al.
Spastic paraparesis, cerebellar ataxia, and intention tremor: a severe
variant of FXTAS? J Med Genet 2005; 42: e14.
Jin P, Zarnescu DC, Zhang F, Pearson CE, Lucchesi JC, Moses K, et al. RNA-
mediated neurodegeneration caused by the fragile X premutation rCGG
repeats in Drosophila. Neuron 2003; 39: 739–47.
Kalimo H, Viitanen M, Amberla K, Juvonen V, Marttila R, Poyhonen M, et al.
CADASIL: hereditary disease of arteries causing brain infarcts and
dementia. Neuropathol Appl Neurobiol 1999; 25: 257–65.
Kenneson A, Zhang F, Hagedorn CH, Warren ST. Reduced FMRP and
increased FMR1 transcription is proportionally associated with CGG
repeat number in intermediate-length and premutation carriers. Hum
Mol Genet 2001; 10: 1449–54.
Leehey MA, Munhoz RP, Lang AE, Brunberg JA, Grigsby J, Greco C, et al. The
fragile X premutation presenting as essential tremor. Arch Neurol 2003; 60:
117–21.
Leiner HC, Leiner AL, Dow RS. Does the cerebellum contribute to mental
skills? Behav Neurosci 1986; 100: 443–54.
Luria A. Human brain and psychological processes. New York: Harper & Row;
1966.
Luria A. Higher cortical functions in man. Vol. 2nd ed. New York: Basic
Books; 1980.
Middleton F, Strick P. New concepts about the organization of basal
ganglia output. In: Obeso J, DeLong M, Ohye C , Marsden C, editors.
The basal ganglia and new surgical approaches for Parkinson’s disease.
Advances in neurology. Vol. 74. Philadelphia: Lippincott-Raven; 1997:
p. 57–68.
Mothersead PK, Conrad K, Hagerman RJ, Greco CM, Hessl D, Tassone F.
GRAND ROUNDS: An atypical progressive dementia in a male carrier of
the fragile X premutation: An example of fragile X-associated tremor/ataxia
syndrome. Appl Neuropsychol 2005; 12: 169–78.
Newell KL, Hyman BT, Growdon JH, Hedley-Whyte ET. Application of the
National Institute on Aging (NIA)-Reagan Institute criteria for the neuro-
pathological diagnosis of Alzheimer disease. J Neuropathol Exp Neurol
1999; 58: 1147–55.
Rousseau F, Rouillard P, Morel ML, Khandjian EW, Morgan K. Prevalence of
carriers of premutation-size alleles of the FMRI gene—and implications for
the population genetics of the fragile X syndrome. Am J Hum Genet 1995;
57: 1006–18.
Scarnati E, Florio T. The pedunculopontine nucleus and related structures:
functional organization. In: Obeso J, DeLong M, Ohye C, Marsden C,
editors. The basal ganglia and new surgical approaches for Parkinson’s
disease. Advances in neurology. Vol. 74. Philadelphia: Lippincott-Raven;
1997: p. 97–110.
Schmahmann J. An emerging concept. The cerebellar contribution to higher
function. Arch Neurol 1991; 48: 1178–87.
Stuss D, Benson D. The frontal lobes. New York: Raven Press; 1986.
Tassone F, Hagerman RJ, Ikle DN, Dyer PN, Lampe M, Willemsen R, et al.
FMRP expression as a potential prognostic indicator in fragile X syndrome.
Am J Med Genet 1999; 84: 250–61.
Tassone F, Hagerman RJ, Chamberlain WD, Hagerman PJ. Transcription of
the FMR1 gene in individuals with fragile X syndrome. Am J Med Genet
2000a; 97: 195–203.
Tassone F, Hagerman RJ, Taylor AK, Gane LW, Godfrey TE, Hagerman PJ.
Elevated levels of FMR1 mRNA in carrier males: a new mechanism
of involvement in the fragile-X syndrome. Am J Hum Genet 2000b; 66:
6–15.
Tassone F, Hagerman RJ, Garcia-Arocena D, Khandjian EW, Greco CM,
Hagerman PJ. Intranuclear inclusions in neural cells with premutation
alleles in fragile X associated tremor/ataxia syndrome. J Med Genet
2004; 41: e43.
Tullberg M, Fletcher E, DeCarli C, Mungas D, Reed BR, Harvey DJ, et al.
White matter lesions impair frontal lobe function regardless of their loca-
tion. Neurology 2004; 63: 246–53.
Van Dam D, Errijgers V, Kooy RF, Willemsen R, Mientjes E, Oostra BA, et al.
Cognitive decline, neuromotor and behavioural disturbances in a mouse
model for fragile-X-associated tremor/ataxia syndrome (FXTAS). Behav
Brain Res 2005; 162: 233–9.
Willemsen R, Hoogeveen-Westerveld M, Reis S, Holstege J, Severijnen LA,
Nieuwenhuizen IM, et al. The FMR1 CGG repeat mouse displays ubiquitin-
positive intranuclear neuronal inclusions; implications for the cerebellar
tremor/ataxia syndrome. Hum Mol Genet 2003; 12: 949–59.
Zuhlke C, Budnik A, Gehlken U, Dalski A, Purmann S, Naumann M, et al.
FMR1 premutation as a rare cause of late onset ataxia–evidence for FXTAS
in female carriers. J Neurol 2004; 251: 1418–9.
Neuropathology of FXTAS Brain (2006), 129, 243–255 255
Dow
nloaded from https://academ
ic.oup.com/brain/article/129/1/243/311853 by guest on 15 D
ecember 2021
Recommended