Estimation of COVID-19 Impactin Virginia
Network Systems Science & Advanced
Computing
Biocomplexity Institute & Initiative
University of Virginia
biocomplexity.virginia.edu
October 27th, 2021(data current to October 23rd – 26th)Biocomplexity Institute Technical report: TR 2021-113
About Us
• Biocomplexity Institute at the University of Virginia• Using big data and simulations to understand massively
interactive systems and solve societal problems
• Over 20 years of crafting and analyzing infectious disease models• Pandemic response for Influenza, Ebola, Zika, and others
29-Oct-21 2
Points of Contact
Bryan [email protected]
Srini [email protected]
Madhav [email protected]
Chris [email protected]
Model Development, Outbreak Analytics, and Delivery Team
Przemyslaw Porebski, Joseph Outten, Brian Klahn, Alex Telionis,
Srinivasan Venkatramanan, Bryan Lewis,
Aniruddha Adiga, Hannah Baek, Chris Barrett, Jiangzhuo Chen, Patrick Corbett,
Stephen Eubank, Galen Harrison, Ben Hurt, Dustin Machi, Achla Marathe,
Madhav Marathe, Mark Orr, Akhil Peddireddy, Erin Raymond, James Schlitt, Anil Vullikanti,
Lijing Wang, James Walke, Andrew Warren, Amanda Wilson, Dawen Xie

Key TakeawaysProjecting future cases precisely is impossible and unnecessary.
Even without perfect projections, we can confidently draw conclusions:
• Case rates in Virginia continue to decline, with nearly all districts declining as well
• Case rates are moderating though the rate of decline remains steady
• VA 7-day mean daily incidence is slightly down to 18/100K from 24/100K; US is also slightly down to
21/100K (from 25/100K)
• Statistical forecasts models show continued declines in the near term
• No major changes in variants, masking, or vax acceptance observed
The situation continues to change. Models continue to be updated regularly.
29-Oct-21 3

Situation Assessment
29-Oct-21 4

29-Oct-21 5
Case Rates (per 100k) and Test Positivity
County level RT-PCR test positivityGreen: <5.0% (or <20 tests in past 14 days)Yellow: 5.0%-10.0% (or <500 tests and <2000 tests/100k and >10% positivity over 14 days)Red: >10.0% (and not “Green” or “Yellow”)
• Case rate increase across all health districts • Some past 50% of winter peak and growing• More than 50% of counties with TPR > 10%
Data source: https://data.cms.gov/covid-19/covid-19-nursing-home-data

29-Oct-21
Goal: Define epochs of a Health District’s COVID-19 incidence to characterize the current trajectory
Method: Find recent peak and use hockey stick fit to find inflection point afterwards, then use this period’s slope to define the trajectory
District Trajectories
6
Trajectory DescriptionWeekly Case Rate (per 100K) bounds
# Districts (prev week)
Declining Sustained decreases following a recent peak below -0.9 32 (31)
Plateau Steady level with minimal trend up or down above -0.9 and below 0.5 3 (4)
Slow GrowthSustained growth not rapid enough to be considered a Surge
above 0.5 and below 2.5 0 (0)
In SurgeCurrently experiencing sustained rapid and significant growth
2.5 or greater 0 (0)
Hockey stick fit

29-Oct-21
District Trajectories – last 10 weeks
7
Status# Districts
(prev week)
Declining 32 (31)
Plateau 3 (4)
Slow Growth 0 (0)
In Surge 0 (0)
Curve shows smoothed case rate (per 100K)Trajectories of states in label & chart boxCase Rate curve colored by Reproductive number

Estimating Daily Reproductive Number –Redistributed gap
29-Oct-21
Methodology• Wallinga-Teunis method (EpiEstim1) for cases by confirmation date
• Serial interval: updated to discrete distribution from observations (mean=4.3, Flaxman et al, Nature 2020)
• Using Confirmation date since due to increasingly unstable estimates from onset date due to backfill
1. Anne Cori, Neil M. Ferguson, Christophe Fraser, Simon Cauchemez. A New Framework and Software to Estimate Time-Varying Reproduction Numbers During Epidemics. American Journal of Epidemiology, Volume 178, Issue 9, 1 November 2013, Pages 1505–1512, https://doi.org/10.1093/aje/kwt133
8
Oct 25th Estimates
Skipping Weekend Reports & holidays biases estimatesRedistributed “big” report day to fill in gaps, and then estimate R from ”smoothed” time series
RegionDate Confirmed
Re
Date Confirmed Diff Last Week
State-wide 0.835 -0.045
Central 0.871 0.053
Eastern 0.752 -0.072
Far SW 0.846 -0.023
Near SW 0.844 -0.044
Northern 0.886 -0.082
Northwest 0.839 -0.054

Vaccine Acceptance Components over Time
29-Oct-21 9
Data Source: https://covidcast.cmu.edu
Vaccine Acceptance adjusted to include scheduled appointments• Steady rise in acceptance over the past couple months• Unvaccinated Acceptance shows ~20% of those who are unvaccinated
are definitely or probably willing to be vaccinated• Scheduled appointments for vaccination have increased through August
but seem to be leveling off
Levels of Vaccine Willingness
Levels of Acceptance in flux:• Most regions are steady with
20-30% of unvaccinated still in the Definitely/Probably “Yes” categories.
• About 50% of the Unvaccinated seem to be in the “Definitely Not” category.

Reasons for Hesitancy by Likeliness to Accept
29-Oct-21 10
Data Source: https://covidcast.cmu.edu
Probably Yes
Reasons for Hesitancy vary across tiers of likeliness to accept the vaccine• Probably Yes and Probably No most concerned about side effects & are waiting to see • Definitely No are concerned about side effects but also don’t think they need the
vaccine and don’t trust the government, though don’t need is declining• Most other reasons are below 30% within these tiers of likeliness
Probably No Definitely No

29-Oct-21 11
Mask Usage StallsSelf-reported mask usage has plateaued out to ~65%, perhaps slight decline starting• US and VA similar, though with considerable variation across counties and states• Mask wearing remains lower amongst unvaccinated especially among least willing to be vaccinated
Data Source: https://covidcast.cmu.edu

29-Oct-21 12
SARS-CoV2 Variants of ConcernDelta d - Lineage B.1.617.2 and related subvariants
• Delta plus d+ lineage which contains the K417N mutation is emerging as a sub-variant that is even more transmissible; declared a VoC in India
• Delta variant now dominates most of Europe and US
• CDC recommends resumption of mask wearing indoors due to reports of breakthrough infections of the vaccinated possibly being transmissible
• Recent study from Mayo clinic shows Delta reducing the efficacy of mRNA vaccines (Pfizer more so than Moderna) along with other reports. Israeli study showed 64% efficacy against infection, however, a 3rd dose may counteract this reduction
• Public Health Scotland study in Lancet suggests Delta is 2x more likely to cause hospitalization than Alpha
• Subvariants AY.3 and AY.4 with some significant recent variability (some AY.4 are most prevalent in limited recent observations)
• While there are limited genomes submitted, these subvariants are mainly clustered in the US, others mainly outside of US
• More non-US AY.X subvariants are being found in VA as they are being defined.
Current fits suggest stable mix of Delta & subvariants into the future

29-Oct-21 13
Other State ComparisonsTrajectories of States
• All neighbors now in sustained decline or have started plateauing around 10/100K
• Case rates are now moderating
• Most states continue to decline (48)• Very few states (1) remain in growth, with some in plateau (5)• Case rates remain high, but nationally rates have been in sustained
decline
Virginia and her neighbors

County level Case Rates (per 100K) proportion when comparing this most recent week to:
29-Oct-21
Last Week compared to the worst and the best
14
Worst Week of the PandemicSummer 2020 mean
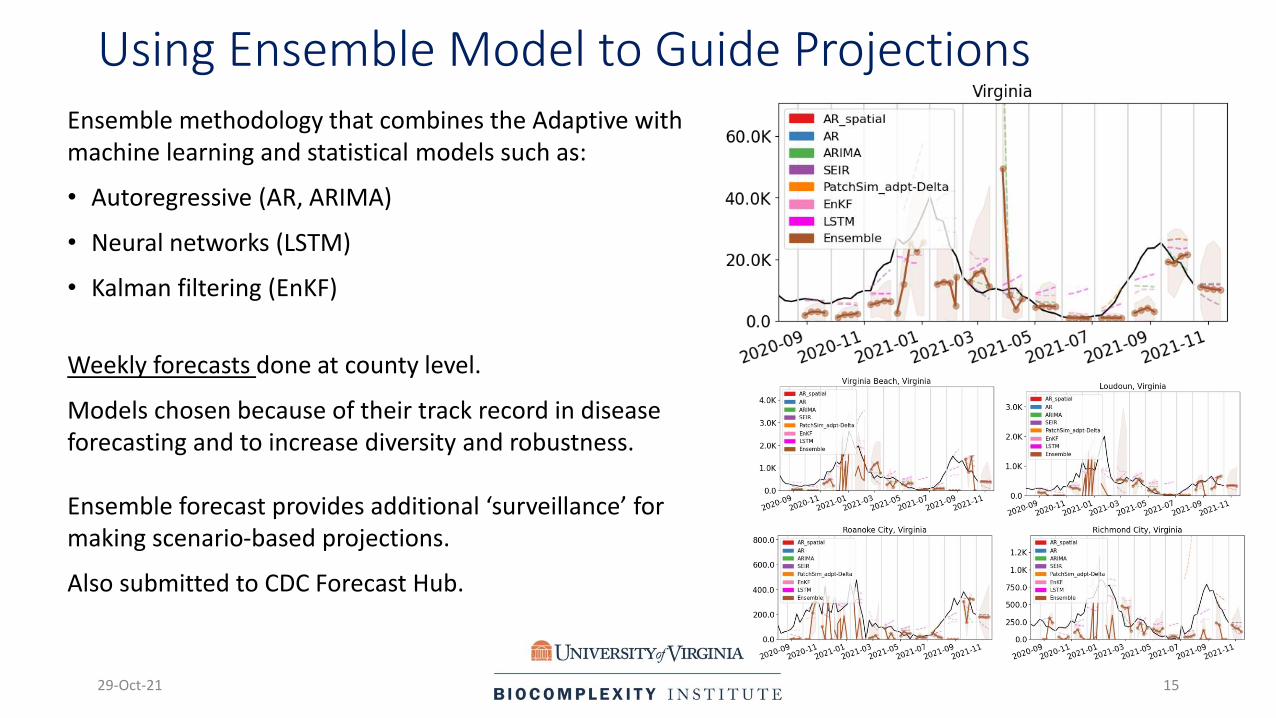
Using Ensemble Model to Guide ProjectionsEnsemble methodology that combines the Adaptive with machine learning and statistical models such as:
• Autoregressive (AR, ARIMA)
• Neural networks (LSTM)
• Kalman filtering (EnKF)
Weekly forecasts done at county level.
Models chosen because of their track record in disease forecasting and to increase diversity and robustness.
Ensemble forecast provides additional ‘surveillance’ for making scenario-based projections.
Also submitted to CDC Forecast Hub.
29-Oct-21 15

Review of “A Year of Projections”
29-Oct-21 16
Confirmed case ProjectionsAdaptive Approach with associated other projections
Sept 30th, 2020 to Oct 20th, 2021

Key Takeaways
29-Oct-21 17
Projecting future cases precisely is impossible and unnecessary.
Even without perfect projections, we can confidently draw conclusions:
• Case rates in Virginia continue to decline, with nearly all districts declining as well
• Case rates are moderating though the rate of decline remains steady
• VA 7-day mean daily incidence is slightly down to 18/100K from 24/100K; US is also slightly down to 21/100K (from
25/100K)
• Statistical forecasts models show continued declines in the near term
• No major changes in variants, masking, or vax acceptance observed
The situation continues to change. Models continue to be updated regularly.
Recommended