2018 SCALE Users’ Group Workshop
NCSU activities on High Temperature Reactor Design using SCALE
Oak Ridge National Laboratory
Paolo Balestra, Pascal Rouxelin, Lidong Wang, Jason Hou, Kostadin Ivanov
1
Overview of the ongoing activities• PBR-250
– IAEA Coordinated Research Program (CRP) on the HTGR Uncertainty Analysis in Modeling (UAM) - Benchmark Phase I Results (PBR-250),
• MTGR-350:– Comparison of the multiplication factor with KENO/SERPENT in
single block, super cell and core models,– Super cell model spectrum comparison for cross section
generation,– Space time convergences of the models – NEWT vs
KENO/SERPENT
2
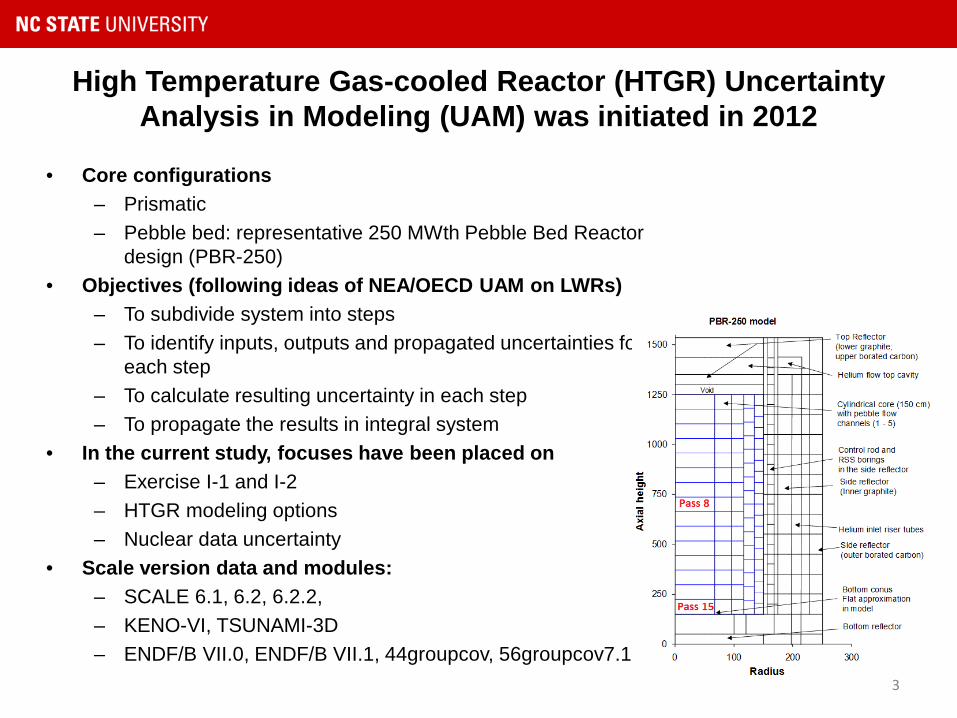
• Core configurations– Prismatic– Pebble bed: representative 250 MWth Pebble Bed Reactor
design (PBR-250)• Objectives (following ideas of NEA/OECD UAM on LWRs)
– To subdivide system into steps– To identify inputs, outputs and propagated uncertainties for
each step– To calculate resulting uncertainty in each step– To propagate the results in integral system
• In the current study, focuses have been placed on– Exercise I-1 and I-2– HTGR modeling options– Nuclear data uncertainty
• Scale version data and modules:– SCALE 6.1, 6.2, 6.2.2,– KENO-VI, TSUNAMI-3D– ENDF/B VII.0, ENDF/B VII.1, 44groupcov, 56groupcov7.1
High Temperature Gas-cooled Reactor (HTGR) Uncertainty Analysis in Modeling (UAM) was initiated in 2012
3
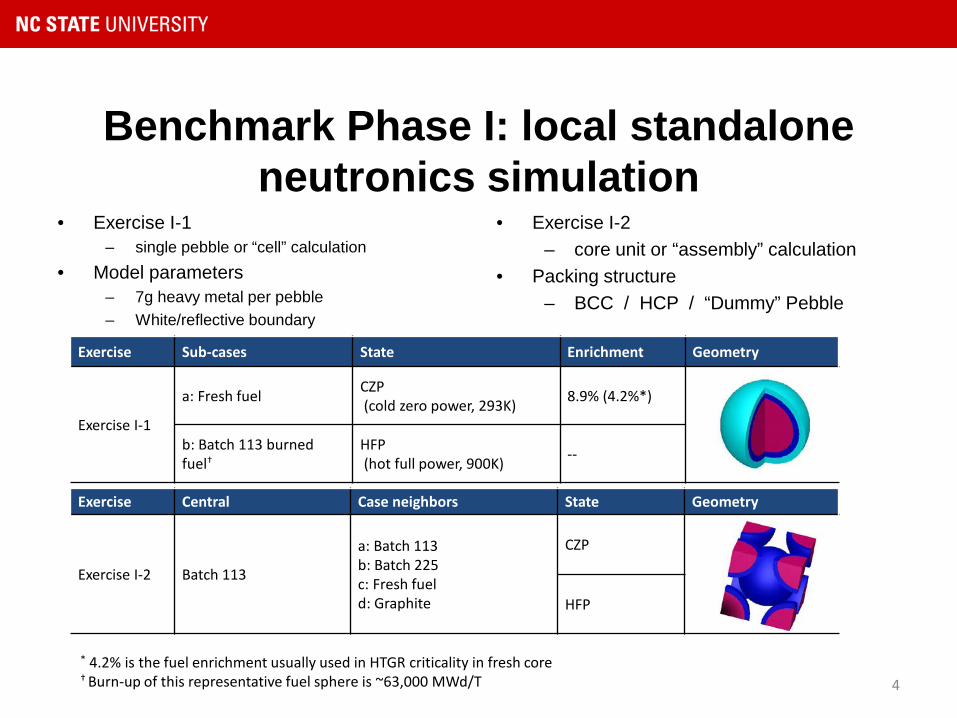
• Exercise I-1– single pebble or “cell” calculation
• Model parameters– 7g heavy metal per pebble– White/reflective boundary
• Exercise I-2– core unit or “assembly” calculation
• Packing structure– BCC / HCP / “Dummy” Pebble
Benchmark Phase I: local standalone neutronics simulation
Exercise Sub-cases State Enrichment Geometry
Exercise I-1
a: Fresh fuel CZP(cold zero power, 293K) 8.9% (4.2%*)
b: Batch 113 burned fuel†
HFP(hot full power, 900K) --
Exercise Central Case neighbors State Geometry
Exercise I-2 Batch 113
a: Batch 113b: Batch 225c: Fresh fueld: Graphite
CZP
HFP
* 4.2% is the fuel enrichment usually used in HTGR criticality in fresh core† Burn-up of this representative fuel sphere is ~63,000 MWd/T 4
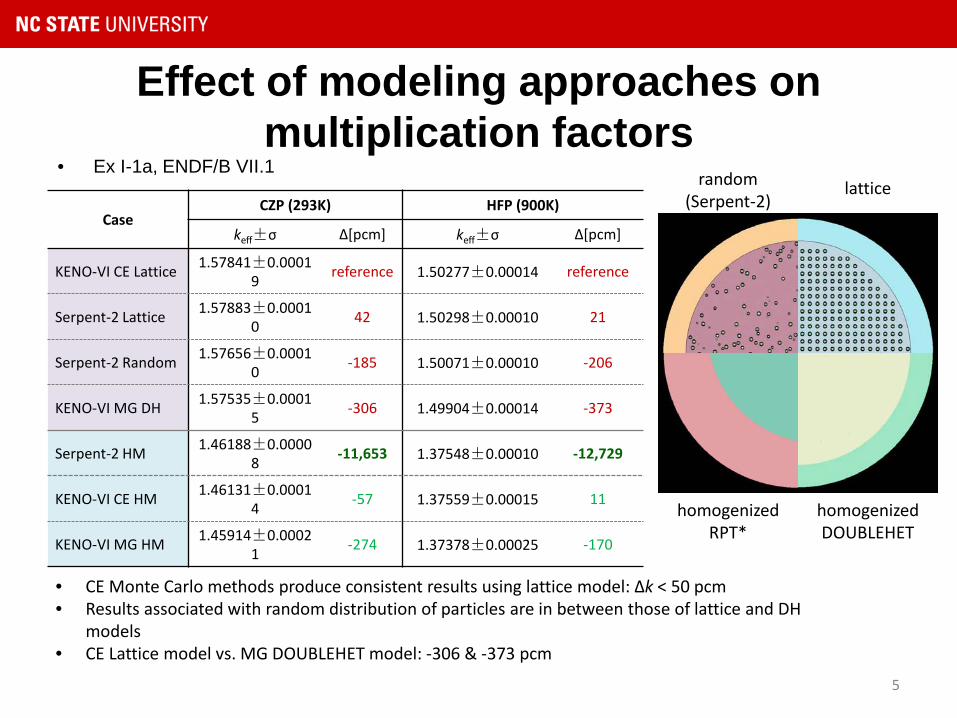
• Ex I-1a, ENDF/B VII.1
Effect of modeling approaches on multiplication factors
5
CaseCZP (293K) HFP (900K)
keff±σ Δ[pcm] keff±σ Δ[pcm]
KENO-VI CE Lattice 1.57841±0.00019 reference 1.50277±0.00014 reference
Serpent-2 Lattice 1.57883±0.00010 42 1.50298±0.00010 21
Serpent-2 Random 1.57656±0.00010 -185 1.50071±0.00010 -206
KENO-VI MG DH 1.57535±0.00015 -306 1.49904±0.00014 -373
Serpent-2 HM 1.46188±0.00008 -11,653 1.37548±0.00010 -12,729
KENO-VI CE HM 1.46131±0.00014 -57 1.37559±0.00015 11
KENO-VI MG HM 1.45914±0.00021 -274 1.37378±0.00025 -170
• CE Monte Carlo methods produce consistent results using lattice model: Δk < 50 pcm• Results associated with random distribution of particles are in between those of lattice and DH
models• CE Lattice model vs. MG DOUBLEHET model: -306 & -373 pcm
lattice
homogenizedRPT*
random(Serpent-2)
homogenizedDOUBLEHET
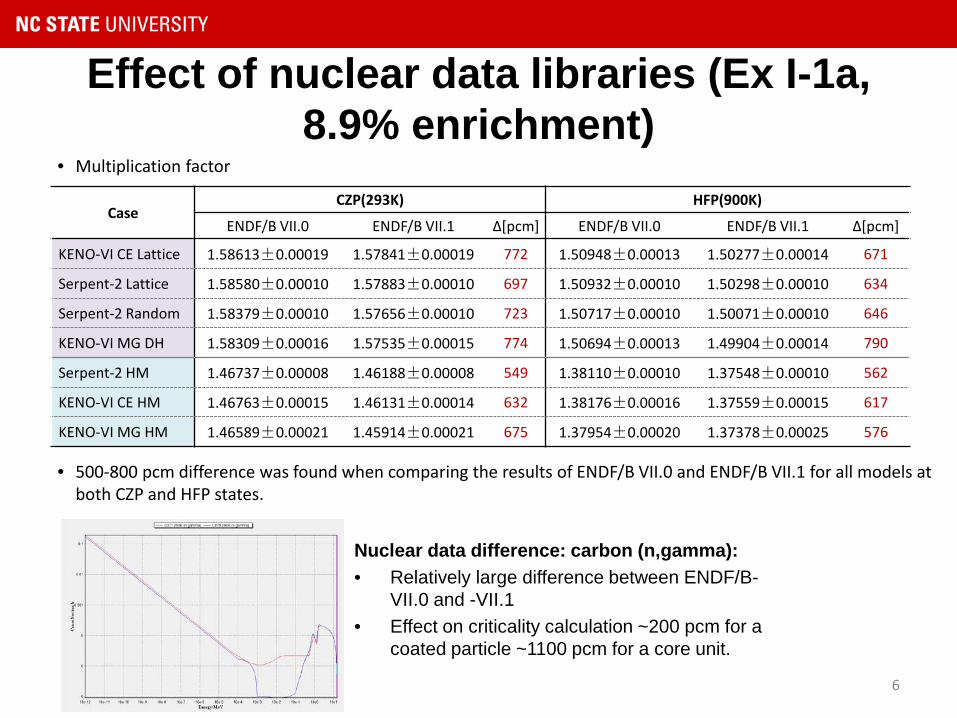
• Multiplication factor
Effect of nuclear data libraries (Ex I-1a, 8.9% enrichment)
6
CaseCZP(293K) HFP(900K)
ENDF/B VII.0 ENDF/B VII.1 Δ[pcm] ENDF/B VII.0 ENDF/B VII.1 Δ[pcm]
KENO-VI CE Lattice 1.58613±0.00019 1.57841±0.00019 772 1.50948±0.00013 1.50277±0.00014 671
Serpent-2 Lattice 1.58580±0.00010 1.57883±0.00010 697 1.50932±0.00010 1.50298±0.00010 634
Serpent-2 Random 1.58379±0.00010 1.57656±0.00010 723 1.50717±0.00010 1.50071±0.00010 646
KENO-VI MG DH 1.58309±0.00016 1.57535±0.00015 774 1.50694±0.00013 1.49904±0.00014 790
Serpent-2 HM 1.46737±0.00008 1.46188±0.00008 549 1.38110±0.00010 1.37548±0.00010 562
KENO-VI CE HM 1.46763±0.00015 1.46131±0.00014 632 1.38176±0.00016 1.37559±0.00015 617
KENO-VI MG HM 1.46589±0.00021 1.45914±0.00021 675 1.37954±0.00020 1.37378±0.00025 576
• 500-800 pcm difference was found when comparing the results of ENDF/B VII.0 and ENDF/B VII.1 for all models at both CZP and HFP states.
Nuclear data difference: carbon (n,gamma):• Relatively large difference between ENDF/B-
VII.0 and -VII.1• Effect on criticality calculation ~200 pcm for a
coated particle ~1100 pcm for a core unit.
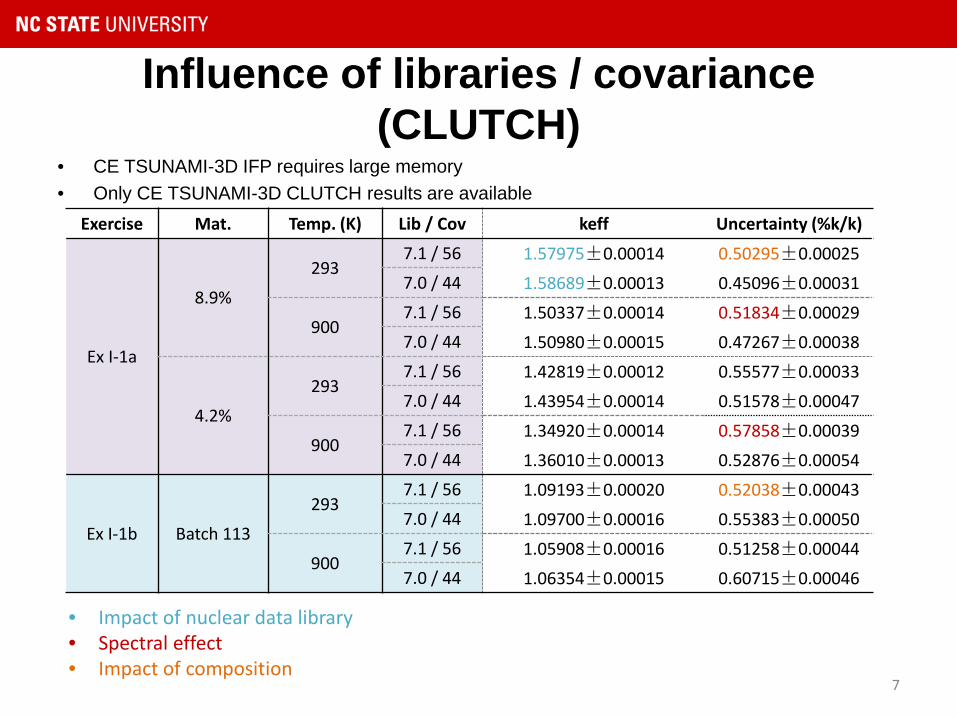
• CE TSUNAMI-3D IFP requires large memory• Only CE TSUNAMI-3D CLUTCH results are available
Influence of libraries / covariance (CLUTCH)
Exercise Mat. Temp. (K) Lib / Cov keff Uncertainty (%k/k)
Ex I-1a
8.9%
2937.1 / 56 1.57975±0.00014 0.50295±0.000257.0 / 44 1.58689±0.00013 0.45096±0.00031
9007.1 / 56 1.50337±0.00014 0.51834±0.000297.0 / 44 1.50980±0.00015 0.47267±0.00038
4.2%
2937.1 / 56 1.42819±0.00012 0.55577±0.000337.0 / 44 1.43954±0.00014 0.51578±0.00047
9007.1 / 56 1.34920±0.00014 0.57858±0.000397.0 / 44 1.36010±0.00013 0.52876±0.00054
Ex I-1b Batch 113
2937.1 / 56 1.09193±0.00020 0.52038±0.000437.0 / 44 1.09700±0.00016 0.55383±0.00050
9007.1 / 56 1.05908±0.00016 0.51258±0.000447.0 / 44 1.06354±0.00015 0.60715±0.00046
7
• Impact of nuclear data library• Spectral effect• Impact of composition
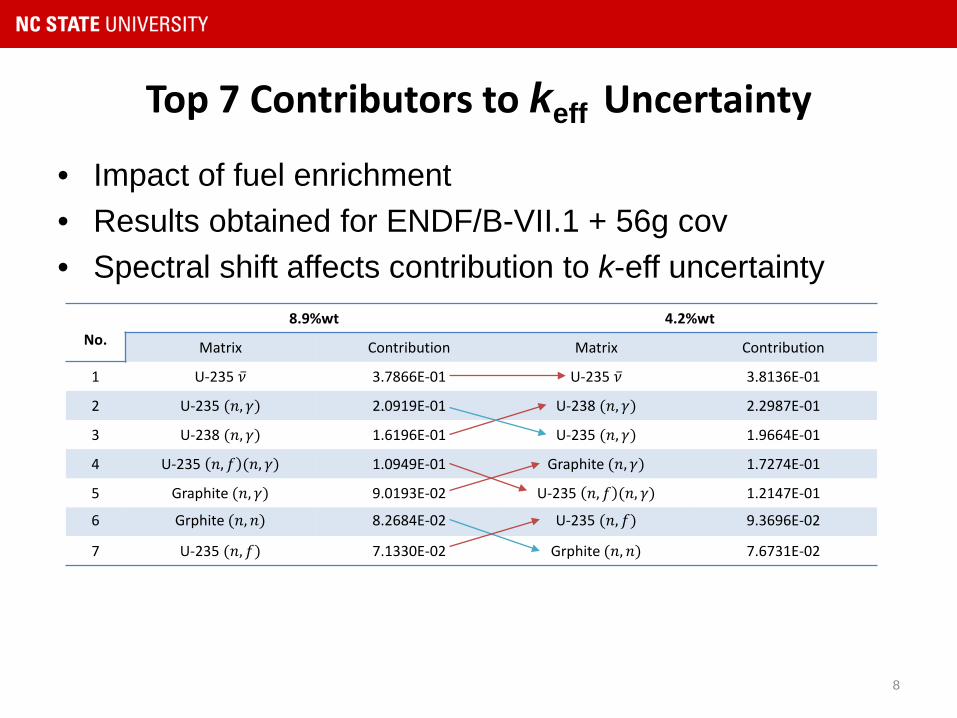
Top 7 Contributors to keff Uncertainty
• Impact of fuel enrichment• Results obtained for ENDF/B-VII.1 + 56g cov• Spectral shift affects contribution to k-eff uncertainty
8
No.8.9%wt 4.2%wt
Matrix Contribution Matrix Contribution
1 U-235 �̅�𝜈 3.7866E-01 U-235 �̅�𝜈 3.8136E-01
2 U-235 (𝑛𝑛, 𝛾𝛾) 2.0919E-01 U-238 (𝑛𝑛, 𝛾𝛾) 2.2987E-01
3 U-238 (𝑛𝑛, 𝛾𝛾) 1.6196E-01 U-235 (𝑛𝑛, 𝛾𝛾) 1.9664E-01
4 U-235 𝑛𝑛, 𝑓𝑓 (𝑛𝑛, 𝛾𝛾) 1.0949E-01 Graphite (𝑛𝑛, 𝛾𝛾) 1.7274E-01
5 Graphite (𝑛𝑛, 𝛾𝛾) 9.0193E-02 U-235 𝑛𝑛, 𝑓𝑓 (𝑛𝑛, 𝛾𝛾) 1.2147E-01
6 Grphite (𝑛𝑛,𝑛𝑛) 8.2684E-02 U-235 (𝑛𝑛,𝑓𝑓) 9.3696E-02
7 U-235 (𝑛𝑛,𝑓𝑓) 7.1330E-02 Grphite (𝑛𝑛,𝑛𝑛) 7.6731E-02
Comparison of the multiplication factor with KENO/SERPENT in single block,
super cell and core models
Objectives: – Comparing criticality calculation between SERPENT2
and SCALE-6.2.0/KENO-VI – Evaluating the effect of CE vs MG structure
9
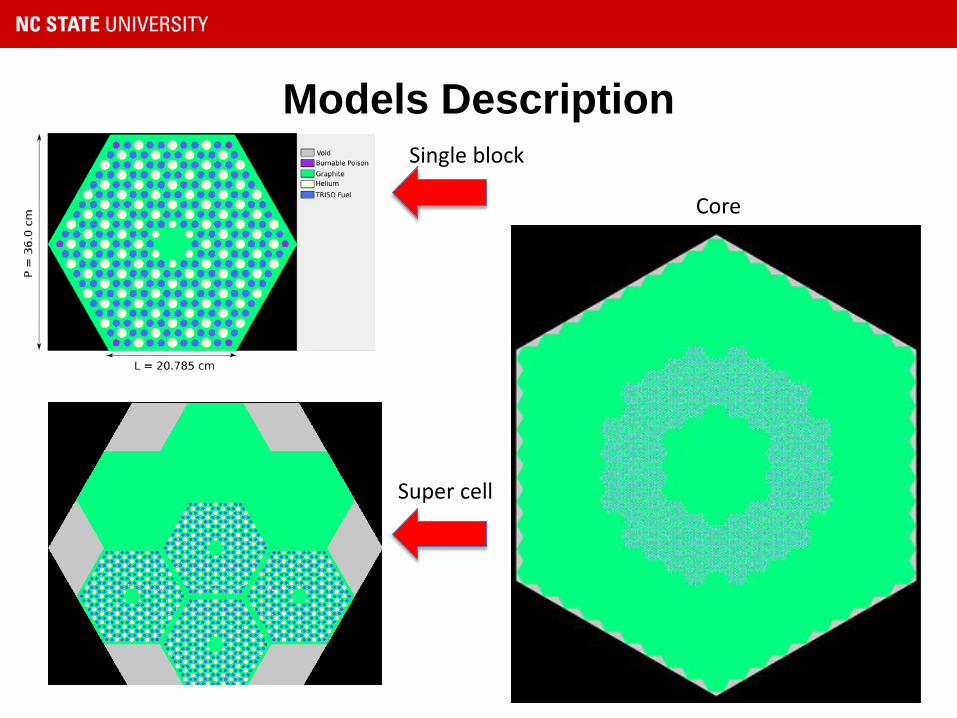
Models Description
10
Single block
Super cell
Core
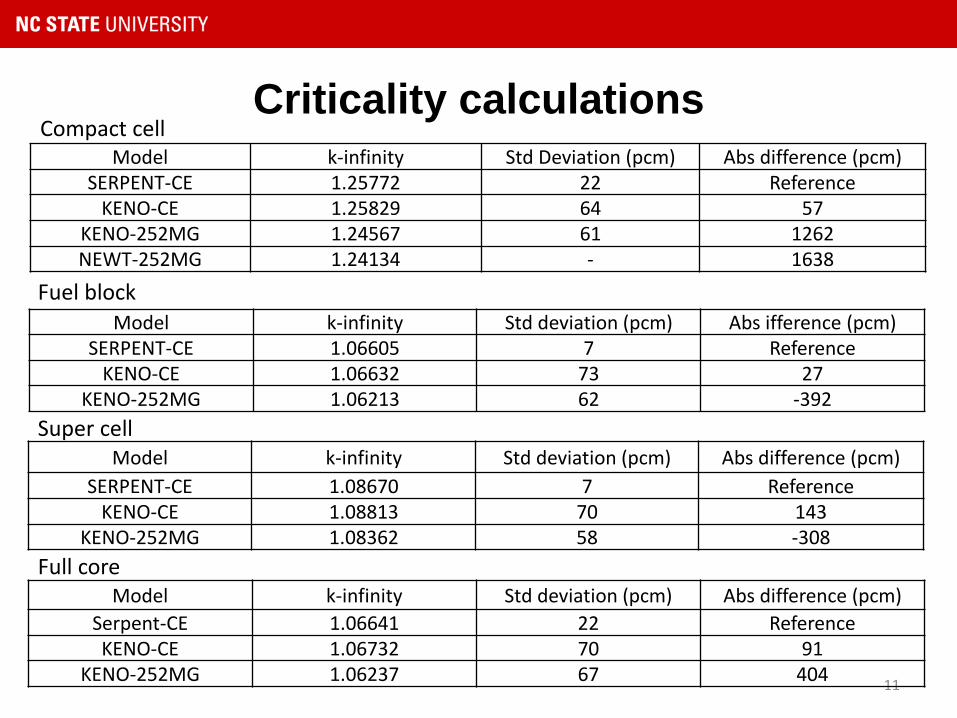
Criticality calculations
11
Model k-infinity Std deviation (pcm) Abs difference (pcm)SERPENT-CE 1.08670 7 Reference
KENO-CE 1.08813 70 143KENO-252MG 1.08362 58 -308
Super cell
Model k-infinity Std Deviation (pcm) Abs difference (pcm)SERPENT-CE 1.25772 22 Reference
KENO-CE 1.25829 64 57KENO-252MG 1.24567 61 1262NEWT-252MG 1.24134 - 1638
Compact cell
Model k-infinity Std deviation (pcm) Abs ifference (pcm)SERPENT-CE 1.06605 7 Reference
KENO-CE 1.06632 73 27KENO-252MG 1.06213 62 -392
Fuel block
Model k-infinity Std deviation (pcm) Abs difference (pcm)Serpent-CE 1.06641 22 ReferenceKENO-CE 1.06732 70 91
KENO-252MG 1.06237 67 404
Full core
Conclusions
12
• As expected the continuous energy mode is in better agreement than themulti-group mode results for all of the models.• The multi-group calculations underestimate the multiplication factor by~400 pcm. The Serpent and KENO-CE simulations agree within 2 standarddeviations.
Super cell model spectrum comparison for cross section generation
Objectives: – Providing a reference spectrum from serpent and comparing it
with NEWT.– Comparing the core flux spectrum to different super cells to get
the configuration that reproduce the core wide spectrum better to generate 26-group libraries for the PHISICS/RELAP5-3D model using NEWT.
13
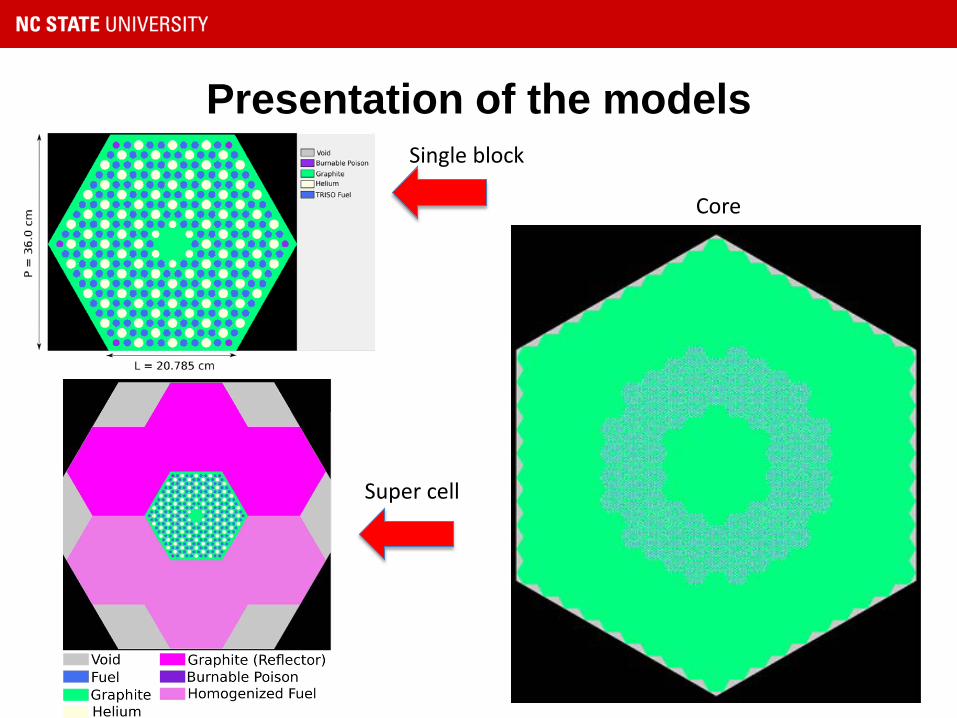
Presentation of the models
14
Single block
Super cell
Core
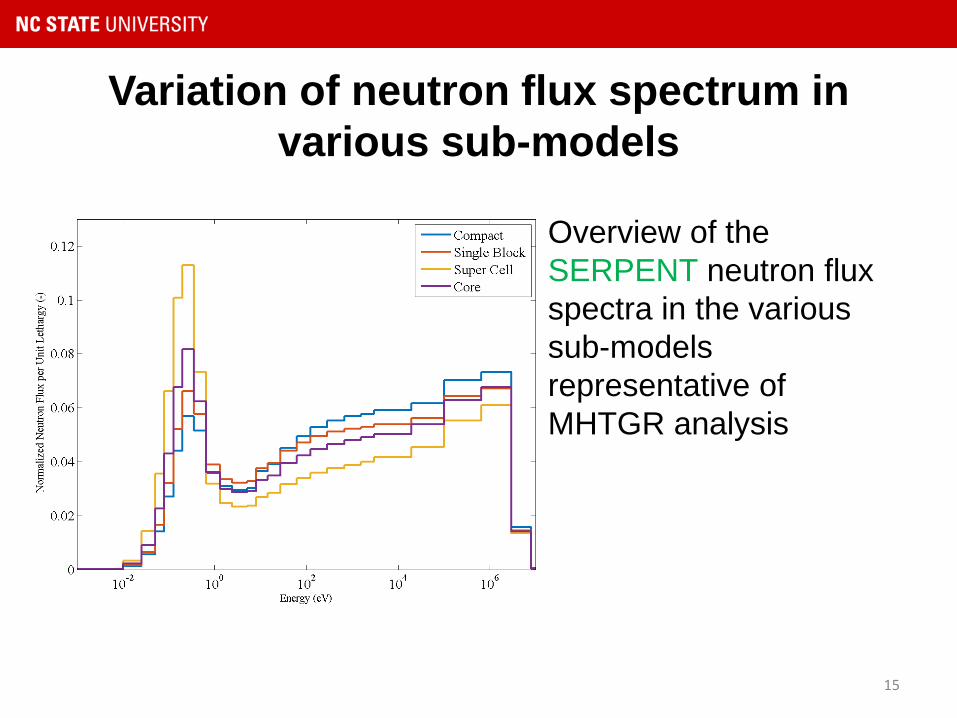
Variation of neutron flux spectrum in various sub-models
Overview of the SERPENT neutron flux spectra in the various sub-models representative of MHTGR analysis
15
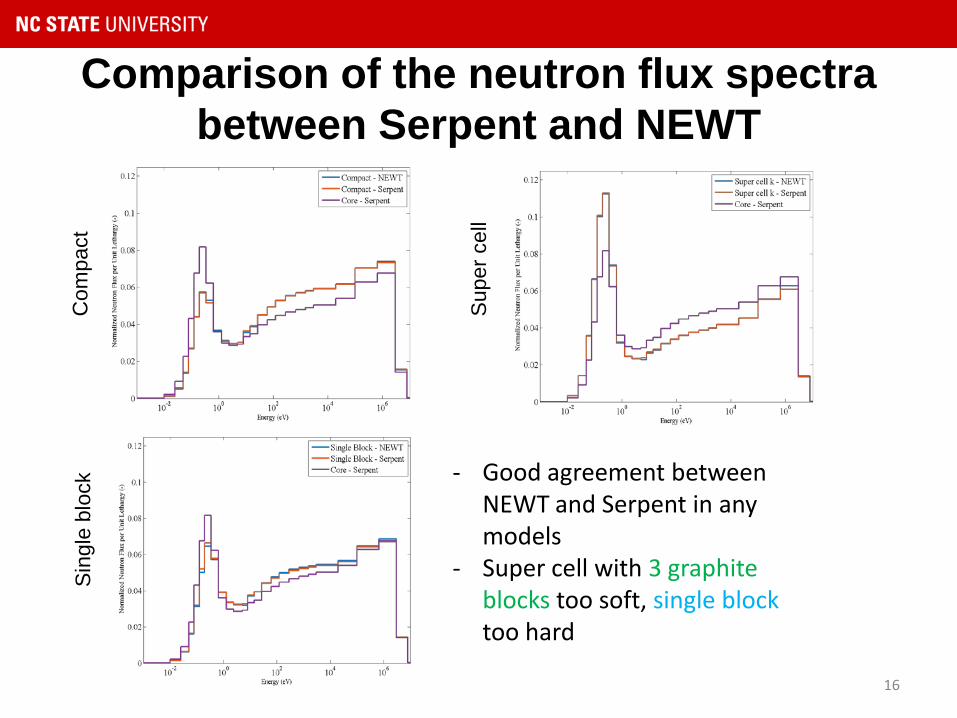
Comparison of the neutron flux spectra between Serpent and NEWT
16
- Good agreement between NEWT and Serpent in any models
- Super cell with 3 graphite blocks too soft, single blocktoo hard
Com
pact
Sing
le b
lock
Supe
r cel
l
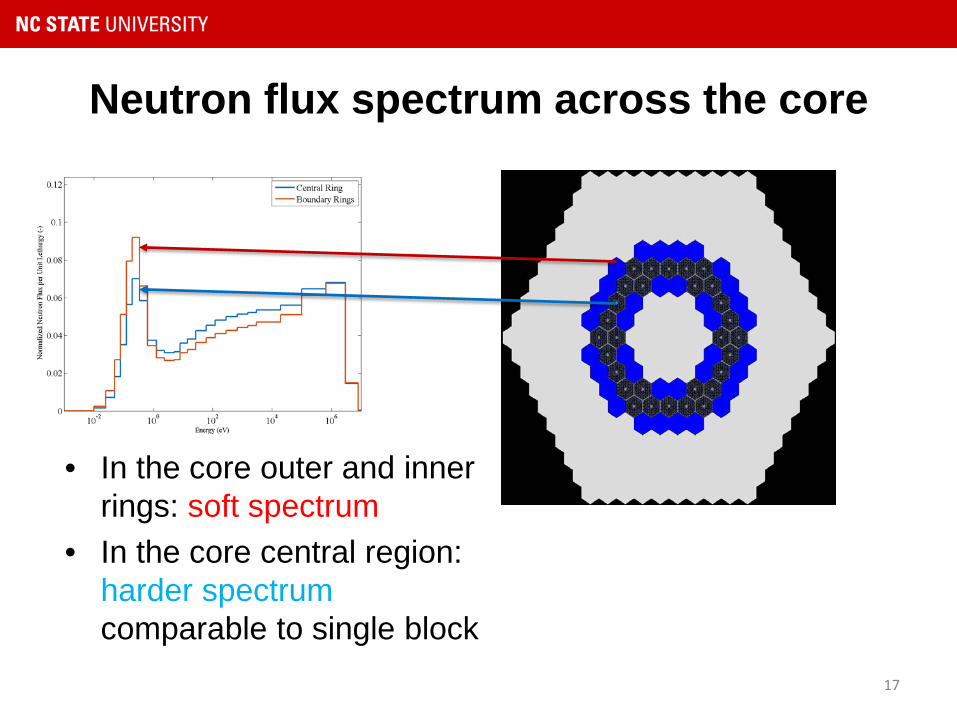
Neutron flux spectrum across the core
• In the core outer and inner rings: soft spectrum
• In the core central region: harder spectrum comparable to single block
17
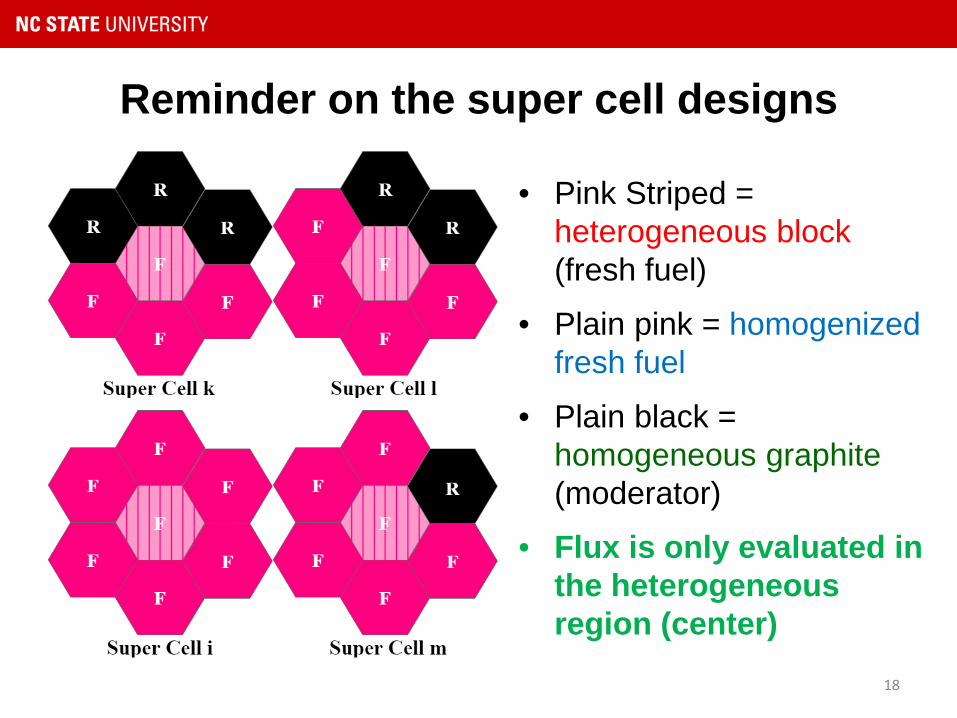
Reminder on the super cell designs
• Pink Striped = heterogeneous block (fresh fuel)
• Plain pink = homogenized fresh fuel
• Plain black = homogeneous graphite (moderator)
• Flux is only evaluated in the heterogeneous region (center)
18
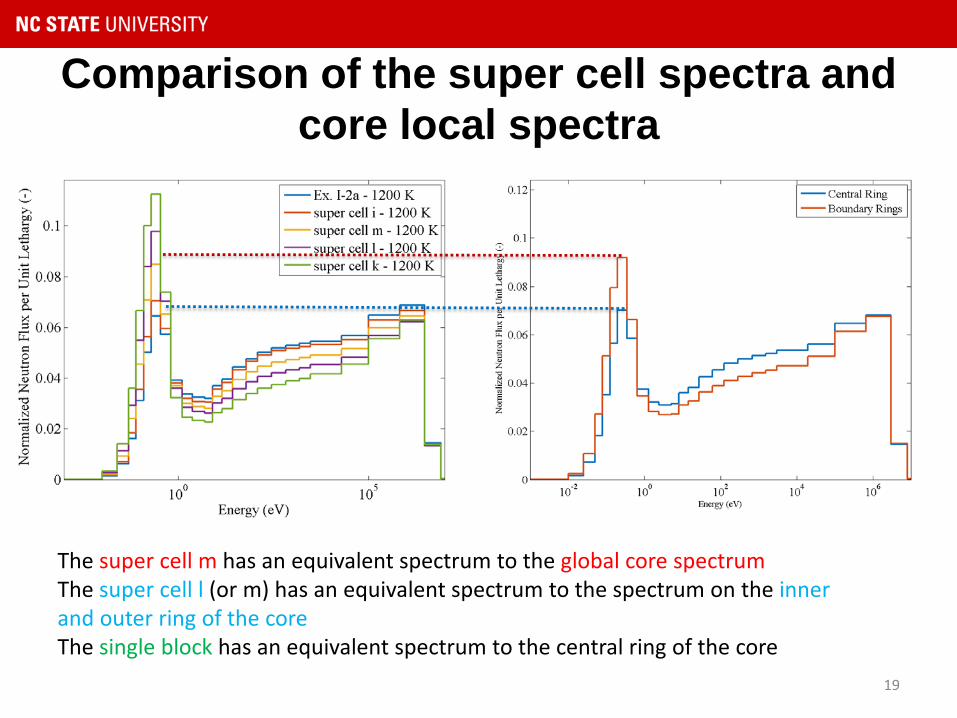
Comparison of the super cell spectra and core local spectra
19
The super cell m has an equivalent spectrum to the global core spectrumThe super cell l (or m) has an equivalent spectrum to the spectrum on the inner and outer ring of the coreThe single block has an equivalent spectrum to the central ring of the core
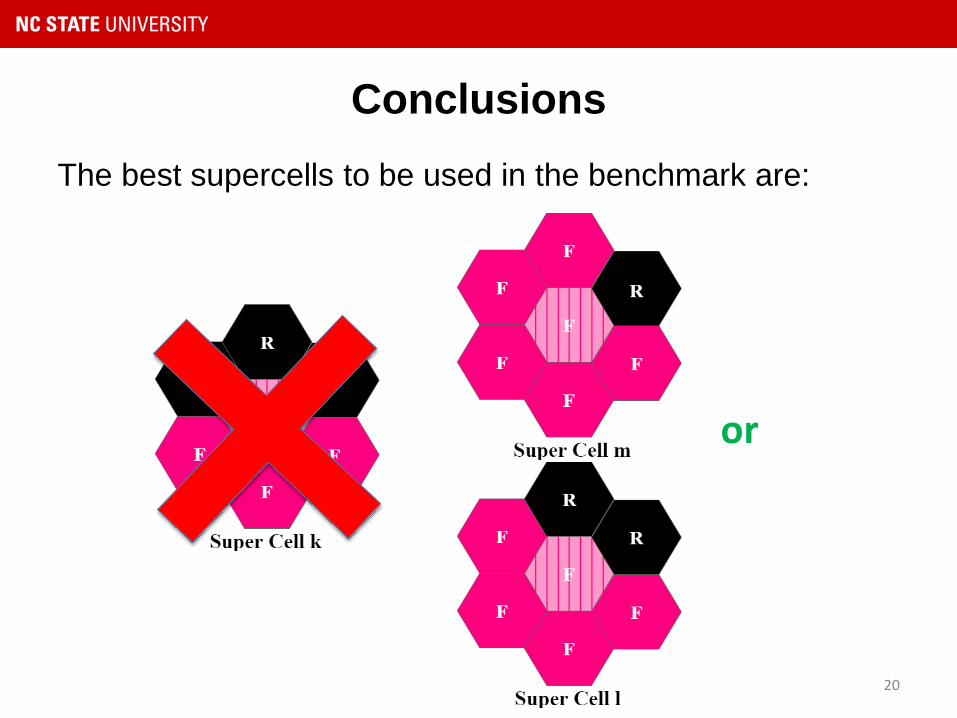
ConclusionsThe best supercells to be used in the benchmark are:
20
or
Space time convergences of the models – NEWT vs KENO/SERPENT
Objectives: – Giving an overview of running time and general convergence of
the various models,– Show that the NEWT models converge to KENO or Serpent
results as the parameters are refined,– Give an order of magnitude of sensitivity of the refined
parameter,– Recommend specifications for the depletion exercises
21
NEWT convergence parameters
22
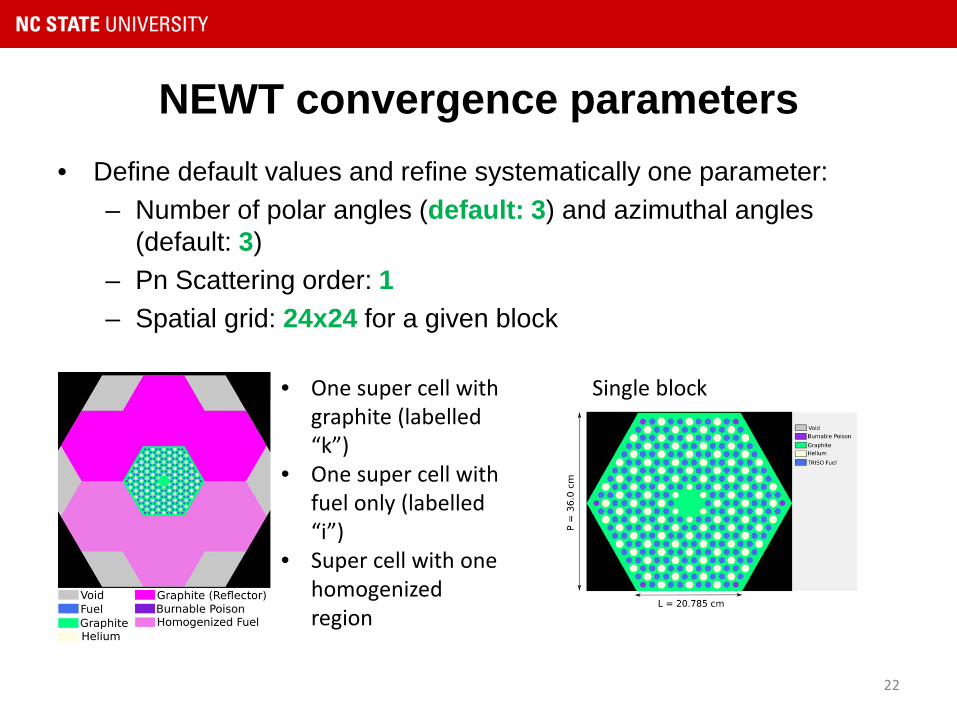
• Define default values and refine systematically one parameter:– Number of polar angles (default: 3) and azimuthal angles
(default: 3)– Pn Scattering order: 1– Spatial grid: 24x24 for a given block
Single block• One super cell with graphite (labelled “k”)
• One super cell with fuel only (labelled “i”)
• Super cell with one homogenized region
Results on multiplication factor
23
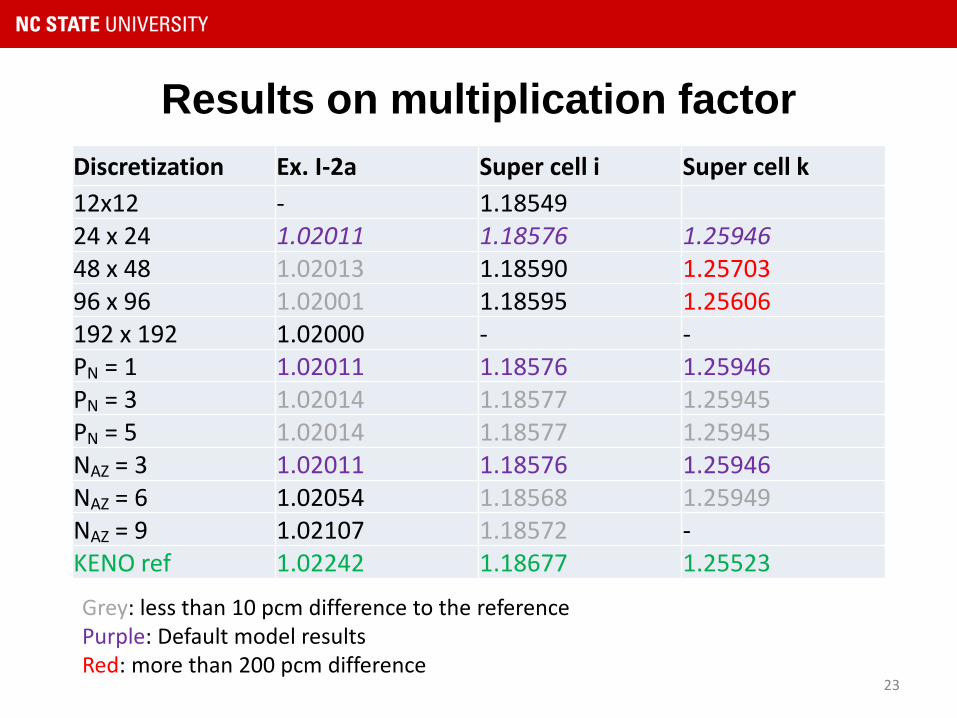
Discretization Ex. I-2a Super cell i Super cell k12x12 - 1.1854924 x 24 1.02011 1.18576 1.2594648 x 48 1.02013 1.18590 1.2570396 x 96 1.02001 1.18595 1.25606192 x 192 1.02000 - -PN = 1 1.02011 1.18576 1.25946PN = 3 1.02014 1.18577 1.25945PN = 5 1.02014 1.18577 1.25945NAZ = 3 1.02011 1.18576 1.25946NAZ = 6 1.02054 1.18568 1.25949NAZ = 9 1.02107 1.18572 -KENO ref 1.02242 1.18677 1.25523
Grey: less than 10 pcm difference to the reference Purple: Default model resultsRed: more than 200 pcm difference
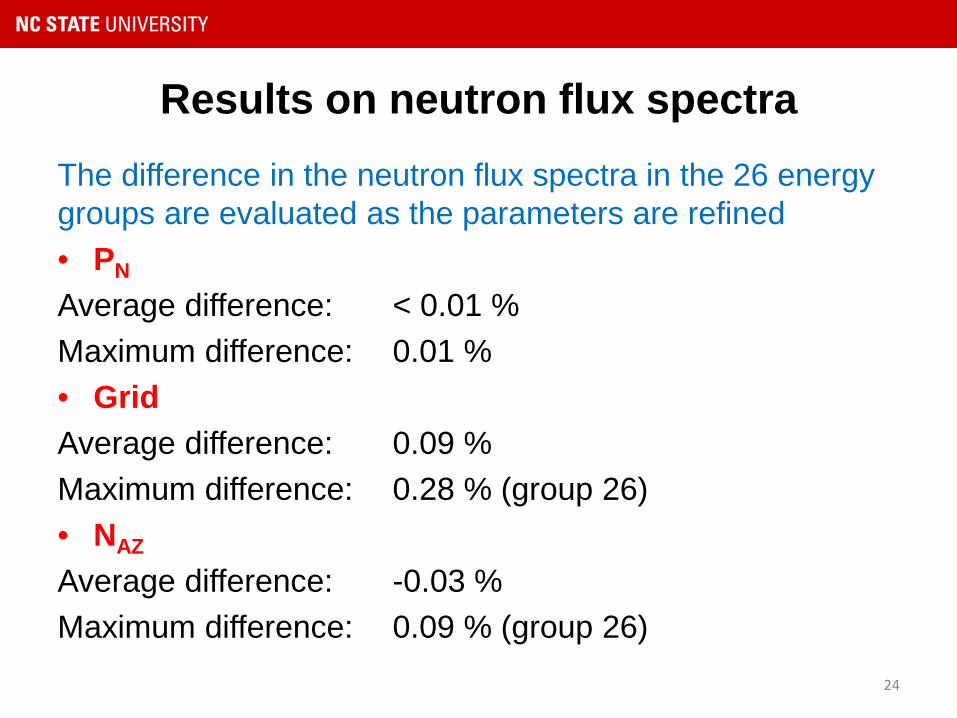
Results on neutron flux spectraThe difference in the neutron flux spectra in the 26 energy groups are evaluated as the parameters are refined• PN
Average difference: < 0.01 %Maximum difference: 0.01 % • GridAverage difference: 0.09 %Maximum difference: 0.28 % (group 26) • NAZ
Average difference: -0.03 %Maximum difference: 0.09 % (group 26)
24
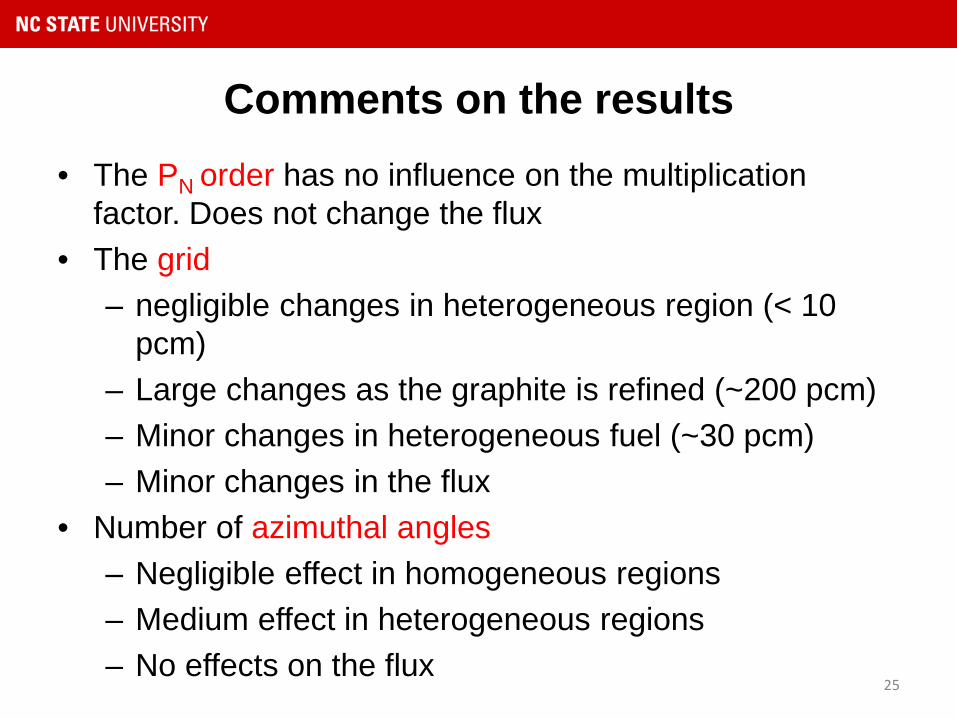
Comments on the results • The PN order has no influence on the multiplication
factor. Does not change the flux• The grid
– negligible changes in heterogeneous region (< 10 pcm)
– Large changes as the graphite is refined (~200 pcm)– Minor changes in heterogeneous fuel (~30 pcm)– Minor changes in the flux
• Number of azimuthal angles– Negligible effect in homogeneous regions– Medium effect in heterogeneous regions– No effects on the flux
25
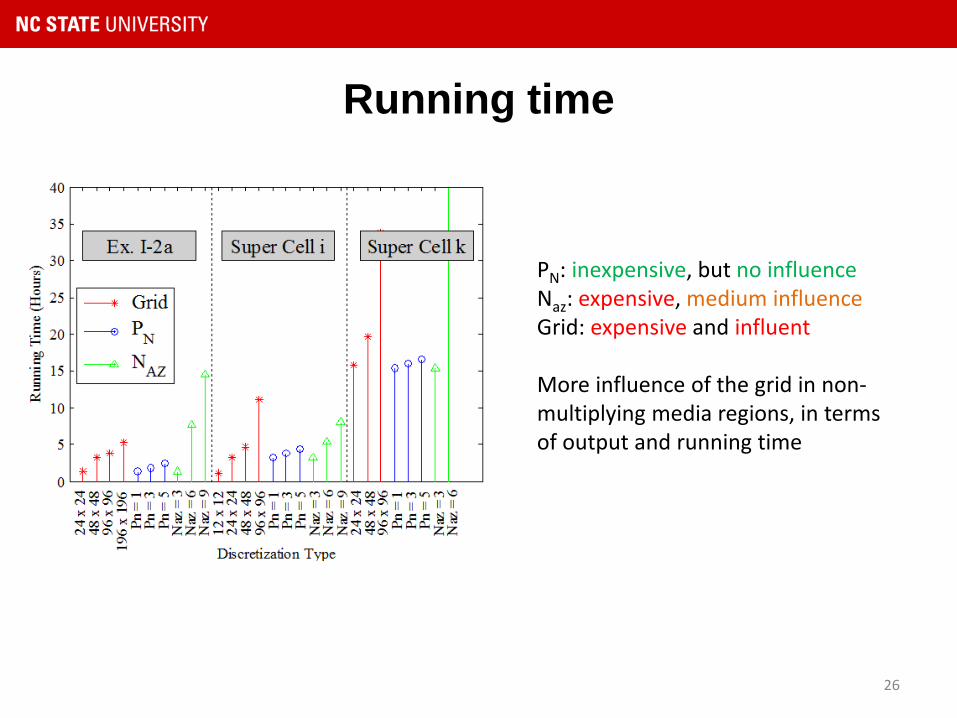
Running time
26
PN: inexpensive, but no influenceNaz: expensive, medium influenceGrid: expensive and influent
More influence of the grid in non-multiplying media regions, in terms of output and running time
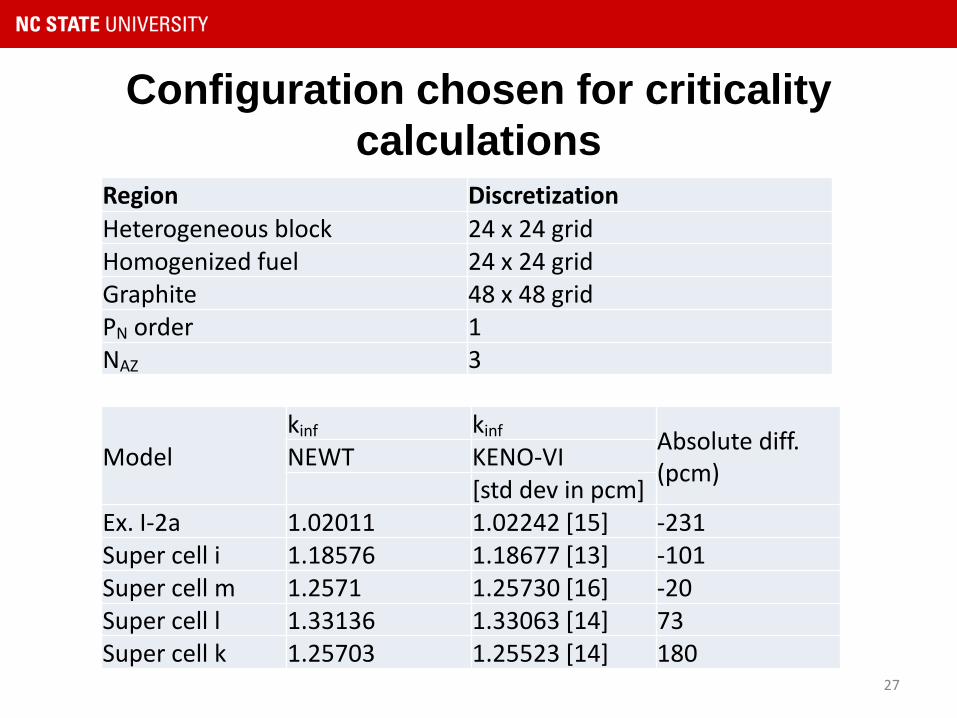
Configuration chosen for criticality calculations
27
Region DiscretizationHeterogeneous block 24 x 24 gridHomogenized fuel 24 x 24 gridGraphite 48 x 48 gridPN order 1NAZ 3
Modelkinf kinf Absolute diff.
(pcm)NEWT KENO-VI[std dev in pcm]
Ex. I-2a 1.02011 1.02242 [15] -231Super cell i 1.18576 1.18677 [13] -101Super cell m 1.2571 1.25730 [16] -20Super cell l 1.33136 1.33063 [14] 73Super cell k 1.25703 1.25523 [14] 180
Thanks for your Attention!
28
Recommended