NBER WORKING PAPER SERIES
THE IMPACT OF PROVIDER CHOICE ON WORKERS’COMPENSATION COSTS AND OUTCOMES
David NeumarkPeter S. Barth
Richard A. Victor
Working Paper 11855http://www.nber.org/papers/w11855
NATIONAL BUREAU OF ECONOMIC RESEARCH1050 Massachusetts Avenue
Cambridge, MA 02138December 2005
Neumark is Senior Fellow at the Public Policy Institute of California, Research Associate of the NBER,Research Fellow at IZA, and Visiting Scholar at the Institute of Business and Economic Research,UC-Berkeley. Barth is Professor of Economics Emeritus at the University of Connecticut. Victor isExecutive Director of the Workers Compensation Research Institute. All views are the authors’, and do notreflect the views of their institutions. Outstanding research assistance was provided by Te-Chun Liu. Webenefited from comments from Leslie Boden, Jeffrey Harris, Allan Hunt, and Frank Neuhauser.The viewsexpressed herein are those of the author(s) and do not necessarily reflect the views of the National Bureauof Economic Research.
©2005 by David Neumark, Peter S. Barth, and Richard A. Victor. All rights reserved. Short sections oftext, not to exceed two paragraphs, may be quoted without explicit permission provided that full credit,including © notice, is given to the source.

The Impact of Provider Choice on Workers’ Compensation Costs and OutcomesDavid Neumark, Peter S. Barth, and Richard A. VictorNBER Working Paper No. 11855December 2005JEL No. J28, I18
ABSTRACT
We study how provider choice in workers' compensation cases affects costs and outcomes. When
employees choose the provider, costs are higher and return-to-work outcomes are worse, while
physical recovery is the same although satisfaction with medical care is higher. The higher costs and
worse return-to-work outcomes associated with employee choice arise largely when employees
selected a new provider, rather than a provider with whom the worker had a pre-existing relationship.
The findings lend some support to recent policy changes limiting workers' ability to choose a
provider with whom they do not have a prior relationship.
David NeumarkDepartment of Economics3151 Social Science PlazaUniversity of CaliforniaIrvine, California 92697-5100and [email protected]
Peter S. BarthUniversity of Connecticut
Richard VictorWorkers Compensation Research Institute

1
1. Introduction
As health care costs in workers’ compensation have grown rapidly and become an
increasingly important proportion of system benefits, more attention has focused on the choice of
provider (National Academy of Social Insurance, 2004). Selection of the provider is critical to
both workers and employers because health care providers in workers’ compensation influence
whether the worker is eligible for benefits, the nature and cost of care, the extent of disability and
hence the amount of income benefit payments, and the timing of return to work.
Workers and their advocates have argued that provider choice should be left to the
worker.1 At a minimum, they argue that workers should be treated by those they trust and whose
interests line up with the worker – interests that encourage prompt return to work, but only as
medically indicated, and the fullest restoration possible of physical capacity (Ellenberger, 1992).
In contrast, employer advocates argue that choice should be made by the employer because
without employer choice there is “… little incentive to see that the costs of care remain reasonable
and appropriate …” (Morrison, 1990). Employer advocates also argue that “[e]mployer selection
of the treating physician serves to direct injured workers away from those providers who provide
excessive services and treatment procedures,” and to “retain those providers familiar with the
operations of the employer and who can expedite return-to-work based on that knowledge”
(National Federation of Independent Business Research Foundation and National Foundation for
Unemployment Compensation and Workers’ Compensation, n.d.).
The issue of provider choice is more complex than simply deciding which party shall
choose the initial provider, because there are often changes in providers associated with
dissatisfaction with treatment or the need for specialized care. Thus, state workers’ compensation
laws regulate both who may select the initial provider and the circumstances under which a change
of provider is permitted.

2
More important, although typically posed as a simply dichotomy of employer versus
employee choice, workers’ compensation laws occasionally draw distinctions between employee
choice of a new provider as opposed to a provider who treated them previously. A recent example
of this comes from the 2004 workers’ compensation reforms in California (Senate Bill 899).
Previously in California, the employer had the right to select the initial provider unless the
employee had predesignated a provider, but after 30 days workers had the right to change to a
medical provider of their own choice. Under the most recent reforms, however, employers are
allowed to establish networks composed of both occupational and non-occupational physicians,
and the legislation grants to the employer (or the insurer) the sole right to decide which medical
providers are in the network. Furthermore, the right of workers to choose their physician after 30
days no longer applies if a network is established that complies with the law, unless the worker
has predesignated a physician under particular conditions, most importantly that the physician was
previously the worker’s primary provider of medical care under an employer-provided group
health plan.2 In general, as long as employers establish networks, which many are expected to do,
workers will have less scope to choose their physician. Most importantly, workers’ ability to seek
out a new physician after an injury will be curtailed most severely.
The purpose of this study is to determine whether who selects the provider, and the choice
of prior versus new providers when employees choose, affect measurable costs and outcomes in
workers’ compensation cases. The costs and outcomes we study include medical and indemnity
(income benefit) costs, the duration of time out of work, the likelihood that the worker had a
substantial return to employment, the worker’s own perception of the degree of recovery from the
work injury, and the worker’s overall satisfaction with the health care received. We use detailed
data on workers’ compensation claims coupled with interviews of workers. Workers (and
employers) exert some choice over who chose the provider; while state law dictates which party

3
has the right to choose the provider, in practice this right is not always exercised. As a
consequence, we pay particular attention to trying to sort out causal effects of variation in provider
choice from differences attributable to selection. In our view, the very rich data available for this
study permit us, by and large, to rule out endogenous selection as the source of our results.
II. Literature Review
In general, studies of the effects of provider choice on workers’ compensation outcomes
have reached mixed conclusions. Based on average annual changes in medical payments in
workers’ compensation cases in 41 states from 1965 to 1985, Boden and Fleischman (1989) found
little relationship at the state level between the state’s approach to provider choice and the rate of
medical cost growth. During the period in question eight states changed their laws – two switched
to employee choice and six switched to employer choice. Boden and Fleischman did not find
evidence that changing the method of choice was correlated with cost changes after the change
was made. Nor was there evidence that states that remained employer choice states over the 20
years studied tended to have lower rates of medical cost growth.
Subsequently, Victor and Fleischman (1990) employed multivariate methods and
concluded that the choice of provider does affect medical payments. Using data from state rating
bureaus and state funds (excluding self-insurers), they examined the impact of a change in
provider choice in Illinois (after 1975) and Texas (after 1973). They reported that medical
payments in Illinois rose 8-11 percent following a change to employee choice in the short run, and
19-49 percent when the full impact of the change was absorbed. In Texas, the short run effect was
4-6 percent, while the ultimate impact was estimated to be 7-29 percent. The authors emphasize
the tentative nature of these results, partly because they use aggregate (not claim level) data and
have a small sample, problems that the current study overcomes. In a later paper, Boden reports
that of eight states analyzed, costs might have been affected in three of them when the state’s

4
approach to choice of provider was changed, but that in five of the states there was “no evidence
that these changes triggered changes in medical payments” (Boden, 1992, p. 45).
Durbin and Appel (1991) studied average state medical payments in the years 1965 to
1984. Employing multivariate analysis, they reported that states with employer choice had 15
percent lower average medical payments in 1965, and that the difference widened to 36.5 percent
in 1984. Their results also suggested that physician choice has a greater impact on medical
payments than do fee schedules.
The most data-intensive study of the issue of provider choice was conducted by Pozzebon
(1994), whose findings differ from those of Durbin and Appel. She relied on data from almost
32,000 closed claims obtained from the National Council on Compensation Insurance (NCCI) for
17 states for the years 1979-1987. Using medical payments per claim as the dependent variable,
Pozzebon created four variables as her statutory choice measures: initial choice was limited;
changing the provider was limited; no limits placed on employee initial choice or on subsequent
changes; and both initial choice and subsequent choice were limited. She found that where the
employee’s initial choice was constrained “Restrictions on initial choice increase health costs in
workers’ compensation programs by 11-16 percent, a large and statistically significant effect …”
(Pozzebon, 1994, p. 161). Limits on changing the provider subsequent to the initial choice were
found to be correlated with higher medical payments also. However, she acknowledged that these
findings could result from higher costs leading to policies to limit change, rather than cost-
increasing effects of policies limiting choice. Pozzebon’s somewhat unexpected findings do not
seem attributable simply to the source of the data used. In a 1996 study, Durbin, et al., also used
NCCI data, and found that employer choice was associated with lower costs of medical benefits.
However, the sample in this latter study was more limited, including 1,300 claims each for four
states with 1987 as the injury year and closing dates between 1988 and 1992.
5
The only study of provider choice in workers’ compensation that uses rigorous
experimental methods was one that compared experimental and control groups where workers in
the former were treated in a managed care framework while workers in the latter group selected
their own provider in a traditional fee-for-service arrangement (Washington Department of Labor
and Industries and University of Washington Department of Health Services, 1997). Firms, and
not individual workers, were placed in the experimental or control group. The study tracked 1,354
injury cases with treatment in managed care and 1,708 cases from firms in the control group. For
our purposes, this study had one significant difficulty – namely, the differences between the
groups were more than solely who selected the provider. Among other differences was the
method of payment to the providers for either group. But the study was also an important
extension of earlier studies since the outcomes analyzed were more extensive than simply medical
payments per case.
The study found that workers in the managed care settings had medical payments that were
27-32 percent below those in the traditional employee choice fee-for-service model. The study
also compared rates of injured workers who received “time loss costs,” role functioning scores (a
self-reported measure of how well the individual was able to carry out activities related to personal
and social roles), and self-reported opinions on the progress of recovery and on overall outcomes.
Workers were surveyed both at six weeks and six months after their injury. Workers treated in the
managed care setting reported statistically significantly lower role functioning scores at six weeks
and at six months, and significantly lower rates of satisfaction with their treatment, their attending
physician, and their overall access to care at six weeks. However, at the six month interview,
statistically significant lower rates of satisfaction were found only with regard to overall access to
care. At six weeks and at six months workers in the managed care group reported less progress on
recovery and the difference was statistically significant. However, at six months the study found

6
no differences in the two groups with regard to pain, mental health status, or physical functioning.
This study points to the multiplicity of outcomes that warrant attention in studies of provider
choice.
What can we conclude from this review? First, while most studies appear to conclude that
employer choice is associated with lower medical payments, the findings are not unchallenged.
This should hardly be surprising, as the states and the years selected have varied, and the measures
of choice have tended to be crude. Additionally, very little work in relation to choice of provider
has focused on outcomes or cost measures other than medical payments – such as duration of time
out of work, indemnity benefits, physical recovery, and worker satisfaction with care. And rarely
have many other factors that likely affect outcomes such as worker and employer characteristics
been controlled for in these studies. Further, no study appears to have considered and analyzed the
significance of whether the injured employee had been treated previously by the provider who
gave primary care in the workers’ compensation claim. Finally, studies done even a few years
earlier were done when network arrangements were less common. Since employer-selected
providers are more likely to participate in such plans now than they did previously, the relevance
of some of those earlier studies may have diminished.
This literature review is helpful in highlighting the potential strengths of the present study.
First, we utilize data that are taken from employee interviews that asked workers to identify who
selected the health care provider. This is critical, since studies by Lewis (1992), Barth and Victor
(2003), and Victor, et al. (2003) have shown that there are many instances where employees
actually choose the provider in employer choice states, and where the employer selects the
provider in states categorized as employee choice.3 Analyzing the outcomes of cases on the basis
of who actually chose the provider, and not simply whether there was an employee or employer
choice state law, is more informative about the impact of provider choice. Second, we linked the

7
interview data to claims data supplied by the claims payors, providing information on factors such
as medical and indemnity costs, medical treatments, employer attributes, etc. A more complete
picture of the claim from the vantage of both the worker and the employer should help to better
establish the consequences of provider choice. And third, a potentially important and unique
feature of this study is that the interview also indicated whether the primary provider had
previously treated the worker for an unrelated condition. We suspected that a previous provider-
patient relationship might affect some of the outcomes that we measured – and as noted above,
recent state-level policy changes recognize this difference – and the data therefore allow us to test
this hypothesis.
III. Data and Descriptive Information
Data Source and Variable Descriptions
One key data source used in this paper is the WCRI Detailed Benchmark/Evaluation
(DBE) database, which contains over 16 million workers’ compensation claims with
representative data in at least a dozen large states. These data come from claims payors – insurers
and self-insured employers. We extracted information about the worker, employer, injury, and
costs of each case in the study from the WCRI DBE database. The second key data source comes
from telephone interviews conducted on behalf of WCRI by the Center for Survey Research and
Analysis at the University of Connecticut as part of a study to compare worker outcomes in
California, Massachusetts, Pennsylvania, and Texas, for a subset of cases drawn from the WCRI
DBE database. Approximately 750 interviews were completed in 2002 and 2003 in each state
with workers who had experienced more than seven days of lost time from work, approximately
3.5 years after the injuries.4 The telephone interviews supplement the claims data with
information on choice of provider, as well as satisfaction with health care, worker and employer
characteristics, return to work, and self-reported information on health status from which we
8
derive measures of severity of injury and recovery of physical health. Victor, et al. (2003) fully
describe the data, the survey, response rates, and representativeness.
Table 1 lists the key variables used in the present study, including the dependent variables
for our analyses, the characterization of provider choice, and injury and treatment characteristics.
Other variables used as controls in our regression models are noted later; most are quite standard.5
Some of these variables merit discussion.
Provider Choice
To classify workers by choice of provider, we first need to identify the primary provider.
Some workers received care at the workplace, in an ambulance, or at a hospital emergency room.
Because provider choice is not an issue in these cases, these workers were excluded from the study
unless they received subsequent treatment from a provider outside of the work place or emergency
room. In contrast, we included those who received initial treatment at a medical doctor’s or
chiropractor’s office, clinic, hospital, etc. The central focus of this study is on the choice of the
primary provider – according to the worker, the one that made the decisions about the care that the
worker needed and either provided that care or directed the worker to someone who could provide
it. The respondents were asked about the number of providers who treated them. Where there
was only a single, non-emergency provider (about 20 percent of cases), the initial provider was
necessarily the primary provider. The remainder of workers received care from more than one
provider. For these workers, the primary provider was also the worker’s initial provider in about
60 percent of cases, according to the worker, and was a different provider in about 40 percent of
cases.6
Next, focusing on the primary provider, if the worker said that the provider was selected by
self, a family member or friend, or the worker’s attorney, we regarded this as “employee choice.”7
If the worker said that the provider was selected by the employer or insurer, we categorized this as

9
“employer choice.” If a medical center, medical provider, or “someone else” was seen by the
worker to have chosen the provider, we excluded the case from this study because it was
ambiguous whether the worker or employer selected the referring medical center or medical
provider. The distributions of these choices for the four states combined and each state separately
are displayed in Table 2.8
The numbers in Table 2 indicate that employee choice was more prevalent in Texas and
Massachusetts. This is sensible because in these two states the law in effect at the time of the
study gave the worker the choice of initial provider and relatively free reign to change providers,
whereas in California and Pennsylvania the law allowed the employer to designate the provider for
the first 30 days and 90 days respectively, after which the worker could change providers.9 But as
noted earlier, the policy “regime” does not fully determine choice, as there are many cases in
Texas and Massachusetts where employers chose the provider, and conversely many cases in
California and Pennsylvania where the employee chose. Table 2 also shows the sample size
available for the empirical analysis, namely the 1,960 cases classified as either employee or
employer choice.
When workers chose the primary provider, we also asked if the provider had previously
treated the worker for a different condition. If so, the provider was defined as a prior provider,
and if the provider had not previously treated the worker for a different condition, we labeled that
provider as a new provider. This breakdown is also shown in Table 2.10 Among those cases
where the workers chose the primary provider, they selected a prior provider about half of the time
in California, Massachusetts, and Pennsylvania, but only about one-third of the time in Texas. We
suspect that the difference for Texas arises because injured workers who are not covered by health
insurance are less likely to have established relationships with health care providers. We do not
know from our survey whether injured workers had health insurance coverage, but the population

10
in Texas is much less likely to have health insurance coverage than are persons in the other three
states.11 Finally, although not central to our analysis, we note that regardless of who chose the
provider, for the vast majority of workers (over 85 percent in each state) a physician was their
primary provider, with chiropractors as the next most common type of provider.
Cost and Outcome Measures
We study most of the key outcomes of workplace injuries that should be of interest to
policymakers: costs, return to work, and recovery of physical health, as well as satisfaction with
care. The two cost measures that we study are indemnity benefits and medical payments per
claim. Both measures are derived from payors’ records about what payments were actually made
as of 29 to 31 months after the injury. The WCRI DBE database standardizes definitions of these
measures across payors and across states. The first two rows of Table 3 show average indemnity
benefit payments and medical payments per claim for each state.
We also study whether the worker returned to work for at least one continuous month at
any time between the injury and the interview, which we call a “substantial return to work.” In
addition, we measure the duration of time out of work, as reported by the worker as of the date of
interview – approximately 3 to 3.5 years post-injury. Recall that all cases sampled had more than
seven days of lost time. The third and fourth rows of Table 3 show the percent who did not report
a substantial return to work, and the mean and median durations of time out of work.
An important outcome is the extent to which the worker recovered his or her physical
health after the injury. The measure used is derived from worker responses to the SF-12® survey –
which, along with the longer SF-36®, is the most widely-used instrument for measuring general
health status. In the interview, we asked workers to recall their health status at three points in time
– the month prior to the injury, the week after the injury, and the month prior to the interview.
The recovery variable is the difference between the worker’s self-reported health status after the

11
injury and the same measure at the time of interview.12 Because this measure is based on workers’
perceptions, we often refer to this variable as “perceived recovery.”13 The focus is on physical
health, not mental health. Because the SF-12® scores for physical health are quite insensitive to
even extreme variations in the mental health scores, we compute the physical health scores
holding the mental health scores constant.14 The fifth row of Table 3 shows the means for the
recovery measure; health status is coded on a scale of 0 to 100.
Our final outcome variable is overall satisfaction with care. The variable used in this study
is based on the specific question “Now think about all of the medical care you received from the
first treatment for your injury until now. Were you satisfied or dissatisfied with the medical care
you received overall?” The final four rows of Table 3 show the distribution of responses.
IV. Empirical Methods Basic Framework
The analysis is based on a standard regression-type model for a cost or outcome variable
generically denoted Yis, where ‘i’ indexes individuals and ‘s’ states, of the form:
(1) Yis = � + CHOICEis� + WORKERis� + FIRMis� + INJURYis� + STATEs�
+ TREATMENTis� + �is.
Our dependent variables come in different forms – continuous (for example, the cost
measures), dichotomous (for example, substantial return to work), and polytomous (satisfaction) –
necessitating different statistical methods, as discussed below. The provider choice variables,
which may be one dummy variable corresponding to the two-way classification, or two dummy
variables corresponding to the three-way classification, are included in the vector CHOICE. In
any model of workers’ compensation costs or outcomes, it is essential to include characteristics of
workers (WORKER) and the workplace (FIRM), as both have been shown to affect costs or
outcomes. For example, older workers have been found to be less likely to return to work;

12
workers with less education may have greater difficulty in the labor market; and workers in some
industries (such as construction) may have unique return-to-work problems (for example, Galizzi
and Boden, 1996). The list of variables included in WORKER includes demographics, education,
wages and whether the individual was an hourly worker, tenure at the time of injury, and whether
the worker elected to have the interview conducted in Spanish. Workplace characteristics include
firm size and the industry/occupation breakdown discussed earlier.
We would expect costs, return to work, recovery, and satisfaction to depend in important
ways on the characteristics of the injury, of which we have alternative measures. The first is a
classification of injury type, based on the diagnostic (ICD-9) codes assigned by the providers,
including: back pain; non-back sprain or strain; fracture; inflammation, laceration, or contusion;
and a residual category of other injuries.15 A second measure captures the worker’s perceived
injury severity. This measure is constructed from the worker’s answers to the SF-12® instrument,
paralleling what we did for the measures of perceived recovery (as discussed earlier).
The inclusion of the worker, workplace, and injury characteristics in a model of how
provider choice affects outcomes is unambiguous, as these variables may be associated with both
provider choice and the costs and outcomes we study, but not for reasons underlying causal
relationships between provider choice and outcomes. For example, older males may have worse
medical outcomes because age inhibits recovery. Yet older males may also – because of greater
affluence, access to health insurance, and possibly even previous injuries – be most likely to have
chosen a primary provider whom they have seen previously. In this case, without controlling for
age and sex we might incorrectly infer that choice of a prior provider resulted in or caused worse
medical outcomes. Similarly, more severe injuries may make it more likely, at least in some
states, that the employee chose the provider; for example, in California, during the sample period

13
we use, the employee had the right to choose a physician 30 days after first receiving treatment,
and more severe injuries are more likely to pass the 30-day window.
Finally, as noted earlier our data come from four states – Texas, Massachusetts,
Pennsylvania, and California – across which workers’ compensation systems vary. As examples,
these states differ on matters such as the frequency and sources of disputes, the methods used to
terminate temporary disability benefits, the criteria used to rate permanent disability benefits, the
use of networks to provide medical care, and so on. Given these facts, if we use across-state
variation in choice and outcomes to identify � in equation (1), we may incorrectly attribute
differences in outcomes associated with other features of states’ workers’ compensation systems to
variation in individual choice of provider. Consequently, we report all specifications including
dummy variables for the states (STATE), in which case the effects of provider choice are
identified solely from within-state differences associated with this choice. The potential downside
of this is that we effectively throw out the variation in provider choice that is driven by differences
in state workers’ compensation systems, which is plausibly the most exogenous source of
variation in provider choice. We examined estimates both excluding and including the state
dummy variables, to see whether we find results that are robust to this specification choice and
therefore can draw firmer conclusions. In general, we found that results including or excluding
the state dummy variables were similar. 16 Because we think it most important to control for
omitted variation in state workers’ compensation systems, we report and focus on estimates based
on specifications including the state dummy variables.17
Statistical Models for Different Types of Dependent Variables
For the three cost and outcome variables that are continuous (indemnity benefits, medical
payments, and recovery of physical health), equation (1) is estimated as a linear regression. We

14
transform the estimated coefficients to report the results in terms of the implied percentage change
in the dependent variable.
The return-to-work outcome is dichotomous, and we estimate a logit model, assuming that
the cumulative distribution for �is is the logistic. Using Zis as a short-hand for the parameters and
variables in equation (1), the logit model implies that the odds ratio is
(2) P(Yis = 1)/P(Yis = 0) = exp(Zis), which in turn implies that exp(k) – where k is the coefficient on a particular variable Zk in Z –
measures the multiplicative effect on the relative probability P(Yis = 1)/P(Yis = 0) of a one-unit
increase in Zk. We report the implied percentage change in the odds ratio associated with each Zk.
The model for the duration of time out of work is estimated using survival methods, to
account for the possible truncation of the spell of time out of work. In this framework, the
outcome measure is Tis, the length of the spell of time out of work. We estimate an accelerated
failure time model, in which
(3) Tis = exp(Zis + �is).
As is common in these models, we fix the variance of � at one, and allow to be a
parameter that is estimated. In this setting, we build the likelihood function for two types of
observations. For the uncensored observations, we have an expression for the probability of
observing a spell of length Tis, or f(Tis). For the censored observations, all we know is that the
spell of time out of work lasts at least as long as tis. The probability of this event is one minus the
cumulative distribution function for tis, or the survivor function for tis, which we denote S(tis). The
density and survival function are related through the hazard function h(tis) = f(tis)/S(tis). All that
remains is to specify a distribution for � in equation (3). We assume a logistic distribution for � (a
log-logistic distribution for Tis), in which case the survivor function is
(4) S(tis) = 1/[1+ {exp(−Zis)tis}1/].18

15
A nice feature of the log-logistic distribution is that an expression very similar to that for
the logit model results, specifically
(5) S(tis)/{1- S(tis)} = exp[Zis(/) − (1/)ln(tis)], which implies that exp(k/), computed from the coefficient on a particular variable Zk in Z,
measures the effect of a one-unit increase in Zk on the ratio of the probabilities of the spell lasting
at least as long as any time t.19 This parallels the earlier interpretations of the parameters for the
logit and multinomial logit models. However, it is also the case that exp(k/) equals the ratio of
the expected duration when the corresponding variable Zk is one unit higher to when it is not, and
therefore 100�(exp(k/) − 1) measures the percentage by which the expected duration is longer
with this change in Zk. We report these percentages in the table.20
Finally, the satisfaction outcome is also discrete, but takes on four ordered values: very
satisfied, somewhat satisfied, somewhat dissatisfied, and very dissatisfied. To study this outcome,
an ordered discrete choice model is used. In this model, Y*is denotes the unobserved continuous
measure of satisfaction, which follows the model Y*is = Zis + �is. The individual responds with
the lowest category, Yis = 1, if Y*is < �1, the next category, Yis = 2, if �1 Y*
is < �2, etc., and the
highest category, Yis = 4, if �3 Y*is, with �1 < �2 < �3 (the �’s are unknown parameters to be
estimated). Assuming again that the cumulative distribution function of � is logistic, then the
probability of each of these outcomes can clearly be written as a function of the same expressions
used in the logit model. For example, we have
(6) P(Yis = 1) = P(Y*is < �1) = 1/[1 + exp(Zis − �1)],
and (7) P(Yis = 2) = P(Y*
is < �2) − P(Y*is < �1) = {1/[1 + exp(Zis − �2)]}
− {1/[1 + exp(Zis − �1)]}.

16
In this way the probability of each response can be written, and the likelihood function
constructed. Note that in this case the relative probability of the response being in any category
j+1 or higher relative to j is
(8) P(Yis � j+1))/P(Yis = j) = exp(Zis − �j), so that, paralleling the logit model, exp(k) measures the effect of a one-unit increase in Zk on the
log of the relative probability P(Yis � j+1))/P(Yis = j), or the relative probability of reporting a
higher level of satisfaction. We report these effects as the implied percentage change in the
likelihood of reporting a higher level of satisfaction.
Equality of Effects of Provider Choice Across States
One issue is whether we can combine or “pool” the data across the four states to obtain the
most precise estimates of the impact of provider choice. Given that we have only about 400-550
observations per state, this pooling is highly desirable. But it could be inappropriate and lead to
biased estimates if the effects of provider choice on the outcomes we study vary significantly
across states. We tested for this and did not find evidence against the restrictions implied in
combining the data and estimating a common set of effects of provider choice. Specifically, for
each analysis we conduct we also tested for differences in the parameters describing the effects of
provider choice, as well as the coefficients of the other variables in the model. We did this by
interacting each of these variables with the state dummy variables, estimating these full models,
and then separately testing the constraints that the provider choice coefficients were the same
across states, and that the other coefficients were the same across states. We never rejected the
first set of restrictions; we sometimes rejected the latter, but verified that the provider choice
estimates were insensitive to allowing the effects of the other control variables to differ across
states.21 We therefore report pooled estimates in the tables that follow.

17
Causal Inferences Regarding Provider Choice
Because workers are not randomly assigned to provider choice categories, we have to be
cautious in drawing causal inferences about the effects of provider choice, which would in turn
potentially be informative about the effects of policy changes regarding provider choice. In
particular, we have to be concerned that there are characteristics of workers associated with both
provider choice and with workers’ compensation outcomes that could result in misleading
inferences about the effects of provider choice. As one concrete example, suppose that the most
severe injuries tend to result in workers ending up with a new provider, chosen by them, as their
primary provider. This might occur because in search of recoveries from the most severe injuries
workers are motivated to seek out particular providers (such as specialists), who they subsequently
report as their primary provider. In this scenario, comparisons of outcomes such as costs and time
away from work between these workers and workers for whom the employer chose the provider
would tend to indicate that for the former group costs were higher and return-to-work outcomes
worse. We might then be led to the incorrect conclusion that worker choice of a new provider
causes higher costs and worse return to work, when instead the relationship arises only because
the most severely injured workers selected into the employee choice/new provider group.
We address this potential problem in a few ways. Most important, the rich data we have
enable us to include controls for numerous detailed characteristics of workers, workplace
characteristics, and injury characteristics, including injury severity. Indeed, we would argue that
the data used in this report yield far more detailed sets of control variables than are available in
data used in past research.
Second, in Table 4 we report estimates of models for provider choice, to explore which
variables are in fact associated with choice. We report odds ratios for the employee choice options
relative to employer choice. A coefficient estimate greater than one, when statistically

18
significantly different from one, implies that the variable associated with that coefficient boosts
the likelihood of employee choice. We do not show the estimated coefficients for all of the
variables, but only for those related to the injury (type, severity, treatment, and attorney
involvement). It turns out that quite a few variables are significantly related to provider choice –
which would not be the case with random assignment of choice. Most significantly, certain types
of injuries, especially back injuries, are significantly more likely to be associated with employee
choice of provider than is the reference category of inflammation, laceration, or contusion. On the
other hand, perceived severity is not associated with a higher likelihood of employee choice of
provider, although because the model includes such variables as type of injury, what is captured
by the estimated coefficient of severity is the association of severity with provider choice for the
same type of injury. Note also that major surgery is significantly positively associated with
employee choice, although as discussed more below, surgery could be more of an outcome of
employee choice rather than a measure of seriousness of the injury.
The estimates in Table 4 certainly indicate that the assignment of workers and their injuries
to provider choice regimes is not random, which is no surprise. What the estimates cannot tell us,
however, is whether the inclusion of the control variables listed in Table 4 in our models for
workers’ compensation costs and outcomes capture enough of the variation in other determinants
of these costs and outcomes that we are confident that the regression models capture the causal
effects of provider choice, or instead whether there is still residual unmeasured variation in
severity of injury or other factors that is related to provider choice. However, the fact that greater
severity is not independently associated with a higher likelihood of employee choice makes it
more plausible that we are estimating causal effects of provider choice.
Our third approach to obtaining estimates that provide evidence on the causal effects of
provider choice involves including additional control variables related to severity. In particular,

19
the claims database includes information on the treatment of the injury, including whether the
treatment included an overnight hospitalization and major surgery; these are captured in the
variable TREATMENT in equation (1) above. These potential control variables present a double-
edged sword. On the plus side, they are likely to capture additional variation in the severity of the
injury that is not picked up in the other variables that capture nature and severity of injury. For
example, some fractures, even if viewed by the respondent as entailing the same severity, may
result in overnight hospitalization for reasons related to the injury, and therefore we would expect
higher medical payments. On the minus side, the treatment variables may also reflect outcomes of
the medical decision-making process, and hence to some extent directly reflect the choice of
provider. Because the treatment variables in part capture costs and outcomes, their inclusion may
amount to “over-controlling” for injury severity.22 That is, they may capture not only remaining
differences in severity, but also outcomes of provider choice that we more appropriately want to
think about as effects of provider choice, but will not capture when the treatment variables are
included.
Under this interpretation, excluding the treatment variables runs the risk of having
unmeasured heterogeneity in injury severity, which if associated with provider choice may lead to
choice-related differences in costs and outcomes that are too large, while including the treatment
variables is likely to generate estimates that understate the differences associated with provider
choice. As a consequence, we present both sets of estimates to assess for which outcomes the
resulting range of estimates is sufficiently tight to be informative about the effects of provider
choice. And where the estimates differ, readers more concerned that our injury and severity
measures leave potentially important differences in severity unmeasured may be more inclined to
emphasize the estimates including the treatment variables, and vice versa.

20
Finally, a fourth approach we take to the problem of unmeasured severity is to assess how
sensitive the estimates are to omitting from the model variables measuring severity or the nature of
the injury. If the estimates are not very sensitive, this suggests that additional unmeasured
variation in severity when these variables are included cannot play much of a role.
Of course, even with all of these efforts, we cannot definitively rule out the possibility that
even with the treatment variables included, there is unmeasured variation in injury severity that
may affect, for example, costs or return to work. The implication of this is that, ultimately, we
cannot arrive at an absolutely definitive answer regarding the causal effects of provider choice
from these data, because, at its core, this is a question about differences between workers that we
cannot measure, in contrast to those we can measure. But in our view, the extensive set of control
variables that we have, coupled with the findings from the various analyses just described that
tend to reinforce the results, make us reasonably confident that we are identifying causal effects of
provider choice. This means that it is appropriate to think of our estimates as indicating what
would happen if policies regarding provider choice were changed, for example, to restrict
employee choice. We believe this is particularly true of the specifications that we regard as likely
over-controlling for injury characteristics by including the hospitalization and surgery variables.
At the same time, we recognize that our evidence falls short of experimental standards, which of
course leaves open the possibility that experimental evidence could lead to different conclusions.
V. Provider Choice and Workers’ Compensation Outcomes Employee versus Employer Choice
We begin by following the literature and looking at the most common way of
characterizing provider choice – employee choice compared to employer choice. The results are
reported in Table 5, for each of the six dependent variables we study. In each case, we first report
the results for the model that may under-control for severity by excluding the treatment variables

21
(“Model 1”), and then for the model that likely over-controls for severity by including them
(“Model 2”).
As shown in Table 5, when employees chose the primary provider, medical payments were
10-21 percent higher. Not surprisingly, the estimated differential is higher for the specification
excluding the treatment variables, but the estimate is statistically significant at the 10-percent level
(or better) in both cases.23 The results for indemnity costs also suggest higher costs when workers
choose the provider, although in this case the evidence is weaker. In particular, the estimates from
the model excluding the hospitalization and surgery controls indicate that indemnity benefits were
15 percent higher when workers chose the provider, while the difference falls by nearly half and
becomes statistically insignificant when these treatment variables are included.
The results for the next two dependent variables – duration of time away from work and an
indicator of substantial return to work – consistently indicate that employee choice of provider is
associated with slower return to work. Reported time from injury until initial substantial return to
employment was 23-32 percent longer where the employee chose, and the results are statistically
significant at the 5-percent level for both specifications. Substantial return to work was 16-19
percent less likely in the three years after the injury when the employee chose; the estimates are
similar with or without the treatment controls, although only marginally significant. For the
return-to-work outcomes the range of estimates for models 1 and 2 is relatively tight, and the
statistical significance of the results is no weaker including the hospitalization and surgery
controls, bolstering our confidence in these results and in a causal interpretation of the effect of
provider choice.
Interestingly, despite the differences in costs and time out of work, there was no difference
in the perceived recovery of physical health between workers who selected the provider and
workers where the employer selected the provider, as any estimated differences in recovery are

22
trivially small (0 to 1 percent) and not statistically significant. On the other hand, we find that
workers who chose their providers were much more likely to be more satisfied with their overall
medical care, with nearly 60 percent higher odds of reporting a higher level of satisfaction, for
both specifications. These last two findings may appear to be contradictory. Below, we discuss
possible reasons why we find higher levels of satisfaction with health care where workers select
the provider despite no difference in perceived recovery, and attempt to untangle the question of
whether the higher satisfaction reflects other dimensions of the quality of medical care.
Employee Choice of Prior Provider, Employee Choice of New Provider, and Employer Choice
We next turn to the three-way classification of provider choice that distinguishes between
employee choice cases where the worker selected as primary provider a “prior provider” –
someone who treated the person prior to the injury for an unrelated condition – and cases where
the worker selected as primary provider a “new provider” – someone who had not previously
treated the worker. Both are compared to employer choice cases, and to each other. As noted
earlier, these results are informative regarding implications of recent public policy changes, such
as California’s recent workers’ compensation reforms (SB 899, passed in April, 2004) that restrict
workers’ ability to choose a new provider.
The results are reported in Table 6. We begin with the estimates in the first row, which
measure differences in outcomes for employee choice of a prior provider relative to employer
choice. With regard to medical benefits, we find that when the employee chose a prior provider,
payments were significantly higher when the treatment variables are excluded (22 percent), but
that the estimate falls by two-thirds and becomes statistically insignificant when the treatment
controls are included. The estimated differences in indemnity benefits are small and statistically
insignificant in either case.

23
The next two specifications examine the two return-to-work outcomes. Here, paralleling
the evidence for medical and indemnity benefits, there is no consistent evidence of differences
between employee choice of a prior provider and employer choice, especially when the treatment
controls are included. When we look at differences in physical recovery, we again find no
difference associated with this particular form of employee choice. But we find considerably
higher satisfaction – on the order of 90 percent.
The results are substantively different when we look at the differences in outcomes
associated with employee choice of a new provider versus employer choice, as reported in the
second row of Table 6. The estimates for medical benefits indicate that these payments were 12-
20 percent higher when the employee chose a new provider, with both estimates statistically
significant at the 10-percent level (or better) whether or not the treatment variables are included.
Indemnity benefits are also estimated to be higher – by 15-20 percent – when employees choose a
new provider, although the smaller estimate when the treatment variables are included is only
marginally significant.
With respect to return to work, the evidence consistently indicates a lower rate of any
substantial return to work and longer durations of time out of work when employees chose a new
provider. The estimates indicate that durations were 40-48 percent longer, and that the likelihood
of a substantial return to work was 28 percent lower, and all of these differences are statistically
significant at the 5-percent level. In contrast to these differences in the findings when the
employee chose a new provider, we again find no difference in physical recovery associated with
this type of employee choice, but we still find higher satisfaction with the health care received. As
noted earlier, we return, below, to the issue of interpreting the higher satisfaction with medical
care in light of no evidence of differences in perceived physical recovery.
24
The results discussed thus far suggest that the findings in Table 5 regarding higher costs
and worse return to work associated with employee choice overall are driven, in large part, by
employee choice of a new provider. That is, there are potentially important differences in the
costs and outcomes of cases where the worker selected a prior provider compared with selecting a
new provider. The third row of Table 6 provides more evidence on the differences between the
effects of employee choice of a prior versus a new provider. Specifically, it shows the differences
in costs and outcomes between when the worker selects a prior versus a new primary provider –
reporting the impact of the employee choosing a new provider compared to the employee choosing
a prior provider – and indicates which differences are statistically significant.24 This is important
because if the differences associated with the two types of employee choice are not significantly
different from each other, then arguably our best estimates come from the simpler models covered
in Table 5 that do not distinguish by type of employee choice.
The estimates indicate that the sharpest differences between the two types of employee
choice are for return to work. Employee choice of a new provider is associated with significantly
poorer return-to-work outcomes, with the odds of having a substantial return to work 26-30
percent lower, and the duration of time out of work 26-30 percent longer; all of these are
significant at the 10-percent level, and three of the four at the 5-percent level. There is little
difference in medical payments, but indemnity benefits are 11-16 percent higher when the
employee selects a new provider. The latter difference is at best weakly statistically significant,
but at least the point estimate is in the direction we would expect given the worse return to work
associated with employee choice of a new provider. Finally, satisfaction is lower when the worker
selects a new provider compared to a prior provider, yet as we have found throughout, choice is
unrelated to physical recovery.

25
Finally, as discussed earlier, there is a question whether the estimates just presented reflect
only provider choice, or instead also reflect unmeasured residual variation in injury severity that is
associated with provider choice. We noted that, especially in the models that control for
treatment, we are more confident that the estimates reflect causal effects of provider choice.
However, as a way of shedding more light on this question, Table 7 reports results in which, in a
sense, we go in the opposite direction to what we did when we added the treatment variables. In
particular, we instead begin with the model 1 estimates, and then successively drop the perceived
severity variable, and then drop the “type of injury” variables as well. If unmeasured injury
severity accounted for large shares of the apparent effects of provider choice on workers’
compensation outcomes, then when we drop the perceived severity measure the effects of provider
choice should appear even larger.
However, as indicated in the third and fourth rows (the first two rows repeat the findings
for model 1 from Table 6), the estimated effects of employee choice of either a prior or a new
provider, relative to employer choice, scarcely change upon omitting the perceived severity
variable, casting doubt on an important role for unmeasured severity. Taking this one step further,
in the last two rows of the table we even drop the injury type variables, which surely capture
information on the nature and seriousness of the injury. Here, especially for choice of a new
provider, the estimated effects on costs and return to work grow (in absolute value), but only
slightly. In our view the modest changes that ensue when we drop measures related to injury
severity indicate that it is unlikely that unmeasured injury severity materially distorts the estimated
effects of provider choice that we find, bolstering a causal interpretation of our findings.25

26
VI. Employee Choice and Worker Satisfaction with Health Care
Why Might Satisfaction Appear Higher but Perceived Physical Recovery No Better with
Employee Choice?
One consistent finding thus far is that worker satisfaction with the overall health care they
received was higher when the worker chose the primary provider (and more so for the choice of a
prior provider), despite the evidence that employee choice is not associated with better physical
recovery as reported by the worker. In this subsection we explore alternative explanations of this
finding. Specifically, we examine three conjectures.
Better care. One conjecture is that the higher satisfaction with employee-selected
providers actually reflects independent information about better medical outcomes beyond what is
captured by the physical recovery measure. One possibility is that employee-selected providers
achieve better physical recoveries for their patients, presumably in ways not captured in the
physical recovery measure we use, and as a result the higher satisfaction associated with employee
choice does reflect better medical outcomes. Alternatively, employer-selected providers may tend
to rush workers back to work prematurely, presumably in part because their interests are more
closely aligned with those of employers. The likely mechanism in this case would be that physical
recovery from the injury is as good when employers choose the provider, but being rushed back to
work leads to more difficulties subsequently and hence lower satisfaction. This conjecture is
significant from a policy perspective because, if true, it would suggest that direct costs associated
with employee choice are higher, but – in contrast to the implications of the results based on
physical recovery – medical outcomes are also better. In such a case employee choice would offer
some real, tangible benefits as well as higher costs, making it difficult to assess policies that
restrict employee choice.

27
Patient advocacy. A second conjecture is that employee-selected providers help workers
engage in behavior that unnecessarily extends time away from work. Specifically, after an injury
some workers may prefer not to go back to work, or may prefer to delay their return to work
beyond the time that they may be physically able to return. Such preferences on the part of
workers would be perfectly consistent with the typical assumption in economic models that there
is some disutility from work, so that for some workers staying away from work and collecting
indemnity benefits – even if lower than what they would earn on the job – is preferable. Worker-
selected providers, again because their interests are less aligned with those of employers, may be
more willing to support workers’ efforts to delay returning to work, and as a consequence workers
might be more satisfied with such care even if physical recovery is no better. This case would
point in the opposite direction as regards policy, since under this interpretation policymakers
would presumably put greater weight on the consequences of provider choice for physical
recovery, and perhaps be justified in discounting the evidence of higher satisfaction associated
with employee choice.
Intangibles of medical care. The final conjecture pertains to aspects of the medical care
that may be important to workers, yet have little impact on physical recovery. First, workers may
have expectations about the processes of care (for example, speed of time to first visit, time spent
with provider, or bedside manner), and employee-selected providers may be more likely to meet
those expectations, regardless of physical recovery. Second, there may be an “empowerment
effect” experienced by some workers who select their own provider which, by itself, leads to
higher levels of satisfaction regardless of physical recovery. And finally, workers may suspect
that employer-selected providers are more concerned with satisfying the needs of the employer
than of the worker. Such a suspicion could result in a lower degree of trust, and hence influence
satisfaction with the treatment, even if recovery is not affected.
28
Evidence
There are two variables in the data set, which have not been discussed so far, that can help
explore the first two conjectures offered above. The first concerns whether there was a second
absence from work (for those who had a substantial return to work) attributable to the original
injury; the second concerns the worker’s perception regarding whether he or she was sent back to
work “too soon” (again, for those who had a substantial return to work). Both of these variables
could reflect variation in medical outcomes that could, in principle at least, vary independently of
reported physical recovery. In addition, the response regarding whether the worker was sent back
to work too soon could be informative about the “patient-advocacy” conjecture, which would
predict that employer-selected providers are more likely to return workers too soon, at least as
perceived by the worker.
To begin, we verify that workers’ expressed satisfaction with their medical care is
associated with these two variables in the manner we would expect if the variables are to provide
information about the first two conjectures explaining why employee choice of provider is
associated with higher satisfaction. As reported in Table 8, workers are considerably more likely
to report higher satisfaction when there is no second absence associated with the injury than when
there is. In addition, workers express much higher satisfaction when, in their view, their return to
work was at the right time, rather than too soon. Thus, in principle, if these outcomes are to some
extent independent of physical recovery, they could explain higher worker satisfaction. The
interpretation regarding return to work is ambiguous, however, as it could reflect better medical
treatment, or cooperation of employee-selected providers in malfeasance.
In Table 9, we turn to evidence on these two conjectures, by estimating models –
paralleling those in Tables 5 and 6 – which measure the relationships between provider choice and
both second absences and perceptions of the timing of return to work. As seen in the first two

29
columns of Table 9, there is no statistical relationship between provider choice and a second
absence. Workers who chose the provider – in general, or whether prior or new – were equally
likely to have a second absence as workers for whom the employer chose the provider. This
makes it unlikely that the large impact of employee choice on satisfaction is due to employer-
selected providers returning workers to work prematurely, leading to these workers suffering a
second absence.
Similarly, the estimates in the third and fourth columns of Table 9 indicate that there is no
relationship between provider choice and a perception of having returned to work too soon. Most
important, employee choice – in general, or whether of a prior or new provider – is not associated
with a higher likelihood of having returned to work at the right time, versus too soon. Thus,
whether a more preferable timing of return to work, from the employee’s perspective, reflects
better care or patient advocacy, the estimates provide no evidence to suggest that either one of
these channels can explain the higher satisfaction workers express when they chose the provider.
Overall, then, we find no evidence consistent with the conjecture that the higher
satisfaction associated with employee choice of provider, coupled with no difference in physical
recovery, is attributable to better medical care by employee-chosen providers along dimensions
not captured by the physical recovery measure, or by patient advocacy in returning to work that is
abetted by these providers. We cannot, however, rule out conjectures associated with intangibles
of medical care, related to factors such as the manner in which care was delivered, empowerment
of the worker, or trust, rather than more objective medical outcomes.
VII. Conclusions and Discussion
Over the past several decades, public policy changes in workers’ compensation placed
more restrictions on the ability of workers to choose their own medical provider. For example,
during the period of rising costs of the late 1980s and early 1990s, a number of states modified

30
“employee choice” laws to require that workers select providers from within approved networks of
providers created by the employer. And an important cost-containment provision of the 2004
California workers’ compensation reforms was to require workers to select providers from
employer-selected networks of providers, unless the workers predesignate a provider who
previously treated them under a qualifying employer-sponsored group health plan. In this paper,
we provide estimates of the effects of provider choice on a variety of workers’ compensation
outcomes, including medical and indemnity costs, return to work, physical recovery, and worker
satisfaction with medical care. Our study differs from previous work in terms of the richness of
the data, the ability to look at outcomes beyond medical costs, our focus on the primary provider,
and providing evidence not simply on employee versus employer choice, but also on the employee
choice of prior versus new providers, which has some parallel to the most recent policy changes.
The results can be summarized relatively succinctly. When we look at the simple two-way
classification of employee versus employer choice, we find evidence that costs are generally
higher and return-to-work outcomes poorer when workers selected the provider, despite workers
reporting similar recovery of physical health. However, workers choosing their provider report
higher satisfaction with overall care. When we further subdivide employee choice into choice of
new versus prior providers, we find that the adverse cost and return-to-work outcomes are largely
associated with employee choice of new providers. These findings suggest that public policies
and private practices that encourage employer choice of provider may lower costs of workers’
compensation without adversely affecting recovery of health, but with reduced worker satisfaction
with care. Of course, these results are for cases “on average,” and any system needs monitoring to
detect and deter cases in which employers take advantage of workers at the expense of their
medical care or other workers’ compensation outcomes.

31
We are cognizant of the possibility that endogenous selection into different categories of
provider choice could generate some of these findings. However, the richness of the data with
respect to capturing characteristics of injuries and their severity, and a number of sensitivity
analyses, make us relatively confident that our findings by and large reflect causal effects of
provider choice.
We also explore why employee choice (overall, and of new or prior providers) is not
associated with better medical outcomes as measured by workers’ perceived physical recovery,
but is associated with higher worker satisfaction with medical care received. We consider the
possibility that higher satisfaction reflects better medical outcomes that are not reflected in the
physical recovery measure, but by and large rule this out. We also consider the possibility that
higher satisfaction reflects employee-selected providers cooperating in some workers’ desires to
stay out of work longer following a compensable injury, and rule this out as well. We are left to
conclude that the most likely explanation of the higher satisfaction with employee choice – despite
no better physical recovery – reflects intangibles of medical care such as trust, empowerment, or
simple manner of care delivery. At the same time, we do not want to suggest that these intangible
characteristics of medical care should necessarily be disregarded by policymakers weighing the
costs and benefits of alternative laws regarding provider choice, especially if future research can
draw links between these intangible characteristics of medical care and improved
medical outcomes.
There are, naturally, some qualifications to these findings. First, only four states are
included in our sample, and a wider set of states could add information that reinforces the
findings, or that is less consistent with them. Second, the focus of this study has been on who
actually chose the (primary) provider in specific cases, rather than the impact of the state legal
provision about choice of initial provider or the laws about ongoing control of provider choice,

32
and we have shown that while state laws influence the actual choice, there is not a perfect
correspondence. At the same time, because state laws do influence the choice of provider, our
results would be expected to correctly predict at least the sign of the effects of changes in state
laws affecting provider choice, and to more accurately predict the effects of policies that more
fully determine provider choice. In addition, the reader is cautioned that the California and
Pennsylvania laws and practices in effect during the sample period were not strong versions of
employer choice laws – in both, the employer retained the right to select the provider for only a
limited period of time, after which the worker could change providers. One must therefore be
careful about extrapolating from our findings to the impact of changing state laws about who
controls the choice of provider. And last, although we regard this study as an important addition
to a relatively sparse empirical literature on a very important public policy issue, it is just one
study. Additional research on other states and using other data sources and approaches will be
useful to see if these results are robust, if they are supported in other contexts, whether provider
choice has different impacts in certain types of states but not in others, and how provider choice
affects additional outcomes that we do not measure.
Finally, it is useful to speculate as to the potential explanations of our findings that
employee choice, and in particular employee choice of new providers, is associated with higher
costs but no better physical recovery. This speculation may prove useful in stimulating other
research to try to better understand the precise mechanisms that drive the effects of provide choice.
One possibility is that a provider selected by the employer may be more knowledgeable about
working conditions and therefore might be better equipped to recommend sound return-to-work
conditions. In addition, many employers participate in medical network arrangements, which in
many instances confers some screening of providers as well as fee discounts. And when workers
choose new providers, they may be operating in an environment where they have inadequate
33
information about provider quality and may also lack leverage to gain access to higher-quality
providers. Better-quality providers may not be taking new patients or may be scheduling with
significant delays; in contrast, the employer or insurer (or network), through its purchasing power,
may help the worker “jump the line” in cases where the employer chooses the provider. In
addition, a new provider may have less information about the worker, and hence engage in some
unnecessary tests and procedures and practice more defensively. We cannot say for sure, but these
results are consistent with workers without pre-existing provider relationships being forced to
participate in a search process with inadequate information about quality and inadequate leverage
to gain access to better quality.
These speculations, coupled with our results, suggest that employee choice, per se, does
not increase costs of workers’ compensation. Employer choice offers some advantages in terms of
lower costs with similar recovery of physical health. But employee choice of providers who had
treated the worker previously offer similar advantages. In contrast, the more problematic model of
employee choice is choice of a new provider, which on average is associated with higher costs but
no better recovery of physical health (although higher satisfaction with care than for employer
choice) – plausibly due to informational disadvantages along a number of dimensions. Together,
these findings suggest that the policymakers may be able to find middle ground that moderates
costs without sacrificing recovery of physical health by allowing workers to continue to treat with
providers with whom they have a pre-existing relationship, but otherwise allowing the employer to
select providers. In states where the law gives the employer the choice of provider, this would
increase worker choice. In states where the law provides that workers may select providers, this
would increase employer control of the choice.

References Barth, P. and R. Victor. 2003. Outcomes for injured workers in Texas. Cambridge, MA: Workers
Compensation Research Institute.
Boden, L. and C. Fleischman. 1989. Medical costs in workers’ compensation: Trends and interstate comparisons. Cambridge, MA: Workers Compensation Research Institute.
Boden, L. 1992. Workers’ compensation medical costs: A special case. In J. Greenwood and A. Tarico, eds., Workers’ compensation health care cost containment. Horsham, PA: LRP Publications.
Damiano, A. M., G. M. Pastores, and J. E. Ware, Jr. 1998. The health-related quality of life of adults with Gaucher’s disease receiving enzyme replacement therapy: Results from a retrospective study. Quality of Life Research 7(5): 373-86.
DeNavas-Walt, C., B. Proctor, and R. Mills. 2004. Income, poverty, and health insurance coverage in the United States: 2003. Washington, DC: U.S. Government Printing Office.
Durbin, D., and D. Appel. 1991. The impact of fee schedules and employer choice of physician. NCCI Digest 6 (3): 39–59.
Durbin, D., D. Corro, and N. Helvacian. 1996. Workers’ compensation medical expenditures: Price vs. quantity. Journal of Risk and Insurance 63(1): 13-33.
Ellenberger, J. 1992. Labor’s perspective on health care reform. In J. Greenwood and A. Tarico, eds., Workers’ compensation health care cost containment. Horsham, PA: LRP Publications.
Galizzi, M, and L. Boden. 1996. What are the most important factors shaping return to work? Evidence from Wisconsin. Cambridge, MA: Workers Compensation Research Institute.
Lewis, J. 1992. Legislative reform efforts and the medical benefit. In J. Greenwood and A. Tarico, eds., Workers’ compensation health care cost containment. Horsham, PA: LRP Publications.
Morrison, J. 1990. Medical cost containment for workers’ compensation. Journal of Risk and Insurance 57(4): 646-653.
National Academy of Social Insurance. 2004. Workers’ compensation: Benefits, coverage, and costs, 2002. Washington, DC.
National Federation of Independent Business Research Foundation and National Foundation for Unemployment Compensation and Workers’ Compensation. n.d. Legislative guide to workers’ compensation insurance reform in the states.
Neumark, D. 2005. The workers’ compensation crisis in California: A primer. California Economic Policy 1(1).
Perneger, T. V., J.-F. Etter, and A. Rougemont. 1996. Prospective versus retrospective measurement of change in health status: A community based study in Geneva, Switzerland. Journal of Epidemiology and Community Health 51(3): 320-5.
Pozzebon, S. 1994. Medical cost containment under workers’ compensation. Industrial and Labor Relations Review 48(1): 153-167.

Tanabe, R. and S. Murray. 2001. Managed care and medical cost containment in workers' compensation: A national inventory, 2001-2002. Cambridge, MA: Workers Compensation Research Institute.
Telles, C., D. Wang, and R. Tanabe. 2004. CompScope™ benchmarks: Multistate comparisons, 4th edition. Cambridge, MA: Workers Compensation Research Institute.
Victor, R., P. Barth, and T. Liu. 2003. Outcomes for injured workers in California, Massachusetts, Pennsylvania, and Texas. Cambridge, MA: Workers Compensation Research Institute.
Victor, R., and C. Fleischman. 1990. How choice of provider and recessions affect medical costs in workers’ compensation. Cambridge, MA: Workers Compensation Research Institute.
Ware, J., D. Turner-Bowker, M. Kosinski, and B. Gandek. 2002. SF-12v2™: How to score version 2 of the SF-12® health survey. Lincoln, RI: QualityMetric, Inc.
Washington Department of Labor and Industries and University of Washington Department of Health Services. 1997. Workers’ compensation managed care pilot project: Final report to the legislature.

Table 1: Definitions of Variables
Dependent variables:
Indemnity benefits The indemnity payment the worker received.
Medical benefits The amount the insurer paid for the worker's medical treatment.
Substantial return to work A dummy variable. The value is 1 if the worker was able to return to work and stay for one full month.
Duration of disability The number of weeks from the time of the injury to the first substantial return to work. If the workers did not have substantial return to work, we assigned 156 weeks.
Recovery Worker's perceived recovery. The difference between SF-12® score in the week after the injury and the score at the time of the interview.
Satisfaction An ordinal categorical variable. The question is about the satisfaction level with the medical care the worker received overall. 1 is "very satisfied." 2 is "somewhat satisfied." 3 is "somewhat dissatisfied." 4 is "very dissatisfied."
Provider choice:
Employer chose A dummy variable equal to 1 if the employer or the insurance company chose the provider.
Employee chose A dummy variable equal to 1 if the worker, their family, their friends, or their attorney chose the provider.
Employee chose, prior A dummy variable equal to 1 if the worker, their family, their friends, or their attorney chose the provider, and the worker was previously treated by this provider for other medical condition.
Employee chose, new A dummy variable equal to 1 if the worker, their family, their friends, or their attorney chose the provider, and the worker was not previously treated by this provider for other medical condition.
Injury characteristics:
Back pain A dummy variable equal to 1 if the type of injury is back pain.
Non-back sprain or strain A dummy variable equal to 1 if the type of injury is non-back sprain or strain.
Fracture A dummy variable equal to 1 if the type of injury is fracture.
Inflammation, laceration, or contusion
A dummy variable equal to 1 if the type of injury is inflammation, laceration, or contusion.
Other injuries A dummy variable equal to 1 if the type of injury is other injury.
Severity Worker's perceived severity. The difference between SF-12® score during the four weeks before the injury and the score during the week after the injury.
Treatment characteristics:
Overnight hospitalization A dummy variable equal to 1 if the worker received “room and board” or “intensive care” based on the revenue code.
Major surgery A dummy variable equal to 1 if the total payment for significant surgical services was positive.

Table 2: Choice of Primary Provider
Percent of Workers Combined California Texas Massachusetts Pennsylvania
Employee chose 41.4 33.8 52.7 51.0 31.3
You/respondent 36.9 28.4 46.8 46.3 29.4
A family member 1.9 0.7 2.9 2.8 1.5
A friend 1.3 1.6 2.0 1.4 0.2
Your attorney 1.3 3.1 1.0 0.5 0.3
Prior versus new:
Prior 18.8 17.0 19.1 26.7 14.1
New 22.6 16.8 33.6 24.3 17.2
Employer chose 37.5 48.3 27.0 19.4 50.7
Your employer 31.7 41.0 21.4 14.4 45.4
An insurance company 5.8 7.3 5.6 5.0 5.3
Medical professional/ hospital/clinic
17.7 13.8 16.7 25.1 16.3
Someone else 3.3 4.0 3.6 4.5 1.6
Number of cases 2,513 665 609 542 697
Number of cases with either employee or employer choice
1,960 538 481 376 565
Notes: In a handful of cases (10) respondents could not or did not answer the question about prior versus new provider.

Table 3: Costs and Health Outcomes
Combined California Texas Massachusetts Pennsylvania
Costs:
Average medical payment per claim
$8,713 $9,950 $11,729 $4,946 $7,594
Average indemnity benefit per claim
$12,709 $15,444 $10,188 $13,874 $11,358
Return to work:
Percent of workers who did not have substantial return to work
19 19 27 18 13
Average/median duration of time out of work (weeks)
44/10 45/12 57/15 43/12 32/8
Recovery:
Average recovery score 19.2 17.6 15.0 24.1 21.0
Satisfaction with medical care:
Percent very satisfied 52 47 51 56 57
Percent somewhat satisfied 29 33 29 29 26
Percent somewhat dissatisfied 8 10 9 6 8
Percent very dissatisfied 10 10 11 8 9
Notes: Only cases where the employee or employer chose the primary provider are included in this table and in subsequent tables. The respondent’s SF-12® scores are scaled scores from 0 to 100, where 100 is the best health. The recovery score is the difference between the SF-12® value at the time of interview and the score one week after injury. The mean value of the preinjury scores for respondents was about 54 or 55 depending on the state. Only those who had substantial return to work are asked “how many weeks was it from the time you first stopped working because of your injury and the first time that you returned to work for one full month?” For those who had not had a substantial return to work, the mean length of time from the injury to the interview is used (156 weeks).
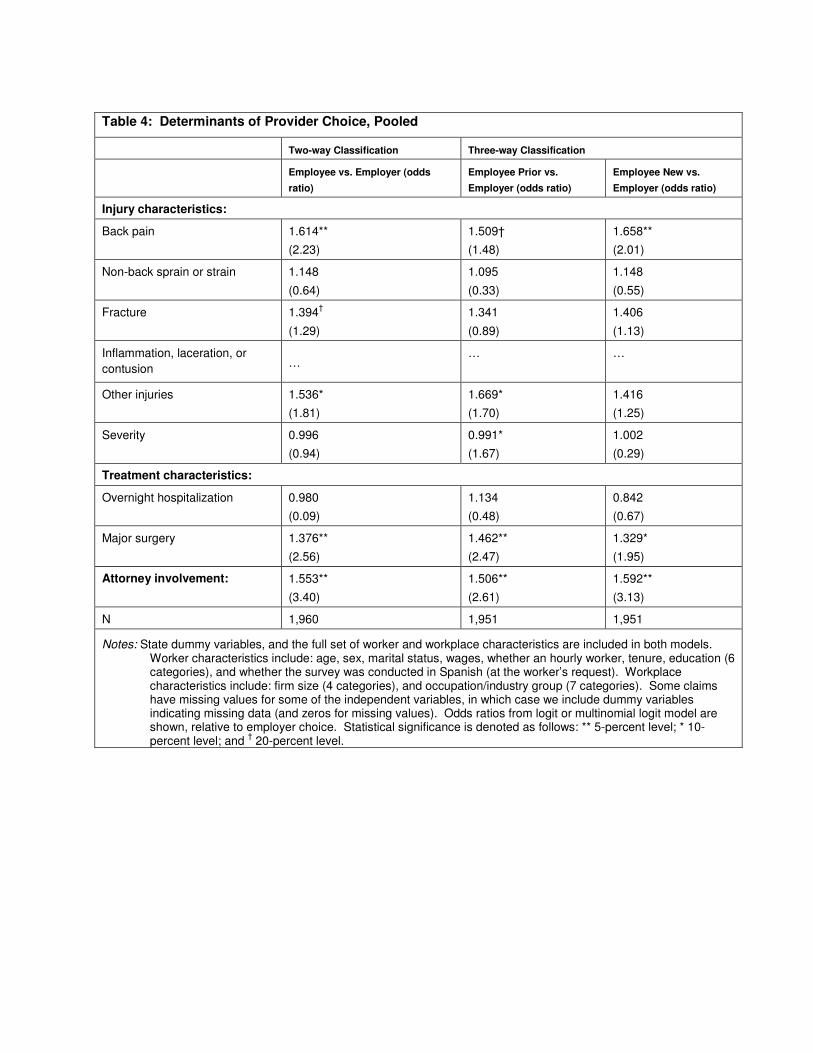
Table 4: Determinants of Provider Choice, Pooled
Two-way Classification Three-way Classification
Employee vs. Employer (odds
ratio)
Employee Prior vs.
Employer (odds ratio)
Employee New vs.
Employer (odds ratio)
Injury characteristics:
Back pain 1.614** (2.23)
1.509† (1.48)
1.658** (2.01)
Non-back sprain or strain 1.148
(0.64)
1.095
(0.33)
1.148
(0.55)
Fracture 1.394†
(1.29)
1.341
(0.89)
1.406
(1.13)
Inflammation, laceration, or contusion …
… …
Other injuries 1.536* (1.81)
1.669* (1.70)
1.416 (1.25)
Severity 0.996 (0.94)
0.991* (1.67)
1.002 (0.29)
Treatment characteristics:
Overnight hospitalization 0.980 (0.09)
1.134 (0.48)
0.842 (0.67)
Major surgery 1.376** (2.56)
1.462** (2.47)
1.329* (1.95)
Attorney involvement: 1.553** (3.40)
1.506** (2.61)
1.592** (3.13)
N 1,960 1,951 1,951
Notes: State dummy variables, and the full set of worker and workplace characteristics are included in both models. Worker characteristics include: age, sex, marital status, wages, whether an hourly worker, tenure, education (6 categories), and whether the survey was conducted in Spanish (at the worker’s request). Workplace characteristics include: firm size (4 categories), and occupation/industry group (7 categories). Some claims have missing values for some of the independent variables, in which case we include dummy variables indicating missing data (and zeros for missing values). Odds ratios from logit or multinomial logit model are shown, relative to employer choice. Statistical significance is denoted as follows: ** 5-percent level; * 10-percent level; and † 20-percent level.
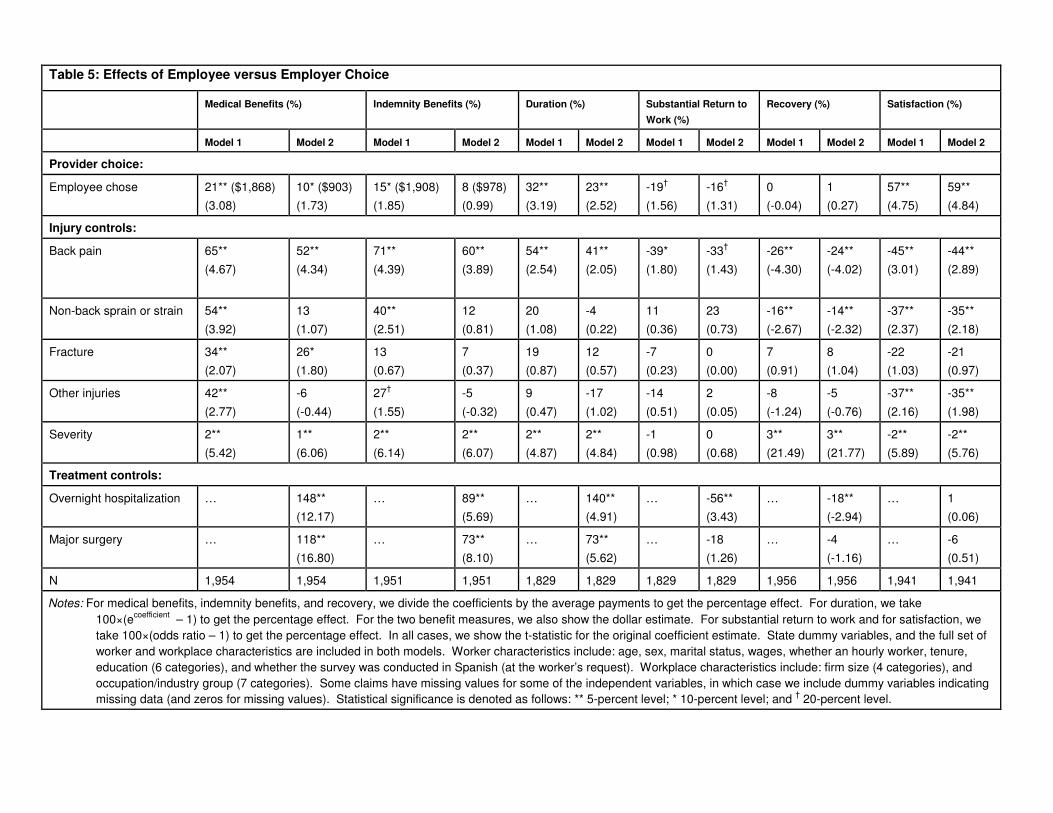
Table 5: Effects of Employee versus Employer Choice
Medical Benefits (%) Indemnity Benefits (%) Duration (%) Substantial Return to
Work (%)
Recovery (%) Satisfaction (%)
Model 1 Model 2 Model 1 Model 2 Model 1 Model 2 Model 1 Model 2 Model 1 Model 2 Model 1 Model 2
Provider choice:
Employee chose 21** ($1,868) (3.08)
10* ($903) (1.73)
15* ($1,908) (1.85)
8 ($978) (0.99)
32** (3.19)
23** (2.52)
-19†
(1.56) -16†
(1.31) 0 (-0.04)
1 (0.27)
57** (4.75)
59** (4.84)
Injury controls:
Back pain 65** (4.67)
52** (4.34)
71** (4.39)
60** (3.89)
54** (2.54)
41** (2.05)
-39* (1.80)
-33†
(1.43) -26** (-4.30)
-24** (-4.02)
-45** (3.01)
-44** (2.89)
Non-back sprain or strain 54** (3.92)
13 (1.07)
40** (2.51)
12 (0.81)
20 (1.08)
-4 (0.22)
11 (0.36)
23 (0.73)
-16** (-2.67)
-14** (-2.32)
-37** (2.37)
-35** (2.18)
Fracture 34** (2.07)
26* (1.80)
13 (0.67)
7 (0.37)
19 (0.87)
12 (0.57)
-7 (0.23)
0 (0.00)
7 (0.91)
8 (1.04)
-22 (1.03)
-21 (0.97)
Other injuries 42**
(2.77)
-6
(-0.44)
27†
(1.55)
-5
(-0.32)
9
(0.47)
-17
(1.02)
-14
(0.51)
2
(0.05)
-8
(-1.24)
-5
(-0.76)
-37**
(2.16)
-35**
(1.98)
Severity 2** (5.42)
1** (6.06)
2** (6.14)
2** (6.07)
2** (4.87)
2** (4.84)
-1 (0.98)
0 (0.68)
3** (21.49)
3** (21.77)
-2** (5.89)
-2** (5.76)
Treatment controls:
Overnight hospitalization … 148** (12.17)
… 89** (5.69)
… 140** (4.91)
… -56** (3.43)
… -18** (-2.94)
… 1 (0.06)
Major surgery … 118** (16.80)
… 73** (8.10)
… 73** (5.62)
… -18 (1.26)
… -4 (-1.16)
… -6 (0.51)
N 1,954 1,954 1,951 1,951 1,829 1,829 1,829 1,829 1,956 1,956 1,941 1,941
Notes: For medical benefits, indemnity benefits, and recovery, we divide the coefficients by the average payments to get the percentage effect. For duration, we take 100×(ecoefficient – 1) to get the percentage effect. For the two benefit measures, we also show the dollar estimate. For substantial return to work and for satisfaction, we take 100×(odds ratio – 1) to get the percentage effect. In all cases, we show the t-statistic for the original coefficient estimate. State dummy variables, and the full set of worker and workplace characteristics are included in both models. Worker characteristics include: age, sex, marital status, wages, whether an hourly worker, tenure, education (6 categories), and whether the survey was conducted in Spanish (at the worker’s request). Workplace characteristics include: firm size (4 categories), and occupation/industry group (7 categories). Some claims have missing values for some of the independent variables, in which case we include dummy variables indicating missing data (and zeros for missing values). Statistical significance is denoted as follows: ** 5-percent level; * 10-percent level; and † 20-percent level.
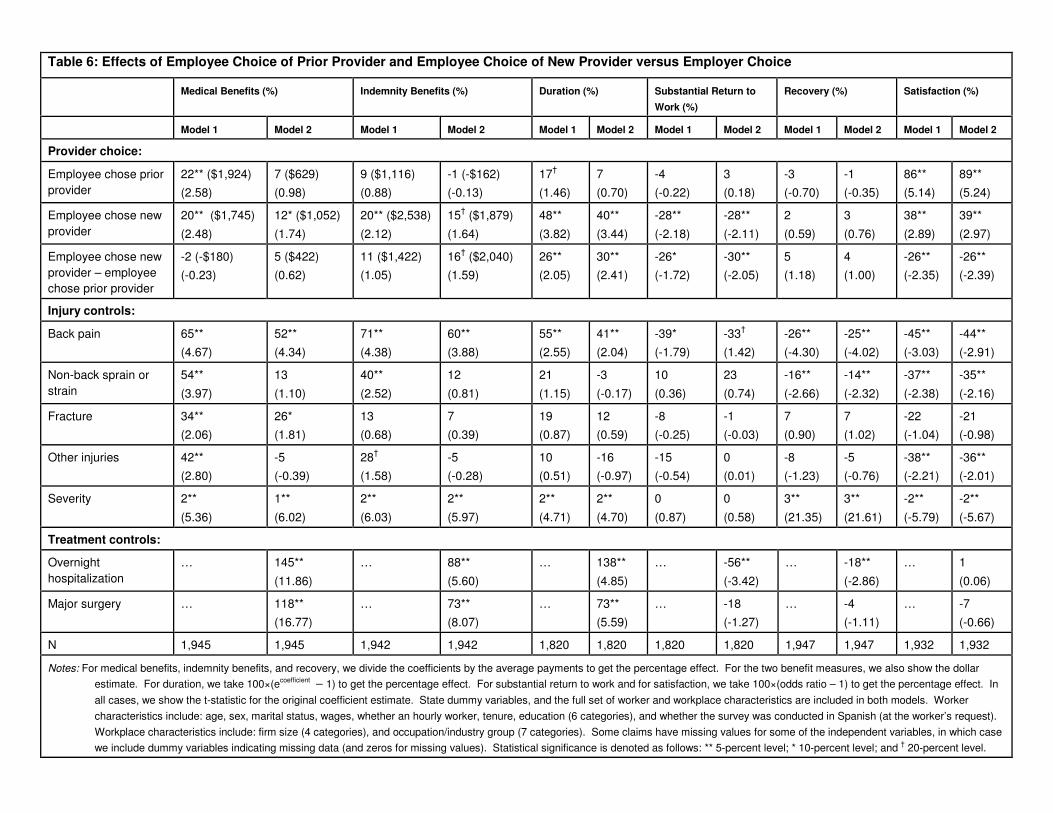
Table 6: Effects of Employee Choice of Prior Provider and Employee Choice of New Provider versus Employer Choice
Medical Benefits (%) Indemnity Benefits (%) Duration (%) Substantial Return to
Work (%)
Recovery (%) Satisfaction (%)
Model 1 Model 2 Model 1 Model 2 Model 1 Model 2 Model 1 Model 2 Model 1 Model 2 Model 1 Model 2
Provider choice:
Employee chose prior provider
22** ($1,924) (2.58)
7 ($629) (0.98)
9 ($1,116) (0.88)
-1 (-$162) (-0.13)
17†
(1.46) 7 (0.70)
-4 (-0.22)
3 (0.18)
-3 (-0.70)
-1 (-0.35)
86** (5.14)
89** (5.24)
Employee chose new provider
20** ($1,745)
(2.48)
12* ($1,052)
(1.74)
20** ($2,538)
(2.12)
15† ($1,879)
(1.64)
48**
(3.82)
40**
(3.44)
-28**
(-2.18)
-28**
(-2.11)
2
(0.59)
3
(0.76)
38**
(2.89)
39**
(2.97)
Employee chose new provider – employee chose prior provider
-2 (-$180) (-0.23)
5 ($422) (0.62)
11 ($1,422) (1.05)
16† ($2,040) (1.59)
26** (2.05)
30** (2.41)
-26* (-1.72)
-30** (-2.05)
5 (1.18)
4 (1.00)
-26** (-2.35)
-26** (-2.39)
Injury controls:
Back pain 65** (4.67)
52** (4.34)
71** (4.38)
60** (3.88)
55** (2.55)
41** (2.04)
-39* (-1.79)
-33†
(1.42) -26** (-4.30)
-25** (-4.02)
-45** (-3.03)
-44** (-2.91)
Non-back sprain or strain
54**
(3.97)
13
(1.10)
40**
(2.52)
12
(0.81)
21
(1.15)
-3
(-0.17)
10
(0.36)
23
(0.74)
-16**
(-2.66)
-14**
(-2.32)
-37**
(-2.38)
-35**
(-2.16)
Fracture 34** (2.06)
26* (1.81)
13 (0.68)
7 (0.39)
19 (0.87)
12 (0.59)
-8 (-0.25)
-1 (-0.03)
7 (0.90)
7 (1.02)
-22 (-1.04)
-21 (-0.98)
Other injuries 42** (2.80)
-5 (-0.39)
28†
(1.58) -5 (-0.28)
10 (0.51)
-16 (-0.97)
-15 (-0.54)
0 (0.01)
-8 (-1.23)
-5 (-0.76)
-38** (-2.21)
-36** (-2.01)
Severity 2**
(5.36)
1**
(6.02)
2**
(6.03)
2**
(5.97)
2**
(4.71)
2**
(4.70)
0
(0.87)
0
(0.58)
3**
(21.35)
3**
(21.61)
-2**
(-5.79)
-2**
(-5.67)
Treatment controls:
Overnight hospitalization
… 145**
(11.86)
… 88**
(5.60)
… 138**
(4.85)
… -56**
(-3.42)
… -18**
(-2.86)
… 1
(0.06)
Major surgery … 118** (16.77)
… 73** (8.07)
… 73** (5.59)
… -18 (-1.27)
… -4 (-1.11)
… -7 (-0.66)
N 1,945 1,945 1,942 1,942 1,820 1,820 1,820 1,820 1,947 1,947 1,932 1,932
Notes: For medical benefits, indemnity benefits, and recovery, we divide the coefficients by the average payments to get the percentage effect. For the two benefit measures, we also show the dollar estimate. For duration, we take 100×(ecoefficient – 1) to get the percentage effect. For substantial return to work and for satisfaction, we take 100×(odds ratio – 1) to get the percentage effect. In all cases, we show the t-statistic for the original coefficient estimate. State dummy variables, and the full set of worker and workplace characteristics are included in both models. Worker characteristics include: age, sex, marital status, wages, whether an hourly worker, tenure, education (6 categories), and whether the survey was conducted in Spanish (at the worker’s request). Workplace characteristics include: firm size (4 categories), and occupation/industry group (7 categories). Some claims have missing values for some of the independent variables, in which case we include dummy variables indicating missing data (and zeros for missing values). Statistical significance is denoted as follows: ** 5-percent level; * 10-percent level; and † 20-percent level.

Table 7: Effects of Employee Choice of Prior Provider and Employee Choice of New Provider versus Employer Choice,
Excluding Severity and Injury Measures
Medical Benefits (%) Indemnity Benefits (%) Duration (%) Substantial Return
to Work (%)
Recovery (%) Satisfaction (%)
Model 1: Without treatment controls:
Employee chose prior provider 22** ($1,924) (2.58)
9 ($1,116) (0.88)
17†
(1.46) -4 (0.22)
-3 (-0.70)
86** (5.14)
Employee chose new provider 20** ($1,745) (2.48)
20** ($2,538) (2.12)
48** (3.82)
-28** (2.18)
2 (0.59)
38** (2.89)
Omit severity variable:
Employee chose prior provider 21** ($1,817) (2.42)
7 ($916) (0.71)
15 (1.28)
-3 (0.20)
-5 (-1.21)
87** (5.22)
Employee chose new provider 21** ($1,811)
(2.56)
21** ($2,651)
(2.19)
47**
(3.78)
-28**
(2.20)
3
(0.78)
36**
(2.82)
Omit severity and injury variables:
Employee chose prior provider 22** ($1,940)
(2.57)
9 ($1,116)
(0.86)
17†
(1.44)
-7
(0.41)
-5
(-1.15)
83**
(5.07)
Employee chose new provider 23** ($2,027) (2.85)
24** ($3,093) (2.54)
52** (4.05)
-31** (2.43)
3 (0.73)
32** (2.55)
Notes: See notes to Table 6.

Table 8: Satisfaction with Medical Care, Second Absences, and Return to Work
Very Satisfied
Somewhat Satisfied
Somewhat Dissatisfied
Very Dissatisfied
Second absence due to injury:
No second absence 60 28 6 6
Second absence 35 32 14 19
Workers’ perception of return to work:
Right time 63 28 6 4
Too soon 42 32 11 16
Notes: All entries are row percentages.

Table 9: Effects of Provider Choice on Completeness of Recovery/Perception of Return to Work, and Second Absences
Second Absence (%) Perception of Return to Work Too Soon (%)
Two-way Three-way Two-way Three-way
Provider choice
Employee chose -1
(0.05)
… 7
(0.56)
…
Employee chose prior provider
… 20 (0.99)
… 4 (0.28)
Employee chose new provider
… -17 (0.98)
… 14 (0.90)
Injury controls
Back pain 93* (1.94)
93* (1.95)
63* (1.92)
65** (1.96)
Non-back sprain or strain 88*
(1.91)
90*
(1.93)
47†
(1.55)
50†
(1.62)
Fracture -54†
(1.59) -57* (1.69)
16 (0.49)
17 (0.53)
Other injuries 7 (0.18)
7 (0.17)
12 (0.40)
12 (0.41)
Severity 2**
(2.99)
2**
(2.93)
3**
(4.77)
3**
(4.66)
N 1361 1355 1357 1351
Notes: We estimate logit models. Positive estimates imply better outcomes – i.e., a lower probability of a second absence and a higher probability of return to work at the right time. We take 100×(odds ratio – 1) to get the percentage effect. In all cases, we show the t-statistic for the original coefficient estimate. State dummy variables, and the full set of worker and workplace characteristics are included in both models. Worker characteristics include: age, sex, marital status, wages, whether an hourly worker, tenure, education (6 categories), and whether the survey was conducted in Spanish (at the worker’s request). Workplace characteristics include: firm size (4 categories), and occupation/industry group (7 categories). The treatment variables are not included in these models. Some claims have missing values for some of the independent variables, in which case we include dummy variables indicating missing data (and zeros for missing values). Statistical significance is denoted as follows: ** 5-percent level; * 10-percent level; and † 20-percent level.

Appendix Table 1: Effects of Employee versus Employer Choice, and Employee Choice of Prior Provider and Employee Choice of New Provider versus Employer Choice, Excluding State Dummy Variables
Medical Benefits (%) Indemnity Benefits (%) Duration (%) Substantial Return to
Work (%)
Recovery (%) Satisfaction (%)
Model 1 Model 2 Model 1 Model 2 Model 1 Model 2 Model 1 Model 2 Model 1 Model 2 Model 1 Model 2
Two-way
Employee chose 17**($1,490)
(2.52)
9† ($765)
(1.51)
11 ($1,338)
(1.36)
5 ($614)
(0.65)
40**
(4.08)
33**
(3.55)
-27**
(2.49)
-26**
(2.31)
1
(0.20)
1
(0.37)
53**
(4.69)
55**
(4.81)
N 1,954 1,954 1,951 1,951 1,829 1,829 1,829 1,829 1,956 1,956 1,941 1,941
Three-way
Employee chose prior provider
14* ($1,248) (1.70)
3 ($256) (0.41)
6 ($709) (0.57)
-3 (-$326) (-0.28)
23** (2.03)
15† (1.39)
-12 (0.76)
-7 (0.44)
-0 (0.09)
1 (0.16)
82** (5.12)
85** (5.26)
Employee chose new provider
18**($1,586)
(2.30)
13*($1,091)
(1.84)
14† (1,806)
(1.56)
10 ($1,334)
(1.20)
57**
(4.62)
51**
(4.35)
-37**
(3.14)
-37**
(3.14)
2
(0.45)
2
(0.51)
33**
(2.72)
35**
(2.81)
Employee chose new provider – employee chose prior provider
4 ($337) (0.42)
10 ($835) (1.21)
9 ($1,097) (0.81)
13†($1,660) (1.29)
28** (2.13)
31** (2.47)
-28** (1.96)
-32** (2.27)
2 (0.47)
1 (0.29)
-27** (2.44)
-27** (2.50)
Treatment controls No Yes No Yes No Yes No Yes No Yes No Yes
N 1,945 1,945 1,942 1,942 1,820 1,820 1,820 1,820 1,947 1,947 1,932 1,932
Notes: Specifications are comparable to those in Tables 5 and 6. For medical benefits, indemnity benefits, and recovery, we divide the coefficients by the average payments to get the percentage effect. For duration, we take 100×(ecoefficient – 1) to get the percentage effect. For the two benefit measures, we also show the dollar estimate. For substantial return to work and for satisfaction, we take 100×(odds ratio – 1) to get the percentage effect. In all cases, we show the t-statistic for the original coefficient estimate. State dummy variables, the full set of worker and workplace characteristics, and injury controls are included in both models. Worker characteristics include: age, sex, marital status, wages, whether an hourly worker, tenure, education (6 categories), and whether the survey was conducted in Spanish (at the worker’s request). Workplace characteristics include: firm size (4 categories), and occupation/industry group (7 categories). Some claims have missing values for some of the independent variables, in which case we include dummy variables indicating missing data (and zeros for missing values). Statistical significance is denoted as follows: ** 5-percent level; * 10-percent level; and † 20-percent level.

Endnotes 1 This is not to suggest that it is solely workers who have supported employee choice. The
organization of workers’ compensation state administrators – the International Association of
Industrial Accident Boards and Commissions – at one time published a list of standards for the
states wherein it endorsed the standard of worker choice. However, the organization no longer
publishes a listing of standards.
2 For more details, see Neumark (2005).
3 This can occur because the law only gives one party the right to choose the provider, which can
be ceded to the other party.
4 Note that these data were collected before the most recent reforms in California affecting
employee choice.
5 The one exception is a set of controls for industry/occupation cells categorized on the basis of
risk, including high-risk services, low-risk services, clerical/professional occupations (regardless
of industry), manufacturing, construction, trade, and other industries. Further details are provided
in Telles, et al. (2004, Technical Appendix).
6 We recognize that the worker might have had many providers, but for the sake of clarity in
interviewing and to keep the survey at a reasonable length, our questions related to those that the
workers identified as the initial provider and the primary provider. We also recognize that the
number of types of specialties involved in treating injured individuals can be very large. We
chose not to probe this issue – other than to distinguish among physicians, chiropractors, and
physical therapists. One reason, again, was the length of the survey; a second was because the
worker might not know a physician’s precise specialty.
7 Classifying the choice of the provider as the employee’s choice if the worker’s attorney chose the
physician strikes us as an accurate characterization of the choice. It is important to emphasize that

attorney involvement and attorney choice of provider are not the same thing. There are plenty of
cases where the employer chose the physician but there turned out to be attorney involvement
(18.5 percent of employer choice cases, versus 24 percent of employee choice cases based on our
classification).
8 In each state, the data come from payors from three different market segments – the voluntary
insurance market, the residual market (market of last resort) or the state fund, and the self-insured
market. In addition, claims were divided into two levels of financial seriousness, and the more
serious claims were oversampled, because they are relatively rare. Consequently, in all of our
analyses weights are applied to data from each of the six strata in the state based on market
segment and financial seriousness to make the claims representative of claims in each state.
However, we do not weight the data by state to make the sample representative of claims in the
four states. Doing so would, naturally, apply much higher weights to observations from California
and Texas. In the regression analysis, this latter type of weighting would only matter if
parameters differ across states, which is something we independently investigate in a number of
ways. Overall, the regression results suggest that by not weighting across states we, if anything,
understate the strength of our conclusions, because the results on the effects of provider choice are
strongest for California and Texas, the two largest states.
9 There are some exceptions to these types of rules. For example, in some employer-choice states,
when the employer has established an approved network the worker must select within the
network. Typically, these should be thought of as broader networks, giving the worker a much
wider array of choice, than the networks that are expected to develop under California’s recent
reforms. See Tanabe and Murray (2001).
10 The prior/new question for initial provider was not asked of those for whom the initial provider

was not primary. This was one of many compromises made in the design of the survey to reduce
the scope to fit into the interview time limit. We could still study initial, non-primary providers
using these latter respondents for the two-way classification, but we do not since the three-way
classification is of greater interest in light of recent reforms.
11 For the period 2001-2003, the proportions of the population not covered by health insurance in
our four states and in the United States were California – 18.7 percent, Massachusetts – 9.6
percent, Pennsylvania – 10.7 percent, Texas – 24.6 percent (highest in the nation), and United
States – 15.1 percent (DeNavas-Walt, et al., 2004).
12 The recovery measure used is the change from one week after the injury to the interview; in
most cases this change is positive, but that is not imposed on the data since a worker’s health
could worsen. In addition, the severity control used in the regression models that follow is
similarly defined as a change in levels – in this case from prior to the injury to one week after.
Again, we do not impose that the worker’s health had to worsen, although it does in almost every
case. We also experimented with specifications defining each of these variables as relative
measures – that is, we defined the percentage recovery relative to health status one week after the
injury, and the percentage severity relative to health status prior to the injury. The results were
very similar. We have some preference for the specification with changes in levels, because we do
not think a full recovery from a very minor injury should be treated symmetrically to a full
recovery from a very serious injury. Put another way, we think it is important that the regression
estimates of effects of provider choice on recovery reflect a large “penalty” for serious injuries
that are not followed by substantial recovery, even if they are also associated with near-complete
recoveries for very minor injuries.
13 Victor, et al. (2003) provide extensive discussion of potential concerns about recall bias and
other limitations, as well as evidence of validity of the health status measure from which both
recovery and injury severity are derived. Of specific concern, although the SF-12® is designed to
assess current health, in the survey it is also used retrospectively to assess health pre- and
immediately post-injury. As Victor, et al., show, retrospective measures based on the SF-12® used
in this survey match up well with results from the more standard, contemporaneous application of
the SF-12® in other studies. In addition, although existing research has not directly explored the
validity of retrospective application of the SF-12® (or the longer SF-36®), studies do validate
retrospective recall of changes in health status with respect to prospective measurements based on
the SF-36® (Perneger, et al., 1996; Damiano, et. al, 1998). Finally, in the particular application of
the data that we explore, recall bias would be most problematic if it were correlated with provider
choice, which seems unlikely.
14 The methodology for scoring the SF-12® is widely accepted and well-documented (Ware, et al.,
2002). The mental health questions were only asked at the time of the interview, in part because
of specific concerns about the difficulty of recalling mental health status, and also because asking
all 12 questions about three periods would have significantly lengthened the time needed to
conduct the entire survey. This poses a problem because the overall scores for physical health and
functioning based on the SF-12® require information on mental health. There are no significant
differences (and the differences are trivial) in the responses to the mental health questions, at the
time of the interview, between workers who chose their own provider and those for whom
employers chose the provider. To compute the SF-12® scores, we assumed that the mental health
scores at the time of the interview prevailed at the other times (pre- and immediately post-injury).
We cannot, of course, verify this directly. But the Victor, et al. (2003) study explored the
sensitivity of the SF-12® scores to using different extreme (best-case and worst-case) assumptions

about mental health at these two times and found the physical health and functioning scores were
very insensitive to the mental health responses (changing by only one percentage point in either
direction relative to the physical health and functioning score using the actual mental health
responses from the interview). Thus, any bias from not having information on mental health pre-
and immediately post-injury should be negligible.
15 In some cases workers may be assigned multiple diagnosis codes during the course of their
disability. In such cases, we define a primary diagnosis code based on the code that receives the
greatest expenditure. Also, in some cases diagnosis codes are missing in the database. In these
cases, we use information from the payor about the nature of injury and part of body to assign the
case to the appropriate injury group.
16 See Appendix Table 1, in comparison to Tables 5 and 6.
17 The TREATMENT variables in equation (1) are discussed below.
18 The hazard function is more complicated, but an appealing feature of the function that results
for the log-logistic distribution is that it is flexible, and can be increasing monotonically,
decreasing monotonically, or first increasing and then decreasing, depending on the value of .
This contrasts with some more widely-used distributional assumptions that impose more
restrictions on the hazard function.
19 The implication of this is that the values of the regressors Z and the parameters exert a
proportional shift on the odds ratio in equation (5) for all values of t. That is, for any two
individuals who have different Z’s but the same values of , the odds of the spell lasting longer
than t are constant for any t.
20 In work with duration models there is sometimes attention given to the problem of unobserved
heterogeneity. We do not think this is critical in our context, for two reasons. First, because we
have very detailed controls we do not have reason to believe that there is an important role for
unmeasured heterogeneity. More important, the unique problem that unobserved heterogeneity
introduces in duration models is bias in the estimates of parameters measuring duration
dependence, because one cannot easily identify whether, for example, the probability of escaping
from some status decreases over time because of duration dependence, or because the sample
increasingly shifts towards those likely to have long durations. By extension, bias will also be
transmitted to coefficients of variables in duration models that are time varying. But we have
neither of these. Rather, we simply have time-invariant controls that are unlikely to be affected by
unobserved heterogeneity any more than would coefficients in a standard regression model. So
rather than use statistical tricks to address this problem in duration models (such as assuming a
functional form for the heterogeneity and integrating out), we prefer to use the data to try to
address the issue. The place we think this is most important is with respect to the problem of
unobserved injury severity, which we address in other ways as discussed below.
21 These results are available from the authors upon request.
22 We consider including these variables, but not attorney involvement, because hospitalization
and surgery are sometimes likely to be dictated by medical exigencies. At the same time, we
recognize that it is possible that attorney involvement exacerbates the effects of employee choice
of provider. This raises interesting questions about how costs and outcomes – and their
relationship to provider choice – might change were policies relating to use of attorneys in
workers’ compensation cases altered; that question, however, is well beyond the scope of this
study.
23 Note that in the tables we report only the effects of provider choice and some other key
variables on the outcomes. Full regression results for are available from the authors upon request.

24 The results in the third row of Table 6 come from including in the regression models a dummy
variable for either type of employee choice, and also an interaction between this dummy variable
and a dummy variable for employee choice of a new provider. The estimated coefficient of the
latter interaction measures the difference between the two types of employee choice, and a test of
its statistical significance tells us whether the two types of employee choice have significantly
different effects. Note that in some cases the number reported in the third row is not simply the
difference between the estimates reported in the first two rows of the table for the two types of
employee choice, because the numbers reported in the table are in some cases calculated from the
exponentials of the regression coefficients.
25 Another potential argument for a relationship between unmeasured severity and employee
choice of a new provider is that it arises by construction. In particular, in employer choice states
employee choice of a new provider is likely to coincide with having at least two providers – the
initial one chosen by the employer and a subsequent one chosen by the employee. If more serious
or complex injuries are also associated with multiple providers, then this can lead to a systematic
sorting of more serious cases into the employee choice of new provider category. We examined
the data and found that the share of claims involving two or more providers was in fact slightly
lower (rather than higher) for claims with employee choice of new providers – both for the pooled
data and each state separately. We also examined this in a multivariate setting, estimating logit
models for whether there were two or more providers, including as independent variables dummy
variables for provider choice and all of the other controls included in Table 4. Using the pooled
data (with state dummy variables) and data for the states separately, the estimated differential
associated with employee choice of a new provider was either zero or negative (rather than
positive). Indeed, the pattern of differences across states does not even suggest that in employer

choice states there is a greater relative likelihood that employee choice of a new provider is
associated with having multiple providers. Thus, we conclude that employee choice of a new
provider is not associated with a greater likelihood of having multiple providers, which we believe
further rules out the likelihood of unmeasured severity differences associated with provider
choice, especially of the type would generate higher costs and worse return to work for cases with
employee choice of new providers.
Recommended