For Professional Client Use Only
Richard S. Nackenson Managing Director and Senior Portfolio Manager
Neuberger Berman US Multi Cap Opportunities Fund
For Professional Client Use Only
Table of Contents
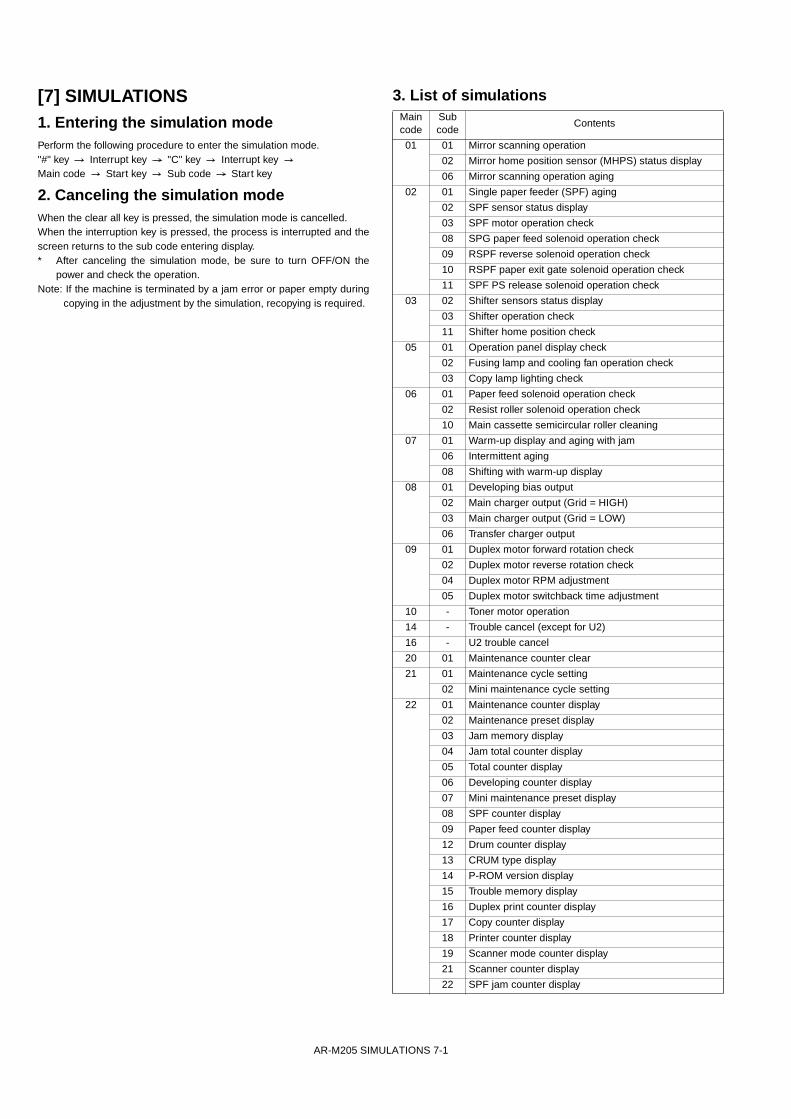
I. FIRM OVERVIEW
II. FUND & TEAM OVERVIEW
III. INVESTMENT PROCESS
IV. FUND PERFORMANCE & PORTFOLIO CHARACTERISTICS
V. LONG-TERM PERFORMANCE
VI. HISTORICAL CATEGORY & CAPITALISATION WEIGHTINGS
VII. BIOGRAPHIES
VIII. STOCK EXAMPLES
IX. DISCLAIMER
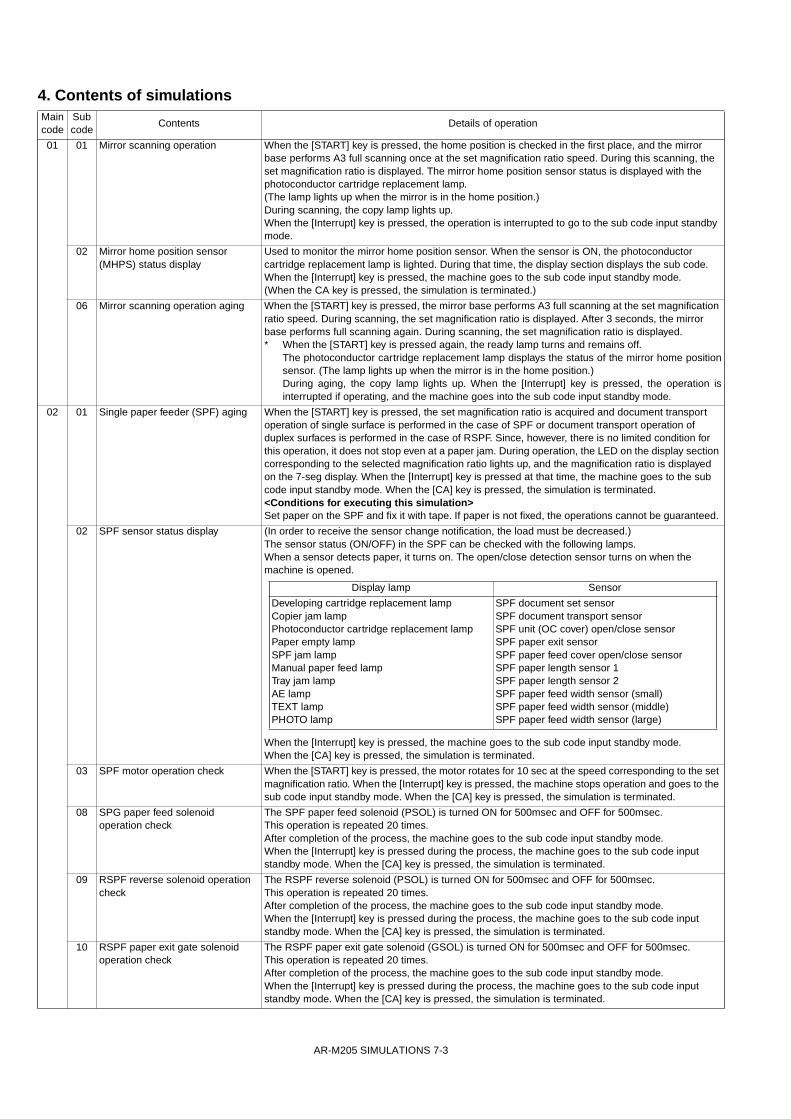
FIRM OVERVIEW

Neuberger Berman Founded in 1939, we are a leading private, employee-controlled asset management firm, with approximately $216 billion in assets under management
_______________________ Sources: Neuberger Berman, FactSet, eVestment, Morningstar, and Lipper, a Thomson Reuters company. All information is as of March 31, 2013, except as otherwise noted. Firm data reflects the collective data for the various affiliated investment advisers that are subsidiaries of Neuberger Berman Group LLC. 1. AUM outperformance data is asset-weighted and based on the gross of fee performance of the firm’s traditional equity and fixed income strategies against their respective benchmarks and peer categories. Individual strategies may have experienced negative performance during certain periods of time. See Additional Disclosures for additional information regarding AUM /fund outperformance and peer statistics (including 3-and 5-yr statistics) and ratings. Mutual funds are not available outside the U.S. Indexes are unmanaged and are not available for direct investment. Investing entails risks, including possible loss of principal. Past performance is no guarantee of future results. Industry portfolio manager averages were compiled by Neuberger Berman based on portfolio manager industry experience data as reported to eVestment and includes separate accounts, mutual funds, and other commingled funds. See Additional Disclosures for additional information on the definition of “investment professionals" and certain exclusions. 2. As of March 14, 2013. Ownership includes employees and their permitted transferees 3. As of December 31, 2012
EXPERIENCED AND ALIGNED WITH CLIENTS
FOCUSED ON PERFORMANCE
INDEPENDENT AND STABLE
72% employee owned2
95% of client’s assets managed by lead PMs who have 20+ years of industry experience
1,832 employees worldwide
418 investment professionals
70% of the firm’s equity AUM outperformed their peer group median for the most recent 10 year period1
65% of our U.S. registered mutual funds are rated 4 and 5 stars Overall by Morningstar vs. 32.5% of 4 and 5 Overall stars awarded1
88% of the firm’s equity & fixed income AUM outperformed their benchmarks for the most recent 10 year period1
68% of our U.S. registered mutual fund share classes outperformed their respective Lipper category average for the most recent 10 year period1
up to 50% portfolio manager deferred compensation invested in own strategies, remainder in the firm and our strategies
up to 25% annual compensation contingent/deferred
37% longer portfolio manager industry experience versus industry average3
27 average years of portfolio manager industry experience
FIRM OVERVIEW 1
Emerging Markets
Hard Currency Local Currency Corporates
Non-Investment Grade Full Market High Yield Short Duration High Yield Bank Loans Distressed Debt
Investment Grade Core/Core Plus Opportunistic Credit Passive/Enhanced Index TIPS
Our Investment Platform
_______________________ All information as of March 31, 2013, except as otherwise noted. Firm data reflects collective data for the various affiliated investment advisers that are subsidiaries of Neuberger Berman Group LLC. 1. Includes $104 billion in Equity assets, $97 billion Fixed Income assets and $15 billion in Alternatives assets under management. 2. Committed Capital is a contractual agreement between an investor and a fund that obligates the investor to contribute that money to the fund as requested. The investor will generally make contributions over a period of time, typically over a number of years. 3. April 1, 2012 – March 31, 2013. Based on percentage of new institutional mandates.
STRATEGIC SOLUTIONS
Dynamic Real Return Dynamic Beta Navigator Strategic Partnerships
EQUITY AUM: $104 billion
FIXED INCOME AUM: $97 billion
U.S. Value (Small, Mid, Large) Growth (Small, Mid, Large) Core (Large, All Cap) Flexible (All Cap, All Styles)
EAFE All Cap Large Cap ACWI ex-US
Global Core Growth Thematic Risk Balanced
Specialty Socially Responsive REIT Equity Income MLPs
Emerging Markets Global Emerging Markets Greater China
ALTERNATIVES AUM / Committed Capital: $19 billion2 Private Equity Fund of Funds Co-Investment Secondaries Direct Investments Private Debt
Hedge Funds Fund of Funds Absolute Return Multi-Manager Long/Short Equity (U.S., Greater China) Global Tactical Asset Allocation
Global Aggregate Opportunistic
Tax-Exempt
Specialty Liability Driven Asset Backed Securities (ABS) Mortgages Currency Residential Mortgage Loan Risk Balanced Commodity Strategy
Cash & Short Duration
Approximately $216 billion assets under management1
CLIENTS SERVED
AUM by Client Organization
56% Pension Funds, Sovereign Wealth Funds and Other Institutions 24% Financial Institutions, RIAs and Advisors 20% Individuals, Families and their Charitable Organizations AUM by Client Domicile
77% U.S. 23% International New Institutional Mandates— Sales Channel Domicile3
64% Americas 16% Europe/Middle East 20% Asia-Pacific
FIRM OVERVIEW 2
Neuberger Berman Industry Average
Our People: Experienced and Long-Tenured Portfolio team members have invested together at the firm over market cycles
______________________ All information as of December 31 2012, except as otherwise noted. Firm data reflects collective data for the various affiliated investment advisers that are subsidiaries of Neuberger Berman Group LLC (the “firm”). See Additional Disclosures at the end of this piece, which are an important part of this presentation, for the definition of “investment professionals" and certain exclusions. Industry averages were compiled by Neuberger Berman based on portfolio manager industry experience data as reported to eVestment and includes separate accounts, mutual funds, and other commingled funds.
AVERAGE MANAGER INDUSTRY EXPERIENCE (Years)
Average of 12 years working together at Neuberger Berman
37% higher than industry average
26
19
2009 2010 2011 2012
Managing Directors 97% 94% 99% 96%
Senior Vice Presidents 95% 91% 95% 97%
RETENTION LEVELS FOR SENIOR INVESTMENT PROFESSIONALS
FIRM OVERVIEW 3
Attractive Performance
EQUITY AND FIXED INCOME1 ALTERNATIVES1
88% 95%79%
63%70%
53%
Equity & Fix ed Income Equity Fix ed Income
% AUM Ex ceeding Benchmark % AUM Ex ceeding Peer Group Median
10-Years – Period ended March 31, 2013 LONG-TERM OUTPERFORMANCE
_______________________ Sources: Neuberger Berman and FactSet. All information is as of March 31, 2013, except as otherwise noted. Firm data reflects the collective data for the various affiliated investment advisers that are subsidiaries of Neuberger Berman Group LLC. 1. AUM outperformance data is asset-weighted and based on the performance of the gross of fee firm’s traditional equity and fixed income strategies against their respective benchmarks and peer categories. Individual strategies may have experienced negative performance during certain periods of time. See Additional Disclosures for additional information regarding AUM outperformance and peer statistics (including 3-and 5-yr statistics) and alternatives performance statistics. Indexes are unmanaged and are not available for direct investment. Investing entails risks, including possible loss of principal. Past performance is no guarantee of future results.
PRIVATE EQUITY Annualized Net IRR: Since Inception, period ended September 30, 2012
PE FoF 16.0%PE Index 11.2%
NB SOF II 21.9%Secondary Index 12.6%NB Co-Invest Partners Fund I 8.7%Buyout Index 4.7%
FUND OF HEDGE FUNDS Annualized Net Returns: January 1, 2002 – March 31, 2013
NB Diversified Arbitrage 4.6%HFRI FOF: Conservative Index 3.1%Distressed Credit Fund Ltd 7.9%HFRI Distressed 8.8%Emerging Managers Sub-Set 6.4%HFRI FOF: Diversified Index 3.7%
FIRM OVERVIEW 4
FUND & TEAM OVERVIEW

For Professional Client Use Only
Our Style of Multi-Cap Equity
A DISTINCT APPROACH • Comprehensive cash flow analysis is key to unlocking a company’s potential value:
− Quantitative − Qualitative − Use of cash − Capital structure
• Seeks investments across three categories: special situations, opportunistic, and classic
DISCIPLINED BOTTOM-UP INVESTMENT PROCESS • Deep fundamental research • Rigorous valuation criteria and dynamic price limits • Quality management with demonstrated record of building shareholder value
MULTI-FACETED RISK MANAGEMENT • Security and portfolio level risk management • Rigorous buy/sell process seeks to maximise upside potential, minimise downside risk • Well-defined portfolio construction parameters • Independent analysis from firm’s portfolio risk team
EXPERIENCED INVESTORS • Senior Portfolio Manager Richard Nackenson has managed the strategy for over 10 years and has more than 20
years of industry experience • Supported by a dedicated investment team
Invests across the market-cap spectrum using an opportunistic approach focused on in-depth cash flow and capital structure analysis
_______________________ This material is intended as a broad overview of the Portfolio Manager’s style, philosophy and process and is subject to change without notice. Portfolio Manager’s views may differ from those of other Portfolio Managers as well as the views of Neuberger Berman LLC.
FUND & TEAM OVERVIEW 5

For Professional Client Use Only
Investment Philosophy and Approach
Companies that require tailored, specific valuation methodologies and investment research
• Unrecognised recovery prospects • Restructuring • Post bankruptcy • Spin-offs • New management teams • “Cold” issues and IPOs • Net asset value
Companies with proven management teams and consistent long-term performance • Consistent free cash flow • High return on invested capital • Financial stability • Shareholder-oriented management • Diversified sources of operating
income
Companies that have become inexpensive for a tangible reason that we believe is temporary, not permanent
• High free cash flow yield • Superior free cash flow growth • Improving return on invested capital • Balance sheet optimisation • Misunderstood by the market • “Underfollowed” companies
CLASSIC
SPECIAL SITUATIONS
OPPORTUNISTIC
US Multi Cap Opportunities
Fund
_______________________ This material is intended as a broad overview of the Portfolio Manager’s style, philosophy and process and is subject to change without notice. Portfolio Manager’s views may differ from those of other Portfolio Managers as well as the views of Neuberger Berman LLC.
We believe that a disciplined and focused approach driven by fundamental research can uncover investment opportunities across market capitalisation and style spectrums
FUND & TEAM OVERVIEW 6
For Professional Client Use Only
Core Investment Team
Richard S. Nackenson is a Managing Director of Neuberger Berman and Senior Portfolio Manager for the Neuberger Berman US Multi Cap Opportunities Fund. He joined the firm in 1999. Previously, Richard was a Securities Analyst with Appaloosa Management focusing on global investing across capital structures and industry sectors. He was a Senior Research Analyst with Pzena Investment Management and also an Associate with James D. Wolfensohn Incorporated. He began his career with McKinsey & Company. Richard earned both a BS, summa cum laude, and an MBA from the Wharton School at the University of Pennsylvania. He has over 20 years of industry experience.
Compelling valuations and strong cash flow generation at the company level are providing an attractive backdrop for equity investing. We believe we are in a stock picker’s market where stock selection becomes the key driver of portfolio returns.
—Richard S. Nackenson, US Multi Cap Opportunities Fund
Dedicated investment team headed by Richard S. Nackenson
Richard S. Nackenson Managing Director Senior Portfolio Manager • Broad experience across
investment disciplines, including deep value and distressed credit
• McKinsey background provides unique perspective on corporate strategies and business models
• 22 years of industry experience
Thomas O. Deutsch Vice President Securities Analyst • Analyst with responsibilities
across classic, opportunistic, and special situations
• 8 years of industry experience
FUND & TEAM OVERVIEW
_______________________ Staffing is subject to change without notice. As of March 31, 2013.
Steven M. Majocha, CFA Senior Vice President Securities Analyst • Senior analyst with
responsibilities across classic, opportunistic, and special situations
• 12 years of industry experience
Jason A. Menzin Senior Vice President Securities Analyst • Senior analyst with
responsibilities across classic, opportunistic, and special situations
• Experience includes high yield analysis
• 13 years of industry experience
7
For Professional Client Use Only
6 Analysts 7 Analysts
5 Analysts
5 Analysts 8 Analysts 11 Analysts 2 Analysts
CONSUMER ENERGY & UTILITIES
FINANCIAL SERVICES
HEALTH CARE INDUSTRIALS & MATERIALS
TECHNOLOGY, MEDIA & TELECOM
MACRO STRATEGIES
Extended Team Supported by The Global Equity Research Department
_______________________ Note: Staffing is subject to change without notice. As of March 31, 2013. The above are members of Neuberger Berman LLC’s Global Equity Research Department. Bolded names represent Analysts, unbolded names represent Associates. 43 research analysts and associates in total – 1 analyst maintains sector coverage in two different industries.
Cohesive team of 8 professionals supported by centralised buy-side sector analysts
FUND & TEAM OVERVIEW
CENTRALISED GLOBAL EQUITY RESEARCH DEPARTMENT – 44 PROFESSIONALS
Richard S. Nackenson Managing Director Senior Portfolio Manager
Thomas O. Deutsch Vice President Securities Analyst
Head Trader
Portfolio Analyst
Research Analyst
Trader
CORE INVESTMENT TEAM
EXTENDED INVESTMENT TEAM
Steven M. Majocha, CFA Senior Vice President Securities Analyst
Jason A. Menzin Senior Vice President Securities Analyst
8
INVESTMENT PROCESS
For Professional Client Use Only
# of Securities
Investment Process Overview Comprehensive, disciplined process focused on free cash flow analysis
IDEA GENERATION
• Dedicated team
• Centralised firm research resources
• Proprietary screens
• Field research network
IN-DEPTH RESEARCH • Determine performance
drivers: − Incorporate
company specific analysis and field research
• Detailed financial and
valuation models
• Storehouse of knowledge
COMPREHENSIVE FREE CASH FLOW ANALYSIS • Quantitative
• Qualitative
• Uses of free cash flow
INITIAL INVESTMENT UNIVERSE
• Publicly traded US
equities and related securities and American Depository Receipts (ADRs) across market capitalisations and sectors
• Filter on quantitative and qualitative metrics
PORTFOLIO CONSTRUCTION AND ONGOING RISK ANALYSIS • Well-defined portfolio
construction guidelines
• Multi-faceted risk management
FOCUSED PORTFOLIO
30 – 40 Securities
DISCIPLINED BUY/SELL PROCESS
_______________________ This material is intended as a broad overview of the Portfolio Manager’s style, philosophy and process and is subject to change without notice. Portfolio Manager’s views may differ from those of other Portfolio Managers as well as the views of Neuberger Berman LLC.
RISK MANAGEMENT
2,000+ 500 150 75
INVESTMENT PROCESS
30 - 40
9

For Professional Client Use Only
Resources for Idea Generation
• Core proprietary research conducted by dedicated investment team
• Focus on free cash flow analysis and return on invested capital
• Proprietary financial models and field research network
NACKENSON GROUP RESOURCES
FIRM RESEARCH RESOURCES Idea
Generation
_______________________ This material is intended as a broad overview of the Portfolio Manager’s style, philosophy and process and is subject to change without notice. Portfolio Manager’s views may differ from those of other Portfolio Managers as well as the views of Neuberger Berman LLC.
Investment ideas generated by portfolio team with access to centralised firm resources
• Meetings with company management teams
• Central global research department of 40+
senior sector analysts and associates
• Third party and specialised research
INVESTMENT PROCESS 10

For Professional Client Use Only
In-depth Research
COMPREHENSIVE FREE CASH FLOW ANALYSIS
How do we arrive at a numerical value for a company’s free cash flow? Utilise proprietary valuation models
• Income statement • Cash flow statement • Balance sheet • Quality of earnings • Determine appropriate valuation
methodology
Analyse key metrics • Free cash flow • Return on invested capital (ROIC) • Earnings growth • Revenue growth • Tangible book value • Net asset value
USE OF FREE CASH FLOW
QUALITATIVE ANALYSIS OF FREE CASH FLOW
QUANTITATIVE ANALYSIS OF FREE CASH FLOW
Analyse the quantitative and qualitative factors that influence core operating capabilities and valuation
How do we evaluate the quality of a company’s free cash flow? Conduct field research
• Industry associations • Customers and competitors • Operating line managers • Supply chain analysis • Empirical data sources
Evaluate management experience
• Articulation of corporate strategy • Implementation and execution • Track record of results
Assess industry structure and dynamics
• Sustainable competitive advantage • Change and evolution
How does a company allocate its free cash flow?
2 1
3
_______________________ This material is intended as a broad overview of the Portfolio Manager’s style, philosophy and process and is subject to change without notice. Portfolio Manager’s views may differ from those of other Portfolio Managers as well as the views of Neuberger Berman LLC.
INVESTMENT PROCESS 11

For Professional Client Use Only
Accumulate Cash/ Reduce Debt
Reinvest in
Core Business
Invest in High Return Expansion Projects
Buy Back Stock
Issue Dividends
Pursue Selective Acquisitions
Use of Free Cash Flow How a company uses its free cash flow is a key factor in our decision making process
BUSINESS MODEL CAPITAL STRUCTURE
_______________________ This material is intended as a broad overview of the Portfolio Manager’s style, philosophy and process and is subject to change without notice. Portfolio Manager’s views may differ from those of other Portfolio Managers as well as the views of Neuberger Berman LLC.
INVESTMENT PROCESS 12

For Professional Client Use Only
Portfolio Construction and Ongoing Risk Management
Construct multi-cap core portfolio • Diversified across three investment categories (Special Situations, Opportunistic, Classic)
Select best ideas • Consider risk/reward profile of each holding as well as
implications within the portfolio
Holdings and sector weightings • 30 - 40 holdings • Invests across the market capitalisation spectrum • Maximum initial position of 5% • Maximum sector weighting ±15% versus benchmark • Cash weighting of 0-5%
Ongoing monitoring • Automatic review if a position declines 10% relative to the
benchmark • Tracking error target: <7% • Barra metrics used to measure and manage risk • Review if management shifts strategy unexpectedly • Review if research indicates deteriorating fundmentals
MULTI-FACETED RISK MANAGEMENT PORTFOLIO CONSTRUCTION GUIDELINES
_______________________ This material is intended as a broad overview of the Portfolio Manager’s style, philosophy and process and is subject to change without notice. Portfolio Manager’s views may differ from those of other Portfolio Managers as well as the views of Neuberger Berman LLC.
MULTI-CAP CORE PORTFOLIO
Research-based Investment Process
Disciplined Portfolio
Construction
Ongoing Investigative Monitoring
Dynamic Price Limits
US MULTI CAP OPPORTUNITIES
FUND
Research-based Investment Process
Disciplined Portfolio
Construction
Ongoing Investigative Monitoring
Dynamic Price Limits
Our disciplined approach integrates proactive portfolio construction with comprehensive risk management
INVESTMENT PROCESS 13

For Professional Client Use Only
Disciplined Buy / Sell Process
BUY • New ideas generated by our research process • Portfolio construction • Entry point based on price
Our approach to buying and selling portfolio holdings seeks to maximise upside potential while minimising downside risk
BUY ADD
SELL REDUCE REDUCE • Position becomes large due to appreciation • Approaching price target • Raise capital to introduce new ideas
SELL • Price target achieved • Superior opportunities available • Research indicates deteriorating fundamentals • Limit downside
ADD • Fundamentals and risk/reward improve • Price target revised • Larger position warranted
_______________________ This material is intended as a broad overview of the Portfolio Manager’s style, philosophy and process and is subject to change without notice. Portfolio Manager’s views may differ from those of other Portfolio Managers as well as the views of Neuberger Berman LLC.
INVESTMENT PROCESS 14

FUND PERFORMANCE & PORTFOLIO CHARACTERISTICS

For Professional Client Use Only
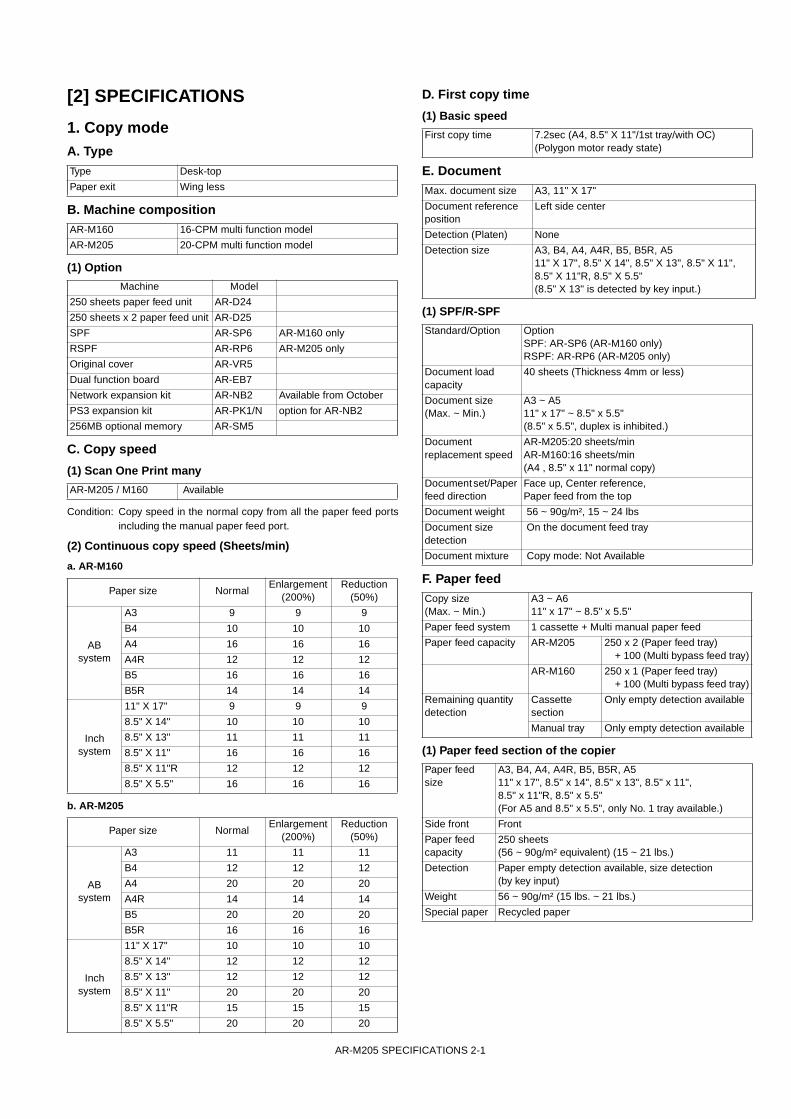
Fund Performance & Fund Facts
_______________________ Source: FactSet, Standard & Poor’s. The inclusion of any individual security in this document does not constitute a recommendation to invest. 1. Representative of the USD Class I Accumulating share class. 2. Benchmark = S&P 500 Index.
PERFORMANCE (USD)
FUND PERFORMANCE & PORTFOLIO CHARACTERISTICS
As of March 31, 2013
Fund1 Benchmark2
1 Month 4.70% 3.75%
3 Months 17.12% 10.61%
YTD 17.12% 10.61%
Since Inception* (TR) 29.30% 20.11%
Fund Family: A sub-fund of the Neuberger Berman Investment Fund plc Portfolio Manager: Richard Nackenson
Benchmark: S&P 500 Index Morningstar Category: US Flex Cap Equity
Inception Date: June 28, 2012* Base Currency: USD
Valuation: Daily Trading Deadline: 3.00 pm Dublin Time
Fund Structure/Domicile: UCITS / Dublin Regulator: Central Bank of Ireland
FUND FACTS
Boeing Co. 4.10% Berkshire Hathaway Inc. Cl B 3.83% Hanesbrands Inc. 3.60% CSX Corp. 3.58% Bed Bath & Beyond Inc. 3.55% Cenovus Energy Inc. 3.48% Omnicom Group Inc. 3.47% JPMorgan Chase & Co. 3.45% Range Resources Corp. 3.43% Procter & Gamble Co. 3.40%
TOP 10 HOLDINGS
15

For Professional Client Use Only
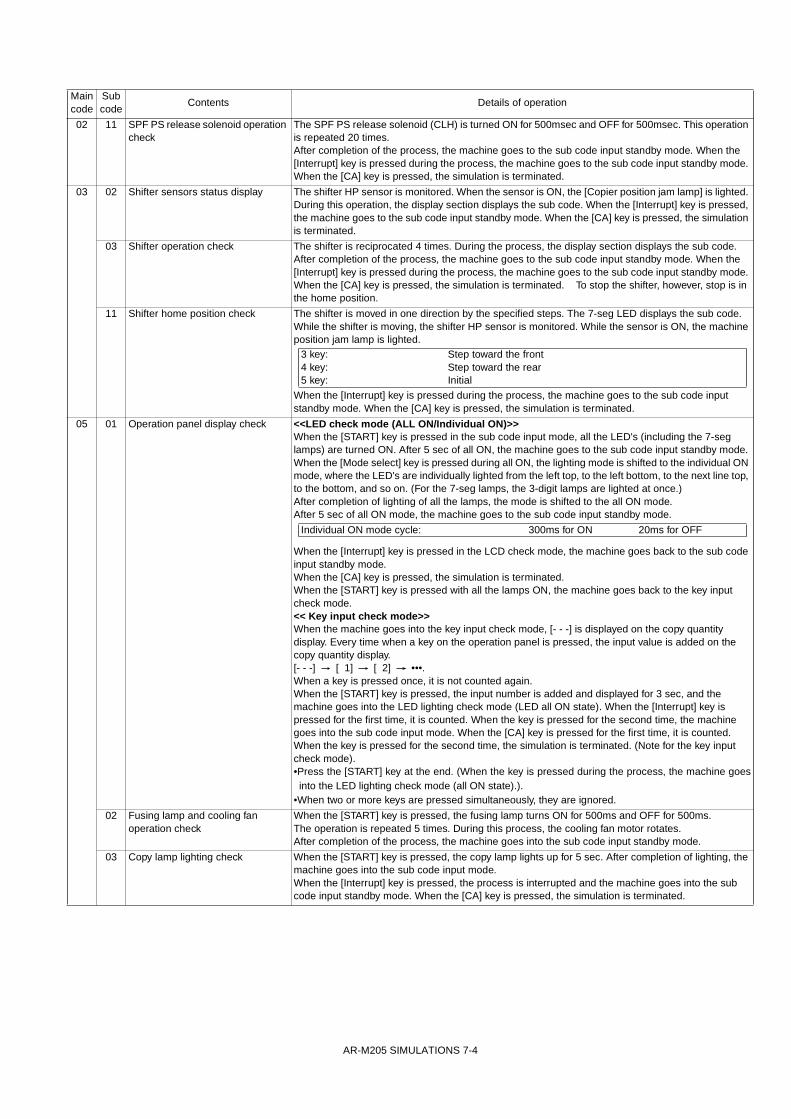
Fund Sector Weightings
_______________________ Source: FactSet, Standard & Poor’s. Sector weightings are as of the date noted and are subject to change without notice. Weightings shown are equity only and excluding cash.
CURRENT SECTOR WEIGHTINGS
As of March 31, 2013
20.5
12.0
14.1
5.9 6.0
0.0
3.3
11.0 10.9
12.5
10.1
18.0
3.5
11.1
19.7
7.5
3.4 3.0
15.9
11.6
0
5
10
15
20
25
ConsumerDiscretionary
Consumer Staples Energy Financials Health Care Industrials InformationTechnology
Materials Telecommunications Utilities
% of Total Market Value
NB US Multi Cap Opportunities Fund S&P 500 Index
FUND PERFORMANCE & PORTFOLIO CHARACTERISTICS 16

For Professional Client Use Only
2.5
13.5
9.4
1.4
6.4
23.6
54.5
10.2
30.334.2
14.1
0.00
10
20
30
40
50
60
$0 - 2B $2 - 5B $5 - 10B $10 - 20B $20 - 50B > $50B
% of Total Market Value
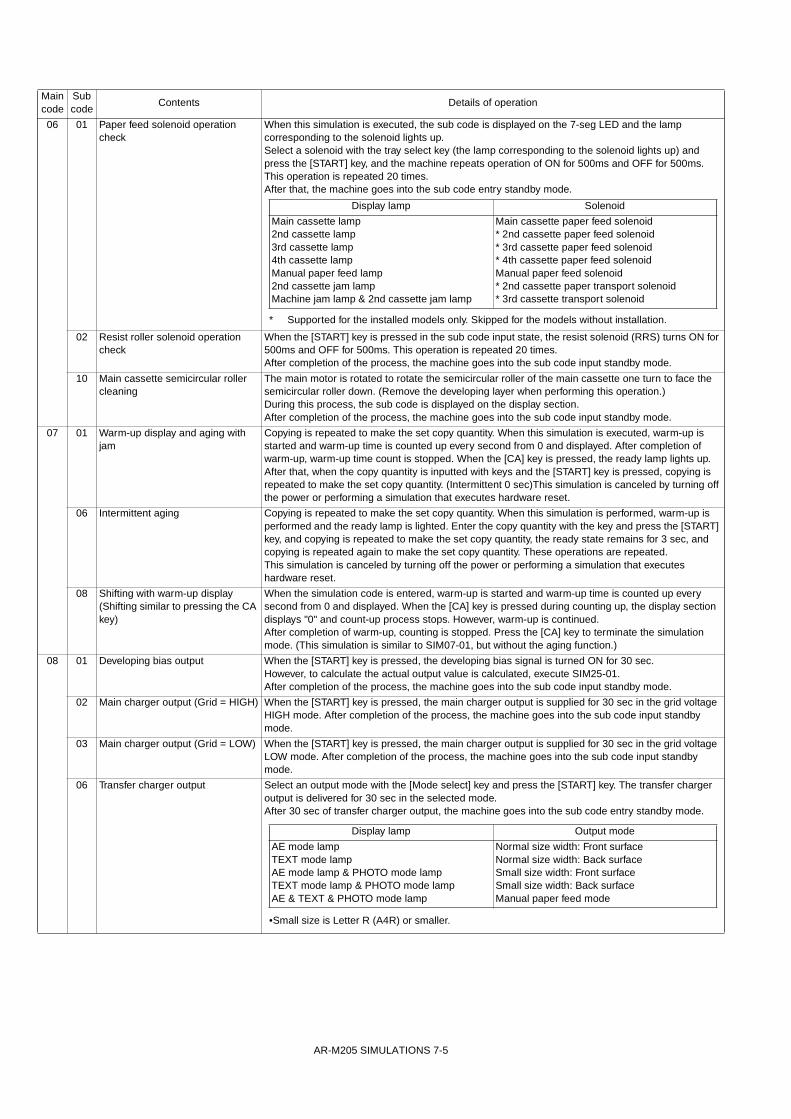
NB US Multi Cap Opportunities Fund S&P 500 Index
Fund Market Cap Allocation
_______________________ Source: FactSet, Standard & Poor’s. Market cap weightings are as of the date noted and are subject to change without notice. Weightings shown are equity only and excluding cash.
FUND ALLOCATION VS. S&P 500 INDEX
As of March 31, 2013
FUND PERFORMANCE & PORTFOLIO CHARACTERISTICS 17

For Professional Client Use Only
Fund Top Holdings Compared to Benchmark (Quarterly)
_______________________ Source: FactSet, Standard & Poor’s. The inclusion of any individual security in this document does not constitute a recommendation to invest. 1. Holdings are subject to change, without notice. 2. Benchmark = S&P 500 Index.
FUND TOP 10 HOLDINGS % BENCHMARK TOP 10 HOLDINGS %
Benchmark2 Fund1 Difference
Apple Inc. 2.97% 2.48% -0.49%
Exxon Mobil Corp. 2.89% 0.00% -2.89%
General Electric Co. 1.72% 0.00% -1.72%
Chevron Corp. 1.65% 0.00% -1.65%
Johnson & Johnson 1.63% 0.00% -1.63%
International Business Machines Corp. 1.60% 0.00% -1.60%
Microsoft Corp. 1.54% 0.00% -1.54%
Google Inc. Cl A 1.52% 0.00% -1.52%
Procter & Gamble Co. 1.51% 3.40% 1.89%
Pfizer Inc. 1.48% 3.32% 1.84%
As of March 31, 2013
FUND PERFORMANCE & PORTFOLIO CHARACTERISTICS
Fund1 Benchmark2 Difference
Boeing Co. 4.10% 0.42% 3.68%
Berkshire Hathaway Inc. Cl B 3.83% 1.36% 2.47%
Hanesbrands Inc. 3.60% 0.00% 3.60%
CSX Corp. 3.58% 0.18% 3.40%
Bed Bath & Beyond Inc. 3.55% 0.10% 3.45%
Cenovus Energy Inc. 3.48% 0.00% 3.48%
Omnicom Group Inc. 3.47% 0.11% 3.36%
JPMorgan Chase & Co. 3.45% 1.30% 2.15%
Range Resources Corp. 3.43% 0.09% 3.34%
Procter & Gamble Co. 3.40% 1.51% 1.89%
18

LONG-TERM PERFORMANCE
For Professional Client Use Only
Private Asset Management – The Nackenson Group Investment Performance – As of March 31, 2013
___________________________ Please see attached disclosures, which are a required part of this presentation. Past performance is no guarantee of future results
Annualized Rates of Return (%) (for periods ended March 31, 2013)
Since Inception
1Q13 YTD 1 Year 3 Years 5 Years 10 Years 12/31/89Total Portfolio Return (Gross of Fees) 16.66 16.66 23.27 13.35 5.64 9.04 9.67Total Portfolio Return (Net of Fees) 16.42 16.42 22.06 12.15 4.50 7.94 8.77Equity Only Return (Gross of Fees) 17.02 17.02 24.08 13.54 3.69 10.45 11.19S&P 500 Index 10.61 10.61 13.96 12.67 5.81 8.53 8.93
Annual Rates of Return (%) (for periods ended December 31)
2012 2011 2010 2009 2008 2007 2006 2005 2004 2003 2002Total Portfolio Return (Gross of Fees) 18.42 -0.86 13.06 21.18 -34.79 16.28 15.93 9.92 11.52 15.82 -12.11Total Portfolio Return (Net of Fees) 17.19 -2.01 11.85 19.89 -35.55 14.96 14.69 8.94 10.68 14.94 -12.75Equity Only Return (Gross of Fees) 19.35 -1.64 14.05 30.00 -46.69 19.32 19.90 12.85 16.43 27.81 -20.99S&P 500 Index 16.00 2.11 15.06 26.46 -37.00 5.49 15.79 4.91 10.88 28.68 -22.10
2001 2000 1999 1998 1997 1996 1995 1994 1993 1992 1991Total Portfolio Return (Gross of Fees) -3.76 0.69 12.86 20.38 33.94 21.94 32.03 2.39 9.50 7.07 24.50Total Portfolio Return (Net of Fees) -4.52 -0.01 12.16 19.34 33.13 20.89 31.15 1.63 8.74 6.32 23.66Equity Only Return (Gross of Fees) -4.73 -2.03 17.54 22.13 38.49 26.79 46.16 3.92 11.60 7.05 45.38S&P 500 Index -11.88 -9.11 21.04 28.58 33.36 22.96 37.58 1.32 10.08 7.62 30.47
1990Total Portfolio Return (Gross of Fees) -1.98Total Portfolio Return (Net of Fees) -2.18Equity Only Return (Gross of Fees) -7.92
S&P 500 Index -3.11
LONG-TERM PERFORMANCE 19

For Professional Client Use Only
Representative Portfolio Investment Performance Multi-Cap Opportunities Representative Portfolio (Gross of fees) – As of March 31, 20131
___________________________ Source: Neuberger Berman Management LLC.®
Performance data quoted represent past performance, which is no guarantee of future results. The investment return and principal value of an investment will fluctuate so that an investor’s shares, when redeemed, may be worth more or less than their original cost.
1. Performance data quoted displays a representative portfolio, inception date October 31, 2003. This performance is included to show the track record of the strategy and is included for illustrative purposes only, and will not necessarily represent the intended portfolio. The information presented is supplemental to a GIPS-compliant presentation. A complete list and description of all firm composites is available upon request.
2. The S&P 500 Index consists of 500 stocks chosen for market size, liquidity, and industry group representation. It is a market value weighted index (stock price times number of shares outstanding), with each stock’s weight in the Index proportionate to its market value. The "500" is one of the most widely used benchmarks of U.S. equity performance. As of September 16, 2005, S&P switched to a float-adjusted format, which weights only those shares that are available to investors, not all of a company’s outstanding shares. The value of the index now reflects the value available in the public markets. Please note that indices do not take into account any fees and expenses of investing in the individual securities that they track, and that individuals cannot invest directly in any index. Data about the performance of these indices are prepared or obtained by Neuberger Berman Management LLC. and include reinvestment of all dividends and capital gain distributions. The Fund may invest in many securities not included in the above-described indices.
LONG-TERM PERFORMANCE
Calendar Year Returns 2013 YTD 2012 2011 2010 2009 2008 2007 2006 2005 2004 20031
Multi-Cap Opportunities Representative Portfolio (Gross of fees)1 17.26 22.38 -1.60 15.93 27.10 -42.49 24.21 20.96 17.25 20.61 7.67
S&P 500 Index2 10.61 16.00 2.11 15.06 26.46 -37.00 5.49 15.79 4.91 10.88 6.17
17.26
25.09
15.06
5.49
11.2910.6113.96 12.68
5.81 6.52
0
5
10
15
20
25
30
YTD 2013 1-year 3-year 5-year Since Inception (10/31/2003)
Annualised Return %
Multi-Cap Opportunities Representative Portfolio S&P 500 Index
20
HISTORICAL CATEGORY & CAPITALISATION WEIGHTINGS

For Professional Client Use Only
0%
10%
20%
30%
40%
50%
60%
70%
80%
90%
100%
Dec-03 Dec-04 Dec-05 Dec-06 Dec-07 Dec-08 Dec-09 Dec-10 Dec-11 Dec-12
Historical Investment Category Weightings
_______________________ Source: FactSet and Neuberger Berman. Data quoted represents a composite portfolio of separately managed accounts and funds (US mutual fund inception date December 21, 2009 / US Multi Cap Opportunities Fund (UCITS) inception date June 28, 2012), and is included for illustrative purposes only and will not necessarily accurately represent the intended portfolio.
Investment category allocations change actively as a function of the market environment
HISTORICAL CATEGORY & CAPITALISATION WEIGHTINGS
Opportunistic
Special Situations Max 42% (3Q 2007) Min 14% (4Q 2009)
Opportunistic Max 50% (4Q 2010) Min 16% (1Q 2008)
Classic Max 58% (2Q 2004) Min 27% (2Q 2006)
Special Situations
Classic
The chart shows what % of each category has been in the Multi-Cap Opportunities Strategy, on a quarterly basis, since it has been managed by Richard Nackenson.
21
For Professional Client Use Only
0%
10%
20%
30%
40%
50%
60%
70%
80%
90%
100%
Dec-03 Dec-04 Dec-05 Dec-06 Dec-07 Dec-08 Dec-09 Dec-10 Dec-11 Dec-12
Historical Market Capitalisation Weightings Market capitalisation weightings change actively as a function of the market environment
_______________________ Source: FactSet and Neuberger Berman. Data quoted represents a composite portfolio of separately managed accounts and funds (US mutual fund inception date December 21, 2009 / US Multi Cap Opportunities Fund (UCITS) inception date June 28, 2012), and is included for illustrative purposes only and will not necessarily accurately represent the intended portfolio.
HISTORICAL CATEGORY & CAPITALISATION WEIGHTINGS
$0-2 Billion Max 19% (4Q 2008) Min 3% (3Q 2010)
$2-10 Billion Max 51% (2Q 2006) Min 14% (4Q 2008)
>$50 Billion Max 38% (4Q 2009) Min 14% (1Q 2012)
$10-$50 Billion Max 46% (4Q 2012) Min 16% (4Q 2007)
$0-$2 Billion
$2-$10 Billion
$10 - $50 Billion
> $50 Billion
22
BIOGRAPHIES
For Professional Client Use Only
Richard S. Nackenson is a Managing Director of Neuberger Berman and Senior Portfolio Manager for the Neuberger Berman US Multi Cap Opportunities Fund. He joined the firm in 1999. Previously, Richard was a Securities Analyst with Appaloosa Management focusing on global investing across capital structures and industry sectors. He was a Senior Research Analyst with Pzena Investment Management and also an Associate with James D. Wolfensohn Incorporated. He began his career with McKinsey & Company. Richard earned both a BS, summa cum laude, and an MBA from the Wharton School at the University of Pennsylvania. He has 22 years of industry experience. Steven M. Majocha, CFA is a Senior Vice President of Neuberger Berman and Senior Securities Analyst for the Neuberger Berman US Multi Cap Opportunities Fund. He joined the firm in 2007. Previously, he was an equity securities associate for Citigroup Investment Research. Steven holds an MBA from the University of Virginia and a BS from Drexel University, where he graduated magna cum laude. He has 12 years of industry experience. Jason A. Menzin is a Senior Vice President of Neuberger Berman and Senior Securities Analyst for the Neuberger Berman US Multi Cap Opportunities Fund. He joined the firm in 2002. Previously, he worked for Lipper & Company, where he was a high yield bond analyst. Jason holds a BA, summa cum laude, from Columbia University. He has 13 years of industry experience. Thomas O. Deutsch is a Vice President of Neuberger Berman and Securities Analyst for the Neuberger Berman US Multi Cap Opportunities Fund. He joined the firm in 2005. Tom holds a BA in Economics and Biology, magna cum laude, from Colby College. He has 8 years of industry experience.
Biographies
BIOGRAPHIES
Portfolio Management Team
_______________________ Staffing is subject to change without notice. As of March 31, 2013.
23
STOCK EXAMPLES
For Professional Client Use Only
1.11.3
0.9
1.31.1 1.1
0.9
0.5
$0.0
$0.5
$1.0
$1.5
2009 2010 2011 2012
Billions
Available Free Cash Flow Shareholder Return (Buyback & Div idend)
CONSISTENT IMPROVEMENT IN PROFITABILITY
STEADY FREE CASH FLOW RETURN TO SHAREHOLDERS
Investment Example: Activision Blizzard (ATVI)
Business • Video game publisher with the best franchises in the industry:
Call of Duty, World of Warcraft, Skylanders Investment Rationale • Consistent and recurring cash flow from Call of Duty and its
subscription based World of Warcraft franchise • Improving margins as business shifts to digital sales • Transition to next-generation game console should support
industry growth • Management is exploring ways to reduce Vivendi’s stake
(Vivendi currently owns 60% of ATVI) Capital Allocation • Strong commitment to shareholder return: ATVI has historically
returned approximately 100% of available FCF in the form of share repurchases and dividends
• $4.00 of net cash per share • Potential for highly accretive share repurchase Valuation • Price-to-Earnings (ex cash): 10.0x FY2014E • EV/EBITDA: 7.0x FY2014E • FCF Yield (ex cash): 9.6% FY2014E
Special Situation investment (Market Cap = $16.2bn)
_______________________ Source: FactSet; Company Reports. All information as of March 31, 2013. For illustrative purposes only. The inclusion of any individual security in this document does not constitute a recommendation to invest.
25.8%28.5%
30.3%
34.0%
20%
25%
30%
35%
2009 2010 2011 2012Operating Margin (Non-GAAP)
Conserving cash for potential one-time
transaction
STOCK EXAMPLES 24
For Professional Client Use Only
$1,503
$982
$982 $4,695
$1,228
$0
$1,000
$2,000
$3,000
$4,000
$5,000
Share Buy back Special Div idend$2.00/share
Special Div idend$2.50/share*
Special Div idend$2.00/share*
Cumulativ eReturn
Millions
POSITIVE ADMISSIONS TRENDS DRIVING STEADY REVENUE GROWTH
CAPITAL RETURN TO SHAREHOLDERS EXCEEDS 30% OF MARKET CAP IN 15 MONTHS
Investment Example: HCA Holdings (HCA)
Business • HCA is the largest for-profit hospital system in the United States,
operating over 160 hospitals and 100 surgery centers Investment Rationale • Admissions trends among best in industry • Beneficiary of expanded coverage under health care reform:
Potential for 30+ Million uninsured to be covered starting in 2014 • Consistent operating income and free cash flow profile • Proven management team with a strong commitment to
shareholder return Capital Allocation • Repurchased 16% of common stock from BAC @ $18.61; added
approximately $0.50 per share to 2012 EPS • Issued three special dividends in 2012, totaling $6.50 per share
(22.3% effective yield) • Company has a full pipeline of acquisition candidates Valuation • Price-to-Earnings: 10.8x FY2014E • EV/EBITDA: 6.9x FY2014E • FCF Yield: 10.8% FY2014E
Special Situation investment (Market Cap = $18.0bn)
_______________________ Source: FactSet; Company Reports. All information as of March 31, 2013. For illustrative purposes only. The inclusion of any individual security in this document does not constitute a recommendation to invest. * Estimated dividend payout in the fourth quarter of 2012, based on 1Q 2012 dividend payout amount.
0%
2%
4%
6%
8%
10%
3Q10 4Q10 1Q11 2Q11 3Q11 4Q11 1Q12 2Q12 3Q12 4Q12
Adjusted Admissions Revenue Growth
3Q 2011 1Q 2012 4Q 2012 4Q 2012
STOCK EXAMPLES 25
For Professional Client Use Only
Investment Example: Great Wolf Resorts (WOLF)
Business • Indoor waterpark resort owner and operator delivering a fully-
integrated, branded vacation experience Investment Rationale • Over-levered / under-followed stock created a special
situation opportunity • Net debt/EBITDA >6.5x, FCF >25% • Property visits and due diligence reinforced our view that
EBITDA could grow, and debt level was manageable • Lack of new supply in lodging industry supported our thesis of
RevPar growth • Majority of debt was tied directly to properties with little recourse
back to the parent Capital Allocation • Cash flow used for debt reduction; covenants significantly limited
management’s ability to spend FCF Valuation • EV/EBITDA: 7.0x vs. 9.0x for theme park operators and 10.0–
12.0x for lodging companies
Special Situation investment (Market Cap = $0.2bn)
_______________________ Source: FactSet; Company Reports. All information as of March 31, 2013. For illustrative purposes only. The inclusion of any individual security in this document does not constitute a recommendation to invest.
LIFECYCLE OF INVESTMENT
$2.00
$3.00
$4.00
$5.00
$6.00
$7.00
$8.00
$9.00
Dec-10 Mar-11 Jun-11 Sep-11 Dec-11 Mar-12
Price
WOLF Delisted
Initiated WOLF
Position
STOCK EXAMPLES 26
For Professional Client Use Only
Investment Example: Great Wolf Resorts (WOLF) (Continued) Deal timeline
_______________________ Source: FactSet; Company Reports. All information as of March 31, 2013. For illustrative purposes only. The inclusion of any individual security in this document does not constitute a recommendation to invest.
$3.50
$4.00
$4.50
$5.00
$5.50
$6.00
$6.50
$7.00
$7.50
$8.00
$8.50
March
1, 2
012
March
6, 2
012
March
11,
201
2
March
16,
201
2
March
21,
201
2
March
26,
201
2
March
31,
201
2
April
5, 2
012
April
10, 2
012
April
15, 2
012
April
20, 2
012
April
25, 2
012
April
30, 2
012
Price
March 13, 2012 WOLF / Apollo issue joint press release announcing $5.00/sh transaction
March 14, 2012 R.Nackenson quoted in WSJ article, “Great Wolf Investors Howl for Higher Bid.”
March 22, 2012 R.Nackenson quoted in Bloomberg article, “Leon Black’s Bid Gets No Respect as Great Wolf Surges: Real M&A.”
April 04, 2012 KSL submits $6.25/sh rival bid
April 06, 2012 WOLF / Apollo issue joint press release announcing $6.75/sh revised offer
April 08, 2012 KSL submits $7.00/sh bid
April 18, 2012 WOLF / Apollo issue joint press release announcing agreement on $7.00/sh offer
April 19, 2012 KSL submits $7.25/sh bid
April 20, 2012 WOLF / Apollo issue joint press release announcing agreement on $7.85/sh offer KSL notifies company they will not bid further
May 04, 2012 Deal Complete; stock delisted
STOCK EXAMPLES 27
For Professional Client Use Only
Investment Example: Hanesbrands Inc. (HBI)
Business • Global consumer goods company with a portfolio of leading apparel
brands • Limited fashion risk mitigates key retail risk factor • Large global apparel essentials company with a dual hemisphere
manufacturing capability; provides cost advantage Investment Rationale • Under-recognised earnings and free cash flow potential due to a
sharp rise in cotton cost − 2012 FCF above $500 Million vs $78 Million in 2011
• Normalisation of costs, coupled with improved pricing enables improved operating profitability longer-term
• HBI expects to repay $800 Million of debt in 2012 and 2013, further reducing net leverage to 1.5x (was 4.3x in 2010)
Capital Allocation • Commitment to debt pay-down
− Continued transfer of enterprise value from debt to equity − Interest cost reduction accretive to earnings and cash flow
• Initiated dividend of $0.80 per share; 1.8% yield Valuation • Price-to-Earnings: 11.6x FY2014E • FCF yield: 8.6% FY2014E
Opportunistic investment (Market Cap = $4.5bn)
_______________________ Source: FactSet; Company Reports. All information as of March 31, 2013. For illustrative purposes only. The inclusion of any individual security in this document does not constitute a recommendation to invest.
STEADY IMPROVEMENT IN CAPITAL STRUCTURE
DECLINE IN COTTON PRICE SUPPORTIVE TO EARNINGS AND FREE CASH FLOW
$0.50
$1.00
$1.50
$2.00
$2.50
Mar
-10
Jun-
10
Sep-
10
Dec-
10
Mar
-11
Jun-
11
Sep-
11
Dec-
11
Mar
-12
Jun-
12
Sep-
12
Dec-
12
Mar
-13
Price ($/lbs)
4.3x3.7x
2.6x1.5x
0.0x1.0x2.0x3.0x4.0x5.0x
2010 2011 2012 2013ELeverage (Net Debt / EBITDA)
STOCK EXAMPLES 28
For Professional Client Use Only
Investment Example: CSX Corporation (CSX)
Business • Class I U.S. Railroad company; operates in a duopolistic market
with NSC, providing pricing power • Heavy regulation / capital-intensity, creates high barriers to entry Investment Rationale • Opportunity as share price was negatively affected by a
reduction in coal volumes due to building inventories at utility customers
• Coal decline driven by factors we feel will normalise: record warm winter weather, record-low gas prices and regulatory uncertainty
• Steady growth continues outside of utility coal • Strong secular support as rails have proven to be more cost
effective and environmentally friendly than trucking • Management targets an operating margin of 35% vs. 30% today Capital Allocation • Committed to returning a majority of its FCF to shareholders
− Management completed its $1 billion share repurchase program in 2012
− 17% increase in annual dividend announced in May, 2012 Valuation • Price-to-Earnings: 11.9x FY2014E • EV/EBITDA: 6.8x FY2014E
Opportunistic investment (Market Cap = $25.1bn)
_______________________ Source: FactSet; Company Reports. All information as of March 31, 2013. For illustrative purposes only. The inclusion of any individual security in this document does not constitute a recommendation to invest.
CSX UTILITY COAL VOLUMES (TONS)
STEADY IMPROVEMENT IN OPERATING RATIO; EXPECTED TO EXPAND TO 65% BY 2015
28.1
19.9 19.3
30.2 31.1
20.216.9
25.428.5
26.8
05
101520253035
3Q10 4Q10 1Q11 2Q11 3Q11 4Q11 1Q12 2Q12 3Q12 4Q12
Millions
75.6%71.1%
65.0%
77.7%
87.8%
40%
50%
60%
70%
80%
90%
100%
2004 2006 2008 2010 2015E
STOCK EXAMPLES 29
For Professional Client Use Only
Investment Example: Boeing (BA)
Business • Boeing offers products and services in both the aerospace (60%
of sales) and the defense (40% of sales) industries − Duopoly aerospace industry provides stable pricing dynamics − Defense business focused on higher-value verticals, and
generates ~1/3 of revenues internationally Investment Rationale • Long-cycle business provides visible earnings stream: total
contracted backlog valued at $372 billion • Significant earnings and cash flow growth as aircraft production
rates increase, and R&D expenses decline • Non-cash pension accounting understates operating earnings
and cash flow Capital Allocation • Strong balance sheet • Increased divided 10%; 2.3% dividend yield • Announced 2013 share repurchase plan of $1.5 - $2.0 billion Valuation • Price-to-Earnings: 12.2x FY2014E • EV/EBITDA: 6.7x FY2014E • FCF Yield: 10.0% FY2014E
Classic investment (Market Cap = $64.9bn)
_______________________ Source: FactSet; Company Reports. All information as of March 31, 2013. For illustrative purposes only. The inclusion of any individual security in this document does not constitute a recommendation to invest.
CONTRACTED BACKLOG
$250
$275
$300$325
$350
$375
$400
1Q 0
9
2Q 0
9
3Q 0
9
4Q 0
9
1Q 1
0
2Q 1
0
3Q 1
0
4Q 1
0
1Q 1
1
2Q 1
1
3Q 1
1
4Q 1
1
1Q 1
2
2Q 1
2
3Q 1
2
4Q 1
2
Billions
STEP-UP IN FREE CASH FLOW AS PRODUCTION RATES INCREASE AND DEVELOPMENT COSTS DECLINE
$2.75
$8.64
$2.00
$4.00
$6.00
$8.00
$10.00
2011 2014E
47% CAGR
STOCK EXAMPLES 30

For Professional Client Use Only
-20%
-10%
0%
10%
20%
30%
1Q 0
9
2Q 0
9
3Q 0
9
4Q 0
9
1Q 1
0
2Q 1
0
3Q 1
0
4Q 1
0
1Q 1
1
2Q 1
1
3Q 1
1
4Q 1
1
1Q 1
2
2Q 1
2
3Q 1
2
4Q 1
2
BBBY Retail Sales, Home Furnishings
Investment Example: Bed Bath & Beyond (BBBY)
Business • Best in class merchandiser with strong store concepts: Bed Bath
& Beyond, buybuy Baby, Christmas Tree Shops, Harmon Stores, and World Market
Investment Rationale • Industry leading same-store sales trends and profitability • Unit growth opportunities available across all concepts • Underappreciated accretion to earnings from recent acquisitions • Beneficiary of a recovery in the US housing market • Consistent and growing free cash flow generation Capital Allocation • Strong Balance Sheet: approximately $4.00 net cash per share • Repurchased over $1 Billion in 2012; reduced share count by 5% • Select acquisitions (World Market) should contribute to earnings
growth next year Valuation • Price-to-Earnings (ex cash): 10.9x FY2014E • EV/EBITDA: 6.7x FY2014E • FCF Yield (ex cash): 7.9% FY2014E
Classic investment (Market Cap = $14.6bn)
_______________________ Source: FactSet; Company Reports; Bernstein; US Census Bureau. All information as of March 31, 2013. For illustrative purposes only. The inclusion of any individual security in this document does not constitute a recommendation to invest.
SALES GROWTH HAS EXCEEDED INDUSTRY TRENDS
RESULTING IN STEADY MARKET SHARE GAINS
10.3%10.6%
11.6%12.0%
12.4% 12.4%
10%
11%
12%
13%
2007 2008 2009 2010 2011 2012
BBBY Market Share of US Home Furnishings
STOCK EXAMPLES 31
For Professional Client Use Only
13.0x 11.4x
1.5%
9.2x
6.0x
2.4%
02468
101214
P/E (Fwd) EV/EBITDA (TTM) Div idend Yield (% )
3Q 2012 1Q 2013
$350
$400
$450
$500
$550
$600
$650
$700
$750
3/12 4/12 5/12 6/12 7/12 8/12 9/12 10/12 11/12 12/12 1/13 2/13 3/13
Price/Share
$48
$50
$52
$54
$56
$58
$60
$62
$64
FY 2014 EPS
Price FY 2014 EPS
Investment Example: Apple Inc. (AAPL)
Business • Leading consumer products company with strong track record of
innovation • Highest customer retention rates across key product lines • Secular growth industry with large addressable market Investment Rationale • Underperformance over last 6 months, near 52 week low
− AAPL returned (36.3%) since 9/19/12 vs. +8.7% for S&P 500 • Sentiment on the stock has turned decidedly negative
− 2013 EPS estimates 1 year ago: 45 increased, 0 reduced − 2013 EPS estimates today: 2 increased, 48 reduced
• Earnings expectations have been revised 20% lower • At current valuation, we believe the stock price is not reflecting future
product innovation and capital structure potential Capital Allocation • Dividend increased by 15% to $12.20 per share annually • $60 Billion share buyback authorisation • $153 per share of net cash on the balance sheet • Management plans to return $100 Billion to shareholders by 2015 Valuation • Price-to-Earnings: 9.2x FY2013E • FCF yield: 10.3% FY2013E
Classic investment (Market Cap = $415.6bn)
_______________________ Source: FactSet; Company Reports. All information as of March 31, 2013. For illustrative purposes only. The inclusion of any individual security in this document does not constitute a recommendation to invest.
INITIATED POSTION AFTER REDUCTION IN EPS ESTIMATES
VALUATION NOW VERSUS PEAK
Initiated starter
position
STOCK EXAMPLES 32
DISCLAIMER

For Professional Client Use Only
Investment Performance Disclosure Statement The Nackenson Group – Inception 12/31/89
Benchmark Description • The benchmark is the S&P 500 Index, which is designed to measure the domestic equity market
performance. The benchmark is calculated on a total return basis and is market cap weighted and unmanaged. Additional disclosures for complete benchmark descriptions are available upon request.
Reporting Currency • Valuations are computed and performance is reported in U.S. dollars Fees • Effective January 1, 2006 accounts in the composite were moved to an all – inclusive fee schedule which
includes investment advisory fees, trading expenses, custody fees, and other administrative fees. Composite Total Return (Gross of Fees) is presented before fees and after the deduction of trading expenses. Composite Total Return (Net of Fees) is presented after the deduction of fees and trading expenses. Composite Equity Only Return (Gross of Fees) excludes the performance of any cash or fixed income instruments that may also be held in the portfolio. Composite Equity Only Return (Gross of Fees) does not reflect the deduction of fees and beginning January 1, 2006 does not reflect the deduction of trading expenses. Composite Equity Only Return is presented as supplemental information and is not a required part of this presentation.
Fee Schedule • The annual investment advisory fee, payable quarterly, for each portfolio with a market value of less than
$10mn is: 1.5% of the first $2.5mn of market value; 1.4% of the next $2.5mn of market value; 1.3% of the next $2.5mn of market value; 1.2% of the next $2.49mn. For each portfolio with a market value, equal to, or greater than $10mn, the annual fee payable quarterly is: 1.25% of the first $10mn of market value and 0.9% of the remaining value of market value.
Internal Dispersion • Internal dispersion is calculated using the asset weighted standard deviation of annual gross returns of
those portfolios that were in the composite for the entire year. Annualized Standard Deviation • The three-year annualized standard deviation measures the variability of the composite and the benchmark
returns over the preceding 36-month period. The standard deviation is not required for periods prior to 2011.
Compliance Statement • Neuberger Berman Group LLC (“NB”) claims compliance with the Global Investment Performance Standards
(GIPS®) and has prepared and presented this report in compliance with the GIPS standards. NB has been independently verified for the periods January 1, 1997 through December 31, 2011. The verification report is available upon request. Verification assesses whether (1) the firm has complied with all the composite construction requirements of the GIPS standards on a firm-wide basis and (2) the firm’s policies and procedures are designed to calculate and present performance in compliance with the GIPS standards. Verification does not ensure the accuracy of any specific composite presentation.
Definition of the Firm • The firm is defined as Neuberger Berman Group LLC (“NB”, “Neuberger Berman” or the “Company”). NB is
comprised of Neuberger Berman LLC, Neuberger Berman Management LLC, Neuberger Berman Fixed Income LLC, NB Alternative Fund Management LLC, Neuberger Berman Europe Ltd., Neuberger Berman Asia Ltd, Neuberger Berman National Trust Company N.A., Neuberger Berman Trust Company of Delaware N.A., NB Alternatives Advisers LLC and NB Alternative Investment Management LLC. The firm definition above is effective December 31, 2011. Prior to that day, there were two firm definitions, Neuberger Berman LLC (“NBLLC”) and Neuberger Berman Fixed Income (“NBFI”). The firm was redefined to adopt the broadest, most meaningful definition of the firm and to align the firm definition to how it now holds itself out to the public.
Policies • Policies for valuing portfolios, calculating performance, and preparing compliant presentations are available
upon request. Composite Description • The Nackenson Group (“Composite”), formerly known as The Ganek Nackenson Group, performance schedule
is provided as supplemental information to the firm composite. From January 1990 to present, this performance schedule includes tax-exempt, fee-paying, discretionary portfolios with a market value equal to or greater than $5mn, managed by Howard Ganek. Starting in January 2000, Richard Nackenson joined the team as portfolio manager, and these portfolios have been co-managed by him and Howard Ganek. Starting in January 2001 the performance schedule also includes all fee-paying, discretionary portfolios with a market value equal to or greater than $250,000 that are managed exclusively by Richard Nackenson. A complete list and description of Neuberger Berman's composites and performance results is available upon request.
Benchmark Composite
Composite Total Return
(Gross of Fees)
Composite Total Return (Net of Fees)
Composite Equity Only Return
(Gross of Fees) S&P 500
IndexNo. of
Accounts Market Value
Total Firm Assets
Internal Dispersion
Composite 3 Year Standard
Deviation
Benchmark 3 Year Standard
Deviation% % % % (millions) (billions) % %
YTD Mar-13 16.66 16.42 17.02 10.61 238 1,705.37 N/A N/A 14.59 14.802012 18.42 17.19 19.35 16.00 218 1,470.67 205.0 3.1 14.34 15.092011 -0.86 -2.01 -1.64 2.11 337 533.80 193.1 1.0 15.03 18.712010 13.06 11.85 14.05 15.06 598 625.97 102.3 2.12009 21.18 19.89 30.00 26.46 619 641.94 91.4 4.92008 -34.79 -35.55 -46.69 -37.00 799 813.20 79.2 11.62007 16.28 14.96 19.32 5.49 687 1,096.30 148.5 3.62006 15.93 14.69 19.90 15.79 369 542.80 127.0 2.62005 9.92 8.94 12.85 4.91 190 307.97 105.9 2.12004 11.52 10.68 16.43 10.88 131 235.64 82.9 2.62003 15.82 14.94 27.81 28.68 84 183.93 70.5 5.2
Composite
DISCLAIMER 33
For Professional Client Use Only
Additional Disclosures
Definitions S&P 500 Index consists of 500 stocks chosen for market size, liquidity, and industry group representation. It is a market-value weighted index (stock price times number of shares outstanding), with each stock's weight in the Index proportionate to its market value. The "500" is one of the most widely used benchmarks of U.S. equity performance. Risk Considerations Past performance is not indicative of future results. For details of the investment risks, see the current prospectus. Please note that any dividends which the Fund may receive are subject to a 30% withholding tax in the US. The benchmark does not take into account the effects of tax and the deduction is therefore not reflected in the benchmark return illustrated herein. The investment objective and performance benchmark is a target only and not a guarantee of the Fund performance. The index is unmanaged and cannot be invested in directly. Index returns assume reinvestment of dividends and capital gains and unlike fund returns do not reflect fees or expenses. Adverse movements in currency exchange rates can result in a decrease in return and a loss of capital. Investments of each portfolio may be fully hedged into its base currency potentially reducing currency risks but may expose the portfolio to other risks such as a default of a counterparty. Small cap companies carry greater risk and are less liquid that larger companies. High Yield Bonds carry a higher level of default risk and can be less liquid than government bonds and investment grade corporate bonds. Monthly and weekly Distributing Classes will distribute out of income and may also pay out of capital which will be eroded; investors in these classes should be aware that the payment out of capital may have different tax implications to distributions of income and should seek tax advice. For C shares a 1% contingent deferred sales change will be payable in respect of all shares redeemed less than 365 days of their issue.
DISCLAIMER 34
For Professional Client Use Only
Disclaimer
This document, and the information contained in it, has been made available by Neuberger Berman Singapore Pte. Limited (“NB Singapore”), which currently operates under an exemption from licensing requirements under the Financial Advisers Act (Chapter 110) of Singapore for marketing of collective investment schemes to institutional investors, and as such, any offer made to persons in Singapore will be made to institutional investors (as defined in Section 4A of the Securities and Futures Act (Chapter 289) of Singapore and the regulations thereunder) only. This document is being provided by NB Singapore on a confidential basis to an “institutional investor” and/or other such qualified person, generically referred to as a “Qualified Person”, on a "one-on-one" basis for informational and discussion purposes only. This document is intended only for the Qualified Person to which it has been provided for internal use. It is being provided on a confidential basis and may not be reproduced or redistributed, in whole or in part, nor may its contents be disclosed to any other person (other than such Qualified Person’s agents or advisers) under any circumstances without the prior written consent of NB Singapore. No recommendation or advice is being given as to whether any investment or strategy referred to in this document is suitable for the Qualified Person. It should not be assumed that any investments in securities, companies, sectors or markets identified and described were or will be profitable. Investing entails risks, including possible loss of principal. Past Performance is no guarantee of future results. This document, and the information contained herein, is not, and does not constitute, a public or retail offer to buy or sell, or a public or retail solicitation of an offer to buy or sell, any fund, units or shares of any fund, security or other instrument (“Securities”), or to participate in any investment strategy. Neither this document nor anything contained herein shall form the basis of any contract or commitment whatsoever. This document is not an offering document or prospectus as defined in the Securities and Futures Act (Chapter 289) of Singapore (“SFA”). Accordingly, statutory liability under the SFA in relation to the contents of prospectuses would not apply. Any offer of securities can only be made by a current offering memorandum in respect of Neuberger Berman Investment Funds Plc (the “Fund”), which is available solely upon request, on a private basis and only to selected investors. The Fund is authorized by the Central Bank of Ireland (the “Central Bank”) as an Undertaking for Collective Investment in Transferable Securities under the European Communities (“UCITS”) Regulations 2003 (S.I. 211 of 2003) of Ireland, as amended. In the case of any inconsistency between the descriptions or terms in this document and the offering memorandum of the relevant Fund, the offering memorandum shall prevail. This document is not directed to, or intended for distribution to or use by, any person or entity who is a citizen or resident of or located in any locality, state, country or other jurisdiction where such distribution, publication, availability or use would be contrary to law or regulation or which would subject NB Singapore or its affiliates (collectively, "Neuberger Berman") or the Fund to any registration or licensing requirement within such jurisdiction. This document is not intended for public use or distribution. While all the information prepared in this document is believed to be accurate, Neuberger Berman makes no representation or warranty, whether express or implied, and accepts no responsibility for the completeness, reliability or accuracy of the information. Past Performance is not indicative of future performance.
DISCLAIMER 35
For Professional Client Use Only
Disclaimer
The views expressed are opinions of Neuberger Berman and are subject to change based on market and other conditions. These views are not intended to be a forecast of future events, a guarantee of future results or investment advice. Nothing in this document constitutes accounting, legal, regulatory, tax or other advice. The Qualified Person to which this document is provided should not rely on the information contained in this document in making any future investment decision. NB Singapore, its officers, employees and affiliates, do not represent that such information is accurate or complete, and it should not be relied upon as such. The information and opinions expressed in this document are subject to change without notice. Certain information contained in this document (including any forward-looking statements and economic and market information) has been obtained from published sources and/or prepared by third parties and in certain cases has not been updated through the date of this document. While such sources are believed to be reliable, NB Singapore, its officers, employees and affiliates do not assume any responsibility for the accuracy or completeness of such information. Any views or opinions expressed may not reflect those of NB Singapore, or its officers, employees and affiliates as a whole. In addition, nothing in this document constitutes legal, accounting or tax advice. None of NB Singapore, its officers, employees or affiliates, make any representation or warranty, express or implied, with respect to the fairness, correctness, accuracy, reasonableness or completeness of any of the information contained in this document (including, but not limited to, information obtained from unrelated third parties), and expressly disclaim any and all responsibility or liability as to the information contained in, or omissions from, this document, including, without limitation, any implied representation or warranty with respect to such information.
© 2013 Neuberger Berman Singapore Pte. Limited (Company No. 200821844K). All rights reserved.
DISCLAIMER
Continued
36
Recommended