February 2015
AHA CENTRE
Japan International Cooperation Agency
OYO International Corporation
Mitsubishi Research Institute, Inc.
CTI Engineering International Co., Ltd.
Risk Profile Report
- Cavite, Laguna and Southern Part of
Metropolitan Manila of the Philippines -
Natural Disaster Risk Assessment and
Area Business Continuity Plan Formulation
for Industrial Agglomerated Areas
in the ASEAN Region

i
Outline of the Pilot Area Country name The Philippines
Pilot areas Industrial clusters and surrounding areas in Cavite Province, Laguna Province and the southern part of Metropolitan Manila
Location of pilot areas
Pilot areas are located in the south of Metropolitan Manila. Industrial clusters are scattered across Cavite Province, Laguna Province and the southern part of Metropolitan Manila. (The approximate area where industrial parks are scattered is indicated by a red broken line.)
Local administrative agencies in pilot areas
The land of the Philippines is largely divided into three blocks, which are subdivided into 17 Regions. Regions have 81 Provinces in total. Provinces consist of Cities and Municipalities. Metropolitan Manila (National Capital Region) is at the same level as Regions, consisting of 16 Cities and one Municipality with no Province.
Area and population of pilot areas
Natural conditions of pilot areas
The island of Luzon, where Metropolitan Manila, Cavite Province and Laguna Province are located, is a mountainous and volcanic region.
Laguna de Bay, the largest lake in the Philippines with the surface area of 949 km2, is located at the southeast of Manila Bay. The Pasig River flows from Laguna de Bay into Manila Bay. The Pasig River is regarded as the most important river in the Philippines since it flows across the central area of Metropolitan Manila.
There are two lakes, named Caldera and Taal, in the south of Cavite Province. Mount
Laguna Cavite
Metropolitan Manila
Batangas
* May 2010, National Statistics Office, the Philippines
Local administrative agencies
Area (km2) Population*
Metropolitan Manila Cavite Province
Laguna Province

ii
Taal, the smallest volcano in the Philippines, rises in the center of Lake Taal. The climate is tropical monsoon. The annual mean temperature is 26°C-27°C. There
are two seasons: the rainy season (June to November) and the dry season (December to May).
Hazards (disasters) in pilot areas: Flood
The types of floods striking the southern part of Manila and the Cavite and Laguna areas differ because they have different basins. The Cavite area is affected by flooding of the Imus, San Juan and Canas Rivers. The Laguna area is affected by the rise of the water level of the lake, while the southern part of Manila affected by the flow of drainage from the capital region. Although the towns in Cavite are at risk for flood damage, industrial parks have a lower risk of incurring direct damage. Major inundation damage is caused by floods due to tropical cyclones or typhoons, and flooding is caused by high waves.
Hazards (disasters) in pilot areas: Earthquake
There is no record in the disaster database of a seismic disaster with casualties occurring around the pilot areas since the 20th century. In the Philippines, PHIVOLCS catalogues historical earthquakes and has accumulated substantial data. According to this data, there is a record of an earthquake that killed more than 600 people in Manila in the 17th century. There was also an earthquake killing more than 400 in the 19th century. Moreover, the earthquake that occurred and killed a few people in the 18th century was caused by the activity of the Taal volcano located south of the pilot areas. PHIVOLCS found that an active fault extends in a north/south direction on the east side of Metropolitan Manila. If this fault moves, significant damage to Metropolitan Manila is projected.
Hazards (disasters) in pilot areas: Tsunami
According to the disaster database, there is one record of a tsunami (Mindro Island Tsunami) with casualties that occurred near the pilot areas in 1994. The tsunami rose to 8 m at Baco Island, killing 81 people. However, there is no record of a large tsunami directly hitting the pilot areas. Presumably, this is because the pilot areas are not likely to be affected by a tsunami generated in the open seas due to their location inside Manila Bay.
Hazards (disasters) in pilot areas: Volcanoes
Approximately 400 volcanoes are currently recognized in the Philippines, of which 23 are active while 26 are potentially active. Within 100 km of the pilot areas, there are three active volcanoes: Mount Pinatubo, Mount Taal and Mount Banahaw.
According to the disaster database, the eruption of Mount Pinatubo in 1991 killed more than 600 and affected about one million people. Buildings and infrastructure around the volcano suffered damage. Ash fell and affected air routes significantly. The amount of loss exceeded USD 200 million, accounting for approx. 0.2 % of the GDP at that time. This eruption is the second largest of the 20th century. Mount Taal also erupted in 1965, killing 355, and erupted again in 1976. The last recorded eruption of Mount Banahaw was in 1843.
Industrial clusters in pilot areas
42 industrial parks are known to exist in Cavite Province, Laguna Province and Batangas Province. Among them, Japanese-affiliated companies are settled in 17 parks. There are 296 Japanese-affiliated companies in total. The Cavite Economic Zone has the largest number of Japanese companies (96).
The Cavite Economic Zone has been selected as the representative industrial park in the pilot areas. Its outline is as follows. Developed by PEZA (Philippine Economic Zone Authority) 286 tenants (Japanese and Korean companies occupy approx. 40% each) Electric power supply
IPP (Trans Asia Oil) generates power, NGCP transmits electricity, TRANSCO・MELARCO distributes electricity. ・Contract ① IPP-PEZA (five year contract from January 2013) ・Contract ② PEZA-Locator (PHP0.6/kWh: costs passed as distribution charge)
Disaster damages ・10-day power outage in 2006 due to the flood caused by Milenyo (typhoon)
General economic Among the pilot areas, investment has been promoted in the Calabarzon area

iii
conditions of pilot areas
(including Cavite Province, Laguna Province, Batangas Province, Rizal Province and Quezon Province in the southern part of Manila) for the construction of industrial parks, etc. Japanese-affiliated companies have recently been moving to the industrial parks in Batangas Province, especially the First Philippines Industrial Park (FPIP) and the Lima Technology Center (LTC). Murata Manufacturing, Brother Industries, Canon, Shimano and others companies are settled in FPIP, while Bandai, Furukawa Electric, Epson and other companies are settled in LTC. On the other hand, since there very little space left in the industrial parks in Cavite and Laguna, further movement into these parks is not possible.
Importing accounts for 70% and exporting accounts for 30% of the cargo movement at the Port of Manila, which is an important port infrastructure in the metropolitan area. Its handling capacity is always at the maximum limit. In Batangas Province, road infrastructure leading to the Port of Manila has been developed, and the Port of Batangas has also become usable. The Port of Subic has been developed on the north side of Manila. Promoting the use of these two ports may contribute to the improvement of distribution in Metropolitan Manila.
Traffic congestion is severe, especially in the central area of Metropolitan Manila. It may take 6 to 7 hours from the industrial parks (Lima Technology Center, etc.) in Batangas Province. Conversely, the distance to the Port of Batangas is 35 km, and only slightly over one hour is required for shipment. Use of this port is clearly more economical. However, the amount of import cargo which can be handled by the Port of Batangas is still small, which may reduce the operational efficiency of distributors.
Expanding the use of the Port of Subic and the Port of Batangas, in addition to the Port of Manila, would clearly ensure substitutability of distribution routes, and will bring advantages to the BCP. However, there are no economic merits since at present, the departure and arrival of liners is infrequent and the transaction volume is small.
BCP dissemination in the Philippines
The concept of the BCP is not well-known in the Philippines. Most companies probably have not considered development of the BCP. They are not aware of natural disaster prevention. Few companies have formed disaster prevention plans or emergency response plans, since disasters other than heavy rains and floods are not expected around Manila.
However, some companies, including those involved in international transactions and major lifeline providers, have been actively promoting the development of an emergency response system and BCP, taking into consideration international requirements and the significant impact on society if business activities are suspended. Specifically, the local offices, customer centers, and data centers of major electric power providers have developed emergency response plans and BCP, and are also planning to establish comprehensive risk management plans.

1
Contents Outline of the Pilot Area
Page Chapter 1 Disaster Risks of the Pilot Area ............................................................................ 1-1
1.1 Overview ........................................................................................................................ 1-1 1.2 Identification of Predominant Hazards ....................................................................... 1-1 1.3 Disaster Risk for Earthquakes ..................................................................................... 1-8 1.4 Hazard and Risk Information Sources ........................................................................ 1-8
Chapter 2 Natural Hazards in the Pilot Area ........................................................................ 2-1 2.1 Floods ............................................................................................................................. 2-1 2.2 Typhoons/ Hydrometeorology ....................................................................................... 2-2 2.3 Storm Surges ................................................................................................................. 2-2 2.4 Earthquakes .................................................................................................................. 2-2 2.5 Tsunami .......................................................................................................................... 2-3 2.6 Volcanoes ........................................................................................................................ 2-4
Chapter 3 Outline of Natural Hazard Assessments .............................................................. 3-1 3.1 Seismic Hazard Assessment ......................................................................................... 3-1 3.2 Tsunami Hazard Assessment ....................................................................................... 3-5 3.3 Flood Hazard Assessment ............................................................................................. 3-9
Chapter 4 Profile of the Pilot Area ......................................................................................... 4-1 4.1 Outline of the Pilot Area ............................................................................................... 4-1 4.2 Outline of Local Authorities ......................................................................................... 4-2
4.2.1 Local Administrative System of the Philippines ................................................. 4-2 4.2.2 Disaster Management Organizations ................................................................... 4-3
4.3 Present State of Industrial Agglomerated Areas ........................................................ 4-6 4.3.1 Industrial Parks in the Industrial Agglomerated Areas ..................................... 4-7 4.3.2 Japanese Manufacturer of Medical Products and Equipment ........................... 4-9
4.4 Transport Infrastructure Conditions ........................................................................... 4-9 4.4.1 Roads ....................................................................................................................... 4-9 4.4.2 Ports ...................................................................................................................... 4-10 4.4.3 Railways ................................................................................................................ 4-13 4.4.4 Airports ................................................................................................................. 4-14
4.5 Lifeline Facilities and Public Services ....................................................................... 4-15 4.5.1 Electricity ............................................................................................................. 4-15 4.5.2 Water ..................................................................................................................... 4-18 4.5.3 Communications................................................................................................... 4-20

2
4.5.4 Gas ........................................................................................................................ 4-22 4.5.5 Waste ..................................................................................................................... 4-23 4.5.6 Schools .................................................................................................................. 4-26 4.5.7 Hospitals ............................................................................................................... 4-27
4.6 Economic Relations with Neighboring Regions and Japan ...................................... 4-29 4.6.1 Overview of the Economy of Pilot Area .............................................................. 4-29 4.6.2 Major Economic Policy ......................................................................................... 4-29 4.6.3 Economic Ties with Japan ................................................................................... 4-30
4.7 BCP Implementation Conditions ............................................................................. 4-33 4.7.1 Major Natural Disasters and Disaster Management Awareness ..................... 4-33 4.7.2 Implementation of BCP ....................................................................................... 4-33 4.7.3 Efforts for Implementing BCP ............................................................................ 4-34 4.7.4 BCP Implementation Problems .......................................................................... 4-35
4.8 Current State of Disaster Risk Management ............................................................ 4-35 4.8.1 Questionnaire Surveys ........................................................................................ 4-35 4.8.2 Review of the Questionnaire Surveys for Industrial Parks .............................. 4-35 4.8.3 Review of the Questionnaire Surveys for Business Enterprises ...................... 4-37 4.8.4 Review of the Questionnaire Surveys for Lifeline Utility Companies ............. 4-43 4.8.5 Review of the Questionnaire Surveys for Traffic Infrastructure Companies .. 4-44 4.8.6 Review of the Questionnaire Surveys for Local Government ........................... 4-45
Appendix Details of Natural Hazard Assessments .............................................................. A-1
A.1 Seismic Hazard Assessment ......................................................................................... A-1 A.1.1 Methodology of Probabilistic Seismic Hazard Analysis ...................................... A-1 A.1.2 Amplification Analysis of the Surface Ground ..................................................... A-4 A.1.3 Expression of the Results ...................................................................................... A-6 A.1.4 Simulation and Results ......................................................................................... A-6 A.1.5 Evaluation of the Results ....................................................................................A-15
A.2 Tsunami Hazard Assessment .....................................................................................A-18 A.2.1 Theory of Tsunami Propagation and Selection of Simulation Model ...............A-18 A.2.2 Input Data ............................................................................................................A-19 A.2.3 Output Data .........................................................................................................A-23 A.2.4 Return Period of Scenario Earthquake ..............................................................A-24 A.2.5 Results of Simulation ...........................................................................................A-26 A.2.6 Evaluation of the Results ....................................................................................A-42
A.3 Flood Hazard Assessment ...........................................................................................A-44 A.3.1 Overview ...............................................................................................................A-44 A.3.2 Design Flood Scale ...............................................................................................A-44 A.3.3 Result of Flood/Inundation Analysis ..................................................................A-45

3
A.3.4 Evaluation of the Results ....................................................................................A-53

Disaster Risks of the Pilot Area
1-1
Chapter 1 Disaster Risks of the Pilot Area
1.1 Overview The disaster risks of the pilot area were assessed by the distribution of facilities that are mentioned in Chapter 4 overlaid on the hazard maps for seismic intensity or inundation depth, among others. (See Appendix) The main subjects of the assessment are traffic infrastructures and lifeline facilities, which are important for the continuation of businesses.
For tsunamis, floods and storm surges, the facilities in areas that will be inundated and/or are projected to be submerged are generally expected to receive damage. Past disaster records for the pilot area are the most valuable data for the assessment, because the extent of damage varies depending on the type and structure of the facilities, as well as their location. However, as past disaster records for the pilot area are not available for this study, disaster risk was assessed by referencing the disaster records in from other areas.
For earthquakes, the extent of damage is determined by the intensity of seismic vibration at the point where the location of the facility and their seismic performance. Several relationships between seismic intensity and the extent of damage of typical facilities have been proposed based on past earthquake disasters as the damage functions. The notable examples of functions are ATC-131, ATC-252 and Hazus3, which were based on damage that occurred in the U.S.A. For this study, the extent of damage and the time needed to recover are assessed based on these damage functions. Therefore, it should be noted that the assessed results in this study can be improved referring to the local situation of the facilities.
1.2 Identification of Predominant Hazards Impacts to business continuity were assessed and shown in Figure 1.2.1. The hazard that will most likely interrupt the business in Cavite and Laguna is earthquake, followed by flooding. The assessment is based on the overlaid maps of hazards and important facilities shown in Figure 1.2.2 – Figure 1.2.6.
The hazards in the pilot area with a probability of occurring once in 200 years are as follows.
Earthquake: seismic intensity of 8 to 9 on the MMI Scale (lower to upper 8 in PEIS); liquefaction probability is high along Manila Bay.
Tsunami: Maximum wave height on the coast closest to the industrial park in Cavite is 1 m for the model with a return period of 100 to 600 years.
Flood: Maximum inundation depth is 2 m along the Manila Bay coastal area and the duration is several days; the inundation area along Laguna Lake is limited.
1 ATC, 1985, ATC-13: Earthquake Damage Evaluation Data for California, Federal Emergency Management Agency, Applied Technology Council, California, U.S.A. 2 ATC, 1991, ATC-25: Seismic Vulnerability and Impact of Disruption on Lifelines in the Conterminous United States, Federal Emergency Management Agency, Applied Technology Council, California, U.S.A. 3 FEMA, 2011, Hazus -MH 2.1, Multi-hazard Loss Estimation Methodology, Earthquake Model.

Risk Profile Report - Cavite, Laguna and Southern Part of Metropolitan Manila of the Philippines -
1-2
Figure 1.2.1 Identification of Predominant Hazards
Large
SmallLow High(1/200 - 1/100)
Probability
Dis
aste
rRis
k by
Nat
ural
Haz
ards

Disaster Risks of the Pilot Area
1-3
Figure 1.2.2 Seismic intensity expected with a 200-year probability and the distribution of important facilities
This map is intended to be used for disaster scenario creation. This map is not the forecast of the future hazard. [Analytical condition] Probabilistic Seismic Hazard Analysis, Software: EZ-FRISK, Earthquake source model: GSHAP, EZ-FRISK, Ground classification and amplification: NEHRP, Ground Data: Digital geological data by IGP, Conversion from PGA to MMI: Trifunac and Brady (1975), Return period: 200 years.

Risk Profile Report - Cavite, Laguna and Southern Part of Metropolitan Manila of the Philippines -
1-4
Figure 1.2.3 Liquefaction probability expected with a 200-year probability and the distribution of important facilities
This map is intended to be used for disaster scenario creation. This map is not the forecast of the future hazard. [Analytical condition] Probabilistic Seismic Hazard Analysis, Software: EZ-FRISK, Earthquake source model: GSHAP, EZ-FRISK, Ground classification and amplification: NEHRP, Ground Data: Digital geological data by IGP, Conversion from PGA to MMI: Trifunac and Brady (1975), Return period: 200 years.

Disaster Risks of the Pilot Area
1-5
Figure 1.2.4 Maximum tsunami wave height for the Manila Bay offshore model (return period is 100 to 600 years)
This map is intended to be used for disaster scenario creation. This map is not the forecast of the future hazard. [Analytical condition] Software: TUNAMI by Tohoku Univ., Bathymetry data: GEBCO_08, Topography map by NAMRIA, Grid size: 1350m, 450m, 150m, 50m, Simulation duration: 24 hours, Return period: 100 - 630 years.

Risk Profile Report - Cavite, Laguna and Southern Part of Metropolitan Manila of the Philippines -
1-6
Figure 1.2.5 Maximum inundation depth expected with a 200-year probability in Cavite and the
distribution of important facilities
This map is intended to be used for disaster scenario creation. This map is not the forecast of the future hazard. [Analytical condition] Software: MIKE-11 for Runoff analysis and MIKE-21 for Inundation analysis, Rainfall data: average rainfall of watershed, Boundary condition: <Upper> Calculated hydrograph with the runoff model, <Lower> Observed tidal level in Manila bay and Cavite port, Return period: 200 years.

Disaster Risks of the Pilot Area
1-7
Figure 1.2.6 Inundation depth expected with a 200-year probability along Laguna Lake and the distribution of important facilities
This map is intended to be used for disaster scenario creation. This map is not the forecast of the future hazard. [Analytical condition] Inundation area caused by the increase of water level of the Laguna Lake is estimated based on the probable water level, Elevation data: ASTER GDEM, Return period: 200 years.

Risk Profile Report - Cavite, Laguna and Southern Part of Metropolitan Manila of the Philippines -
1-8
1.3 Disaster Risk for Earthquakes The disaster risk for earthquakes, which has been identified as the predominant hazard for business interruption with a 200-year probability was assessed and is shown in Table 1.3.1.
Table 1.3.1 Disaster Risk for Earthquakes
Buildings in
Industrial Parks
10% of the buildings suffer moderate damage. Repair is necessary for
operations.
Some ceiling panels and lights fall down and parts racks may topple.
Non-anchored heavy machinery may move on the floor.
Transformers may topple.
Lifeline Facilities
Electric substations will cease operations for 1 week. Capacity recovers to
50% in 1 month after the earthquake, with 3 months needed for full recovery.
Fixed-line phones and mobile phone lines become congested because of the
limitation of channels due to the shortage of electric power.
Wells and water tanks cease operations for several days. Capacity recovers to
50% in 1 week after the earthquake, with 1 month needed for full recovery.
Traffic
Infrastructures
The expressway between Manila and Cavite is closed for 2 weeks because of
liquefaction. After temporary restoration work, limited traffic passage will
become possible.
Traffic capacity of the expressway between Manila and Laguna is limited in
some sections. Capacity recovers to 50% in 1 week, with 2 weeks needed for
ful recovery.
Most piers at Manila Port cannot be used for several months due to the
liquefaction. Several piers resume operation after temporary restoration work.
Gantry cranes in container terminal are severely damaged. Cargo handling
capacity will recover to 50% after 6 months.
Industrial Park
Workers
Some employees will be absent from work because 10% of their houses are
heavily damaged and 20% suffer moderate structural damage.
Traffic conditions will become worse and many workers will be late for their
shifts.
1.4 Hazard and Risk Information Sources
Earthquakes, Tsunamis, Volcanoes [PHIVOLCS] Philippine Institute of Volcanology and Seismology
http://www.phivolcs.dost.gov.ph/ Fault Zone Map

Disaster Risks of the Pilot Area
1-9
http://www.phivolcs.dost.gov.ph/index.php?option=com_content&view=article&id=379&Itemid=500023 Active Faults and Trenches, Active Faults and Liquefaction Susceptibility Map http://www.phivolcs.dost.gov.ph/index.php?option=com_content&view=article&id=78&Itemid=500024 Tsunami Prone Areas and Tsunami Hazard Map http://www.phivolcs.dost.gov.ph/index.php?option=com_content&view=article&id=312&Itemid=500027 Volcano Hazard Map http://www.phivolcs.dost.gov.ph/index.php?option=com_content&view=article&id=57:active-volcanoes&catid=55&Itemid=114 Ready Project Map http://www.phivolcs.dost.gov.ph/index.php?option=com_content&view=article&id=465&Itemid=500028 Earthquake Monitoring http://www.phivolcs.dost.gov.ph/index.php?option=com_content&view=article&id=38&Itemid=75
[MGB] Mines and Geosciences Bureau http://www.mgb.gov.ph/ Geological Map http://www.mgb.gov.ph/lgmp.aspx Geological Database Information System http://gdis.denr.gov.ph/mgbviewer/
[NAMRIA] National Mapping and Resource Information Authority http://www.namria.gov.ph/
[PAGASA] Philippine Atmospheric, Geophysical and Astronomical Services Administration http://www.pagasa.dost.gov.ph/
Meteorological Hazards, Floods [NDRRMC] National Disaster Risk Reduction and Management Council
http://www.ndrrmc.gov.ph/ [OCD] Office of Civil Defense
http://ocd.gov.ph/ [PAGASA] Philippine Atmospheric, Geophysical & Astronomical Services Administration
http://www.pagasa.dost.gov.ph/index.shtml [DOST-ICTO] The Department of Science and Technology-Information and Communications
Technology Office http://www.dost.gov.ph/

Risk Profile Report - Cavite, Laguna and Southern Part of Metropolitan Manila of the Philippines -
1-10
[NAMRIA] National Mapping and Resource Information Authority http://www.namria.gov.ph/
[UP] University of the Philippines Diliman http://www.upd.edu.ph/

Natural Hazards in the Pilot Area
2-1
Chapter 2 Natural Hazards in the Pilot Area
2.1 Floods
(1) The pilot area has suffered from floods and inundation caused by storm rainfalls due to tropical
cyclones and typhoons.
The Pasig-Marikina River and Laguna Lake Basin in Metropolitan Manila suffered from severe
flooding and inundation caused by storm rainfall during the tropical storm Ondoy, which was
assessed as a flood with a probability of over 100 years. The southern part of Metropolitan Manila
was affected by storm waters and inundated for one to three days. The area along Laguna Lake was
submerged for a long time because the water level rose over the normal water level (11.50 m) to
13.90 m due to the storm rainfall.
The Cavite area has been frequently affected by floods, even by 2-year probable floods caused by
the Imus River, San Juan River and Canas River, which flow through the urban area.
In this area, there are also floods caused by river overflow and inundation due to storm rainfalls
from tropical cyclones and typhoons. There is a risk of storm surges in the low-lying coastal areas.
The severest flood disasters were caused by Typhoon Milenyo (in 2006), which was evaluated as a
flood with a probability of 100 years. However, the industrial estates are generally protected from
the floods.
(2) The eastern part of Cavite province, in which industrial estates are located, lies close to
Metropolitan Manila. The provincial government of Cavite conducts dredging of the major river
channels as a flood control measure in order to maintain their discharge capacities. After Typhoon
Milenyo, a development study was conducted by JICA on flood disaster prevention from 2007 to
2009, with a project scheduled to be implemented from 2014. The project includes the construction
of three retarding basins (two at the Imus River and one at the San Juan River) and channel
improvements for the Imus and San Juan Rivers.
(3) As for the formulation of national and regional disaster prevention plans, a new Republic Act
(1012) entitled “An Act Strengthening the Philippine Disaster Risk Reduction and Management
System” was issued in 2010. Based on the new act, national and local governments established
Disaster Risk Reduction Management Offices and are preparing Disaster Risk Reduction Plans.
The MMDA and the provincial governments of Laguna and Cavite have already prepared
DRRMPs. However, the industrial estates in the area are not included as communities in the
RDRRMP. The Area BCP must thus consider their participation in the RDRRMP.
(4) The flood warning system of the Cavite Provincial Government is completely dependent on
information from PAGASA, as they do not have their own monitoring system like MMDA and the

Risk Profile Report - Cavite, Laguna and Southern Part of Metropolitan Manila of the Philippines -
2-2
Laguna Provincial Government. In Cavite, when considering the scale of rivers (catchment area:
110 km²~150 km², river length: 42 km ~ 45 km, river slope: 1/66~1/80), it can be seen that they
must develop their own monitoring system in order to improve the level of safety for its residents.
2.2 Typhoons/ Hydrometeorology
The Philippines is subject to various risks of natural disasters caused by typhoons and tropical
cyclones, floods, flashfloods, mud flows and landslides, storm surges, volcanic eruptions and
earthquakes. Typhoons are the most destructive in the country.
Typhoons generally originate in the region of the Mariana and Caroline Islands in the Pacific
Ocean and move northwest. An average of 20 typhoons pass through the country annually, four (4)
~ five (5) of them cause major disasters by floods, storm surges and strong winds.
In recent years, flood and inundation disasters were caused by Typhoon Milenyo in 2006, Typhoon
Frank in 2008, Tropical Storm Ondoy in 2009, Typhoon Basyang in 2010 and Typhoon Maring in
2013.
2.3 Storm Surges
The Ready Project has created hazard maps of natural disasters including a hazard map for storm
surges. According to the hazard map, the storm surge disaster risk areas are identified as the coastal
areas that are 2 m below MSL, which include 60 Barangays (including 15 Barangays in Cavite
city) located along the coast.
2.4 Earthquakes
There is no record of an earthquake with casualties in or around the pilot area after the 20th century.
However, tracing back history using the PHIVOLCS earthquake catalog, an earthquake with over
600 deaths was found in the 17th century. Additionally, an earthquake which was generated by the
activity of the Taar volcano, which is located south of the pilot area, caused several deaths in the
18th century. According to PHIVOLCS research, an active fault is running in a north-south
direction on the east side of Manila. Serious damage to Metro Manila is predicted if this fault slips.
However, the level of fault activity is not clear. Conversely, there is no record of damage caused by
earthquakes occurring along the Manila Trench.
The Global Seismic Hazard Assessment Program (GSHAP) modeled global seismic activity and
conducted probabilistic seismic hazard analyses. The published peak ground acceleration (PGA)
for the pilot area with a 10% probability of exceedance in 50 years (475-year return period) is
about 400 gal above bedrock. However, according to a geological map published by NAMRIA,
some of the pilot area is covered by soft sediment from the Quaternary period, which is expected to
Natural Hazards in the Pilot Area
2-3
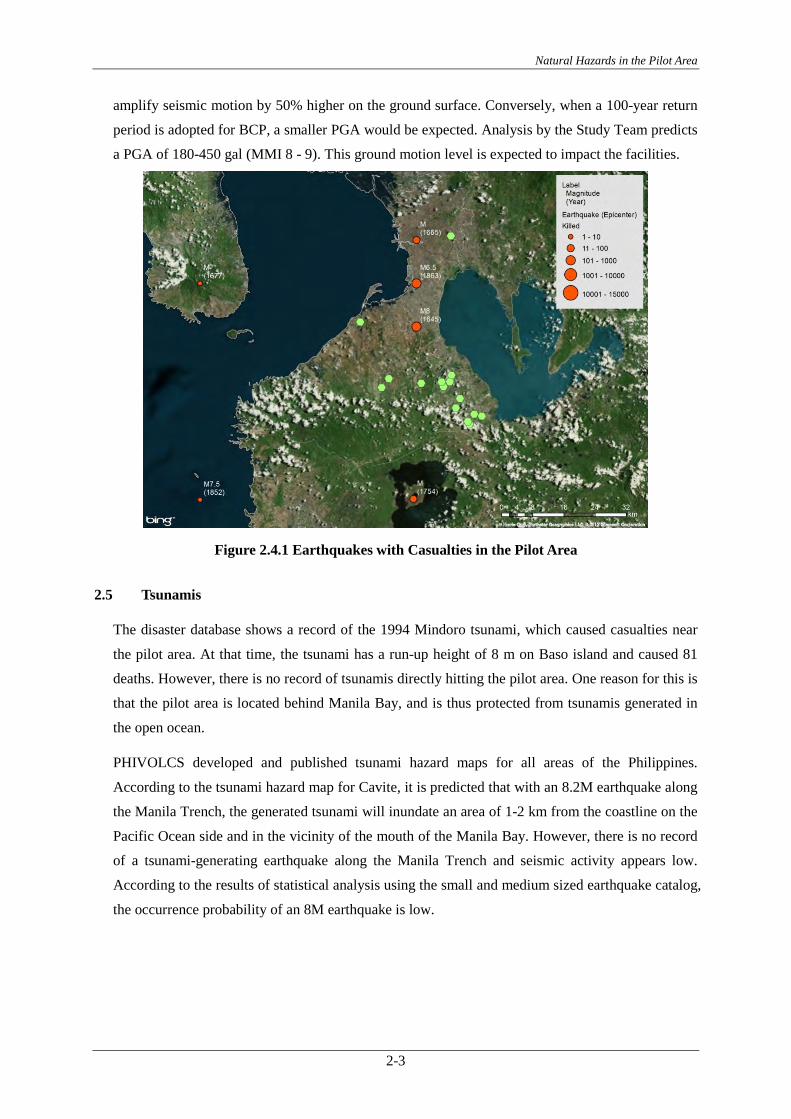
amplify seismic motion by 50% higher on the ground surface. Conversely, when a 100-year return
period is adopted for BCP, a smaller PGA would be expected. Analysis by the Study Team predicts
a PGA of 180-450 gal (MMI 8 - 9). This ground motion level is expected to impact the facilities.
Figure 2.4.1 Earthquakes with Casualties in the Pilot Area
2.5 Tsunamis
The disaster database shows a record of the 1994 Mindoro tsunami, which caused casualties near
the pilot area. At that time, the tsunami has a run-up height of 8 m on Baso island and caused 81
deaths. However, there is no record of tsunamis directly hitting the pilot area. One reason for this is
that the pilot area is located behind Manila Bay, and is thus protected from tsunamis generated in
the open ocean.
PHIVOLCS developed and published tsunami hazard maps for all areas of the Philippines.
According to the tsunami hazard map for Cavite, it is predicted that with an 8.2M earthquake along
the Manila Trench, the generated tsunami will inundate an area of 1-2 km from the coastline on the
Pacific Ocean side and in the vicinity of the mouth of the Manila Bay. However, there is no record
of a tsunami-generating earthquake along the Manila Trench and seismic activity appears low.
According to the results of statistical analysis using the small and medium sized earthquake catalog,
the occurrence probability of an 8M earthquake is low.

Risk Profile Report - Cavite, Laguna and Southern Part of Metropolitan Manila of the Philippines -
2-4
Figure 2.5.1 Example of Tsunami Hazard Map by PHIVOLCS
2.6 Volcanoes
There are about 400 volcanoes in the Philippines, of which 23 are active volcanoes and 26 are
potentially active volcanoes. There are three active volcanoes within 100 km of the pilot area. They
are Mt. Pinatubo, Mt. Taal and Mt. Banahaw.
According to the disaster database, the eruption of Mt. Pinatubo in 1991 was the most devastating
eruption in the Philippines in recent years and it was the second largest eruption of the 20th century
in the world. More than 600 people were killed and about one million people were affected by the
eruption. Many buildings and infrastructures around Mt. Pinatubo were damaged, and ash fall
affected air transportation. The loss amount exceeded USD 200 million, which was equivalent to
0.2% of Philippines’ GDP at that time. Mt. Taal erupted in 1965 and caused 355 deaths. This
volcano also erupted in 1976. The last eruption of Mt. Banahaw was recorded in 1843.
PHIVOLCS developed volcano hazard maps for 14 active volcanoes including Mt. Pinatubo and
Mt. Taal. The maps identify hazardous items such as volcanic ash, lava flow, pyroclastic flow,
lahar, and volcanic mud flow and they are used for evacuation plans, quick response and land use.
A real time observation system has been installed for Mr. Pinatubo and Mt. Taal, and PHIVOLCS
issues of volcanic eruption warning with five alarm levels. Seismic activity monitoring is
conducted for Mt. Banahaw.

Outline of Natural Hazard Assessments
3-1
Chapter 3 Outline of Natural Hazard Assessments
3.1 Seismic Hazard Assessment The basic procedure of earthquake hazard assessment is shown in Figure 3.1.1. The details of each item
are stated below.
Figure 3.1.1 Basic Procedure of Earthquake Hazard Assessment
Step 1: Collection and Analysis of Existing Information
1) Past Earthquake Disasters
2) Existing Research
3) Earthquake Catalogue
5) Infrastructure Facilities
6) Natural Conditions
7) Probabilistic Seismic Hazard Analysis Method
8) Selection of Software for Analysis
9)-1 Source Model
11) Amplification Analysis of Surface Ground
Earthquake-related Information Social & Natural Information
12) Expression of the Results
9) Input Data Preparation
9)-2 Attenuation Model
Step 2: Setting of Hazard Probability
Step 3: Analysis and Evaluation
10) Calculation of Baserock Motion
4) Active Faults

Risk Profile Report - Cavite, Laguna and Southern Part of Metropolitan Manila of the Philippines -
3-2
Step 1: Collection and Analysis of Existing Information Earthquake-related Information
1) Past earthquake disaster records Seismic intensity distribution data and disaster records of past earthquakes in the study area are collected.
The frequency and the extent of earthquake disasters can be understood by analyzing the year of
occurrence, earthquake magnitude, seismic intensity distribution and damage distribution.
2) Existing research and study Existing research and study results of earthquake hazards in the area are collected. The information
collected focuses on historical earthquake research, seismic hazard maps and studies on ground
amplification of earthquake motion.
3) Earthquake catalogue The earthquake catalogue is a list of past earthquakes including origin, depth, year/month/day/time of
occurrence, seismic magnitude and so on. As the earthquake catalogue is a base for earthquake hazard
analysis, a catalogue that covers a longer period is preferable. The catalogue should include the
earthquakes that occurred within a 100 km range of the study area.
4) Active faults An active fault is a fault which may generate earthquakes in the future. Data on active faults such as
location, length and activity are necessary for earthquake hazard assessment.
Social and Natural Information
5) Infrastructure facilities The distribution of infrastructure facilities on which industrial agglomerated areas are dependent is
studied. Transportation facilities and lifeline facilities are the main target for study. The actual region
where earthquake hazard is to be assessed is decided based on the distribution of infrastructure facilities.
As infrastructure facilities are widely spread outside of industrial agglomerated areas, the region of
hazard analysis is not limited to industrial agglomerated areas.
6) Natural conditions Topography maps or DEM are collected as the basic information of the study area. Geological,
geomorphological and land use maps are also collected to assess the amplification of earthquake motion
caused by subsurface ground.
Step 2: Setting of Hazard Probability
7) Methodology of probabilistic seismic hazard analysis

Outline of Natural Hazard Assessments
3-3
Probabilistic methodology is used in the seismic hazard assessment because the probability of hazards
is important for the Area BCP. Using the probabilistic method, the expected earthquake ground motion
within a certain period at the study point is calculated, considering all the earthquake sources around the
study point to reflect the possibilities of each source. Any hazard that has a high possibility of occurring
during the lifetime of the industrial facilities is taken into account for the Area BCP. Therefore,
estimating the probability of hazards is an essential component of the analysis.
Step 3: Analysis and Evaluation
8) Selection of software for analysis As the probabilistic seismic hazard analysis involves complicated numerical calculations, many
computing programs have been developed for this purpose and some of them are freely available.
However, they are intended to be used by researchers or engineers with expert knowledge. EZ-FRISK is
commercial software offered by Risk Engineering Inc. Analysis using EZ-FRISK is comparatively easy
because the earthquake source model and attenuation formula are provided with the program.
9) Input data preparation
9)-1 Source model The earthquake source model should include all the active faults within several 100 km of the study
point. The earthquakes for which sources are unknown and for which it is difficult to make a definite
estimation of the magnitude/location of future events are modeled as background seismic activities.
9)-2 Attenuation formula The empirical attenuation formula is used to calculate earthquake ground motion based on the
magnitude of the earthquake and the distance between epicenter and the study point. It is desirable to
use an attenuation formula that was created for use on the study site. It is generally more desirable to
use a new proposed attenuation formula because this newer formula is derived from precise, recent
earthquake observation records.
10) Calculation of baserock motion The earthquake ground motion calculated with a probabilistic method is expressed as follows.
a) The probability that the study site experiences a certain earthquake ground motion.
e.g. The probability of experiencing 100 gal or more is 10% in 50 years.
b) The earthquake ground motion value for a certain probability.
e.g. 100 gal or more will be experienced with a probability of 10% in 50 years.
11) Amplification analysis of surface ground Seismic waves are amplified by the surface ground. There are several methodologies to evaluate the
amplification characteristics of surface ground; for example, evaluation can be based on the surface
soil, the average S wave velocity of surface soil layers, and numerical response analysis using the

Risk Profile Report - Cavite, Laguna and Southern Part of Metropolitan Manila of the Philippines -
3-4
ground structure model. The most suitable method is selected by considering the available data,
necessary work and budget.
12) Expression of the results Calculated values for ground movement are physical quantities, such as peak ground acceleration or
velocity. Seismic intensity is another way to express the strength of the ground vibration caused by
earthquakes and is a more popularly understandable way of expressing values. Seismic intensity is also
used to estimate damage based on past earthquake disasters. Though the relationship between PGA or
PGV and seismic intensity is not a one-to-one ratio, empirical formulas are used to convert the former to
the latter.
Outline of Natural Hazard Assessments
3-5
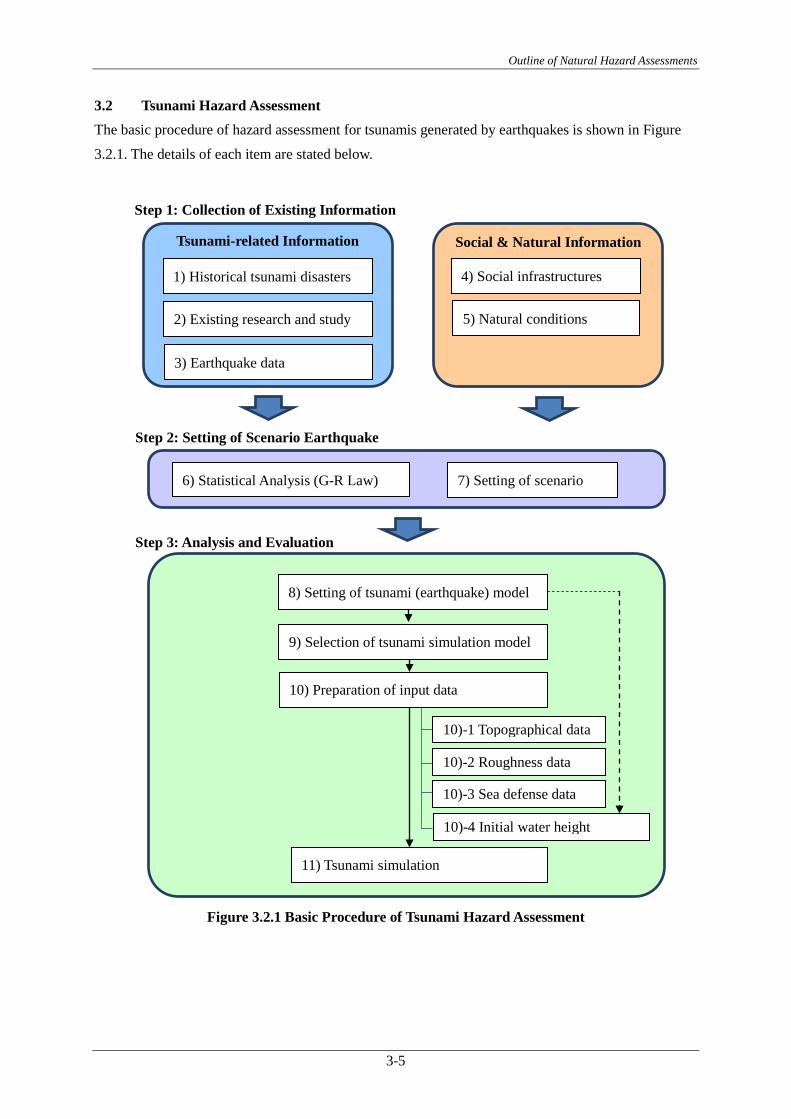
3.2 Tsunami Hazard Assessment The basic procedure of hazard assessment for tsunamis generated by earthquakes is shown in Figure
3.2.1. The details of each item are stated below.
Figure 3.2.1 Basic Procedure of Tsunami Hazard Assessment
Step 1: Collection of Existing Information
1) Historical tsunami disasters
2) Existing research and study
3) Earthquake data
4) Social infrastructures
5) Natural conditions
6) Statistical Analysis (G-R Law) 7) Setting of scenario
8) Setting of tsunami (earthquake) model
10)-1 Topographical data
Tsunami-related Information Social & Natural Information
11) Tsunami simulation
10) Preparation of input data
10)-4 Initial water height
10)-3 Sea defense data
10)-2 Roughness data
Step 2: Setting of Scenario Earthquake
Step 3: Analysis and Evaluation
9) Selection of tsunami simulation model

Risk Profile Report - Cavite, Laguna and Southern Part of Metropolitan Manila of the Philippines -
3-6
Step 1: Collection of Existing Information Tsunami-related Information
1) Records of historical tsunami disasters Inundation data and disaster records of past tsunamis in the study area are collected. The frequency and
the extent of tsunami disaster can be understood by analyzing the year of occurrence, tsunami wave
height, inundation and damage distribution.
2) Existing research and study Existing research and study results of tsunami hazards in the area are collected. The information
collected focuses on historical tsunami research and tsunami hazard maps.
3) Earthquake data (earthquake catalogue) Data on earthquakes that have caused tsunamis is collected. The earthquake catalogue is the list of past
earthquakes including the origin, depth, year/month/day/time of occurrence, seismic magnitude and so
on. Earthquakes which generated tsunami are selected.
Social and Natural Information
4) Social infrastructures Information on industrial agglomerated areas and social infrastructure that would be potentially affected
by tsunami will be collected. Social infrastructures are categorized into transportation infrastructures
and lifelines. The actual region where tsunami hazard is to be assessed is decided based on the
distribution of infrastructure facilities. As infrastructure facilities are widely spread outside of industrial
agglomerated areas, the region of hazard analysis is not limited to industrial agglomerated areas.
5) Natural conditions Topography maps, bathymetry maps or DEM are collected as the basic information of the study area.
Land use maps and geological maps are also useful for more precise analysis.
Step 2: Setting of Scenario Earthquake A scale of tsunami disaster for risk assessment is decided based on the collected data. The scale of
tsunamis is defined as the scale of the earthquake which generates the tsunami.
6) Statistical analysis of earthquake (Gutenberg-Richter Law) The recurrence interval of scenario earthquakes that generate tsunami is decided based on the
earthquake catalogue around the source area of scenario earthquakes. The relationship of earthquake
magnitude and the frequency of earthquake occurrence, which is known as the Gutenberg-Richter Law
is used. The annual probability or recurrence interval of the scenario earthquake of arbitrary magnitude
can be estimated.

Outline of Natural Hazard Assessments
3-7
7) Setting of scenario earthquake A scenario earthquake and its magnitude should be set for the Area BCP. If a larger magnitude is
assumed, the components of the Area BCP increase and the process to formulate it becomes more
complicated. However, business continuity after a disaster will be more stable. Conversely, if a smaller
magnitude is assumed, the Area BCP can be more easily formulated. However if the disaster is larger
than the estimated scenario, business continuity may become difficult. Therefore, it is desirable to
decide the magnitude of the scenario earthquake by holding discussions with stakeholders, including
citizens, on local disaster management planning, governmental policy and feasibility of the plan.
Step 3: Analysis and Evaluation
8) Setting of tsunami (earthquake) model The fault parameters of the scenario earthquake such as location, size, slip, etc. are decided for
numerical simulation.
9) Selection of tsunami simulation model Tsunami propagation simulations require complicated numerical calculations. There are several
theories to describe tsunami propagation, depending on the relationship between wavelength and depth
of water or distance to the tsunami source area. Several computing programs have been developed in
for these theories; however, most of them are intended to be used by researchers or engineers with
expert knowledge.
10) Preparation of input data The general input data for tsunami simulation is as follows. This data is given to each grid, which is
explained below.
10)-1 Topographical data For the simulation, it is necessary to create a topographical model for the area that includes the source
area of the scenario earthquake, the objective area, and the route of tsunami propagation. The
topographical model includes the topography of the sea floor, the topography of the land surface where
tsunami might run up, and the sea defense structures.
The simulation area is divided and covered by a square grid, and altitude and roughness data are
allotted to each grid. The size of grid is appropriate defined, taking into account the complexity of the
topography and the wave length of the tsunami. The grid size is usually defined from larger to smaller
according to the distance from coast, considering that the topography becomes more complex and
shorter wave components become dominant near the coast. This methodology is called "nesting." The
grid size is defined as, for instance, 1350 m → 450 m → 150 m → 50 m from the tsunami source
region to the coast.
10)-2 Roughness data

Risk Profile Report - Cavite, Laguna and Southern Part of Metropolitan Manila of the Philippines -
3-8
The effect of friction for tsunami wave propagation is expressed by Manning's roughness coefficient
(n). The roughness coefficient usually adopted for marine areas is n=0.025.
10)-3 Sea defense data Embankments and other sea defense structures are modeled as height data in the grid.
10)-4 Initial water height data (= deformation of sea floor) Changes of water heights caused by fault movement are given as initial conditions for tsunami
simulations. Changes of water height are assumed to be same as the vertical components of sea floor
deformation.
11) Tsunami simulation The general output of the tsunami simulation is as follows. Output items are obtained for each grid.
1. Maximum water height or maximum inundation height
2. Maximum velocity
3. Elapsed time of maximum water height
4. Elapsed time of given water height (x cm, for instance)
Outline of Natural Hazard Assessments
3-9
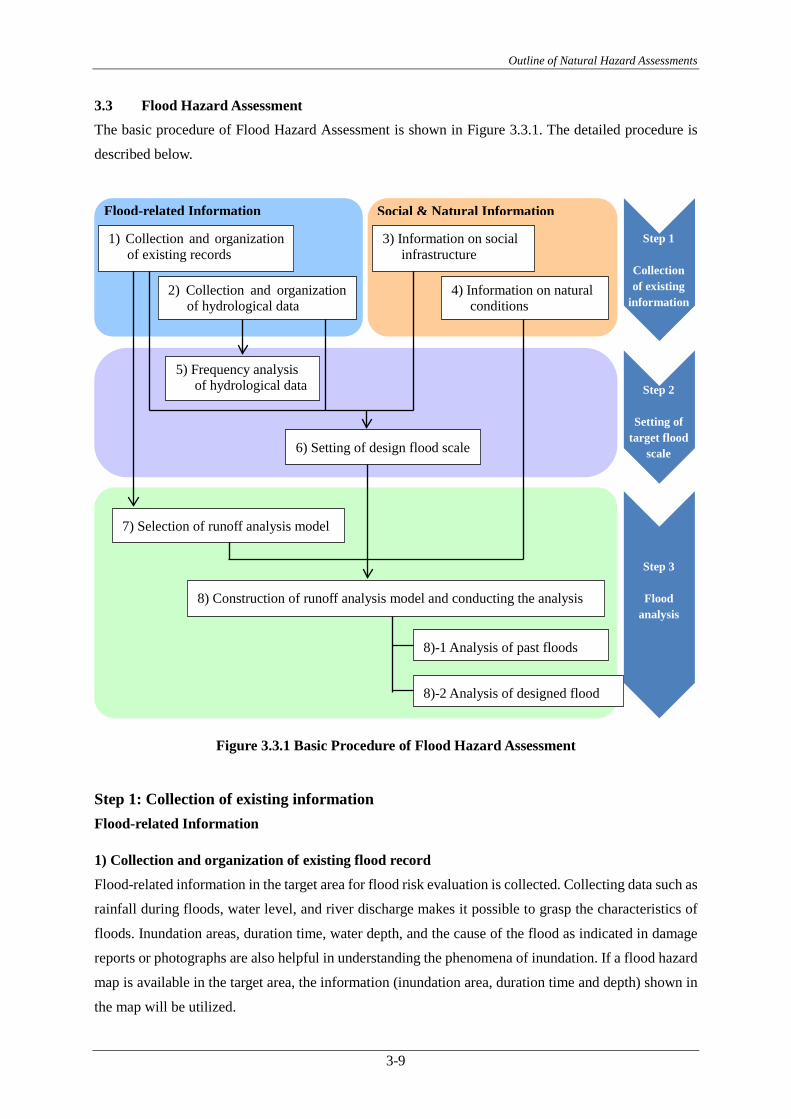
3.3 Flood Hazard Assessment The basic procedure of Flood Hazard Assessment is shown in Figure 3.3.1. The detailed procedure is
described below.
Figure 3.3.1 Basic Procedure of Flood Hazard Assessment
Step 1: Collection of existing information Flood-related Information
1) Collection and organization of existing flood record Flood-related information in the target area for flood risk evaluation is collected. Collecting data such as
rainfall during floods, water level, and river discharge makes it possible to grasp the characteristics of
floods. Inundation areas, duration time, water depth, and the cause of the flood as indicated in damage
reports or photographs are also helpful in understanding the phenomena of inundation. If a flood hazard
map is available in the target area, the information (inundation area, duration time and depth) shown in
the map will be utilized.
1) Collection and organization of existing records
2) Collection and organization of hydrological data
3) Information on social infrastructure
4) Information on natural conditions
5) Frequency analysis of hydrological data
6) Setting of design flood scale
7) Selection of runoff analysis model
8) Construction of runoff analysis model and conducting the analysis
8)-1 Analysis of past floods
8)-2 Analysis of designed flood
Flood-related Information Social & Natural Information
Step 1
Collection of existing
information
Step 2
Setting of target flood
scale
Step 3
Flood analysis

Risk Profile Report - Cavite, Laguna and Southern Part of Metropolitan Manila of the Philippines -
3-10
2) Collection and organization of hydrological data Existing hydrological data in target area is collected. Data on rainfall (hourly data or daily data), river
water level, river discharge and tidal level should be collected. If there are river facilities such as dams or
gates, it is advisable to collect the operational reports of these facilities during floods. Before organizing
this data, confirm if there is incorrect or missing data.
Based on the collected hydrological data, flood duration, probability of flood occurrence, and situation
when the largest recorded flood occurred will be analyzed. Cross-cutting profile data is also helpful in
this step of model construction.
Information on Social Infrastructure and Natural Conditions
3) Collection and organization of information on social infrastructure Information on industrial estates and social infrastructure that would be affected by flooding is collected.
Social infrastructure can be divided into two categories: the transportation infrastructure related to
transport to and from industrial estates and the lifeline infrastructures necessary to maintain business
operations.
The actual region where flood hazard is to be assessed is decided based on the distribution of
infrastructure facilities. As infrastructure facilities are widely spread outside of industrial agglomerated
areas, the region of hazard analysis is not limited to industrial agglomerated areas.
4) Collection and organization of information on natural conditions Topographic maps are collected, and data relating to natural conditions such as altitude, land use pattern
and geology is organized. From the aspect of data accuracy, it is advisable to use a detailed map with a
scale of 1/5,000 or more.
Step 2: Setting of target flood scale Based on the data collected in Step 1, the target flood scale for formulating the Area BCP is set. The
basic flood scale set as the largest recorded flood, 50-year return period, 100-year return period and
200-year return period.
5) Frequency analysis on hydrological data Probable hydrological value is calculated using collected hydrological data. The procedure for
processing statistics will involve applying probability density functions such as exponential distribution,
evaluating the probability density function, and then determining the appropriate probability density
function. For reliable probability density function results, samples for at least 50 years are needed.
6) Setting of design flood scale The design flood scale for formulating the Area BCP is set. If the designed flood is large in scale, there
are more components for formulating the Area BCP. In this case, a considerable amount of work is
necessary to formulate the Area BCP, but level of safety in the plan is high. Conversely, if the designed

Outline of Natural Hazard Assessments
3-11
flood scale is small, the target scope of the Area BCP becomes limited, which makes it easier to
formulate the Area BCP. In this case, there is a possibility the Area BCP will not be effective. Hence,
design flood scale should be set in accordance with regional city plans, administrative strategy, and
feasibility of plan, and upon discussions with stakeholders, including local residents.
Step 3: Runoff analysis/evaluation
7) Selection of runoff analysis model The appropriate model for analyzing the characteristics of floods in target area is selected. The
appropriate analysis model should be selected from the viewpoint of runoff characteristics, required
resolution, and financial capacity for purchasing software. At first, it is preferable to use free software
like IFAS for formulating the Area BCP.
8) Construction of flood analysis model and conducting the analysis
8)-1 Analysis of past floods Flood analysis with the selected model and past rainfall data is conducted. After that, simulation
accuracy is confirmed by comparing the results of the simulation with actual discharge records. If the
precision of the simulation is not satisfactory, attempts to improve the accuracy will be made by
modifying parameters.
8)-2 Analysis of designed scale flood Runoff analysis on the designed flood is conducted.

Profile of the Pilot Area
4-1
Chapter 4 Profile of the Pilot Area
4.1 Outline of the Pilot Area
The pilot areas in the Philippines are industrial agglomerated areas and the areas surrounding them.
They are located in Cavite Province, Laguna Province and southern part of Metropolitan Manila.
Pilot areas are encircled by the red dashed line as shown in Figure 4.1.1. Basic information on the
pilot areas is shown in
Figure 4.1.1 Location of Pilot Areas
Laguna Cavite
Metropolitan Manila
Batangas

Risk Profile Report - Cavite, Laguna and Southern Part of Metropolitan Manila of the Philippines -
4-2
Table 4.1.1 Basic Information on the Pilot Areas
Pilot area Industrial agglomerated areas and the areas surrounding them. They are located in Cavite Province, Laguna Province and Southern part of Metro Manila.
Area and population (As of 2010 May)
Local Government Area (km2) Population
Metropolitan Manila 636 11,855,975
Cavite Province 1,427 3,090,691
Laguna Province 1,824 2,669,847 * As of May 2010, National Statistics Office, the Philippines
Natural conditions The island of Luzon, where Metropolitan Manila, Cavite Province and Laguna Province are located, is a mountainous and volcanic region. Laguna de Bay, the largest lake in the Philippines with the surface area of 949 km2, is located at the southeast of Manila Bay. The Pasig River flows from Laguna de Bay into Manila Bay. The Pasig River is regarded as the most important river in the Philippines since it flows across the central area of Metropolitan Manila. There are two lakes, named Caldera and Taal, in the south of Cavite Province. Mount Taal, the smallest volcano in the Philippines, rises in the center of Lake Taal. The climate is tropical monsoon. The annual mean temperature is 26°C-27°C. There are two seasons: the rainy season (June to November) and the dry season (December to May).
4.2 Outline of the Local Authorities
4.2.1 Local Administrative System of the Philippines
The Philippines is divided into three main classes and sub-divided into 17 administrative regions.
There are 81 provinces in the Philippines. The local administrative system in the Philippines
consists of provinces, cities, municipalities and barangays.
There are three types of cities under the jurisdiction of province: (1) Highly Urbanized Cities, (2)
Independent Component Cities, and (3) Component Cities. Highly Urbanized Cities and
Independent Component Cities are on an equal footing with provinces. All cities are under the
jurisdiction of the province. All of municipalities and cities are composed of barangays. Each local
government has a chief executive, vice-chief executive and councilors, who are elected. Barangays
composed of 50-100 households are the smallest administrative divisions in the Philippines.
Barangays have a captain, councilor’s secretary and financial officer but there is no central
government staff.
The National Capital Region (NCR) is composed of one city and 16 municipalities. The NCR is
positioned at the local government level.

Profile of the Pilot Area
4-3
Figure 4.2.1 Local Administrative System in the Philippines
4.2.2 Disaster Management Organizations
(1) Country Level
The National Disaster Coordination Council was renamed as the National Disaster Risk Reduction
Management Council (NDRRMC) by Republic Act 101211. More authority was granted to
NDRRMC followed by the increase of its membership from 23 to 43 (including participants from
civil society and private sector). The chairperson of NDRRMC is the Secretary of the Department
of National Defense (DND) and four Vice-chairpersons are also appointed in charge of four
thematic areas. The Administrator of the Office of Civil Defense (OCD), DND is appointed as the
Executive Director for NDRRMC. Figure 4.2.2 below shows a detail organizational structure.

Risk Profile Report - Cavite, Laguna and Southern Part of Metropolitan Manila of the Philippines -
4-4
Source: Data collection survey on ASEAN regional collaboration in disaster management final report.
Note: Local level disaster risk reduction and management councils are established as follows: (1) 17 RDRRMCs (region) (2) LDRRMCs (80 provinces, 138 cities, 1496 municipalities), (3) BDRRMCs (42,027 Barangays. RDRRMCs
are chaired by OCD Regional Directors, while other levels are chaired by the Local Chief Executives.)
Figure 4.2.2 Philippines’ Disaster Management Structure
(2) Metropolitan Manila
The disaster management organization of Metropolitan Manila is shown in Figure 4.2.3. The
Chairperson of the Metropolitan Manila Development Authority (MMDA) posts as Chairman of
the organization, and the Office Civil Defense (OCD) NCR Regional Director posts as Senior
National Disaster Risk Reduction and Management Council (NDRRMC)
Secretariat (Executive Director)
Administrator, Office of Civil Defense, DND
Preparedness
Vice Chairperson
Secretary of the Department of
Interior and Local Government
Prevention and Mitigation
Vice Chairperson
Secretary of the Department of Science and Technology
Response
Vice Chairperson
Secretary of the Department of
Social Welfare and Development
Rehabilitation and Recovery
Vice Chairperson
Director-General of
the National Economic and Development
Related governmental
agencies and CSO
representative
Related governmental
agencies and CSO
representative
Related governmental
agencies and CSO
representative
Related governmental
agencies and CSO
representative
Regional Disaster Risk Reduction and Management Councils (RDRRMC: 17)
Local Disaster Risk
Reduction and
Management Councils
(80 Provinces)
Local Disaster Risk
Reduction and
Management Councils
(138 Cities)
Local Disaster Risk
Reduction and
Management Councils
(1496 Municipals)
Barangay Disaster Risk
Reduction and
Management Committee
(42027 Barangays)
Chairperson
The Secretary of Department of National Defense (DND)

Profile of the Pilot Area
4-5
Vice-Chair. The Senior Vice-Chair supervises Vice-Chairs in four fields: (1) preparation and
mitigation, (2) preparedness, (3) response, and (4) rehabilitation.
Figure 4.2.3 Disaster Management Organization of Metropolitan Manila
(3) Cavite Province
The disaster management organization of Cavite Province is shown in Figure 4.2.4. The Committee
on Peace, Public Safety and Order is in charge of disaster management in Cavite Province.
Figure 4.2.4 Disaster Management Organization of Cavite Province
CHAIRMAN (Governor)
VICE-CHAIRMAN (Vice-Governor)
SECRETARIAT & MEMBER Cavite
Office of Public Safety
Provincial Planning & Development Coordinator
Provincial Veterinarian
Provincial Agriculturist
President – Association of Barangay Chairpersons
(ABC)
Provincial Social Welfare Officer
Provincial Environment & Natural Resources Officer
SP Chair – Committee on Peace, Public Safety & Order
Representative, Philippine Red Cross
Provincial Health Officer
Administrator for Community Affairs
Police Provincial Director (PNP)
President, Cavite Chamber of Commerce & Industry
Provincial Budget Officer
Division Superintendent of Schools (DepED)
Bureau of Fire Provincial Director
Representative, Philippine Coast Guard
Provincial Engineer
SP Chair – Committee on Women, Family, Elderly &
Social Services
Provincial Director (DILG)
Representative, Armed Forces of the Philippines
CHAIRMAN (MMDA Chairperson)
SENIOR VICE-CHAIR (OCD NCR Regional
Director)
VICE-CHAIR FOR PREVENTION AND
MITIGATION (DOST NCR Director)
VICE-CHAIR FOR PREPAREDNESS
(DILG NCR Director)
VICE-CHAIR FOR RESPONSE
(DSWD NCR Director)
VICE-CHAIR FOR RECOVERY &
REHABILITATION (Designated MMDA Officer)
MMDA Senior Official [MMDA GM] &
Resource Persons/Advisors
MMDRRMC EMERGENCY ACTION AGENCIES
SECRETARIAT (OCD & MMDA)
MMDRRM OPERATION CENTER (MMDA FCIC)

Risk Profile Report - Cavite, Laguna and Southern Part of Metropolitan Manila of the Philippines -
4-6
(4) Laguna Province
The disaster management organization of Laguna Province is shown in Figure 4.2.5. The Provincial
Disaster Risk Reduction and Management office is in charge of disaster management in Cavite
Province. The Provincial Disaster Risk Reduction and Management Office works on research and
planning, warning and training, and water search and rescue.
Figure 4.2.5 Disaster Management Organization of Laguna Province
4.3 Present State of Industrial Agglomerated Areas
For the formulation of the Area Business Continuity Plan, the Cavite Economic Zone was selected
as the industrial park representing the others in the Industrial Agglomerated Areas. There are 42
industrial parks in the three provinces, i.e. Cavite, Laguna and Batangas. Japanese tenants are
located in 17 of 42 industrial parks. The total number of the Japanese companies is 292. Of this, 96
Japanese companies are located in the Cavite Economic Zone, which accounts for the largest
proportion.1
1 ASEAN-Japan Centre Website
Development Planning Officer
Provincial Agriculturist
Provincial Veterinarian
Provincial Budget Officer
Provincial Environment &
Natural Resource Officer
Commander, 202nd Infantry Brigade
(Army)
Commander, 403rd CDC, 4RCDG Army Reserve
Command
Provincial Police Director
Provincial Fire Marshall
Representative
Nearest NAVY Unit
Administrator Laguna Chapter,
Philippine Red Cross
CHAIRMAN (Governor, Province of Laguna)
Social Welfare & Development Officer
Provincial Disaster Risk Reduction & Management
Office
Administrative, Research & Planning
Operations, Warning & Training
Water Search and Rescue
Representative Department of
Education
Representative Department of Interior
& Local Gov’t

Profile of the Pilot Area
4-7
4.3.1 Industrial Parks in the Industrial Agglomerated Areas
The JICA Study Team visited Cavite Economic Zone and Laguna Technopark for interviews. The
following are summaries of these two parks.
Cavite Economic Zone (CEZ)
The Cavite Economic Zone is wholly-owned and governed by PEZA, which currently manages
2,900 companies with 912 thousands employees all over the Philippines. There are 292 tenants
presently operating in CEZ. The companies are mainly from the electronics industry, which
accounts for 99 tenants. This is followed by the fabricated metal products industry with 50 tenants
and the garments/textiles and rubber/plastic industries with 35 tenants each. The rest include
industries related to by paper/cardboard, machinery/equipment, office/computing machines, and
printing, with a total of 17, 9, 9, and 6 tenants, respectively. Many industries are Japanese
companies, which accounts for 32% of the tenant population. South Korean tenants have similar
numbers.
Electric power is supplied to CEZ by
Trans Asia Oil, which is an IPP that
generates and sells electricity. Power
transmission is conducted by the
government corporation NGCP 2 .
TRANSCO and MELARCO
distribute electricity to the end user,
PEZA. In January 2013, a power
purchase agreement between the IPP
and PEZA was signed for five years.
PEZA contracts with each tenant for
power supply and charges for
distribution at a rate of PHP 0.6 per
kWh, which includes direct costs and
overhead costs.
Laguna Technopark, Inc. (LTI)
Laguna Technopark, Inc. is located in the government Priority Promotion Centre in the Calabarzon
region near Metropolitan Manila.
1) 50 km from the Manila International Airport
2) 52 km from the Manila North Harbor
2 National Grid Corporation of the Philippines, privatized to be in charge of the operation and maintenance of national transmission lines owned by Transco (state-run company).
Source: PEZA
Figure 4.3.1 Master Plan of the Cavite Economic Zone

Risk Profile Report - Cavite, Laguna and Southern Part of Metropolitan Manila of the Philippines -
4-8
3) 44 km from the Makati Central Business District, i.e. the largest financial center
In 1989, LTI was established as a joint venture between Ayala Land, Inc. (75% of investment) and
the Mitsubishi Corporation (25% of investment). LTI is an operating Special Economic Zone with
220 tenants. Most of these tenants are Japanese. To date, there are 48% Japanese enterprises
operating inside the LTI, which are mostly export manufacturing companies whose businesses
activities vary from semi-conductors, automotive, pharmaceuticals, and home appliances3. The
remaining 52% is from the countries including the Philippines, Korea, America, Italy, Ireland,
Singapore, Germany, Australia, Canada, France, Russia, India, Spain, Malaysia, and the
Netherlands. The actual number of Japanese-owned companies in Laguna Technopark is 90 to
date4. Most of the tenants, i.e. 70%, are exporting companies. The leading manufacturers are from
the automotive industry with electronic manufacturing companies coming as second.
Infrastructure at Laguna Technopark includes:
1) Highway–grade concrete roads
2) Digital hybrid fiber-optic telecommunication network capable of full video, data, internet and
voice communications
3) Ample supply of industrial water and potable water sourced from deep wells
4) Available pipelines for the supply of industrial gasses
5) Sewer and drainage system
6) Power substation with one 133MVA and one 50MVA transformer
7) Easily accessible via the South Luzon Expressway and three roads
8) Fire brigade and security force owned and managed by the Laguna Technopark Association
(membership system)
9) Bureau of Customs office
10) Administration office
11) Banking facility
12) Multi-purpose hall
13) Transport terminals
Typhoons (e.g. Milenyo5 and Ondoi6) have caused damage to the sewerage system, wastewater
treatment facility, and electricity supply system. Therefore, Melarco installed power substations
consisting of transformers7 dedicated to LTI to maintain a stable supply of electricity to the tenants.
Routine inspections of the power supply system are conducted to minimize power outage caused by
floods and typhoons, which may topple utility poles and break electric wires.
3 Honda, Isuzu, Termo, Hitachi, Fujitsu-Ten, Takata 4 Source: PEZA and LTI 5 September 2006 6 Second most devastating cyclone(September 2009) 7 Two transformers: 133MVA and 50MVA

Profile of the Pilot Area
4-9
4.3.2 Japanese Manufacturer of Medical Products and Equipment
The main business is of this company is the manufacturing of syringes and needle. They hold the
largest production share of syringes and needles within the company group at 60%, supplying the
markets in Asia, the U.S. and the EU. There are 16 Japanese employees and 2,300 local employees,
who commute by company buses from their areas of residence. The factory in Japan is the only
alternative supply source for the products.
Regarding their Business Continuity Plan, the head office has created the basic structure. Having an
alternative factory is the best solution, but this is not possible. The basic idea for the plan is to
pursue temporary alternatives until the production and supply level is back to its normal state. If
production stops completely in the Philippines, the Japanese factory will provide an alternative
supply, and vice versa. However, before switching the supply source, the following current solution
for inventory control should be achieved.
1) Raw materials, which take longer to produce, are to have an inventory reserve of two months.
2) Wrapping film, silicone, and solvents are purchased at the same time from the two sources for
security purposes.
3) As metal molds are important tools for producing molded products, the manufacturer contracts
with suppliers to be ready to reproduce and deliver such upon notice.
4.4 Transport Infrastructure Conditions
4.4.1 Roads
The population continues to concentrate around the Manila metropolitan area. Including the
suburbs, the population is 21.29 million (as of 2011) and the population density is about 3 times
that of Tokyo.
Although the transportation network supporting this population is still at an insufficient level, it is
improving gradually through the development of circular/radial roads and highways, etc., traffic
congestion is still serious.
The transport system in the Manila metropolitan area is still fundamentally composed of a road
traffic system. However, there has been a gradual shift to a railed transport system since it was
introduced to the area.
The SLEX (South Luzon Expressway) and Metro Skyway connect Laguna Province to the southern
metropolitan area. Cavite Province is connected to the southern metropolitan area by the
Manila-Cavite toll road.

Risk Profile Report - Cavite, Laguna and Southern Part of Metropolitan Manila of the Philippines -
4-10
Figure 4.4.1 Major Expressway
Table 4.4.1 Introductory Note
Source: JBIC, Investment Environment of the Philippines
2013
Table 4.4.2 Outline of Related Expressways
Name Section No. of Lanes
Length (km)
Year of Opening/ Extension
South Luzon Expressway (SLEX)
Calanba-Laguna 8, 6, 4 36 (60) 1977 / 2011
Manila-Cavite Expressway (CAVITEX)
Manila-Cavite 4 14 1999 / 2011
Southern Tagalog Arterial Road
SLEX-Batangas 4, 2 42 2001 / 2008
Metro Manila Skyway Metro Manila 6, 4 20 1977 / 2009 Source: JBIC, Investment Environment of the Philippines 2013
Buses play an important role as a means of transportation in Manila. Almost all bus routes use
EDSA Avenue, which is one of the beltways in Manila, and where the bus centers are located.
Jeepneys, tricycles, and taxis are also used. Cycle rickshaws called pedicabs also serve as an
important and popular means of transportation.
4.4.2 Ports
(1) Manila Port
The Manila Port consists of the North Harbor, South Harbor, the Manila International Container
Terminal (MICT), and the grain terminal, which is located along the Pasig River and consists of
multiple light cargo facilities.
Name Legend

Profile of the Pilot Area
4-11
Figure 4.4.2 Manila Port
Table 4.4.3 Manila Port
Area No. of Berths
Length (m)
Width (m)
Water Depth
(m) Remarks
North Port 9 220~250 80~100 5~8 Comb-shaped port, total length 1,200m South Port 7 240~430 50~100 14 2 piers are for containers.
International cargo is also handled. Total length: 975m Container yard: 30ha
MICT 6 ― ― 10.5~12 Total length: 1,520m, Total area: 94ha Container yard: 58ha Cranes: 10
Source:Ministry of Land, Infrastructure, Transport and Tourism, Transportation Situation of the Philippines 2011
The volume of cargo handed at Manila Port is increasing yearly through the reinforcement of
cargo-handling equipment.
Table 4.4.4 Shipping and Cargo Statistics: Port of Manila 2012
Item Breakdown North Port South Port MICT Total Number of vessels
5,329 5,671 1,862 12,862
Cargo Throughput (mT)
Total 19,174,424 11,130,626 19,966,465 50,271,515 Domestic 14,482,959 4,232,355 1,054,242 19,769,556 (Container) 10,902,311 1,482,220 1,054,242 13,438,773 Foreign 4,691,465 6,898,271 18,892,293 30,482,029 (Container) 0 5,973,041 17,940,202 23,913,243 Transit 0 0 19,930 19,930 Transship 0 0 113,668 113,668
Passenger 766,942 161,500 0 928,442 Source: Interview by local consultant

Risk Profile Report - Cavite, Laguna and Southern Part of Metropolitan Manila of the Philippines -
4-12
It can be seen that demurrage time and level of ship congestion is increasing.
Table 4.4.5 Demurrage Time per Ship
Year 1998 2005 2010 No. of Hours 4.06 (2001) 3.15 7.69
Source: IC-Net Limited, Batangas Port Development Work (II)
(2) Batangas Port
Batangas Port currently has an area of 22.6 ha, and Phase I facilities are listed as follows.
Table 4.4.6 Batangas Port Facilities
No. Usage Quantity Specification 1 Foreign General Cargo Berth 1 185m long, 10m deep 2 Multipurpose Berth 1 230m long, 10m deep 3 Domestic General Cargo Berth 3 470m long, 7.3mdeep 4 Ferry Berth 1 124m long, 4m deep 5 RORO Berth Pier Type 4 5m deep 6 RORO Berth Wharf Type 2 5m deep 7 Fatcraft Berth 7 4-70m long, 2-75m long, 1-120m long 8 Passenger Terminal 1 2 layers×2,132 m2 9 Foreign General Cargo Transit Shed 1 3,892 m2 10 Foreign General Cargo Open Area 1 1.3 ha 11 Domestic General Cargo Area 1 1 9,943.70 ha 12 Domestic General Cargo Area 2 1 3.4 ha
Source: PMO-Batangas Officers, Port Introduction Pamphlet
Currently, there is only one regular service route for container ships at Batangas Port. Therefore,
there is little growth in cargo throughput. The cause of this is that there has been no shift in cargo
handling from Manila Port to Batangas Port.
Table 4.4.7 Cargo at Batangas Port 2012
Item Breakout Total No. of Vessels 5,671 Cargo Throughput (tons)
Total 11,130,626 Domestic 4,232,355 (Container) 1,482,220 Foreign 6,898,271 (Container) 5,973,041 Transit 0 Transship 0
Passengers 161,500 Source: Interview by local consultant

Profile of the Pilot Area
4-13
4.4.3 Railways
(1) Outline
The railways are four railways (4) in total: one national railway and three light rail lines.
Figure 4.4.3 Traffic Infrastructure in the Target Region
(2) Philippine National Railway: PNR
The railroad currently operates in only four directions from the Manila metropolitan area because
of road network maintenance, natural disasters, decreased passengers, etc. The service is called
Commute Express or Commex. 47,000 passengers are carried by 24 motor cars.
Table 4.4.8 PNR Operating Conditions
Line Section length Operation Remarks Manila-Legazpi 474km 1 round-trip per day Bicol Train Manila-Naga 2 trips per day One way Manila-Binan 40km 1 round-trip per day Commuter train Manila-Alaban 23 round trips per day
Source: JBIC, Investment Environment of the Philippines 2013
(3) Rapid Transit Railway
The LRT (Light Railway Train) No. 1 and No. 2 lines, and the MRT (Metro Rail Transit) No. 3
line operate in the Manila metropolitan area.

Risk Profile Report - Cavite, Laguna and Southern Part of Metropolitan Manila of the Philippines -
4-14
LRT is falls under the Light Rail Transit Authority (LRTA), and MRT is under the management of
the Department of Transportation and Communications (DOTC). The Metro Rail Transit
Corporation (MRTC) is in charge of management. The number of passengers does not seem to be
increasing.
Table 4.4.9 Outline of Rapid Transit Line
Name Length (km)
Start Year
No of stations
Average No. of Passengers
Operation Interval at Rush Hour
LRT1 18 1985 20 Approx. 470,000/day 1 in 1 minute LRT2 13 2004 11 Approx. 200,000/day 1 in 5 minutes MRT3 17 2000 13 Approx. 500,000/day 1 in 3 minutes
Source: JBIC, Investment Environment of Philippines 2013
Table 4.4.10 Number of Passengers(million people)
Name 2010 2011 LRT1 155.87 156.66 LRT2 63.36 63.83 MRT3 153.15 158.81
Total 372.38 379.30 Source: LRTA and DOTC / Metrostar Express
4.4.4 Airports
The only airport in the Manila metropolitan area is the Ninoy Aquino International Airport (NAIA).
It is a commercial airport managed by the Manila International Airport Authority (MIAA). There
are two (2) runways: 3,737 m x 60 m, and 2,258 m x 45 m, and four (4) terminals as described
below.
Although it is desirable to operate with 36 landings/departure per hour for one runway, in the
summer, this number can reach 50 landing/departures. Therefore, nighttime use is being studied.
Table 4.4.11 Ninoy Aquino International Airport
Terminal Use Japanese Airlines using terminals Remarks
Terminal 1 Only for international airlines JAL 16 gates Terminal 2 Centennial Terminal: only for Philippine
Airlines (International and Domestic)
Terminal 3 International and domestic mixture ANA Terminal 4 Only for domestic airlines Local airlines
Source: Wikipedia
The Ninoy Aquino international airport is becoming increasingly important every year, and growth
has been remarkable in recent years. However, despite this growth, cargo volume is not stable, due
to significant yearly changes. Recently, the government has been using two airports in the Manila
Metropolitan area: the Ninoy Aquino International Airport and the Clark Airport. The Clark airport

Profile of the Pilot Area
4-15
was used by 1.015 million passengers travelling internationally 2012. This is about four (4) times
the number of the passengers in 2005 (224,000).
The Ninoy Aquino International Airport will function as a primary shelter for evacuees during
times of disaster.
Table 4.4.12 Air Traffic Statistics: Manila and Clark
Airport 2008 2009 2010 2011 2012 Manila (NAIA) International Passengers (x1,000) 11,273 11,203 12,380 12,969 14,140
Cargo (x1,000 MT) 263 238 307 269 311 Aircraft (x1,000) 60.5 64.4 67.6 144.8 159.7
Domestic Passengers (x1,000) 10,980 12,905 14,940 16,583 19,750
Cargo (x1,000 MT) 92 186 119 121 150 Aircraft (x1,000) 144.7 158.4 168.6 290.7 386.8
Clark International Passengers (x1,000) 491 560 608 725 1,015
Cargo (x1,000 MT) 0.1 0.1 <0.1 <0.1 <0.1 Aircraft (x1,000) 2.0 2.6 2.7 7.0 9.3
Domestic Passengers (x1,000) 40 31 46 42 300
Cargo (x1,000 MT) <0.1 <0.1 <0.1 0 0 Aircraft (x1,000) 0.6 0.6 0.4 0.6 3.5
Source: DOTC-Air Transport Planning
4.5 Lifeline Facilities and Public Services
4.5.1 Electricity
(1) Outline
In Metropolitan Manila and the Province of Cavite, the National Power Corporation (NPC)
supplies electric power to the Manila Electric Company (MERALCO), which distributes electricity
to the general public. First Laguna Electric Cooperative (FLECO) supplies electricity in the
Province of Laguna, and MERALCO distributes in the other areas. It is an area equivalent to 25%
of the population of Philippines, with 5,026,543 customers served (as of 2011).
MERALCO is supplied from the independent power producers (IPP) NPC TSCs and WESM. They
are also making an effort to secure new suppliers for the long term.

Risk Profile Report - Cavite, Laguna and Southern Part of Metropolitan Manila of the Philippines -
4-16
Table 4.5.1 MERALCO Electricity and Sales
Company Power Distribution Area
Production (GWh)
Distribution Share (%)
Sales (100 million pesos)
Sales Share (%)
MERALCO National Capital Region (NCR) 32,471 67 506 30
Source: JBIC, Investment Environment of the Philippines 2013
Source: MERALCO 2011 Annual Report
Figure 4.5.1 Distribution Area of MERALCO

Profile of the Pilot Area
4-17
Source: Interview by local consultant
Figure 4.5.2 Power Facilities in Cavite Province
Source: Province of Laguna, Provincial Development and Physical Framework Plan
Figure 4.5.3 Power Facilities in Laguna Province

Risk Profile Report - Cavite, Laguna and Southern Part of Metropolitan Manila of the Philippines -
4-18
(2) Natural Disasters
When the Typhoon Milenyo hit in 2006, the electric power supply was stopped for about ten days
at the industrial park. This is because many utility poles outside were toppled. After this typhoon
passed, electric power was cut off over two days, because electrical substation facilities and old
power lines were damaged.
4.5.2 Water
The population with water service around the project area is as follows.
Table 4.5.2 Water Service Population by District in 2007
No. Area Approximate population
Ratio of the population to which safe water is supplied
(%)
Representative City
NCR NCR 12 million people 91 Manila IV-A CALABARZO
N 12 million people 89 Laguna, Cavite
Source: Ministry of Health, Labor and Welfare, International Water Promotion Report 2012.3
In the Philippines, the National Economic and Development Authority (NEDA) has formulated the
National Development Policy, and the maintenance and management of water services are
performed based on this policy. Moreover, the National Water Resource Board (NWRB) regulates
water rates and use of water resources.
The Metropolitan Waterworks Sewerage System (MWSS) has jurisdiction over the water and
sewage of the Metropolitan Manila. Other areas are managed by municipal corporations (Local
Government Units: UGUs), the water service cooperatives (Community Based Organizations:
CBOs) and the private sector companies (Private Operator: PO).

Profile of the Pilot Area
4-19
Source: Ministry of Health, Labor and Welfare, International Water Promotion Report 2012.3
Notes: DPWH: Department of Public Works and Highways LWUA: Local Water Utilities Administration DILG: Department of Interior and Local Government DOH: Department of Health
Figure 4.5.4 Relationship between Government Organizations and Water Utilities
Manila Water Company, Inc. (MWCI) and Maynilad Water Services, Inc. (MWSI) engage in water
supply services for Manila. In the West Zone, which is the target study area, Maynilad supplies
water.
Table 4.5.3 Water Consumption in South Manila 2012
Vendor Service area Consumption (mil. m3) No. of Connections MWCI Makati 47.6 N.A. MWSI Muntinlupa 3.65 125,511
MWSI Paranaque (Old Manila) 4.43 115,827
Source: Interview by local consultants
Management of Water and Sewage in Metro ManilaNow, management is under commission.
Development Aid
Funding Loan and Technical Support
Government
Local Administration
Management of Water and Sewage in Metro ManilaNow, management is under commission.
Development Aid
Funding Loan and Technical Support
Government
Local Administration

Risk Profile Report - Cavite, Laguna and Southern Part of Metropolitan Manila of the Philippines -
4-20
Source: Tokyo University, Water Project in the Philippines 2008
Figure 4.5.5 Service Area
In the Province of Laguna, there is no accurate data on water services. In the Province of Cavite,
water is supplied to 253,300 locations by 18 water suppliers, which consists of public institutions
and private companies. Of these locations, 40,778 are covered by MWSI. According 2012 statistics,
1.46 million m³ of water is supplied for 63,459 households.
Table 4.5.4 Water Service Population Ratio by Nationwide Level of Service
Population which receives service by government endorsement 80% Water supply by the other methods
(Private wells, tanks, etc.)
20%
Level III (Door-to-door piped water
supply) 45%
Level II (Water supply by
public taps) 10%
Level I (Independent heads such
as shallow wells) 25%
WD 20%
PO 5%
LGU-CBO 20%
LGU-CBO 35%
Source: Ministry of Health, Labor and Welfare, International Water Promotion Report 2012.3
4.5.3 Communications
(1) Outline
In the Philippines, the diffusion rate of fixed-line telephones is low. Therefore, they have a high
dependence on mobile phones as well as wireless communications, which is related to the quick
spread of the internet.

Profile of the Pilot Area
4-21
The Philippine Long Distance Telephone Company (PLDT) and Globe Telecom monopolize the
communications industry market. The National Telecommunications Commission (NTC) regulates
and supervises the telecommunication business.
(2) Telephones
In the Philippines, there is only small number of subscribers to fixed-line telephones. In 2011,
about 3.55 million people were subscribed, with a diffusion rate of 3.8%. This situation is greatly
affected by geographical conditions, as the country consists of island groups. Conversely, there are
94 million mobile phone subscribers with a diffusion rate of 99.3%, or one mobile phone per
person. A prepaid system, which uses cards, etc., to pay charges beforehand is commonly used. In
the mobile communications market, two companies, Globe and Smart, which are subsidiary
companies of PLDT, share 99% of the market.
Data fees are 50 pesos per day, which has caused an increase in the use social medias such as
e-mail and chatting. Although Nokia is most widely used model of mobile phone, various models
such as Samsung, Apple, and Blackberry are also used. It is expected that smart phone usage will
increase greatly in the future.
Table 4.5.5 Nationwide Subscribers and Diffusion Rates for Fixed-line Telephone Services
Year 2007 2008 2009 2010 2011 Number of Fixed-line Telephone Subscribers (x 1,000) 3,940 4,076 6,783 6,783 6,782
Diffusion Rate of Fixed-line Telephones (%) 4.4 4.5 7.4 7.3 7.2
Source: ITU-World Telecommunication/ICT Indicators Database 2012
Table 4.5.6 Fixed-line Telephones in Laguna and Cavite 2011
Province Items Fixed-line Telephone
Public Calling Office (PCO)
Laguna Total 257,525 471 PLDT 110,881 - Digital 60,878 471 Others 28,766 -
Cavite Total 151,913 169 PLDT 95,817 - Digital 52,096 169 Others 4,000 -
Total 409,438 640 Source: Interview by local consultant

Risk Profile Report - Cavite, Laguna and Southern Part of Metropolitan Manila of the Philippines -
4-22
Table 4.5.7 Nationwide Subscribers and Diffusion Rates for Mobile Phone Services
Year 2007 2008 2009 2010 2011 Number of Mobile Phone Subscribers (x 1,000) 57,345 68.117 75,587 79,896 87,256
Diffusion Rate of Mobile Phones (%) 64.7 75.5 82.4 85.7 92.0 Source: ITU-World Telecommunication/ICT Indicators Database 2012
(3) Internet
In 2011, there were about 5.2 million internet subscribers (5.5% diffusion rate), and there are about
1.8 million broadband subscribers (1.9% diffusion rate). Although internet usage has spread well,
broadband usage is not progressing due to high monthly charges.
The main internet sites used in the Philippines are: 1. Facebook, 2. Google, 3. Yahoo, 4. Wikimedia
Foundation, and 5. Microsoft. The share rates of devices used for internet access are: desktop PC
(61%), laptop PC (28%), and mobile devices (3%).
Table 4.5.8 Nationwide Subscribers and Diffusion Rates for Broadband Services
Year 2007 2008 2009 2010 2011 Number of Broadband Subscribers (x 1,000) 496 1,046 1,722 1,722 1,791
Diffusion Rate of Broadband % 0.6 1.2 1.9 1.8 1.9 Source: ITU-World Telecommunication/ICT Indicators Database 2012
(4) Broadcast Market
Terrestrial television broadcasting is offered by three commercial broadcasters (ABC-CBN, GMA
and ABC) three state-run broadcasters (Peoples TV, Solar TV and IBC). Cable TV is offered by
more than 1,000 companies. Broadcasting stations in Manila cover the provinces of Laguna and
Cavite.
4.5.4 Gas
(1) Gas
In the Philippines, liquefied petroleum gas (LPG) is used at home and for taxis. Gas cylinders of
about 11.2 kg are mainly used. Gas is commonly used by contacting one of the 23 sellers in
Metropolitan Manila and having it delivered.
There are two sellers in Cavite. Department of Energy (DOE) data shows that there are nine LPG
refinery plants in the Province of Laguna, with 13 in the Province of Cavite.
(2) Oil Depots
Oil depots in the region are as follows.

Profile of the Pilot Area
4-23
Table 4.5.9 Oil Depots in Metro Manila (NCR) and Region IV-A
Region Province City/ Municipality No. Storage Capacity (in 1,000 barrels, MB)
Total NCR 25 2,077 NCR Manila 8 1,645
Mandaluyong 3 144 Muntinlupa 1 2 Paranaque 1 94 Pasay 1 33 Taguig 2 5 Pasig 3 50 Navotas 1 76 Caloocan 2 1 Valenzuela 3 28
Total REGION IV-A* 15 10,623 Region IV-A (Calabarzon)
Cavite Rosario 1 77 Naic 1 100.93
Laguna Alaminos 1 1 Batangas Mabni 2 326
San Pascual 2 1,783 Calaca 1 504 Batangas City 4 767 Tabangao 2 7,065
Quezon Candelaria 1 0.5 *Includes refinery storage capacity.
Source: Interview by local consultant
4.5.5 Waste
(1) Outline
Management of waste in the Metropolitan Manila area is based on guidelines formulated by the
National Solid Waste Management (NSWMC). The Department of Environment and Natural
Resources (DENP) implements policy, and the Metro Manila Development Authority (MMDA)
performs comprehensive management from the collection of waste to waste disposal.
The amount of waste generated in the Metropolitan Manila area is 8,400 to 8,600 tons per day, with
0.7 kg generated per general household.
Sixteen municipalities in Laguna operate open dumpsites. Private entities also provide waste
disposal services. There are two sanitary landfills and one controlled dumpsite operated by private
entities. Laguna, like Cavite, has no data on the volume of generated waste.
In Cavite Province, since there is no sanitary disposal landfill site, waste disposal is a pending issue
among residents. Although the present throughput for waste treatment is unknown, statistics from
2002 show a volume of 1,540 m³/day. The Cavite municipal government has taken on the challenge
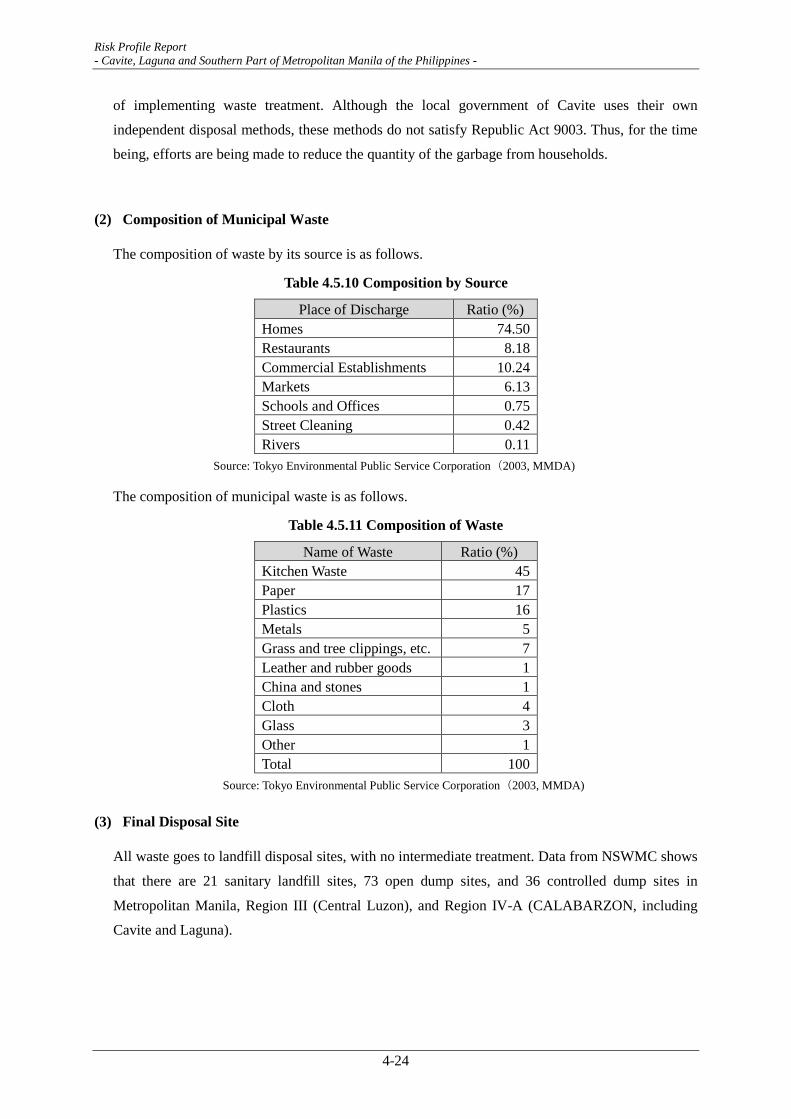
Risk Profile Report - Cavite, Laguna and Southern Part of Metropolitan Manila of the Philippines -
4-24
of implementing waste treatment. Although the local government of Cavite uses their own
independent disposal methods, these methods do not satisfy Republic Act 9003. Thus, for the time
being, efforts are being made to reduce the quantity of the garbage from households.
(2) Composition of Municipal Waste
The composition of waste by its source is as follows.
Table 4.5.10 Composition by Source
Place of Discharge Ratio (%) Homes 74.50 Restaurants 8.18 Commercial Establishments 10.24 Markets 6.13 Schools and Offices 0.75 Street Cleaning 0.42 Rivers 0.11
Source: Tokyo Environmental Public Service Corporation(2003, MMDA)
The composition of municipal waste is as follows.
Table 4.5.11 Composition of Waste
Name of Waste Ratio (%) Kitchen Waste 45 Paper 17 Plastics 16 Metals 5 Grass and tree clippings, etc. 7 Leather and rubber goods 1 China and stones 1 Cloth 4 Glass 3 Other 1 Total 100
Source: Tokyo Environmental Public Service Corporation(2003, MMDA)
(3) Final Disposal Site
All waste goes to landfill disposal sites, with no intermediate treatment. Data from NSWMC shows
that there are 21 sanitary landfill sites, 73 open dump sites, and 36 controlled dump sites in
Metropolitan Manila, Region III (Central Luzon), and Region IV-A (CALABARZON, including
Cavite and Laguna).

Profile of the Pilot Area
4-25
Table 4.5.12 Final Disposal Sites in Metro Manila
Name of Facility Start of Operation Type Area
(ha) Capacity (ton/day)
Montalban Solid Waste Disposal Facility – Rodriguez, Rizal
June 2002 Controlled 14 1,321.12
Barangay Tanza, Navotas Oct. 2002 Controlled 11 430.00 Lingonan, Valenzuela City 1998 Controlled 14 270.00 Payatas, Quezon City 1973 Opened 21 1,294.00 San Pedro, Laguna Controlled 14 467.00 Catmon, Malabon Opened 14 195.00 Pier 18, Tondo, Manila Opened - 186.00 Pulang Lupa, Las Pinas Controlled 7 228.00 Total 4,391.12
Source: Tokyo Environmental Public Service Corporation(2003, MMDA)
NSWMC has the following statistics limited to Laguna and Cavite, in addition to those shown
above.
Table 4.5.13 Number of Solid Waste Management Facilities: Laguna and Cavite 2011
Province Open Dumpsite
Material Recovery Facilities
Solid Waste Treatment
Number Total Area (ha)
Total Capacity (ton/day)
Laguna 12 128 4 >10.7 >350 Cavite 5 55 1 800 55
Source: NSWMC
Source: Province of Laguna, Ecological Profile
Figure 4.5.6 Solid Waste Facilities in Laguna Province

Risk Profile Report - Cavite, Laguna and Southern Part of Metropolitan Manila of the Philippines -
4-26
Source: Interview by local consultant
Figure 4.5.7 Solid Waste Facilities in Cavite Province
4.5.6 Schools
The number of schools and enrollment are as follows.
Table 4.5.14 Number of schools and enrollment
Laguna Province 2008-2009
Cavite Province 2012 Total
Schools Students Schools Students Schools Students Primary/Elementary 757 190,409 1,122 445,036 1,879 635,445 Public 473 - 373 350,650 846 - Private 284 - 749 94,386 1,033 - Secondary 251 94,300 513 242,751 764 337,051 Public 105 - 81 74,641 186 - Private 146 - 432 78,684 578 - Tertiary (College and Univ.)
73 - 69 - 142 -
Public 16 - 16 - 32 - Private 57 - 53 - 110 -
Source: Interview by local consultant

Profile of the Pilot Area
4-27
Source: Province of Laguna, Provincial Development and Physical Framework Plan
Figure 4.5.8 Education Facilities in the Province of Laguna
Source: Interview by Local Consultant
Figure 4.5.9 Education Facilities in the Province of Cavite
4.5.7 Hospitals
There are 102 hospitals in Laguna and Cavite Provinces.

Risk Profile Report - Cavite, Laguna and Southern Part of Metropolitan Manila of the Philippines -
4-28
Table 4.5.15 Number of Hospitals 2009
Item Laguna Cavite Total Total 49 53 102 Government Owned 9 12 21 Private 40 41 81 Number of Beds 1,600 2,312 3,912
Source: Interview by local consultant
Source: Province of Laguna, Provincial Development and Physical Framework Plan
Figure 4.5.10 Health Facilities in the Province of Laguna
Source: Interview by local consultant
Figure 4.5.11 Health Facilities in the Province of Cavite

Profile of the Pilot Area
4-29
4.6 Economic Relations with Neighboring Regions and Japan
4.6.1 Overview of the Economy of Pilot Area
The pilot area is known as the Calabarzon region (located south of Manila and composed of the
provinces of Cavite, Laguna, Batangas, Rizal and Quezon), and investment is being made in
activities such as the construction of industrial parks in the region. With this region, Japanese
companies, particularly in the automobile, machinery, and electronics industries, are currently
concentrated in the industrial parks of the Batangas region, including the First Philippines
Industrial Park (FPIP) and in Lima Technology Center (LTC). The Murata Manufacturing
Company, Brother Industries, Canon and SHIMANO are operating in FPIP, and companies such as
BANDAI, Furukawa Electric, and Epson are located in LTC. Conversely, there are few openings in
the industrial parks in Cavite and Laguna provinces, and thus it is almost impossible to move into
the area.
At the Port of Manila, which serves as an important port infrastructure in the capital region, imports
account for 70% and exports account for 30% of the total cargo movement. The port is operating at
full capacity on a consistent basis. In Batangas, roadway infrastructure connecting to the port of
Manila has been improved, and the Port of Batangas is also beginning to be utilized. Similarly, the
Port of Subic located north of Manila is also being improved. It is though that increased utilization
of these ports will contribute to the improvement of logistical efficiency in Metropolitan Manila.
Traffic congestion is especially serious in the central area of Metropolitan Manila, and takes about
6-7 hours to reach central Manila from the industrial parks in Batangas province (e.g. Lima
Technology Center). Conversely, the Port of Batangas is located at a distance of 35 km, and if it is
utilized, cargo could be shipped in a little over one hour, making the economic advantage obvious.
However, the low import volume at the Port of Batangas makes the operation of logistics
companies inefficient.
If the Port of Subic and Port of Batangas become available, in addition to the Port of Manila,
alternative logistics route will be secured, and the advantages are obvious even from the point of
view of BCP. However, the frequency and cargo handling volume of liner services is low under
current circumstances, and to date, there has not been much economic benefit.
4.6.2 Major Economic Policy
In terms of economic development plans in the Philippines, a national level plan known as the
Philippine Development Plan (PDP) and a regional level plan known as the Regional Develop Plan
(RDP) have been established. Both function to propose economic policy frameworks and are
closely linked to one another.

Risk Profile Report - Cavite, Laguna and Southern Part of Metropolitan Manila of the Philippines -
4-30
With respect to the details of the development process of the plan, a preliminary draft of the PDP
was prepared and circulated among regional offices for review, and then confirmed after their
opinions were reflected. After that, RDP is to be established based on PDP. A Regional
Development Council is established in each regional office of NEDA, and the opinion of the region
will be reflected through the Governor, who shall serve as a Council member.
For details of the programs specified in the economic development plan, refer to the Provincial
Development Physical Framework Plan (PDPFP) and Comprehensive Development Plan (CDP).
4.6.3 Economic Ties with Japan
In terms of trade value, Japan is the largest trade partner of the Philippines. Looking at the actual
performance over the period of 2010-2011, Japan was the largest export destination in terms of
export volume. Meanwhile, Japan is also the largest importer from the Philippines, along with the
U.S.A. As for the trade with other countries, import from China has increased drastically, and is
approaching the level of Japan and U.S.A.
Also, by examining the amount of foreign direct investment by country, Japan has become the
largest investor in the Philippines. In terms of the cumulative amount of FDI approved over the
past six years from 2006 to 2011, Japanese FDI has been the largest, accounting for almost
one-fourth of the total.
The trends in total approved Foreign Direct Investments in 2005-2010 are shown below. Due to the
negative economic impacts caused by the global economic recession, the total amount of FDI
dropped in 2009, but recovered in the following year of 2010. Among the four executing agencies,
PEZA takes a major role in promoting FDI from foreign countries.

Profile of the Pilot Area
4-31
Agency 2005 2006 2007 2008 2009 2010 Total
BOI 43,797 36,557 102,282 93,552 10,397 22,329 308,913 CDC 1,329 8,083 1,462 9,243 4,536 26,250 50,903 PEZA 49,842 52,338 87,376 70,355 103,421 142,167 505,500 SBMA 839 68,902 22,963 9,531 3,462 5,323 111,020 Total 95,807 165,880 214,083 182,681 121,816 196,069 976,335
Source: Invest Philippines 2012 (http://www.investphilippines.gov.ph/statistic2.html)
Figure 4.6.1 Total Approved Foreign Direct Investments by Promotion Agencies 2005-2010 [million pesos]
The trends of total approved Foreign Direct Investments by country of investor in 2005-2010 are
shown below. Of the total FDI in 2005-2010, Japan (231.4 billion pesos) is on the top, followed by
South Korea (158.0 billion pesos) and the United States (135.0 billion pesos).
Table 4.6.1 Total Approved Foreign Direct Investments by Country of Investor 2005-2010 [million pesos]
Country 2005 2006 2007 2008 2009 2010 Total Australia 563 689 705 1,347 799 615 4,719 Belgium - - - - - 30 30 Bermuda - - - 654 - - 654 Br. Virgin Islands 658 5,450 670 2,111 1,176 7,654 17,719 Canada - - - 582 312 157 1,051 Cayman Islands 13,817 384 521 3,616 - 10,638 28,976 China 195 17,935 1,822 2,307 2,392 5,657 30,307 Denmark - - - - 146 - 146 France 46 1,106 746 822 112 602 3,433 Germany 418 306 3,301 3,765 1,001 1,097 9,887 Hong Kong 93 553 1,464 1,135 3,923 59 7,227 India - - - - 634 1,857 2,491 Indonesia - 11 - - - - 11 Italy 8 18 21 - - - 47 Japan 27,539 20,066 38,587 16,116 70,737 58,333 231,378 South Korea 10,828 54,327 12,077 39,954 9,624 31,182 157,991 Luxembourg - - - - 726 - 726 Malaysia 69 856 7,562 112 96 754 9,449 Manx - - - - - - - Nauru - 439 - - - - 439 Netherlands 19,208 7,188 14,401 45,354 2,070 36,784 125,005 Norway - - 11,175 4,051 64 - 15,290
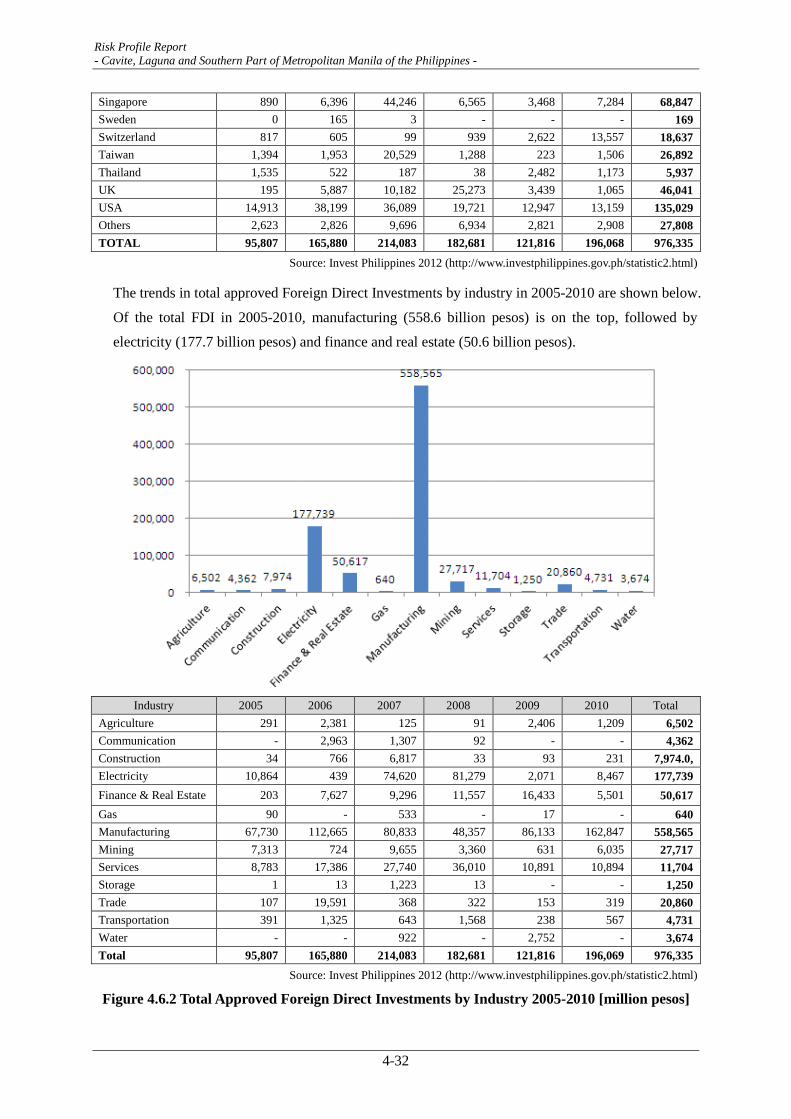
Risk Profile Report - Cavite, Laguna and Southern Part of Metropolitan Manila of the Philippines -
4-32
Singapore 890 6,396 44,246 6,565 3,468 7,284 68,847 Sweden 0 165 3 - - - 169 Switzerland 817 605 99 939 2,622 13,557 18,637 Taiwan 1,394 1,953 20,529 1,288 223 1,506 26,892 Thailand 1,535 522 187 38 2,482 1,173 5,937 UK 195 5,887 10,182 25,273 3,439 1,065 46,041 USA 14,913 38,199 36,089 19,721 12,947 13,159 135,029 Others 2,623 2,826 9,696 6,934 2,821 2,908 27,808 TOTAL 95,807 165,880 214,083 182,681 121,816 196,068 976,335
Source: Invest Philippines 2012 (http://www.investphilippines.gov.ph/statistic2.html)
The trends in total approved Foreign Direct Investments by industry in 2005-2010 are shown below.
Of the total FDI in 2005-2010, manufacturing (558.6 billion pesos) is on the top, followed by
electricity (177.7 billion pesos) and finance and real estate (50.6 billion pesos).
Industry 2005 2006 2007 2008 2009 2010 Total
Agriculture 291 2,381 125 91 2,406 1,209 6,502 Communication - 2,963 1,307 92 - - 4,362 Construction 34 766 6,817 33 93 231 7,974.0, Electricity 10,864 439 74,620 81,279 2,071 8,467 177,739 Finance & Real Estate 203 7,627 9,296 11,557 16,433 5,501 50,617 Gas 90 - 533 - 17 - 640 Manufacturing 67,730 112,665 80,833 48,357 86,133 162,847 558,565 Mining 7,313 724 9,655 3,360 631 6,035 27,717 Services 8,783 17,386 27,740 36,010 10,891 10,894 11,704 Storage 1 13 1,223 13 - - 1,250 Trade 107 19,591 368 322 153 319 20,860 Transportation 391 1,325 643 1,568 238 567 4,731 Water - - 922 - 2,752 - 3,674 Total 95,807 165,880 214,083 182,681 121,816 196,069 976,335
Source: Invest Philippines 2012 (http://www.investphilippines.gov.ph/statistic2.html)
Figure 4.6.2 Total Approved Foreign Direct Investments by Industry 2005-2010 [million pesos]

Profile of the Pilot Area
4-33
4.7 BCP Implementation Conditions
4.7.1 Major Natural Disasters and Disaster Management Awareness
In the Philippines, typhoons, floods, landslides and earthquakes are envisioned as the major natural
disasters. Most businesses are not concerned with natural disaster risk. The necessity of preparing
of plans for Disaster Risk Management (DRM) and emergency response is not yet well understood.
For most business people in Philippines, the concept of BCP is not well known, and they often do
not make a distinction between BCM and DRM.
4.7.2 Implementation of BCP
(1) Implementation of BCP by Enterprises
At businesses in the Philippines, since people have not experienced extensive disaster around
Manila, the awareness of risk management for natural disaster is quite low. General enterprises
have yet to develop a Disaster Management Plan or Contingency Plan. Furthermore, most
enterprises have not conducted activities for ensuring business continuity during disasters.
As an example of DRM implementation, manufacturing companies tend to consider disaster risk as
part of their corporate crisis management. Moreover, some enterprises that deal with international
business also consider their BCM and develop BCP.
Most SMEs fully rely on local authorities or large-scale companies to establish their disaster risk
mitigation systems, since they cannot afford to do so themselves.
(2) Implementation of BCP by Utility Suppliers and Distributors
Utility companies providing electricity, water, and telecommunication have addressed crisis
management or DRM relatively well. Some have already developed contingency plans for disaster
and/or recovery plans.
In particular, major electricity companies have established disaster risk management systems and
BCM. The individual structures of DRM and BCM are conducted in each of their branches,
customer center, and data centers. Moreover, they plan to establish an inclusive disaster risk
management system through the integration of individual structures.
There are no laws or regulations which obligate utility suppliers to conduct risk assessment and risk
management for natural disasters.
(3) Implementation of BCP by Foreign Capital Companies and Japanese companies
Foreign capital companies which are located in industrial parks including automobile
manufacturers, electronic manufacturers, and food manufacturers are regarded as advanced

Risk Profile Report - Cavite, Laguna and Southern Part of Metropolitan Manila of the Philippines -
4-34
enterprises for corporate disaster management. Moreover, some enterprises that deal with
international business are required to build contingency plans for disasters or BCP as part of
international agreements and tendering.
However, even among foreign capital companies, only some enterprises can afford to conduct
BCM for disaster risk. The implementation of BCM/BCP will likely be further addressed in the
future.
4.7.3 Efforts for Implementing BCP
(1) Regulations or Guidelines for the Implementation of BCP
Along with the revision of the law on Disaster Risk Management in 2010, the government also
revised the disaster management policy to place a high value on disaster preparedness and
rehabilitation. Before the revision, the priority issue of governmental policy was emergency
response. This revised law established the commitment that every local authority, including
provinces, municipalities, towns and the barangay community level must develop a Disaster Risk
Reduction Management Plan (DRRMP). However no specific laws or guidelines stipulating the
implementation of BCM/BCP have been considered.
For private enterprises, no laws or regulations stipulating the implementation of disaster risk
management have been established. Cooperation with national and local disaster risk management
is expressly stipulated for every private enterprise and civil organization in the National Disaster
Risk Reduction Management Plan (NDRRMP), and private enterprises are also required to
implement risk management along with the national and local disaster risk management systems.
After the development of DRRMP among all local authorities, the Office of Civil Defense (OCD)
plans to disseminate the preparedness plan for disaster risk, emergency response plan and also a
post-disaster rehabilitation plan. Furthermore, they are considering making BCP a requirement in
the DRRMP in the future.
(2) Private Sector Efforts in BCP Education and Dissemination
No particular efforts for spreading BCP implementation are being conducted in the private sector.
Some conferences, review meetings or seminars pertaining to BCP have been held by private
enterprises in conjunction with support from international authorities such as UNISDR. These
conferences discussed efforts for raising awareness on the concept of BCP. As an example of
efforts undertaken by private enterprises, an industrial symposium held regularly by a major retail
company in Philippines has dealt with the implementation of business continuity for crisis
management as the main issue for discussion.

Profile of the Pilot Area
4-35
4.7.4 BCP Implementation Problems
Infrastructures such as electricity and water distribution have not been adequately developed. In
terms of road infrastructure, the main roads around Manila, except toll roads, are often flooded by
heavy rain or storms, which negatively impacts business commuters. Since road networks often
face heavy traffic congestion, it should be regarded as one of the problems for business continuity.
In addition, most local enterprises in the Philippines cannot afford to establish DRM and BCP in
their present circumstances.
4.8 Current State of Disaster Risk Management
In order to review the current state of disaster risk management, questionnaire surveys were
conducted by the local consultant.
4.8.1 Questionnaire Surveys
Questionnaires were prepared for five organizations deeply or markedly involved with Area
Business Continuity Plans (A-BCP). The purpose of the questionnaires was to analyze the current
practices and readiness of both A-BCP and individual BCP. A review of these questionnaires
review will be used as a basis for formulating the framework of the JICA’s Area Business
Continuity Plan.
Focuses of the questionnaires are:
1) assessment of the 10 selected industrial parks;
2) disaster risk management applied by business enterprises as tenants of the Cavite Economic Zone;
3) assessment of lifeline utilities services;
4) assessment of traffic infrastructure operators;
5) disaster risk management applied by various levels of governments.
4.8.2 Reviews of the Questionnaire Surveys for Industrial Parks
The interviews with the industrial parks were facilitated by the Philippine Economic Zone
Authority (PEZA) through the Office of Deputy Director General for Finance and Administration
Mr. Justo Porfirio LL.Yusingco. The following firms were interviewed using the JICA-AHA
Interview/Questionnaire for Industrial Parks Managers.
1) Laguna Technopark Inc. (Laguna Province)
2) Cavite Economic Zone (Cavite Province)
3) Northgate Cyberzone (Muntinlupa City)
4) Cavite Economic Zone II (Cavite Province)
5) Gateway Business Park (Cavite Province)

Risk Profile Report - Cavite, Laguna and Southern Part of Metropolitan Manila of the Philippines -
4-36
6) Golden Mile Business Park (Cavite Province)
7) People’s Technology Complex (Cavite Province)
8) EMI-Special Economic Zone (Cavite Province)
9) Daiichi Industrial Park (Cavite Province)
10) First Cavite Industrial Estate (Cavite Province)
The following is a summary of the findings of the interview survey.
Dates of request and final collection:
1) Date of request: September 4, 2013
2) Date of final collection: September 20, 2013
The results of the questionnaire survey for Industrial Parks are as follows.
1) Interruption of lifeline utility services
The majority of the industrial parks experienced no interruptions in lifeline utilities.

Profile of the Pilot Area
4-37
2) Incidents and natural disasters in the industrial parks
The majority have not experienced serious damage during disasters, while half stated that flooding
is a problem. However, the majority have employees available to work during disasters.
4.8.3 Reviews of the Questionnaire Surveys for Business Enterprises
The tenant survey was similarly facilitated through the PEZA’s Office of Deputy Director General
for Finance and Administration, Mr. Yusingco. The questionnaire was delivered starting the first
week of September. The following were the responses of the tenants in the three (3) industrial
parks.
1) Cavite Economic Zone (CEZ): 22 out of 146 firms given questionnaires provided answers to the
questionnaire survey.
2) Laguna Technopark Inc. (LTI): 13 out of 63 firms given questionnaires provided answers to the
questionnaire survey.
3) Northgate Cyberzone (NC): 2 out of 11 firms given questionnaires provided answers to the
questionnaire survey.
The low turnout is due to the following factors.
1) The short time duration of the study did not allow for in-person surveys.
2) The distribution of the questionnaire as agreed upon by the JICA-AHA Team with PEZA was
through email, which increased the chances of no response.
3) Due to the strict confidentiality of the industrial parks, we were not given the distribution list to
follow up on the initial email to the tenants. Only CEZ allowed us to have the list, and follow-up
with the tenants was conducted during the last week of September 2013.

Risk Profile Report - Cavite, Laguna and Southern Part of Metropolitan Manila of the Philippines -
4-38
The following is the list of respondents by park.
1) Cavite Economic Zone (CEZ)
Table 4.8.1 Tenants in CEZ
No. Name of tenant/business firm 1 ACE Mannix 2 Faith Achieve Plastics Corp. 3 M. UBIS Phils 4 NT Philippines, Inc. (Plant 2) 5 ALE Component Industries 6 HRD Singapore Pte. LTD. 7 Magnetron Phils Corp 8 S-A-N-G-T-O-P Solutions Co. Ltd., Inc. 9 Cavite Manufacturing Corp 10 Nippon Pulse Tech Phils. 11 Ant Steel Corporation 12 Reliance Apparel & Fashion Mfg. Corp. 13 Taesung Phils. Co., Inc. 14 Oakwave Phils., Corp. 15 IM Tech. Co., Inc. 16 DS Tech. Phils., Inc. 17 AMCA Packaging Solutions, Inc 18 J-Film Philippines, Inc. 19 Yukio Iimura Mfg. Inc. 20 Dai Shin Han Tech Corporation 21 Keon Yang Industrial Phils., Inc. 22 NANBU PHILIPPINES, INC.
Source: WCI (Local consultant in the Philippines)
2) Laguna Technopark Inc. (LTI)
Table 4.8.2 Tenants in LTI
No. Name of tenant/business firm 1 Ichinomiya Elect Philippines Corp. 2 F-Tech. Phils. Mfg., Inc. 3 JX Nippon Mining & Metals Phils., Inc. 4 Honda Cars Phils., Inc. 5 Surtec Phils., Corp. 6 Imasen Philippine Mfg. Corp. 7 Swedish Match Phil., Inc. 8 EMS Components Assembly, Inc. 9 Terumo (Phils.) Corp.
10 Jfe Shoji Steel Philippines 11 Seafood Fukui Phils., Inc 12 Fujitsu Die-Tech Corp. Phils. 13 Toshiba Information Equipment Phils.
Source: WCI (Local consultant in the Philippines)

Profile of the Pilot Area
4-39
3) Northgate Cyberzone (NC)
Table 4.8.3 Tenants in NC
No. Name of tenant/business firm 1 iHub 2 Plaza C
Source: WCI (Local consultant in the Philippines)
The following is a summary of the findings of the survey of tenants in the three industrial parks.
Business Enterprises in CEZ
The following is a summary of the findings of the survey of tenants or business firms in CEZ.
1) Date of request and the final collection
Date of request: September 4, 2013
Date of final collection: September 30, 2013
2) Collection ratio (= Collected numbers divided by the total number of requests)
Out of 146 tenants, 21 companies responded.
22/146= 15%
3) Reasons for the low collection ratio
The questionnaires were distributed by email only. Many email addresses were invalid. The
industrial park manager permitted email follow-up only much later. The initial questionnaire
distributed lacked a letter of request and AHA pamphlet. Because of insufficient time, in-person
follow-up was not possible.
4) Interruption of lifeline utility services
Electricity interruption due to natural disasters was experienced by 14 out of 21 firms, with a
weighted average interruption time of 15 hours.
Water service interruption due to natural disasters was experienced by 7 out of 21 firms, with
a weighted average interruption time of 14 hours.
Communication service interruption due to natural disasters was experienced by 9 out of 21
firms, with a weighted average interruption time of 13 hours.

Risk Profile Report - Cavite, Laguna and Southern Part of Metropolitan Manila of the Philippines -
4-40
Interruption of Supply due to Natural Disaster
5) Normally used traffic infrastructure and roads
Expressway: Cavitex (13/21)
Port: Port of Manila (8/21)
Airport: Ninoy Aquino International Airport (13/21)
Railway: None
6) Alternative traffic infrastructures
Roads and expressways: General Trias Drive (2/21)
Alternative expressway: South Luzon Expressway
Alternative port: Batangas Port
Alternative airport: None
7) Disaster Prevention Plans, Business Continuity Plans and concerns
The Business Continuity Plan (BCP) is not well recognized among the tenants.

Profile of the Pilot Area
4-41
Business Enterprises in LTI
The following is a summary of the findings of the survey of tenants or business firms in LTI.
1) Date of request and the final collection
Date of request: September 4, 2013
Date of final collection: September 24, 2013
2) Collection ratio (= Collected numbers divided by the total number of requests)
Out of 63 tenants, 13 companies responded.
13/63= 21%
3) Reasons for the low collection ratio
The questionnaires were distributed by email only. The industrial park manager did not supply
email address details of the respondents, making email follow-up impossible. Because of
insufficient time, in-person follow-up was not possible.
4) Interruption of lifeline utility services
Electricity interruption due to natural disasters was experienced by 8 out of 13 firms, with a
weighted average interruption time of 11 hours.
Water service interruption due to natural disaster was experienced by 6 out of 13 firms, with a
weighted average interruption time of 3 hours.
Communication service interruption due to natural disaster was experienced by 6 out of 13
firms, with a weighted average interruption time of 5 hours.
Interruption of Supply due to Natural Disaster
5) Normally used traffic infrastructure and roads
Expressway: South Luzon Expressway (13/13)
Port: Port of Manila (9/13)
Airport: Ninoy Aquino International Airport (13/13)
Railway: None

Risk Profile Report - Cavite, Laguna and Southern Part of Metropolitan Manila of the Philippines -
4-42
6) Alternative traffic infrastructures
Roads and expressways: National Road, Muntinlupa (5/13)
Alternative expressway: Coastal Road Expressway (2/13)
Alternative port: Batangas Port (8/13)
Alternative airport: Clark International Airport (6/13)
7) Disaster Prevention Plans, Business Continuity Plans and concerns
The Business Continuity Plan (BCP) is well recognized among the tenants.
Business Enterprises in NC
The following is a summary of the findings of the survey of tenants or business firms in NC.
1) Date of request and the final collection
Date of request: September 4, 2013
Date of final collection: September 09, 2013
2) Collection ratio (= Collected numbers divided by the total number of requests)
Out of 11 tenants, 2 companies responded. 2/11= 18%
3) Reasons for the low collection ratio
The questionnaires were distributed by email and through interviews only. The industrial park
manager did not provide email address details of the respondents, making email follow-up
impossible. Because of insufficient time, in-person follow up was not possible.
4) Interruption of lifeline utility services
Profile of the Pilot Area
4-43
Electricity interruption due to natural disaster was experienced by 0 out of 2 firms.
Water service interruption due to natural disaster was experienced by 0 out of 2 firms.
Communication service interruption due to natural disaster was experienced by 0 out of 2
firms.
5) Normally used traffic infrastructure and roads
Expressway: South Luzon Expressway (2/2)
Port: South Harbor Port of Manila (1/2)
Airport: Ninoy Aquino International Airport (2/2)
Railway: None
6) Alternative traffic infrastructures
Roads and expressways: None
Alternative expressways: Aguinaldo Highway (1/2)
7) Disaster Prevention Plans, Business Continuity Plans and concerns
Both respondents have a Disaster Risk Reduction Management Plan and Business Continuity Plan.
The Business Continuity Plan (BCP) is well recognized among the tenants.
4.8.4 Reviews of the Questionnaire Surveys for Lifeline Utility Companies
The following are the lifeline utility organizations which we were able to interview and from which
secondary data was gathered.
1) Philippine Long Distance Telecommunication Company (PLDT), South Sub-Exchange Unit,
Cavite
2) PLDT, Main Office, Laguna
3) Meralco, Alabang, Muntinlupa
4) Maynilad Water Services, Inc.
Other lifeline organizations were not able to respond to interview requests.
The highlights of the interviews are shown below.

Risk Profile Report - Cavite, Laguna and Southern Part of Metropolitan Manila of the Philippines -
4-44
Types of Disasters Treated in Disaster Mitigation Plan and Duration of Interruption
As indicated in the figure above, all the lifeline utility organizations have three types of disaster
categories in their disaster mitigation plans. The duration of disaster interruption is from half a day
to a whole day.
4.8.5 Reviews of the Questionnaire Surveys for Traffic Infrastructure Companies
The following are the traffic infrastructure organizations interviewed and from which data and
information was gathered.
1) Department of Public Works and Highways, Cavite
2) Provincial Engineering Office, Cavite
3) City Planning and Development Office of Muntinlupa
4) City Engineer's Office, Muntinlupa
5) Muntinlupa Traffic Management Bureau
6) Provincial Engineering Office, Laguna
7) Manila North Harbor Port, Inc.
8) Philippine Ports Authority; Manila South Harbor/Manila Port
The highlights of the interviews are shown below.
1) Types of Disasters Treated in Disaster Mitigation Plan and Duration of Interruption
The traffic infrastructure organizations mostly indicated flooding as the primary type of disaster in
their mitigation plan. The duration of interruption during disasters is by mostly from 12 to 24
hours.
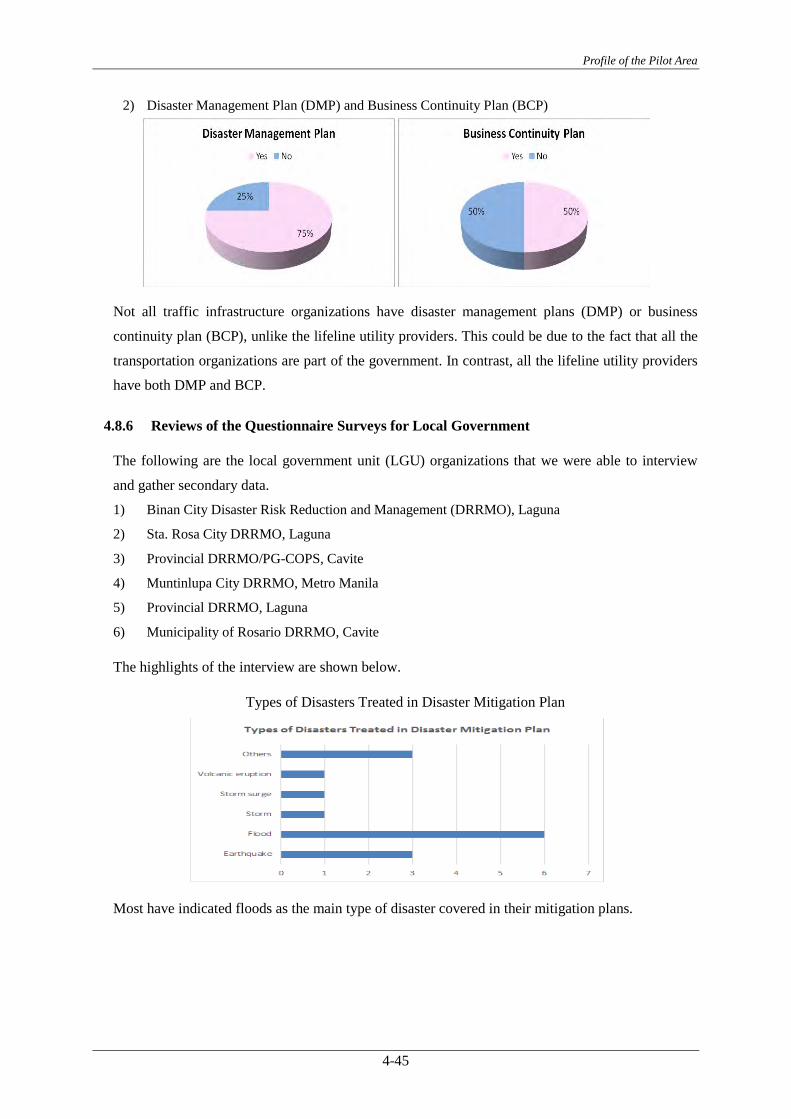
Profile of the Pilot Area
4-45
2) Disaster Management Plan (DMP) and Business Continuity Plan (BCP)
Not all traffic infrastructure organizations have disaster management plans (DMP) or business
continuity plan (BCP), unlike the lifeline utility providers. This could be due to the fact that all the
transportation organizations are part of the government. In contrast, all the lifeline utility providers
have both DMP and BCP.
4.8.6 Reviews of the Questionnaire Surveys for Local Government
The following are the local government unit (LGU) organizations that we were able to interview
and gather secondary data.
1) Binan City Disaster Risk Reduction and Management (DRRMO), Laguna
2) Sta. Rosa City DRRMO, Laguna
3) Provincial DRRMO/PG-COPS, Cavite
4) Muntinlupa City DRRMO, Metro Manila
5) Provincial DRRMO, Laguna
6) Municipality of Rosario DRRMO, Cavite
The highlights of the interview are shown below.
Types of Disasters Treated in Disaster Mitigation Plan
Most have indicated floods as the main type of disaster covered in their mitigation plans.

Risk Profile Report - Cavite, Laguna and Southern Part of Metropolitan Manila of the Philippines -
4-46
Response by Local Government during Disasters
Only half of the local government units (LGU) prioritize the recovery of lifeline utilities/traffic
infrastructure for companies. Similarly, only half of the LGUs receive financial support from the
national government to help these companies.
Appendix Details of Natural Hazard Assessments
A-1
Appendix Details of Natural Hazard Assessments
Seismic Hazard Assessment A.1The methodology of seismic hazard simulation is roughly divided into deterministic methodology and probabilistic methodology. By the deterministic methodology, earthquake ground motion is calculated if the specific earthquake source fault has been activated. The earthquake ground motion distribution by the future possible earthquake can be calculated precisely, but to estimate when the calculated earthquake ground motion will be realized is difficult because it is impossible to predict the future earthquake by current technology. By the probabilistic method, the expected earthquake ground motion within a certain period at the study point is calculated considering all the earthquake sources around the study point reflecting the possibility of each sources. Therefore, the earthquake motion distribution by probabilistic method is not the estimation of the earthquake motion distribution by future probable earthquake but the ensemble of independent expected earthquake motion at each point. The deterministic method is commonly used for disaster management purpose and the probabilistic methodology is usually used for zoning in the building seismic code or earthquake insurance system etc.
The probabilistic method is adopted in the seismic hazard analysis for area BCP because the probability of the hazard is important. The hazard that has high possibility to occur in the lifetime of the industrial facilities is considered in area BCP, therefore to estimate the probability of the hazard is essential component in the analysis.
Methodology of Probabilistic Seismic Hazard Analysis A.1.1
(1) Summary The combination of earthquake ground motion at a certain point and the probability to experience at least the ground motion in a certain period is calculated by the probabilistic seismic hazard analysis method. The flow of the analysis is shown in Figure A.1.1.
The general steps of the analysis are as follows.
1) Set up the model of seismic activity around the study point. Not only the earthquakes that the source faults are clearly known but the earthquakes that the earthquake sources are not known and definite estimation of the magnitude and the location of future event is difficult should be included.
2) Estimate the probability of the magnitude, probability of the distance from the study point and the probability of the occurrence of the modeled earthquakes.
3) Set up the probability model to estimate the earthquake ground motion if the magnitude of the earthquake and the distance from the study point are given. The empirical attenuation equation and the dispersion of the equation are usually used.

Risk Profile Report - Cavite, Laguna and Southern Part of Metropolitan Manila of the Philippines -
A-2
4) Calculate the probability that the earthquake ground motion at the study point by modeled earthquake become larger than a certain value in a certain period.
5) Steps 1) to 4) are carried out for each modeled earthquake and all the probabilities are aggregated. The probability to experience a certain earthquake ground motion at least once in a certain period at the study point is calculated as a result.
McGuire, R. K. (2004)1) is recommended as a textbook of probabilistic seismic hazard analysis.
Figure A.1.1 Flowchart of probabilistic seismic hazard analysis (NIED(2005)2), original in Japanese)

Appendix Details of Natural Hazard Assessments
A-3
(2) Software for analysis As the probabilistic seismic hazard analysis involves complicated numerical calculation, many computing programs are developed and some of them are freely available. Among them, SEISRISK, FRISK, CRISIS, NSHMP and OpenSHA are famous but they are intended to be used by the researchers or the engineer with expert knowledge. Danciu et al. (2010)3) compiled the precise information about the probabilistic seismic hazard analysis programs. Table A.1.1 is the general information of the major software for probabilistic seismic hazard analysis by Danciu et al. (2010).
Table A.1.1 Major software for probabilistic seismic hazard analysis
EZ-FRISK is the expanded commercial version of FRISK and offered by Risk Engineering Inc. The analysis by EZ-FRISK is comparatively easy because the earthquake source model and attenuation formula are provided with computing program. EZ-FRISK Ver. 7.62 was used in this study.
(3) Source model The earthquake source model should include all the seismic activities within several 100km from the study point. The active faults in the area are modeled at first because earthquake basically occurs by the activity of the fault. However, not all the active faults are known or studied of the properties, the earthquakes that the earthquake sources are not known and definite estimation of the magnitude and the location of future event is difficult are modeled as the background seismic activities also. As the creation of the earthquake source model needs high grade capacity and expert knowledge, earthquake modeling is usually conducted in university or public research institute. Therefore, to conduct originally new probabilistic seismic hazard analysis, the earthquake source model should be given from academic organization.
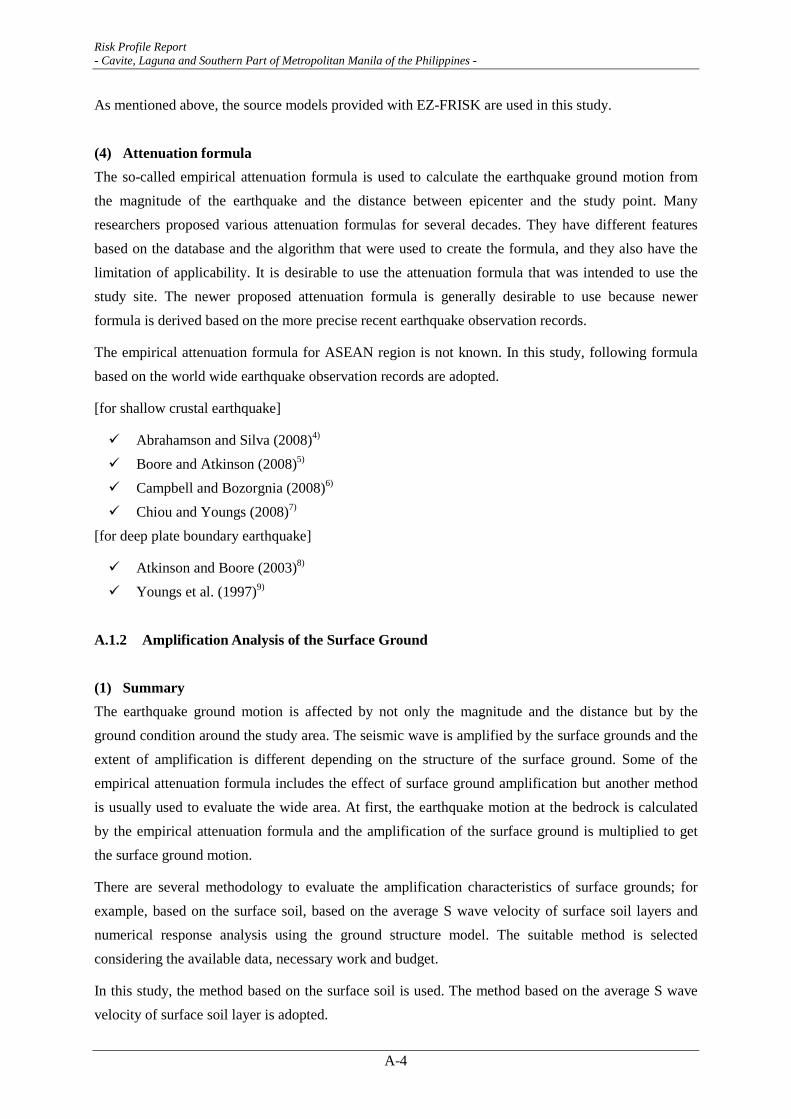
Risk Profile Report - Cavite, Laguna and Southern Part of Metropolitan Manila of the Philippines -
A-4
As mentioned above, the source models provided with EZ-FRISK are used in this study.
(4) Attenuation formula The so-called empirical attenuation formula is used to calculate the earthquake ground motion from the magnitude of the earthquake and the distance between epicenter and the study point. Many researchers proposed various attenuation formulas for several decades. They have different features based on the database and the algorithm that were used to create the formula, and they also have the limitation of applicability. It is desirable to use the attenuation formula that was intended to use the study site. The newer proposed attenuation formula is generally desirable to use because newer formula is derived based on the more precise recent earthquake observation records.
The empirical attenuation formula for ASEAN region is not known. In this study, following formula based on the world wide earthquake observation records are adopted.
[for shallow crustal earthquake]
Abrahamson and Silva (2008)4) Boore and Atkinson (2008)5) Campbell and Bozorgnia (2008)6) Chiou and Youngs (2008)7)
[for deep plate boundary earthquake]
Atkinson and Boore (2003)8) Youngs et al. (1997)9)
Amplification Analysis of the Surface Ground A.1.2
(1) Summary The earthquake ground motion is affected by not only the magnitude and the distance but by the ground condition around the study area. The seismic wave is amplified by the surface grounds and the extent of amplification is different depending on the structure of the surface ground. Some of the empirical attenuation formula includes the effect of surface ground amplification but another method is usually used to evaluate the wide area. At first, the earthquake motion at the bedrock is calculated by the empirical attenuation formula and the amplification of the surface ground is multiplied to get the surface ground motion.
There are several methodology to evaluate the amplification characteristics of surface grounds; for example, based on the surface soil, based on the average S wave velocity of surface soil layers and numerical response analysis using the ground structure model. The suitable method is selected considering the available data, necessary work and budget.
In this study, the method based on the surface soil is used. The method based on the average S wave velocity of surface soil layer is adopted.

Appendix Details of Natural Hazard Assessments
A-5
(2) Ground classification and amplification factor The classification of the ground and the amplification factor by FEMA (1995)10) is adopted in this study (see Table A.1.2 and Table A.1.3). They are developed in U.S.A. and used in many countries recently. The soil profile, average S wave velocity of upper 30 meters and N value are used to define the site class.
Followings are the adopted ground classification based on the geologic time read from collected geologic maps.
Class B: Tertiary and before Class C: Pleistocene Class D: Holocene Class E: River deposit and marine deposit in Holocene The average S wave velocity of the upper 30 meters is studied by Grutas and Yamanaka (2012)11) and JICA (2004)12) in the Philippines. These data are also used to define the site class.
Table A.1.2 NEHRP Classification
Site Class
Profile Average S-wave velocity of the upper 30 meters
N value
A Hard rock > 1500 m/sec
B Rock 1500 ≥ Vs > 760 m/sec
C Very dense soil and soft rock 760 ≥ Vs > 360 m/sec N > 50
D Stiff soil 360 ≥ Vs > 180 m/sec 50 ≥ N ≥ 15 E Soil 180 m/sec ≥ Vs 15 > N
Table A.1.3 NEHRP Amplification
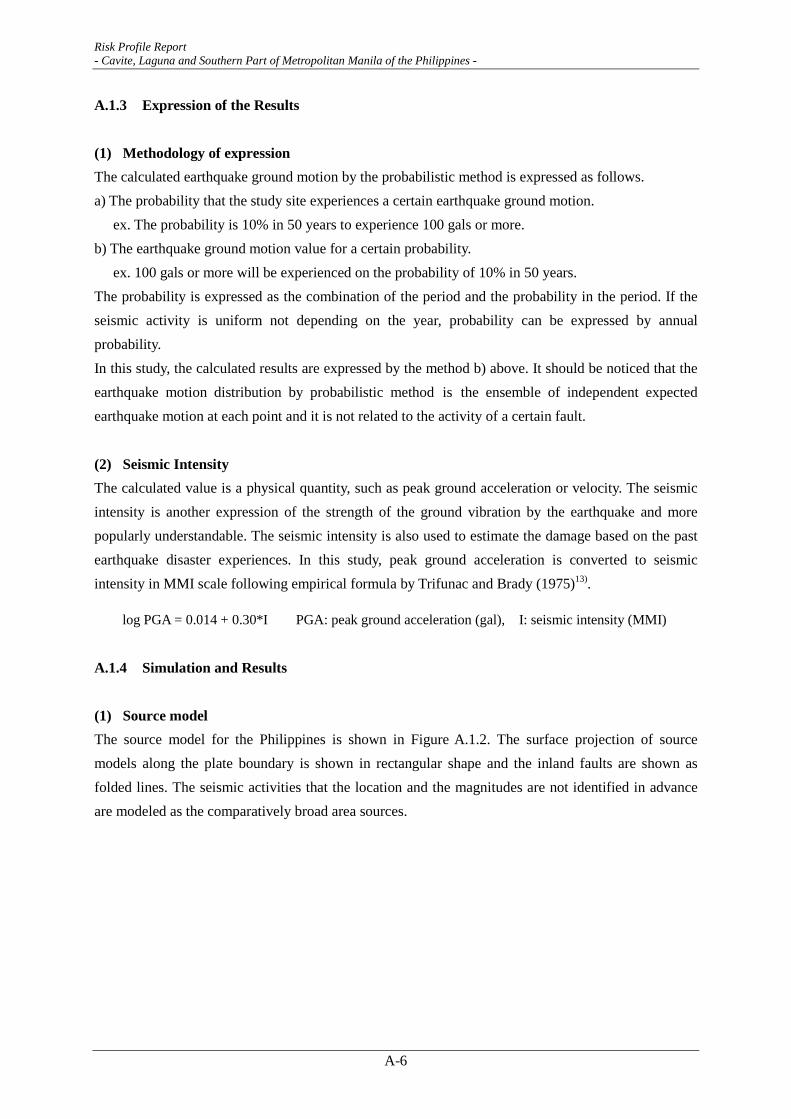
Risk Profile Report - Cavite, Laguna and Southern Part of Metropolitan Manila of the Philippines -
A-6
Expression of the Results A.1.3
(1) Methodology of expression The calculated earthquake ground motion by the probabilistic method is expressed as follows. a) The probability that the study site experiences a certain earthquake ground motion.
ex. The probability is 10% in 50 years to experience 100 gals or more. b) The earthquake ground motion value for a certain probability.
ex. 100 gals or more will be experienced on the probability of 10% in 50 years. The probability is expressed as the combination of the period and the probability in the period. If the seismic activity is uniform not depending on the year, probability can be expressed by annual probability. In this study, the calculated results are expressed by the method b) above. It should be noticed that the earthquake motion distribution by probabilistic method is the ensemble of independent expected earthquake motion at each point and it is not related to the activity of a certain fault.
(2) Seismic Intensity The calculated value is a physical quantity, such as peak ground acceleration or velocity. The seismic intensity is another expression of the strength of the ground vibration by the earthquake and more popularly understandable. The seismic intensity is also used to estimate the damage based on the past earthquake disaster experiences. In this study, peak ground acceleration is converted to seismic intensity in MMI scale following empirical formula by Trifunac and Brady (1975)13).
log PGA = 0.014 + 0.30*I PGA: peak ground acceleration (gal), I: seismic intensity (MMI)
Simulation and Results A.1.4
(1) Source model The source model for the Philippines is shown in Figure A.1.2. The surface projection of source models along the plate boundary is shown in rectangular shape and the inland faults are shown as folded lines. The seismic activities that the location and the magnitudes are not identified in advance are modeled as the comparatively broad area sources.

Appendix Details of Natural Hazard Assessments
A-7
Figure A.1.2 Source model for the Philippines
(2) Baserock motion The acceleration distribution on the ground with Vs=760 m/sec is shown in Figure A.1.3 to Figure A.1.6. The expected probability of occurrence is at least once in 50, 100, 200 or 500 years (50, 100, 200 or 500 years probability). The calculated acceleration is larger in north.

Risk Profile Report - Cavite, Laguna and Southern Part of Metropolitan Manila of the Philippines -
A-8
Figure A.1.3 Baserock acceleration distribution (expected for 50 years, unit: g)
Figure A.1.4 Baserock acceleration distribution (expected for 100 years, unit: g)
This map is intended to be used for disaster scenario creation. This map is not the forecast of the future hazard. [Analytical condition] Probabilistic Seismic Hazard Analysis, Software: EZ-FRISK, Earthquake source model: EZ-FRISK, Return period: 50 years.
This map is intended to be used for disaster scenario creation. This map is not the forecast of the future hazard. [Analytical condition] Probabilistic Seismic Hazard Analysis, Software: EZ-FRISK, Earthquake source model: EZ-FRISK, Return period: 100 years.

Appendix Details of Natural Hazard Assessments
A-9
Figure A.1.5 Baserock acceleration distribution (expected for 200 years, unit: g)
Figure A.1.6 Baserock acceleration distribution (expected for 500 years, unit: g)
(3) Ground classification Following three data sets are used for the ground classification.
a) Proposed Vs30 value (average sheer wave velocity of the ground over 30m from surface) in Metro Manila, north of Cavite and Laguna by Grutas and Yamanaka (2012)11).
b) Vs30 value calculated from the database of the ground model by JICA (2004)12).
This map is intended to be used for disaster scenario creation. This map is not the forecast of the future hazard. [Analytical condition] Probabilistic Seismic Hazard Analysis, Software: EZ-FRISK, Earthquake source model: EZ-FRISK, Return period: 200 years.
This map is intended to be used for disaster scenario creation. This map is not the forecast of the future hazard. [Analytical condition] Probabilistic Seismic Hazard Analysis, Software: EZ-FRISK, Earthquake source model: EZ-FRISK, Return period: 500 years.

Risk Profile Report - Cavite, Laguna and Southern Part of Metropolitan Manila of the Philippines -
A-10
c) Geological maps with 1/50,000 scale by National Mapping and Resource Information Authority (NAMRIA)
The Vs30 values of a) and b) and the geological time read from c) are used for ground classification. If several classifications are possible, the geological classification with largest amplification value is adopted. The ground classification map is shown in Figure A.1.7.
Figure A.1.7 Ground classification
(4) Surface motion The acceleration at the ground surface is calculated multiplying the amplification factor to the acceleration value at the baserock. the results are shown in Figure A.1.8 to Figure A.1.11. The acceleration value is converted to seismic intensity in MMI scale by empirical equation and shown in Figure A.1.12 to Figure A.1.15
.
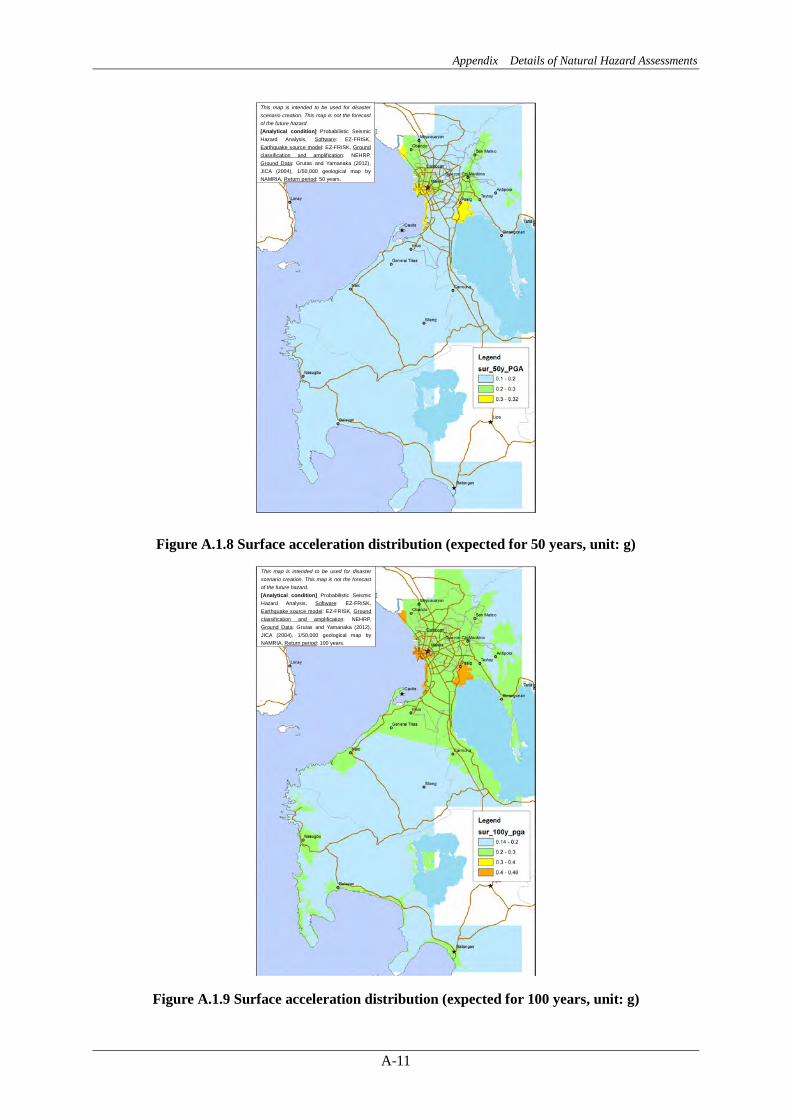
Appendix Details of Natural Hazard Assessments
A-11
Figure A.1.8 Surface acceleration distribution (expected for 50 years, unit: g)
Figure A.1.9 Surface acceleration distribution (expected for 100 years, unit: g)
This map is intended to be used for disaster scenario creation. This map is not the forecast of the future hazard. [Analytical condition] Probabilistic Seismic Hazard Analysis, Software: EZ-FRISK, Earthquake source model: EZ-FRISK, Ground classification and amplification: NEHRP, Ground Data: Grutas and Yamanaka (2012), JICA (2004), 1/50,000 geological map by NAMRIA, Return period: 50 years.
This map is intended to be used for disaster scenario creation. This map is not the forecast of the future hazard. [Analytical condition] Probabilistic Seismic Hazard Analysis, Software: EZ-FRISK, Earthquake source model: EZ-FRISK, Ground classification and amplification: NEHRP, Ground Data: Grutas and Yamanaka (2012), JICA (2004), 1/50,000 geological map by NAMRIA, Return period: 100 years.

Risk Profile Report - Cavite, Laguna and Southern Part of Metropolitan Manila of the Philippines -
A-12
Figure A.1.10 Surface acceleration distribution (expected for 200 years, unit: g)
Figure A.1.11 Surface acceleration distribution (expected for 500 years, unit: g)
This map is intended to be used for disaster scenario creation. This map is not the forecast of the future hazard. [Analytical condition] Probabilistic Seismic Hazard Analysis, Software: EZ-FRISK, Earthquake source model: EZ-FRISK, Ground classification and amplification: NEHRP, Ground Data: Grutas and Yamanaka (2012), JICA (2004), 1/50,000 geological map by NAMRIA, Return period: 200 years.
This map is intended to be used for disaster scenario creation. This map is not the forecast of the future hazard. [Analytical condition] Probabilistic Seismic Hazard Analysis, Software: EZ-FRISK, Earthquake source model: EZ-FRISK, Ground classification and amplification: NEHRP, Ground Data: Grutas and Yamanaka (2012), JICA (2004), 1/50,000 geological map by NAMRIA, Return period: 500 years.

Appendix Details of Natural Hazard Assessments
A-13
Figure A.1.12 Seismic intensity distribution (expected for 50 years in MMI scale)
Figure A.1.13 Seismic intensity distribution (expected for 100 years in MMI scale)
This map is intended to be used for disaster scenario creation. This map is not the forecast of the future hazard. [Analytical condition] Probabilistic Seismic Hazard Analysis, Software: EZ-FRISK, Earthquake source model: EZ-FRISK, Ground classification and amplification: NEHRP, Ground Data: Grutas and Yamanaka (2012), JICA (2004), 1/50,000 geological map by NAMRIA, Conversion from PGA to MMI: Trifunac and Brady (1975), Return period: 50 years.
This map is intended to be used for disaster scenario creation. This map is not the forecast of the future hazard. [Analytical condition] Probabilistic Seismic Hazard Analysis, Software: EZ-FRISK, Earthquake source model: EZ-FRISK, Ground classification and amplification: NEHRP, Ground Data: Grutas and Yamanaka (2012), JICA (2004), 1/50,000 geological map by NAMRIA, Conversion from PGA to MMI: Trifunac and Brady (1975), Return period: 100 years.

Risk Profile Report - Cavite, Laguna and Southern Part of Metropolitan Manila of the Philippines -
A-14
Figure A.1.14 Seismic intensity distribution (expected for 200 years in MMI scale)
Figure A.1.15 Seismic intensity distribution (expected for 500 years in MMI scale)
This map is intended to be used for disaster scenario creation. This map is not the forecast of the future hazard. [Analytical condition] Probabilistic Seismic Hazard Analysis, Software: EZ-FRISK, Earthquake source model: EZ-FRISK, Ground classification and amplification: NEHRP, Ground Data: Grutas and Yamanaka (2012), JICA (2004), 1/50,000 geological map by NAMRIA, Conversion from PGA to MMI: Trifunac and Brady (1975), Return period: 200 years.
This map is intended to be used for disaster scenario creation. This map is not the forecast of the future hazard. [Analytical condition] Probabilistic Seismic Hazard Analysis, Software: EZ-FRISK, Earthquake source model: EZ-FRISK, Ground classification and amplification: NEHRP, Ground Data: Grutas and Yamanaka (2012), JICA (2004), 1/50,000 geological map by NAMRIA, Conversion from PGA to MMI: Trifunac and Brady (1975), Return period: 500 years.

Appendix Details of Natural Hazard Assessments
A-15
(5) Liquefaction potential The liquefaction potential in Metro Manila is evaluated using the ground model and the analysis method used in the study by JICA (2004)12). The liquefaction potential by the earthquake of 200 years probability is shown in Figure A.1.16.
Figure A.1.16 Liquefaction potential in Metro Manila (expected for 200 years)
Evaluation of the Results A.1.5
1) Probabilistic seismic hazard analysis As the most software for probabilistic seismic hazard analysis is made based on the same theorem, there is no big difference between them except user interface. The largest component that may affect to the result is the earthquake source model. Not only the earthquake catalogue of recorded events and historical earthquakes, the active faults with no record of earthquakes in the history or the area source model should be considered. In this study, the earthquake source model included in the commercial analysis package is used. This source model was made based on the existing documents in the world and the accuracy is enough for the hazard assessment of the pilot study site in this project. However, the opinions about the active faults by the researchers are not usually same and the consensus between them is difficult in many cases. To consult the local researcher and reflect the opinion to the analysis may be necessary to assess the seismic hazard in smaller area.
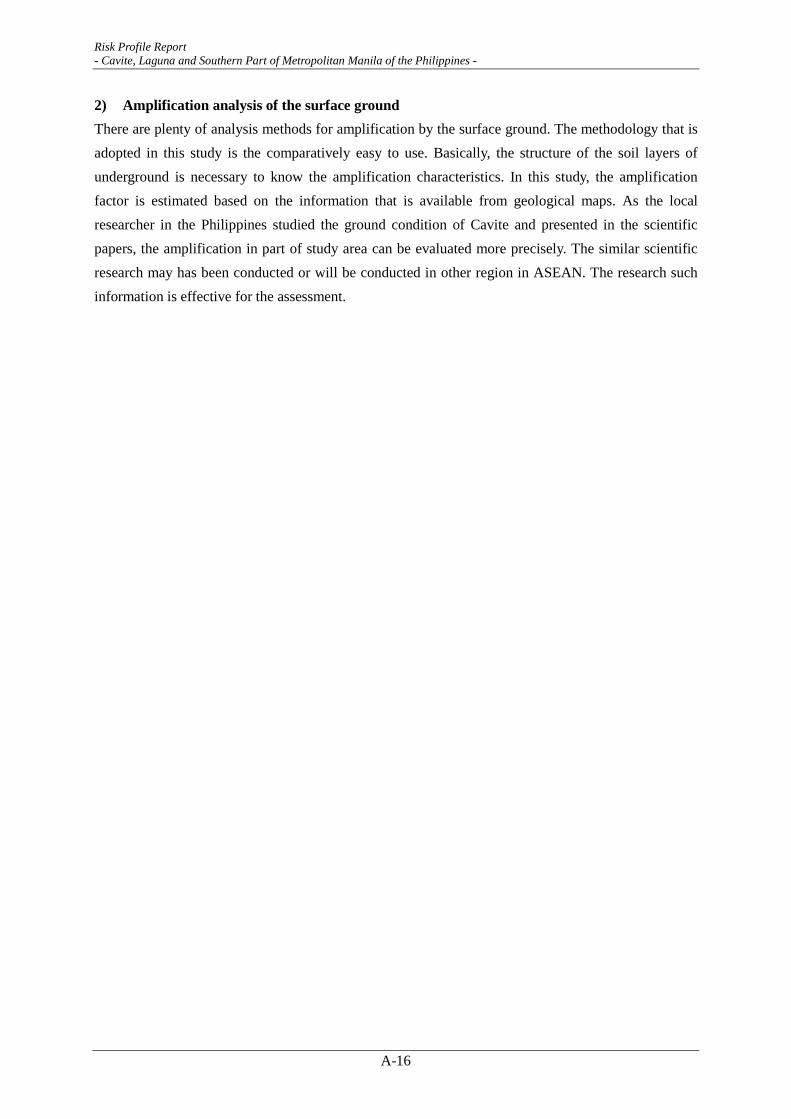
Risk Profile Report - Cavite, Laguna and Southern Part of Metropolitan Manila of the Philippines -
A-16
2) Amplification analysis of the surface ground There are plenty of analysis methods for amplification by the surface ground. The methodology that is adopted in this study is the comparatively easy to use. Basically, the structure of the soil layers of underground is necessary to know the amplification characteristics. In this study, the amplification factor is estimated based on the information that is available from geological maps. As the local researcher in the Philippines studied the ground condition of Cavite and presented in the scientific papers, the amplification in part of study area can be evaluated more precisely. The similar scientific research may has been conducted or will be conducted in other region in ASEAN. The research such information is effective for the assessment.
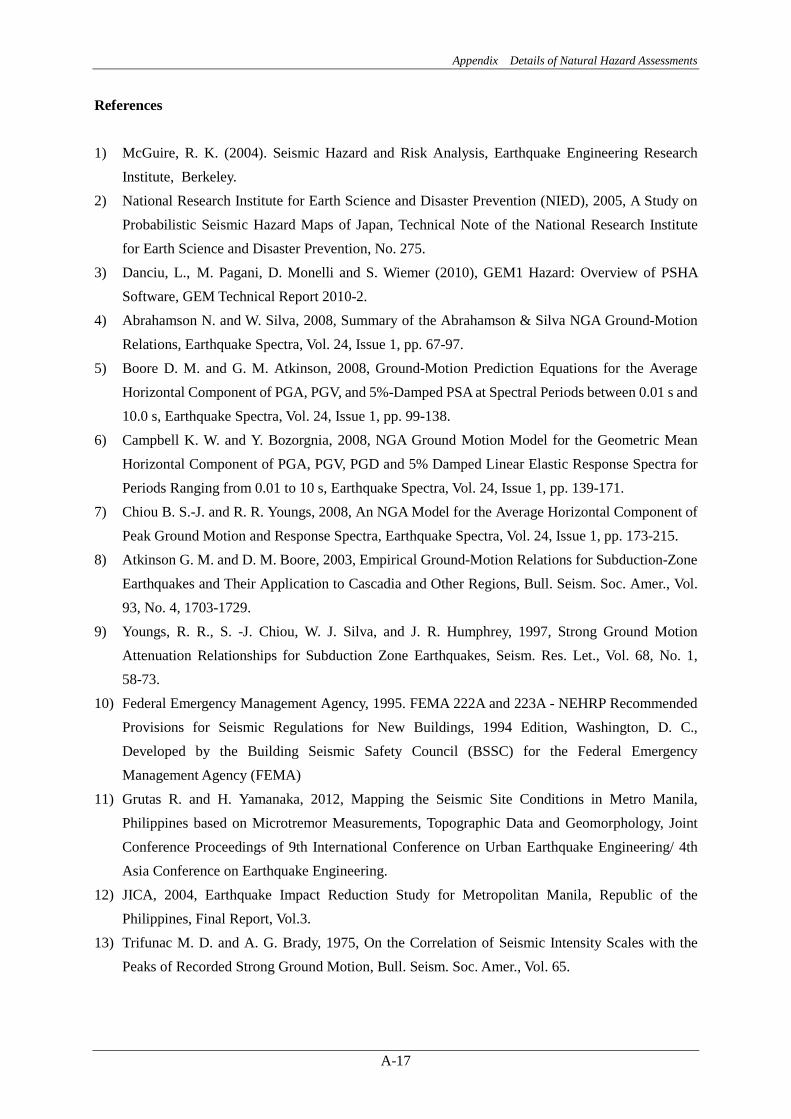
Appendix Details of Natural Hazard Assessments
A-17
References 1) McGuire, R. K. (2004). Seismic Hazard and Risk Analysis, Earthquake Engineering Research
Institute, Berkeley. 2) National Research Institute for Earth Science and Disaster Prevention (NIED), 2005, A Study on
Probabilistic Seismic Hazard Maps of Japan, Technical Note of the National Research Institute for Earth Science and Disaster Prevention, No. 275.
3) Danciu, L., M. Pagani, D. Monelli and S. Wiemer (2010), GEM1 Hazard: Overview of PSHA Software, GEM Technical Report 2010-2.
4) Abrahamson N. and W. Silva, 2008, Summary of the Abrahamson & Silva NGA Ground-Motion Relations, Earthquake Spectra, Vol. 24, Issue 1, pp. 67-97.
5) Boore D. M. and G. M. Atkinson, 2008, Ground-Motion Prediction Equations for the Average Horizontal Component of PGA, PGV, and 5%-Damped PSA at Spectral Periods between 0.01 s and 10.0 s, Earthquake Spectra, Vol. 24, Issue 1, pp. 99-138.
6) Campbell K. W. and Y. Bozorgnia, 2008, NGA Ground Motion Model for the Geometric Mean Horizontal Component of PGA, PGV, PGD and 5% Damped Linear Elastic Response Spectra for Periods Ranging from 0.01 to 10 s, Earthquake Spectra, Vol. 24, Issue 1, pp. 139-171.
7) Chiou B. S.-J. and R. R. Youngs, 2008, An NGA Model for the Average Horizontal Component of Peak Ground Motion and Response Spectra, Earthquake Spectra, Vol. 24, Issue 1, pp. 173-215.
8) Atkinson G. M. and D. M. Boore, 2003, Empirical Ground-Motion Relations for Subduction-Zone Earthquakes and Their Application to Cascadia and Other Regions, Bull. Seism. Soc. Amer., Vol. 93, No. 4, 1703-1729.
9) Youngs, R. R., S. -J. Chiou, W. J. Silva, and J. R. Humphrey, 1997, Strong Ground Motion Attenuation Relationships for Subduction Zone Earthquakes, Seism. Res. Let., Vol. 68, No. 1, 58-73.
10) Federal Emergency Management Agency, 1995. FEMA 222A and 223A - NEHRP Recommended Provisions for Seismic Regulations for New Buildings, 1994 Edition, Washington, D. C., Developed by the Building Seismic Safety Council (BSSC) for the Federal Emergency Management Agency (FEMA)
11) Grutas R. and H. Yamanaka, 2012, Mapping the Seismic Site Conditions in Metro Manila, Philippines based on Microtremor Measurements, Topographic Data and Geomorphology, Joint Conference Proceedings of 9th International Conference on Urban Earthquake Engineering/ 4th Asia Conference on Earthquake Engineering.
12) JICA, 2004, Earthquake Impact Reduction Study for Metropolitan Manila, Republic of the Philippines, Final Report, Vol.3.
13) Trifunac M. D. and A. G. Brady, 1975, On the Correlation of Seismic Intensity Scales with the Peaks of Recorded Strong Ground Motion, Bull. Seism. Soc. Amer., Vol. 65.

Risk Profile Report - Cavite, Laguna and Southern Part of Metropolitan Manila of the Philippines -
A-18
Tsunami Hazard Assessment A.2The flowchart of tsunami simulation is shown in Figure A.2.1. The detailed procedure is described hereinafter and the results of simulation for three pilot areas are shown next.
Figure A.2.1 Flowchart of tsunami simulation
Theory of Tsunami Propagation and Selection of Simulation Model A.2.1There are several theories to describe the behavior of tsunami such as linear long-wave theory, non-linear long-wave theory, linear disperse wave theory and non-linear disperse wave theory. Each of them is a theory based on the long-wave approximation which can be applied to the wave which wave length is long enough to the depth of water. The wave length of tsunami is generally from several 10 km to 100 km relative to the average depth of the ocean is 4 km. That is the reason why the long-wave approximation can be proper for tsunami.
Linear long-wave theory can be applied to the deep water area, over around 50 m in depth, where the amplitude of the wave is small enough to the depth of water and the friction on the sea floor can be
Input Grid data contains; - Topography (= altitude) - Coefficient of roughness - Height of sea defense - Initial sea-level
Tsunami Simulation Model
Fault Model
Deformation of seabed
Sea area: Bathymetric chart Land area: Topographic map
Output - Max tsunami height (all grid) - Max tsunami velocity (all grid) - Arrival time of max height (all grid) - Arrival time of x cm height (all grid) - Tsunami height wave form (selected grid)

Appendix Details of Natural Hazard Assessments
A-19
neglected. On the other hand, non-linear long-wave theory can be applied to the shallow water area where the amplitude of the wave is not so small to the depth of water and the friction on the sea floor cannot be neglected and the case of tsunami runs up on the land.
The velocity of shorter wave is slower than longer wave. Therefore, when tsunami wave consists of several waves of different length, dispersion of short wave and long wave is observed. This difference in velocity by the wavelength is called dispersibility and the theory considering this dispersibility is the disperse wave theory. The simulation on the disperse wave theory is not so common at present, however in case of distant tsunami which occurs over 1,000 km far from the object site, linear disperse wave theory is to be applied. And when the effect of dispersibility is concerned at shallow water area, non-linear disperse wave theory is to be applied. Please see reference 1) and 2) when more detailed explanation of those theories are required.
Table A.2.1 shows the sample tsunami simulation models based on the long-wave theory and the disperse wave theory introduced above. Tsunami simulation program "TUNAMI" which is developed by Tohoku University based on the non-linear long wave theory is used in this study.
Table A.2.1 Tsunami simulation model Program Name Organization Source URL
Long Wave Theory TUNAMI Tohoku University, Japan Open https://code.google.com/p/tunami/
STOC The Port and Airport Research Institute, Japan Open http://www.pari.go.jp/cgi-bin/search-en/de
tail.cgi?id=2005060440205
COMCOT Cornell University, USA Open http://ceeserver.cee.cornell.edu/pll-group/comcot.htm
GeoClaw Washington University, USA Open http://depts.washington.edu/clawpack/geo
claw/ MOST NOAA, USA Closed http://nctr.pmel.noaa.gov/model.html ComMIT NOAA, USA Closed http://nctr.pmel.noaa.gov/ComMIT/ Disperse Wave Theory Disperse Potential Model
National Defense Academy, Japan Open http://www.nda.ac.jp/cc/kensetsu/index-e.
html
FUNWAVE University of Delaware, USA Open http://chinacat.coastal.udel.edu/programs/f
unwave/funwave.html NEOWAVE University of Hawaii, USA Open http://www.ore.hawaii.edu/OE/index.htm
COULWAVE Cornell University, USA Closed http://ceeserver.cee.cornell.edu/pll-group/doc/COULWAVE_manual.pdf
Input Data A.2.2General input data for tsunami simulation is as follows. These data is given to each grid which is explained below.
1) Topographical data 2) Roughness data

Risk Profile Report - Cavite, Laguna and Southern Part of Metropolitan Manila of the Philippines -
A-20
3) Sea defense data 4) Initial water height data (= deformation of sea-floor)
(1) Topographical Data Topographical model for the area which includes the source region of the scenario earthquake, the objective area and the route of tsunami between them is required for tsunami simulation. Topographical model includes the topography of sea-floor, the topography of the land surface where tsunami might run up and sea defense structures. Orthogonal coordinate system is usually used for the modeled area of less than 1,000 km x 1,000 km and polar coordinate system is used for the wider area. The orthogonal UTM coordinate system is used for this analysis.
The simulation area is divided and covered by square grid and altitude and roughness data are given to each grid. Altitude describes topographic features and roughness is used for considering friction between water and sea-floor or land surface. The size of grid is properly defined considering the complexity of topography and the wavelength of tsunami. The grid size is usually defined from bigger to smaller according to the distance from coastlines, considering the condition that is the topography becomes more complex and shorter wave component becomes dominant at the nearer area to the coastlines. This methodology is called "nesting". The grid size is defined as, for instance, 1350m -> 450m -> 150m -> 50m from tsunami source region to the coast. Grid is connected with 1/3 size grid step by step in this case and this 1/3 connection is the most general way, however 1/2 connection and 1/5 connection is also used for nesting.
Topographical data is obtained from bathymetry chart and topographical map. Nowadays, digital data of those maps are often available. However, if there is no digital data, it is required to generate digital data by digitizing those maps. Table A.2.2 shows digital topographical data provided by international organization for free. Those data can be also used for the modeling. Following shows a case study preparing topographical model from source region to coastal area by GEBCO_08 data (Figure A.2.2) and from coastal area to the coastline and inland area by more detailed bathymetry chart (Figure A.2.3).
Table A.2.2 Open-source Data of Bathymetric Chart
Name Explanation
GEBCO_08 Grid - Organization: British Oceanographic Data Centre (BODC) - Topographic data of 30 sec grid covering sea-floor and land surface - URL: http://www.gebco.net/data_and_products/gridded_bathymetry_data/
SRTM30_PLUS - Organization: Scripps Institution of Oceanography, University of California San Diego - Topographic data of 30 sec grid covering sea-floor and land surface - URL: http://topex.ucsd.edu/

Appendix Details of Natural Hazard Assessments
A-21
Figure A.2.2 Wide Area Topography Model by GEBCO Data (South China Sea Area)
Figure A.2.3 Topography Model of Coast Area by Bathymetry Data (Manila Bay area)
(2) Roughness Data The effect of friction for tsunami wave propagation is considered by Manning's roughness coefficient (n). "0.025" is often used as roughness coefficient for marine area. Table A.2.33) and Table A.2.44) show Manning's roughness coefficients for different types of ground surfaces.
0 1000 2000 3000 4000 5000 6000
Depth (m)
1350m grid area

Risk Profile Report - Cavite, Laguna and Southern Part of Metropolitan Manila of the Philippines -
A-22
Table A.2.3 Comparison of Manning's roughness coefficients 3) Fukuoka et al. (1994) Aida (1977) Goto and Shuto (1983) Kotani et al. (1998)
category estimated roughness coefficient
category equivalent roughness coefficient
category estimated coefficient category
setup roughness coefficient
80% 0.1 high density 0.01
50 ~8 0.096 dense zone 0.07 high density residential zone 0.080
20 ~5 0.084 rather high density zone 0.05 mid
density 0.05 mid density residential zone 0.060
0 ~2 0.056 low density 0.03 low density residential zone 0.040
road 0.043 other land zone 0.02 forest zone (inc. garden, tide protection forest) 0.030
field zone (inc. waste land) 0.020
Shoreline (inc. tide protection forest) 0.04 sea and river zone (w/o tide
protection forest) 0.025
Table A.2.4 Manning values for land cover classes 4)
(3) Sea defense data Embankment and other sea defense structures are modeled as a grid height data.
(4) Initial Water Height Data (=deformation of sea-floor)

Appendix Details of Natural Hazard Assessments
A-23
Change of water height caused by fault movement should be prepared as an initial condition for tsunami simulation. Change of water height is assumed to be same as vertical component of sea-floor deformation. The sea-floor deformation is calculated as a displacement caused by a slip on the fault in the semi-finite elastic body using fault parameters shown in Table A.2.5.
The theory of above calculation is described in the following references like Mansinha and Smilie (1971) 5) or Okada (1992) 6) and others. The website of Cornell University7) and National Research Institute for Earth Science and Disaster Prevention (NIED) 8) are also informative.
Figure A.2.4 shows a calculated deformation of sea-floor by the program named DC3D0 / DC3D 8) developed by Okada.
Table A.2.5 Example of fault parameters
Fault Parameter Sample Value
(corresponding to Figure A.2.4) Depth (km) 18
Strike angle (degree) 177 Dip angle (degree) 24
Rake angle (degree) 90 Length (km) 313 Width (km) 70
Slip (m) 9.6
Figure A.2.4 Example of calculated vertical deformation
Output Data A.2.3The general output of the tsunami simulation is as follows. Output items are obtained for each grid.
1) Maximum water height or maximum inundation height (for all grid)
Water Level (m)

Risk Profile Report - Cavite, Laguna and Southern Part of Metropolitan Manila of the Philippines -
A-24
2) Maximum velocity (for all grid) 3) Elapsed time of maximum water height (for all grid) 4) Elapsed time of given water height ( x cm, for instance) (for all grid) 5) Time history of water height (selected grid) 6) Time history of water velocity (selected grid)
Figure A.2.5 shows a sample result of tsunami simulation by the program "TUNAMI" developed by Tohoku University in Japan. The left side of Figure A.2.5 shows maximum water height distribution map and the right side of Figure A.2.5 shows time history of water height at the selected grid.
Figure A.2.5 example of tsunami simulation results
Return Period of Scenario Earthquake A.2.4The relationship of earthquake magnitude and return period is estimated by Gutenberg-Richter Low using earthquake data, often called earthquake catalog, around the targeted earthquake zone. It is well known that larger earthquake occurs less frequently. It was Gutenberg and Richter who formulate this relation as the following equation in 1941. It is the reason why this relation is called as Gutenberg-Richter Low or G-R Low.
log n(M) = a - b M or
log N(M) = A - b M
The relation between occurrence frequency, n(M) dM, and cumulative frequency which is magnitude M and over, N(M), and 0.1 interval magnitude, dM = 0.1, is arranged in Table A.2.6 for the earthquake data which occurred during 1965 to 1999 in and around Japan area. Figure A.2.6 is the plot of the data with magnitude on x-axis and frequency on y- axis. The formula on the figure is a regression curve of M and N relation derived by the least square method.
Water Level (m)
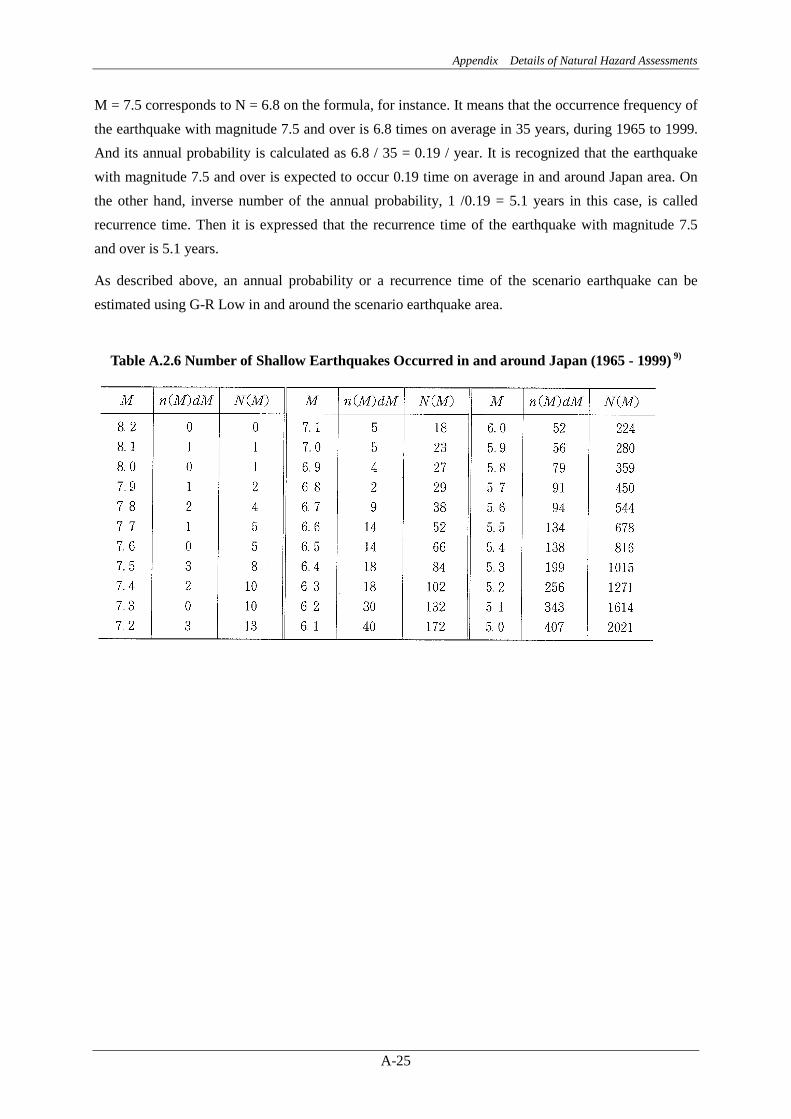
Appendix Details of Natural Hazard Assessments
A-25
M = 7.5 corresponds to N = 6.8 on the formula, for instance. It means that the occurrence frequency of the earthquake with magnitude 7.5 and over is 6.8 times on average in 35 years, during 1965 to 1999. And its annual probability is calculated as 6.8 / 35 = 0.19 / year. It is recognized that the earthquake with magnitude 7.5 and over is expected to occur 0.19 time on average in and around Japan area. On the other hand, inverse number of the annual probability, 1 /0.19 = 5.1 years in this case, is called recurrence time. Then it is expressed that the recurrence time of the earthquake with magnitude 7.5 and over is 5.1 years.
As described above, an annual probability or a recurrence time of the scenario earthquake can be estimated using G-R Low in and around the scenario earthquake area.
Table A.2.6 Number of Shallow Earthquakes Occurred in and around Japan (1965 - 1999) 9)

Risk Profile Report - Cavite, Laguna and Southern Part of Metropolitan Manila of the Philippines -
A-26
Figure A.2.6 Data Plot of Table A.2.6 9)
Results of Simulation A.2.5
(1) Collection of Existing Information The following information and data are collected for setting scenario earthquake and conducting tsunami simulation.
Literatures related to scenario earthquakes
- EMILE A. OKAL et al. (2011) 10): Tsunami Simulations for Regional Sources in the South China and Adjoining Seas
- Vu Thanh Ca1 et al. (2008)11): Tsunami risk along Vietnamese coast - Nguyen Hong Phuong et al. (2013)12): Simulation of a Worst Case Tsunami Scenario from the
Manila Trench to Vietnam Literatures related to earthquake environment
- Earthquake Impact Reduction Study for Metropolitan Manila, Republic of the Philippines Final Report (2004)13): JICA, MMDA, PHIVOLCS
Data related to bathymetric feature
● N(M) ○ n(M) dM (dM=0.1)
M=7.5
N=6.8

Appendix Details of Natural Hazard Assessments
A-27
- Wide area: GEBCO_08 Grid - Vicinity of objective area: Topographical map by NAMRIA (National Mapping and Resource
Information Authority)
(2) Setting of Scenario Earthquake
1) Statistical analysis of earthquake (Gutenberg-Richter Law) The earthquake data along the Manila Trench is picked up from the data14) as shown in Figure A.2.7 and the return period of the earthquake is estimated by statistical analysis based on the Gutenberg-Richter Law. The estimated result is shown in Figure A.2.8. Followings are the results obtained by the analysis.
Formula-1: G-R Law parameters are derived from the data during 1980 to 2002 as "b = 1.0" and "a = 5.2".
Formula-2: In case of drawing envelope assuming "b = 1.0", "a = 6.0" is estimated. Formula-3 (reference): In case of drawing envelope for all data, "b = 0.9" and "a = 5.2" are
estimated. Magnitude of the earthquake along the Manila Trench with 100 years return period is estimated to be 7.2 to 8.0 from Formula-1 and Formula-2.
On the other hand, the return period of the earthquakes with magnitude 8.0 is estimated to be 100 to 630 years and 1,000 to 6,300 years for magnitude 9.0.
2) Setting of scenario earthquake The west side of Luzon Island where Cavite is located faces the South China Sea where fewer earthquakes occur than the Pacific Ocean. In addition, Cavite is located inside the Manila Bay. Therefore, there is almost no record of large tsunami disaster around the area. In this study, the possible tsunami that may cause impact to the study area, though the possibility is very low, is simulated considering that the result will be used in the future.

Risk Profile Report - Cavite, Laguna and Southern Part of Metropolitan Manila of the Philippines -
A-28
Figure A.2.7 Epicenter Data along Manila Trench used for Statistical Analysis

Appendix Details of Natural Hazard Assessments
A-29
Figure A.2.8 Return Period of the Earthquakes along Manila Trench (Gutenberg–Richter law)
(3) Analysis and Results
1) Setting of tsunami (earthquake) model Scenario earthquakes which may affect to the objective area are selected from the existing researches
10)11)12). Table A.2.7 shows fault parameters of scenario earthquakes. The locations of the scenario earthquakes are shown in Figure A.2.9 to Figure A.2.11.
0.001
0.01
0.1
1
10
100
2 3 4 5 6 7 8 9
Anua
l Fre
quen
cy
M
Frequency of Earthquake
PHIVOLCS(2011.1-2013.7)PHIVOLCS(1980-2002)Historical (1897-2000)formula-1 (a=5.2, b=1.0)formula-2 (a=6.0, b=1.0)formula-3 (a=5.2, b=09)

Risk Profile Report - Cavite, Laguna and Southern Part of Metropolitan Manila of the Philippines -
A-30
Table A.2.7 Source Model Scenario
Mw Depth Strike Dip Rake Length Width Slop
No. (km) (degree) (degree) (degree) (km) (km) (m)
111) 8.0 12 177 24 90 151 47 5.3
211) 8.5 18 177 24 90 313 70 906
311) 9.0 27 177 24 90 646 101 17.5
410) 8.6 10 355 35 57 400 90 6.0
510) 8.6 10 355 24 72 400 90 6.0
6 8.0 10 355 24 72 151 47 5.3
Worst Case 12)
9.3
0 35.4 10 90 190 120 25.0
0 22 20 90 250 160 40.0
0 2 28 90 220 160 40.0
0 356 20 90 170 90 28.0
0 344 22 90 140 110 12.0
0 331 26 90 95 80 5.0
Figure A.2.9 Tsunami Source Model (Scenario 1 - 3)
Scenario 1 (M8.0) Scenario 2 (M8.5)
Scenario 3 (M9.0)

Appendix Details of Natural Hazard Assessments
A-31
Figure A.2.10 Tsunami Source Model (Scenario 4 - 6)
Figure A.2.11 Tsunami Source Model (Worst Case Scenario)
Worst Case Scenario (M9.3)
Scenario 4 (M8.6)
Scenario 5 (M8.6)
Scenario 6 (M8.0)

Risk Profile Report - Cavite, Laguna and Southern Part of Metropolitan Manila of the Philippines -
A-32
2) Selection of tsunami simulation model Tsunami simulation program "TUNAMI" which is developed by Tohoku University based on the non-linear long wave theory is used for the analysis. Analysis period is set to be 24 hours after earthquake occurrence.
3) Preparation of Input data UTM coordinate system is used. Square grids are adopted for topographical model. The size of grids are defined as 1350m, 450m, 150m and 50m, from tsunami source region to the coast based on the nesting method.
Topographical data The depth of the grids in the ocean area with the size of 1350m, 450m and 150m and the inland 50m grids are generated based on "GEBCO_08 Grid" data prepared by BODC (British Oceanographic Data Centre).
The point water depths in the topography map prepared by NAMRIA (National Mapping and Resource Information Authority) are digitized and used for creating the depth data of the 50m grids in the Manila Bay.
Figure A.2.12 shows the wide area topographical model prepared from "GEBCO_08 Grid". Figure A.2.13 shows the topographical model around the Manila Bay prepared from topographical map.
Roughness data Roughness coefficient "0.025" is used for ocean and land area.
Sea defense data Embankment and other sea defense structures are not considered in this study.
Initial water height data (= deformation of sea-floor) Deformation of sea-floor is calculated by Okada's program "DC3D0 / DC3D" with using fault parameters of scenario earthquakes and the vertical component of the deformation of sea-floor is given to corresponding grid as initial water height.
Calculated deformation of sea-floor is shown in Figure A.2.14, Figure A.2.17, Figure A.2.20, Figure A.2.23, Figure A.2.26, Figure A.2.29 and Figure A.2.32.

Appendix Details of Natural Hazard Assessments
A-33
Figure A.2.12 Wide Area Topography Model by GEBCO Data (South China Sea Area)
Figure A.2.13 Topography Model of Coast Area by Bathymetry Data (Manila Bay area)
0 1000 2000 3000 4000 5000 6000
Depth (m)
1350m grid area

Risk Profile Report - Cavite, Laguna and Southern Part of Metropolitan Manila of the Philippines -
A-34
4) Tsunami simulation Figure A.2.14 to Figure A.2.34 show the results of the simulation for Scenario 1 to 5 and the Worst Case Scenario. Table A.2.8 shows the maximum tsunami height at Cavite and the expected return period calculated from magnitude of each scenario earthquake.
Cavite is located inside of the Manila Bay, therefore tsunami height is not so high compared to the open ocean. It is estimated that the tsunami heights by the earthquakes with magnitude around 8.5 which occur along the Manila Trench are less than 1 m by the simulation (Scenario 2, 4, 5, 6). If earthquake of magnitude 9.0 occurs, the tsunami height may become larger than 2 m (Scenario 3 and Worst Case Scenario); however the probability of such a huge earthquake may be once in several thousand years.
Table A.2.8 Maximum Tsunami Height at Cavite for Each Scenario
Scenario No. Mw Return Period
(year) Max. Tsunami Height
(m)
1 8.0 100 ~63 0.12
2 8.5 300 ~20 0.57
3 9.0 1000 ~6 2.66
4 8.6 400 ~25 0.24
5 8.6 400 ~25 0.66
6 8.0 100 ~63 0.34
Worst Case 9.3 2000 ~1 2.98

Appendix Details of Natural Hazard Assessments
A-35
Simulation result of Scenario 1
Figure A.2.14 Vertical deformation (Scenario 1)
Figure A.2.15 Maximum Water Height (Scenario 1)
Figure A.2.16 Wave form of Tsunami Height at Cavite (Scenario 1)
Water Level (m)
Water Level (m)
Cavite
This map is intended to be used for disaster scenario creation. This map is not the forecast of the future hazard. [Analytical condition] Software: TUNAMI by Tohoku Univ., Bathymetry data: GEBCO_08, Topography map by NAMRIA, Grid size: 1350m, 450m, 150m, 50m, Simulation duration: 24 hours, Return period: 100 - 630 years.
This map is intended to be used for disaster scenario creation. This map is not the forecast of the future hazard. [Analytical condition] Software: TUNAMI by Tohoku Univ., Bathymetry data: GEBCO_08, Topography map by NAMRIA, Grid size: 1350m, 450m, 150m, 50m, Simulation duration: 24 hours, Return period: 100 - 630 years.

Risk Profile Report - Cavite, Laguna and Southern Part of Metropolitan Manila of the Philippines -
A-36
Simulation result of Scenario 2
Figure A.2.17 Vertical deformation (Scenario 2)
Figure A.2.18 Maximum Water Height (Scenario 2)
Figure A.2.19 Wave form of Tsunami Height at Cavite (Scenario 2)
Water Level (m)
Water Level (m)
Cavite
This map is intended to be used for disaster scenario creation. This map is not the forecast of the future hazard. [Analytical condition] Software: TUNAMI by Tohoku Univ., Bathymetry data: GEBCO_08, Topography map by NAMRIA, Grid size: 1350m, 450m, 150m, 50m, Simulation duration: 24 hours, Return period: 300 - 2000 years.
This map is intended to be used for disaster scenario creation. This map is not the forecast of the future hazard. [Analytical condition] Software: TUNAMI by Tohoku Univ., Bathymetry data: GEBCO_08, Topography map by NAMRIA, Grid size: 1350m, 450m, 150m, 50m, Simulation duration: 24 hours, Return period: 300 - 2000 years.

Appendix Details of Natural Hazard Assessments
A-37
Simulation result of Scenario 3
Figure A.2.20 Vertical deformation (Scenario 3)
Figure A.2.21 Maximum Water Height (Scenario 3)
Figure A.2.22 Wave form of Tsunami Height at Cavite (Scenario 3)
Water Level (m)
This map is intended to be used for disaster scenario creation. This map is not the forecast of the future hazard. [Analytical condition] Software: TUNAMI by Tohoku Univ., Bathymetry data: GEBCO_08, Topography map by NAMRIA, Grid size: 1350m, 450m, 150m, 50m, Simulation duration: 24 hours, Return period: 1000 - 6300 years.
This map is intended to be used for disaster scenario creation. This map is not the forecast of the future hazard. [Analytical condition] Software: TUNAMI by Tohoku Univ., Bathymetry data: GEBCO_08, Topography map by NAMRIA, Grid size: 1350m, 450m, 150m, 50m, Simulation duration: 24 hours, Return period: 1000 - 6300 years.

Risk Profile Report - Cavite, Laguna and Southern Part of Metropolitan Manila of the Philippines -
A-38
Simulation result of Scenario 4
Figure A.2.23 Vertical deformation (Scenario 4)
Figure A.2.24 Maximum Water Height (Scenario 4)
Figure A.2.25 Wave form of Tsunami Height at Cavite (Scenario 4)
Water Level (m)
Water Level (m)
Cavite
This map is intended to be used for disaster scenario creation. This map is not the forecast of the future hazard. [Analytical condition] Software: TUNAMI by Tohoku Univ., Bathymetry data: GEBCO_08, Topography map by NAMRIA, Grid size: 1350m, 450m, 150m, 50m, Simulation duration: 24 hours, Return period: 400 - 2500 years.
This map is intended to be used for disaster scenario creation. This map is not the forecast of the future hazard. [Analytical condition] Software: TUNAMI by Tohoku Univ., Bathymetry data: GEBCO_08, Topography map by NAMRIA, Grid size: 1350m, 450m, 150m, 50m, Simulation duration: 24 hours, Return period: 400 - 2500 years.

Appendix Details of Natural Hazard Assessments
A-39
Simulation result of Scenario 5
Figure A.2.26 Vertical deformation (Scenario 5)
Figure A.2.27 Maximum Water Height (Scenario 5)
Figure A.2.28 Wave form of Tsunami Height at Cavite (Scenario 5)
Water Level (m)
Water Level (m)
Cavite
This map is intended to be used for disaster scenario creation. This map is not the forecast of the future hazard. [Analytical condition] Software: TUNAMI by Tohoku Univ., Bathymetry data: GEBCO_08, Topography map by NAMRIA, Grid size: 1350m, 450m, 150m, 50m, Simulation duration: 24 hours, Return period: 400 - 2500 years.
This map is intended to be used for disaster scenario creation. This map is not the forecast of the future hazard. [Analytical condition] Software: TUNAMI by Tohoku Univ., Bathymetry data: GEBCO_08, Topography map by NAMRIA, Grid size: 1350m, 450m, 150m, 50m, Simulation duration: 24 hours, Return period: 400 - 2500 years.

Risk Profile Report - Cavite, Laguna and Southern Part of Metropolitan Manila of the Philippines -
A-40
Simulation result of Scenario 6
Figure A.2.29 Vertical deformation (Scenario 6)
Figure A.2.30 Maximum Water Height (Scenario 6)
Figure A.2.31 Wave form of Tsunami Height at Cavite (Scenario 6)
Water Level (m)
Water Level (m)
Cavite
This map is intended to be used for disaster scenario creation. This map is not the forecast of the future hazard. [Analytical condition] Software: TUNAMI by Tohoku Univ., Bathymetry data: GEBCO_08, Topography map by NAMRIA, Grid size: 1350m, 450m, 150m, 50m, Simulation duration: 24 hours, Return period: 100 - 630 years.
This map is intended to be used for disaster scenario creation. This map is not the forecast of the future hazard. [Analytical condition] Software: TUNAMI by Tohoku Univ., Bathymetry data: GEBCO_08, Topography map by NAMRIA, Grid size: 1350m, 450m, 150m, 50m, Simulation duration: 24 hours, Return period: 100 - 630 years.
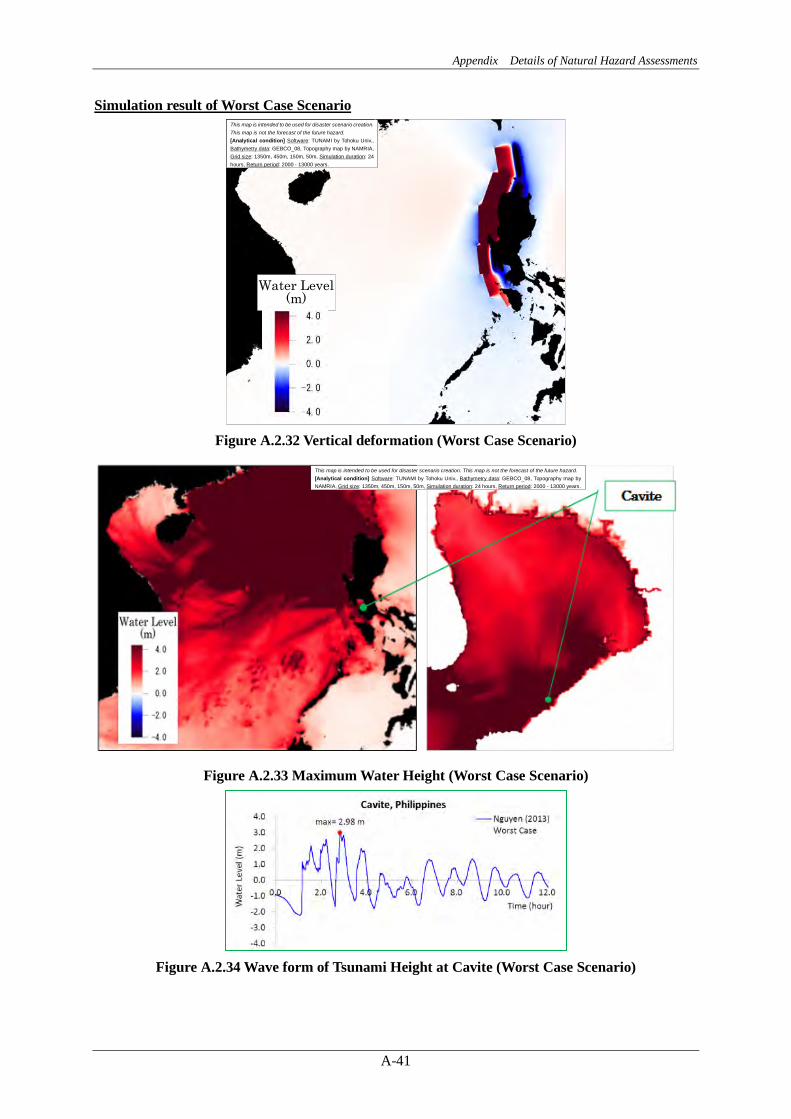
Appendix Details of Natural Hazard Assessments
A-41
Simulation result of Worst Case Scenario
Figure A.2.32 Vertical deformation (Worst Case Scenario)
Figure A.2.33 Maximum Water Height (Worst Case Scenario)
Figure A.2.34 Wave form of Tsunami Height at Cavite (Worst Case Scenario)
Water Level (m)
This map is intended to be used for disaster scenario creation. This map is not the forecast of the future hazard. [Analytical condition] Software: TUNAMI by Tohoku Univ., Bathymetry data: GEBCO_08, Topography map by NAMRIA, Grid size: 1350m, 450m, 150m, 50m, Simulation duration: 24 hours, Return period: 2000 - 13000 years.
This map is intended to be used for disaster scenario creation. This map is not the forecast of the future hazard. [Analytical condition] Software: TUNAMI by Tohoku Univ., Bathymetry data: GEBCO_08, Topography map by NAMRIA, Grid size: 1350m, 450m, 150m, 50m, Simulation duration: 24 hours, Return period: 2000 - 13000 years.

Risk Profile Report - Cavite, Laguna and Southern Part of Metropolitan Manila of the Philippines -
A-42
Evaluation of the Results A.2.6
1) Return period of the tsunami The probabilistic analysis methodology for tsunami is not established as for the earthquake. The main reason is that there is no simple simulation method for tsunami compared to the earthquake. The earthquake motion can be evaluated by attenuation formula using only the magnitude of the earthquake and the distance from the epicenter to the study point; however simple formula to estimate tsunami is not exist because the influence of the bathymetry and the shape of the shore line have a great influence to the tsunami. Therefore, the tsunami simulation for the previously decided probability of occurrence like the other hazards is not possible. In this study, the tsunami was simulated based on the existing fault models in the existing scientific papers, and the probability of the occurrence of the earthquake at the fault was estimated based on the earthquake catalogue around the fault separately. The tsunami simulation in this study is not the probabilistic analysis but the simulation of tsunami by the existing fault model and the evaluation of the probability of fault activity.
2) Bathymetry data The open source bathymetry data of around 1km grid is used to make the bathymetry model. The quality of the data is enough to be used to make offshore bathymetry model. The bathymetry data near the coast should be more precise, for example 50m grid data is necessary. The chart or bathymetry map are digitized and used in this study. The precise bathymetry data is sometimes unavailable or not exist at all. This limitation may become an obstacle to the tsunami simulation.
3) Run-up The run-up is not simulated in this study because the precise and accurate elevation model, height of dyke, land cover and distribution of the buildings are necessary. The high level of technique is also required for precise analysis. The hurdle to realize the run-up simulation for Area BCP is high.
References 1) IUGG/IOC Time Project: Numerical Method of Tsunami Simulation with the Leap-frog Scheme,
IOC Manuals and Guides No.35, UNESCO 1997 http://www.jodc.go.jp/info/ioc_doc/Manual/122367eb.pdf
2) Imamura, Yalciner and Ozyurt (2006): TSUNAMI MODELLING MANUAL (TUNAMI model) http://www.tsunami.civil.tohoku.ac.jp/hokusai3/E/projects/manual-ver-3.1.pdf
3) Tsunami Dictionary (Japanese) (2007) : Edited by Shuto, Imamura, Koshimura, Satake, Matsutomi, Asakura Publishing Co., Ltd
4) Kaiser, Scheele1, Kortenhaus, Løvholt, Romer, Leschka (2011): The influence of land cover roughness on the results of high resolution tsunami inundation modeling, Nat. Hazards Earth Syst.

Appendix Details of Natural Hazard Assessments
A-43
Sci., 11, 2521–2540 http://www.nat-hazards-earth-syst-sci.net/11/2521/2011/nhess-11-2521-2011.pdf
5) Mansinha, Smilie (1971): The Displacement Fields of Inclined Faults, Bulletin of the Seismological Society of America, Vol. 61, No. 5, pp. 1433-1440 http://ceeserver.cee.cornell.edu/pll-group/doc/Mansinha_Smylie_1971.pdf
6) Okada (1992): Internal deformation due to shear and tensile faults in a half-space, Bull. Seism. Soc. Am., 82, 1018-1040.
7) COMCOT, Cornell University http://ceeserver.cee.cornell.edu/pll-group/comcot_fault.htm
8) Program to calculate deformation due to a fault model DC3D0 / DC3D http://www.bosai.go.jp/study/application/dc3d/DC3Dhtml_E.html
9) Utsu (2001): Seismology, 3rd edition (Japanese), Kyoritsu Shuppan Co., Ltd. 10) EMILE A. OKAL, COSTAS E. SYNOLAKIS, and NIKOS KALLIGERIS (2011): Tsunami
Simulations for Regional Sources in the South China and Adjoining Seas, Pure and Applied Geophysics 168 (2011), 1153–1173
11) Vu Thanh Ca1 and Nguyen Dinh Xuyen (2008): Tsunami risk along Vietnamese coast, Journal of Water Resources and Environmental Engineering, No. 23, November 2008
12) Nguyen Hong Phuong, Vu Ha Phuong, and Pham The Truyen (2013): Simulation of a Worst Case Tsunami Scenario from the Manila Trench to Vietnam, Joint Symposium on Seismic Hazard Assessment - Sendai, Japan, 17 –19 June, 2013
13) Earthquake Impact Reduction Study for Metropolitan Manila, Republic of the Philippines Final Report (2004): Japan International Cooperation Agency (JICA), Metropolitan Manila Development Authority (MMDA), and Philippine Institute of Volcano and Seismology (PHIVOLCS), Pacific Consultants International, OYO International Corporation, PASCO Corporation

Risk Profile Report - Cavite, Laguna and Southern Part of Metropolitan Manila of the Philippines -
A-44
Flood Hazard Assessment A.3
Overview A.3.1The flood/inundation analysis model for Cavite Lowland was already built in previous JICA Study, The Study on Comprehensive Flood Mitigation for Cavite Lowland Area, 2007 - 2009. In this study, the analysis model build in previous JICA study shall be used for evaluation of natural disaster. The following table shows the outline of the model.
Table A.3.1 Outline of Flood/Inundation Model for Cavite Lowland Area No. Items Descriptions
1 Target area Eastern part of state of Cavite in Philippine including Imus River Basin, Sun Juan & Ylang Ylang River Basin and Canas River Basin. Total area is 407.4km2
2 Rainfall Analysis
Sample: annual maximum 2 days rainfall (average rainfall of watershed) Number of samples: 25 (from 1978 to 2006) Probability density function: Logarithm-Pearson distribution type III
Probable Rainfall Return Period (year) 2-days rainfall (mm)
2 191 3 224 5 258
10 295 20 326 30 342 50 360
100 383 200* 412
* re-calculated in this study
3 Runoff Analysis
Model: Quasi Linear model MIKE-11 (one-dimensional unsteady flow model, DHI1) was employed for flood routing analysis Land use condition: 2003
4 Inundation Analysis
Model: MIKE-FLOOD (DHI) MIKE-11 (for flood routing analysis) and MIKE-21 (inundation analysis) Boundary condition
Upper: Calculated hydrograph with the runoff model Lower: Observed tidal level in Manila bay and Cavite port
5 Accuracy of the model
In order to ensure the reasonability of the model, hydrological parameters were tuned. This model can re-produce the flood/inundation condition by typhoon Milenyo in 2006 which was record-high flood in those days.
Design Flood Scale A.3.2Design disaster scale shall be determined considering central and/or local government policies, opinion of resident, feasibility of countermeasures and so on. Here, flood analysis under four cases including 50, 100, 200-year (probable rainfall) and record-high rainfall shall be conducted for reference. Other studies on natural disaster (earthquake, tsunami and storm surge) would be done for same probability.
1 Danish Hydraulic Institute, DHI http://www.dhigroup.com/

Appendix Details of Natural Hazard Assessments
A-45
Result of Flood/Inundation Analysis A.3.3The inundation maps are shown in next pages. According to the analysis, it could be said that Cavite industrial estate is not damaged even by flooding of 200-year scale. Northern part of coastal line could be inundated by flooding and road traffic could be closed. However, from the past result2, interrupting time of traffic by inundation was evaluated to be a few days (average interrupting time was 1.5 days) and an influence of prohibition of traffic could be small.
Figure A.3.1 Target Area for Flood/Inundation Analysis (Cavite Lowland)
2 The Study on Comprehensive Flood Mitigation for Cavite Lowland Area, 2007 - 2009
Cavite industrial estate
Analysis area
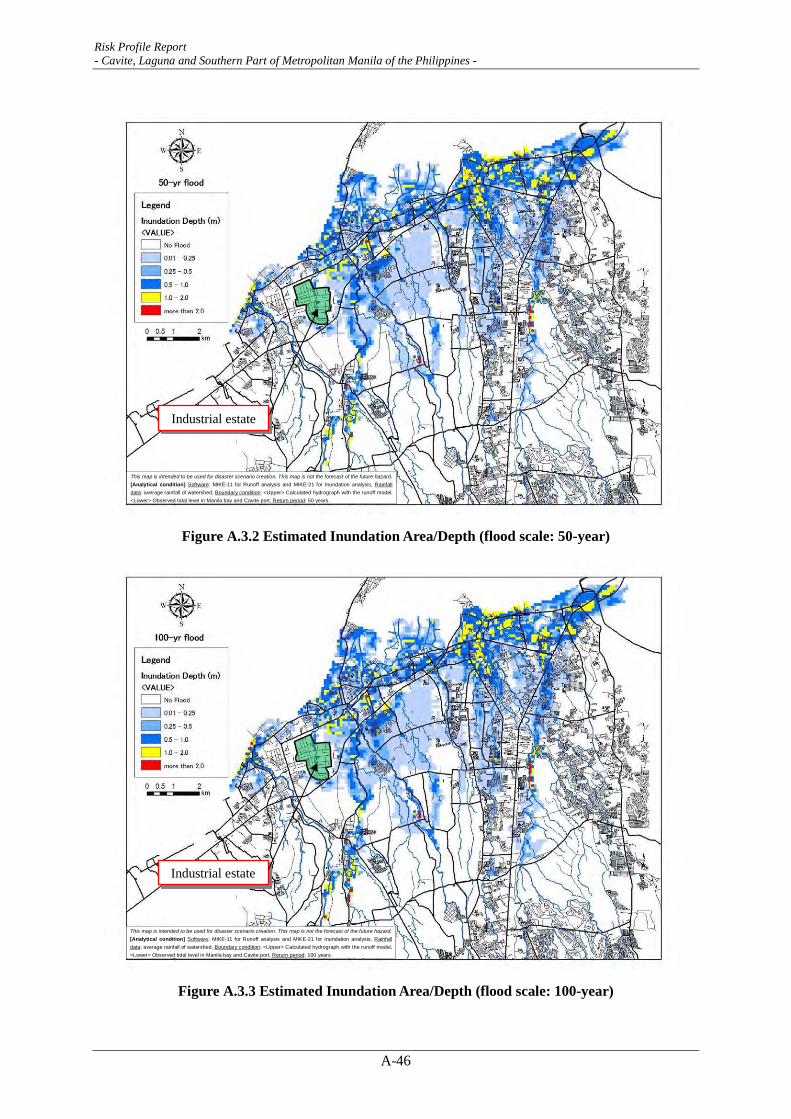
Risk Profile Report - Cavite, Laguna and Southern Part of Metropolitan Manila of the Philippines -
A-46
Figure A.3.2 Estimated Inundation Area/Depth (flood scale: 50-year)
Figure A.3.3 Estimated Inundation Area/Depth (flood scale: 100-year)
Industrial estate
Industrial estate
This map is intended to be used for disaster scenario creation. This map is not the forecast of the future hazard. [Analytical condition] Software: MIKE-11 for Runoff analysis and MIKE-21 for Inundation analysis, Rainfall data: average rainfall of watershed, Boundary condition: <Upper> Calculated hydrograph with the runoff model, <Lower> Observed tidal level in Manila bay and Cavite port, Return period: 50 years.
This map is intended to be used for disaster scenario creation. This map is not the forecast of the future hazard. [Analytical condition] Software: MIKE-11 for Runoff analysis and MIKE-21 for Inundation analysis, Rainfall data: average rainfall of watershed, Boundary condition: <Upper> Calculated hydrograph with the runoff model, <Lower> Observed tidal level in Manila bay and Cavite port, Return period: 100 years.

Appendix Details of Natural Hazard Assessments
A-47
Figure A.3.4 Estimated Inundation Area/Depth (flood scale: 200-year)
Figure A.3.5 Estimated Inundation Area/Depth (record-high flood, 2006yr)
Industrial estate
Industrial estate
This map is intended to be used for disaster scenario creation. This map is not the forecast of the future hazard. [Analytical condition] Software: MIKE-11 for Runoff analysis and MIKE-21 for Inundation analysis, Rainfall data: average rainfall of watershed, Boundary condition: <Upper> Calculated hydrograph with the runoff model, <Lower> Observed tidal level in Manila bay and Cavite port, Return period: 200 years.
This map is intended to be used for disaster scenario creation. This map is not the forecast of the future hazard. [Analytical condition] Software: MIKE-11 for Runoff analysis and MIKE-21 for Inundation analysis, Rainfall data: average rainfall of watershed, Boundary condition: <Upper> Calculated hydrograph with the runoff model, <Lower> Observed tidal level in Manila bay and Cavite port, Record-high flood in 2006.

Risk Profile Report - Cavite, Laguna and Southern Part of Metropolitan Manila of the Philippines -
A-48
*Inundation depth less than 5cm is not displayed
Figure A.3.6 Estimated Inundation Period (flood scale: 50-year)
*Inundation depth less than 5cm is not displayed
Figure A.3.7 Estimated Inundation Period (flood scale: 100-year)
Industrial estate
Industrial estate
This map is intended to be used for disaster scenario creation. This map is not the forecast of the future hazard. [Analytical condition] Software: MIKE-11 for Runoff analysis and MIKE-21 for Inundation analysis, Rainfall data: average rainfall of watershed, Boundary condition: <Upper> Calculated hydrograph with the runoff model, <Lower> Observed tidal level in Manila bay and Cavite port, Return period: 50 years.
This map is intended to be used for disaster scenario creation. This map is not the forecast of the future hazard. [Analytical condition] Software: MIKE-11 for Runoff analysis and MIKE-21 for Inundation analysis, Rainfall data: average rainfall of watershed, Boundary condition: <Upper> Calculated hydrograph with the runoff model, <Lower> Observed tidal level in Manila bay and Cavite port, Return period: 100 years.

Appendix Details of Natural Hazard Assessments
A-49
Inundation depth less than 5cm is not displayed
Figure A.3.8 Estimated Inundation Period (flood scale: 200-year)
Inundation depth less than 5cm is not displayed
Figure A.3.9 Estimated Inundation Period (record-high flood, 2006)
Industrial estate
Industrial estate
This map is intended to be used for disaster scenario creation. This map is not the forecast of the future hazard. [Analytical condition] Software: MIKE-11 for Runoff analysis and MIKE-21 for Inundation analysis, Rainfall data: average rainfall of watershed, Boundary condition: <Upper> Calculated hydrograph with the runoff model, <Lower> Observed tidal level in Manila bay and Cavite port, Return period: 200 years.
This map is intended to be used for disaster scenario creation. This map is not the forecast of the future hazard. [Analytical condition] Software: MIKE-11 for Runoff analysis and MIKE-21 for Inundation analysis, Rainfall data: average rainfall of watershed, Boundary condition: <Upper> Calculated hydrograph with the runoff model, <Lower> Observed tidal level in Manila bay and Cavite port, Record-high flood in 2006.
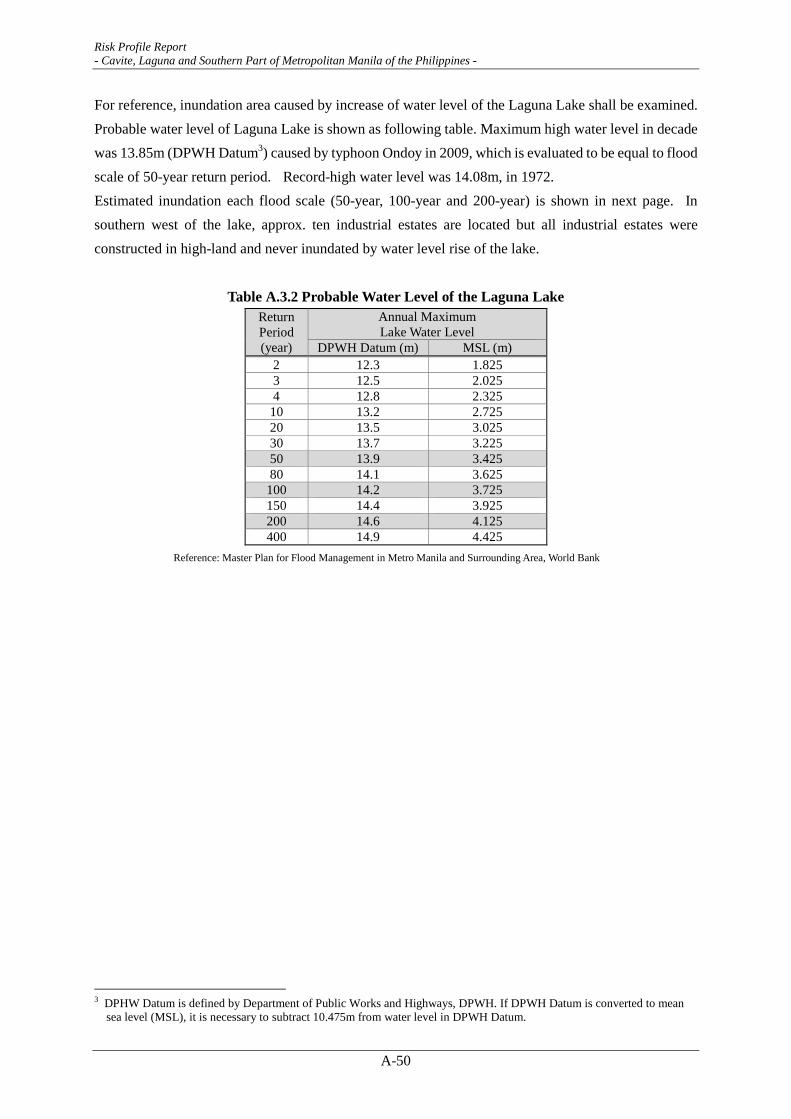
Risk Profile Report - Cavite, Laguna and Southern Part of Metropolitan Manila of the Philippines -
A-50
For reference, inundation area caused by increase of water level of the Laguna Lake shall be examined. Probable water level of Laguna Lake is shown as following table. Maximum high water level in decade was 13.85m (DPWH Datum3) caused by typhoon Ondoy in 2009, which is evaluated to be equal to flood scale of 50-year return period. Record-high water level was 14.08m, in 1972. Estimated inundation each flood scale (50-year, 100-year and 200-year) is shown in next page. In southern west of the lake, approx. ten industrial estates are located but all industrial estates were constructed in high-land and never inundated by water level rise of the lake.
Table A.3.2 Probable Water Level of the Laguna Lake Return Period (year)
Annual Maximum Lake Water Level
DPWH Datum (m) MSL (m) 2 12.3 1.825 3 12.5 2.025 4 12.8 2.325 10 13.2 2.725 20 13.5 3.025 30 13.7 3.225 50 13.9 3.425 80 14.1 3.625
100 14.2 3.725 150 14.4 3.925 200 14.6 4.125 400 14.9 4.425
Reference: Master Plan for Flood Management in Metro Manila and Surrounding Area, World Bank
3 DPHW Datum is defined by Department of Public Works and Highways, DPWH. If DPWH Datum is converted to mean
sea level (MSL), it is necessary to subtract 10.475m from water level in DPWH Datum.

Appendix Details of Natural Hazard Assessments
A-51
flo
od sc
ale:
100
-yea
r (14
.2m
)
Figu
re A
.3.1
0 In
unda
tion
Map
aro
und
the
Lag
una
Lak
e (1
/2)
flo
od sc
ale:
50-
year
(13.
9m)
This
map
is
in
tend
ed t
o be
us
ed f
or
disa
ster
sce
nario
cr
eatio
n. T
his
map
is n
ot th
e fo
reca
st o
f the
futu
re h
azar
d.
[Ana
lytic
al
cond
ition
] In
unda
tion
area
ca
used
by
th
e in
crea
se o
f w
ater
lev
el o
f th
e La
guna
Lak
e is
est
imat
ed
base
d on
the
pro
babl
e w
ater
lev
el,
Ele
vatio
n da
ta:
AS
TER
G
DE
M, R
etur
n pe
riod:
100
yea
rs.
This
m
ap
is
inte
nded
to
be u
sed
for
disa
ster
sce
nario
cr
eatio
n. T
his
map
is n
ot th
e fo
reca
st o
f the
futu
re h
azar
d.
[Ana
lytic
al
cond
ition
] In
unda
tion
area
ca
used
by
th
e in
crea
se o
f w
ater
lev
el o
f th
e La
guna
Lak
e is
est
imat
ed
base
d on
the
pro
babl
e w
ater
leve
l, E
leva
tion
data
: A
STE
R
GD
EM
, Ret
urn
perio
d: 5
0 ye
ars.
This
map
is
in
tend
ed t
o be
us
ed f
or
disa
ster
sce
nario
cr
eatio
n. T
his
map
is n
ot th
e fo
reca
st o
f the
futu
re h
azar
d.
[Ana
lytic
al
cond
ition
] In
unda
tion
area
ca
used
by
th
e in
crea
se o
f w
ater
lev
el o
f th
e La
guna
Lak
e is
est
imat
ed
base
d on
the
prob
able
wat
er le
vel,
Elev
atio
n da
ta:
ASTE
R
GD
EM, R
etur
n pe
riod:
50
year
s.

Risk Profile Report - Cavite, Laguna and Southern Part of Metropolitan Manila of the Philippines -
A-52
R
ecor
d-hi
gh w
ater
leve
l in
1972
Figu
re A
.3.1
1 In
unda
tion
Map
aro
und
the
Lag
una
Lak
e (2
/2)
flo
od sc
ale:
200
-yea
r (14
.6m
)
This
map
is
in
tend
ed t
o be
us
ed f
or
disa
ster
sce
nario
cr
eatio
n. T
his
map
is n
ot th
e fo
reca
st o
f the
futu
re h
azar
d.
[Ana
lytic
al
cond
ition
] In
unda
tion
area
ca
used
by
th
e in
crea
se o
f w
ater
lev
el o
f th
e La
guna
Lak
e is
est
imat
ed
base
d on
the
pro
babl
e w
ater
lev
el,
Ele
vatio
n da
ta:
AS
TER
G
DE
M, R
ecor
d-hi
gh w
ater
leve
l in
1972
.
This
map
is
in
tend
ed t
o be
us
ed f
or
disa
ster
sce
nario
cr
eatio
n. T
his
map
is n
ot th
e fo
reca
st o
f the
futu
re h
azar
d.
[Ana
lytic
al
cond
ition
] In
unda
tion
area
ca
used
by
th
e in
crea
se o
f w
ater
lev
el o
f th
e La
guna
Lak
e is
est
imat
ed
base
d on
the
pro
babl
e w
ater
lev
el,
Ele
vatio
n da
ta:
AS
TER
G
DE
M, R
etur
n pe
riod:
200
yea
rs.

Appendix Details of Natural Hazard Assessments
A-53
Evaluation of the Results A.3.4The analysis of flooding in Cavite considers plenty of precise conditions because the data and software, which are used in the existing precise study project, are made use of. The surveyed cross section of river and channel and surveyed elevation data are used. The precise high precision analysis method is adopted. This analysis is higher than outline level and over-spec for disaster scenario. The flooding simulation specialist was occupied for six months during the existing study. This may be far beyond the proper input for disaster scenario formulation.
Recommended


![REPORT OF OYO SEMO[1]](https://img.pdfslide.us/doc/110x75/58edc8291a28aba90b8b4679/report-of-oyo-semo1.jpg)