
The Collaborative
Economy:
A Response to a Digitally
Disrupted World
Frank Farrall

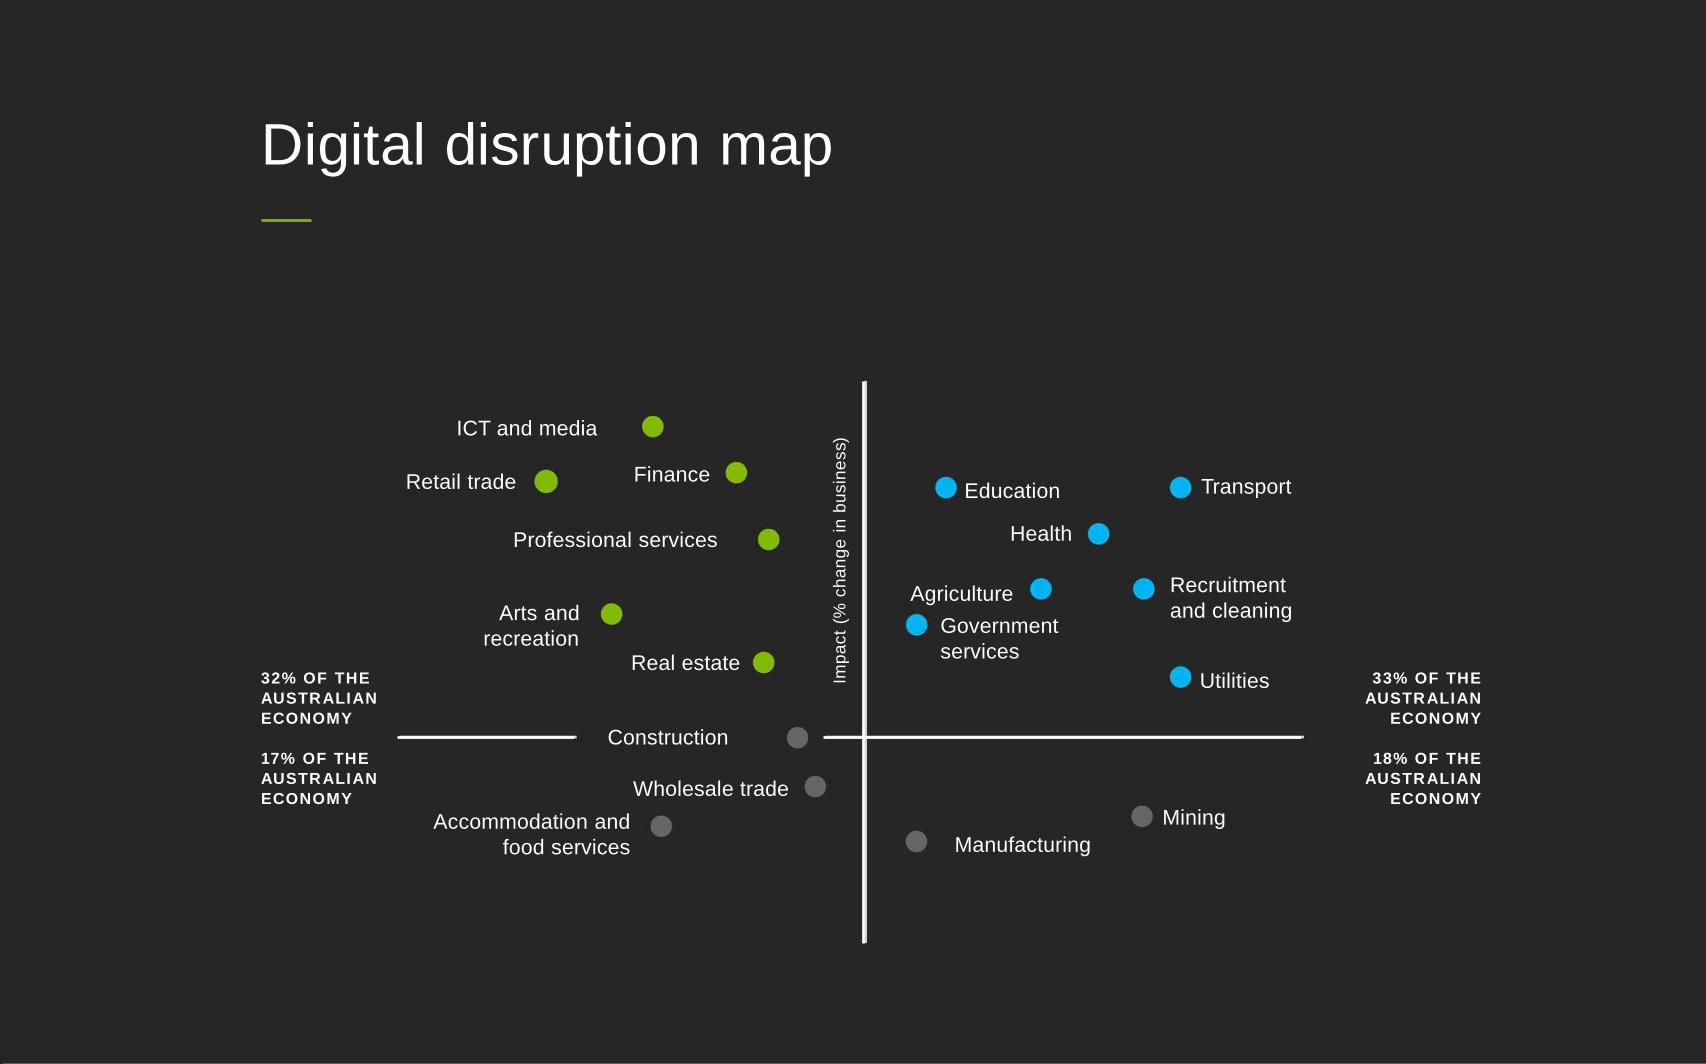
ICT and media
Finance
Professional services
Retail trade
Arts and
recreationReal estate
Construction
Wholesale trade
Manufacturing
Mining
Utilities
Agriculture
Government
services
Education
Health
Transport
Recruitment
and cleaning
Accommodation and
food services
32% OF THE
AUSTRALIAN
ECONOMY
17% OF THE
AUSTRALIAN
ECONOMY
18% OF THE
AUSTRALIAN
ECONOMY
33% OF THE
AUSTRALIAN
ECONOMY
Imp
act
(%ch
an
ge
inb
usin
ess)
Digital disruption map
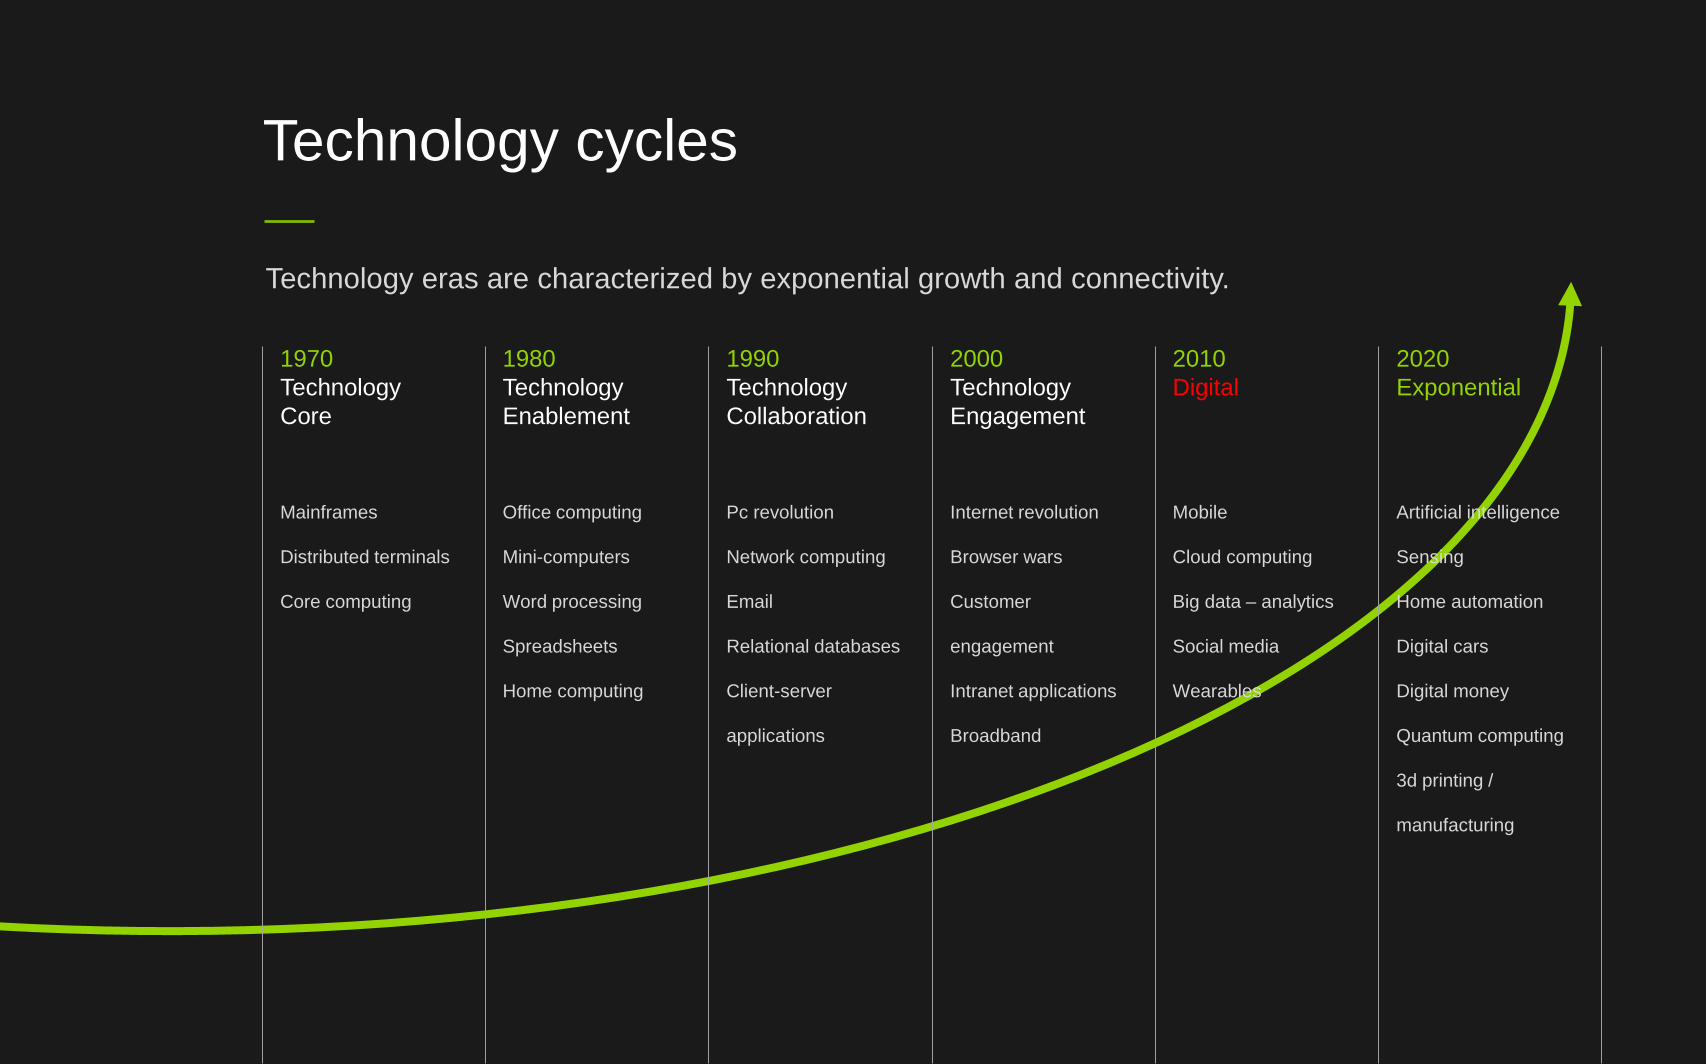
1970
Technology
Core
1980
Technology
Enablement
1990
Technology
Collaboration
2000
Technology
Engagement
2010
Digital
2020
Exponential
Technology cycles
Technology eras are characterized by exponential growth and connectivity.
Mainframes
Distributed terminals
Core computing
Office computing
Mini-computers
Word processing
Spreadsheets
Home computing
Pc revolution
Network computing
Relational databases
Client-server
applications
Internet revolution
Browser wars
Customer
engagement
Intranet applications
Broadband
Mobile
Cloud computing
Big data – analytics
Social media
Wearables
Artificial intelligence
Sensing
Home automation
Digital cars
Digital money
Quantum computing
3d printing /
manufacturing
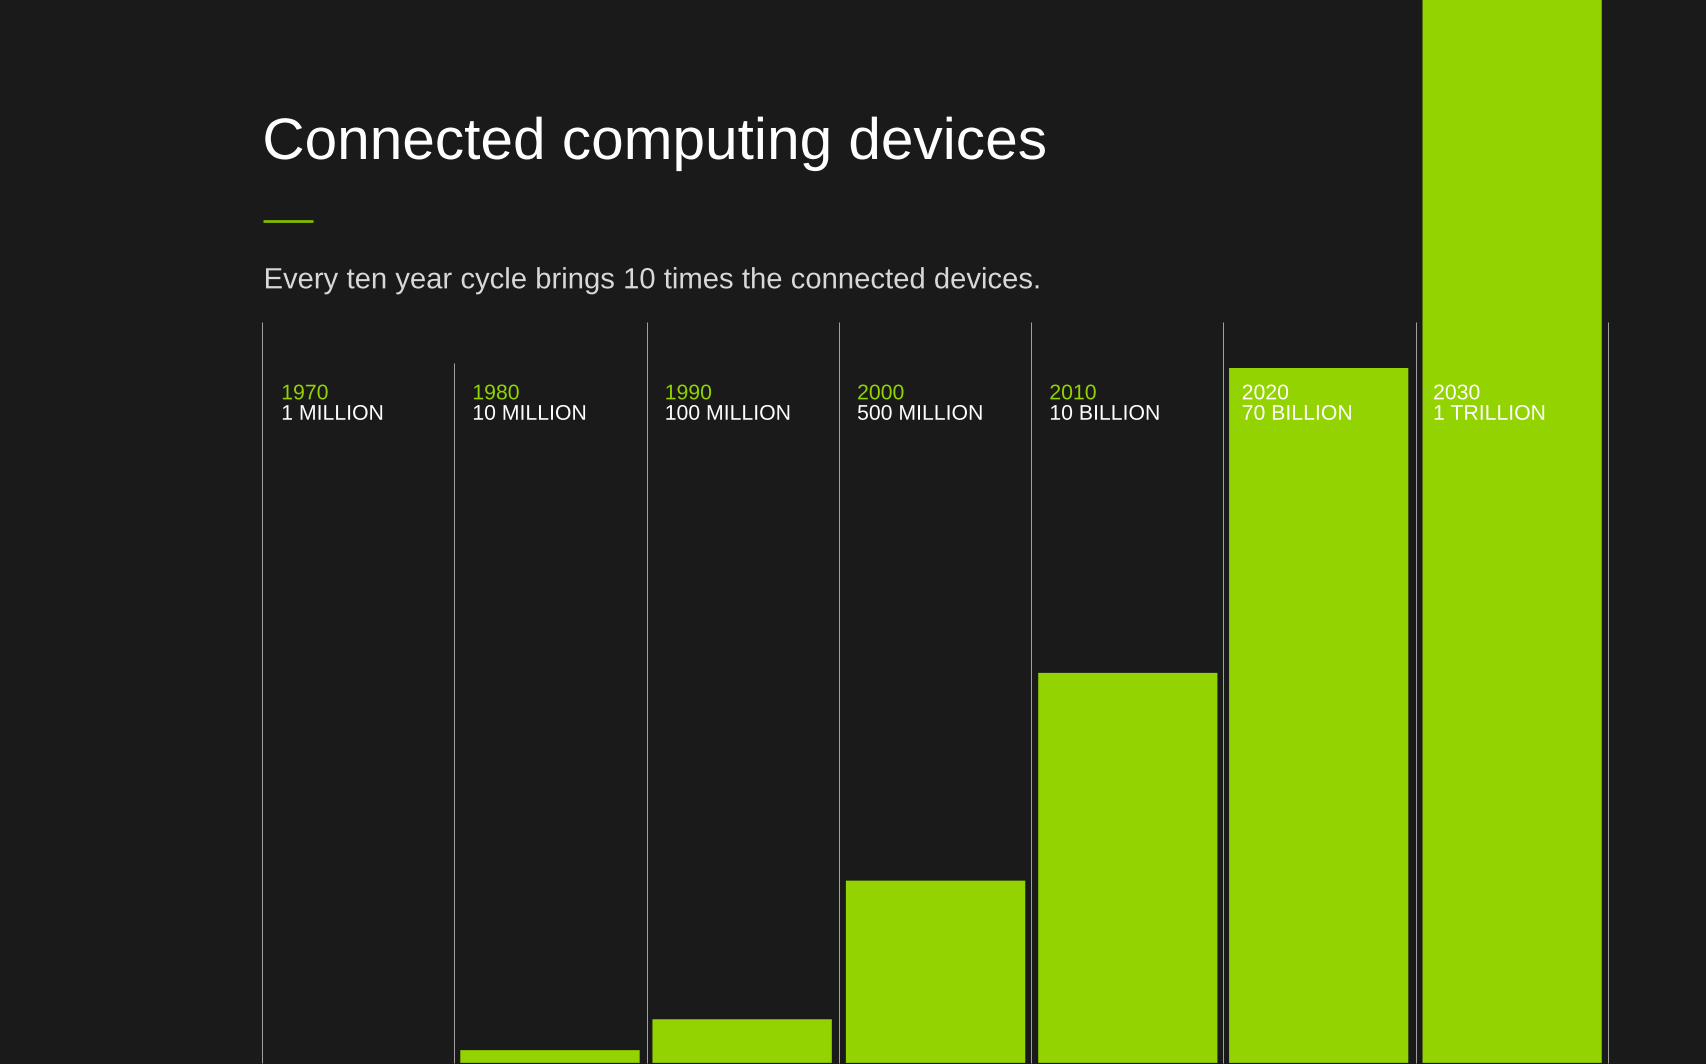
Connected computing devices
Every ten year cycle brings 10 times the connected devices.
19701 MILLION
198010 MILLION
1990100 MILLION
2000500 MILLION
201010 BILLION
202070 BILLION
20301 TRILLION
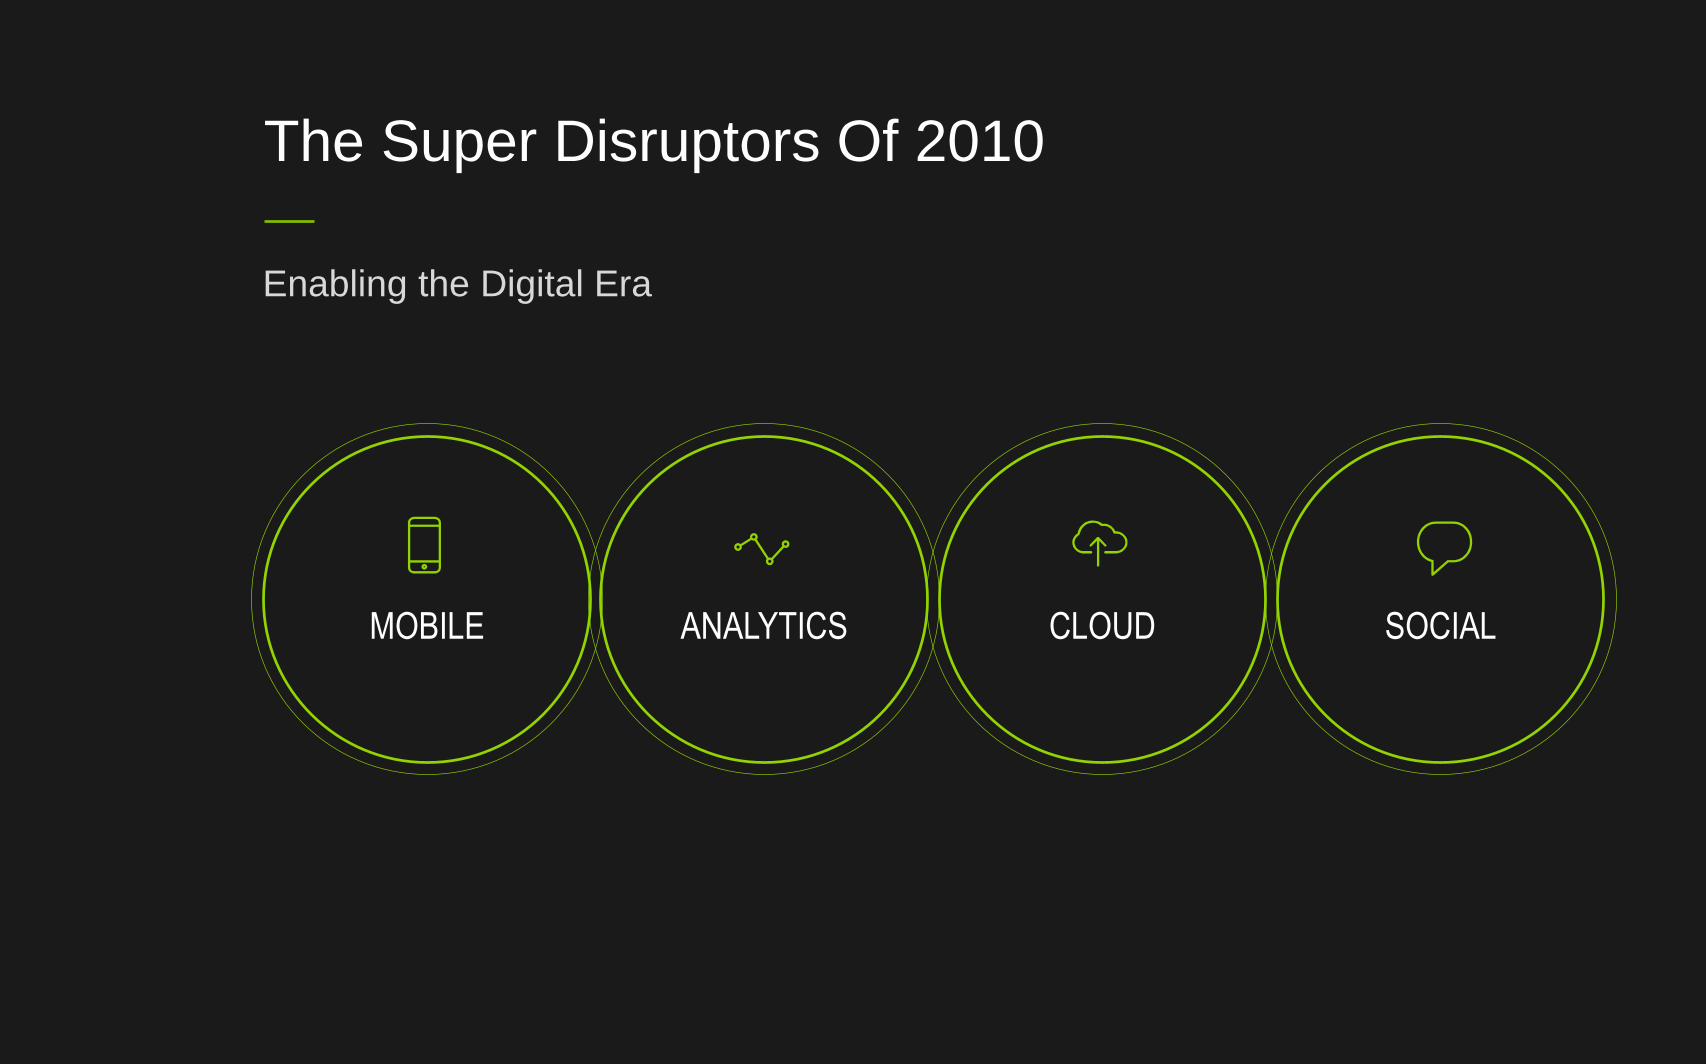
The Super Disruptors Of 2010
Enabling the Digital Era
MOBILE ANALYTICS CLOUD SOCIAL

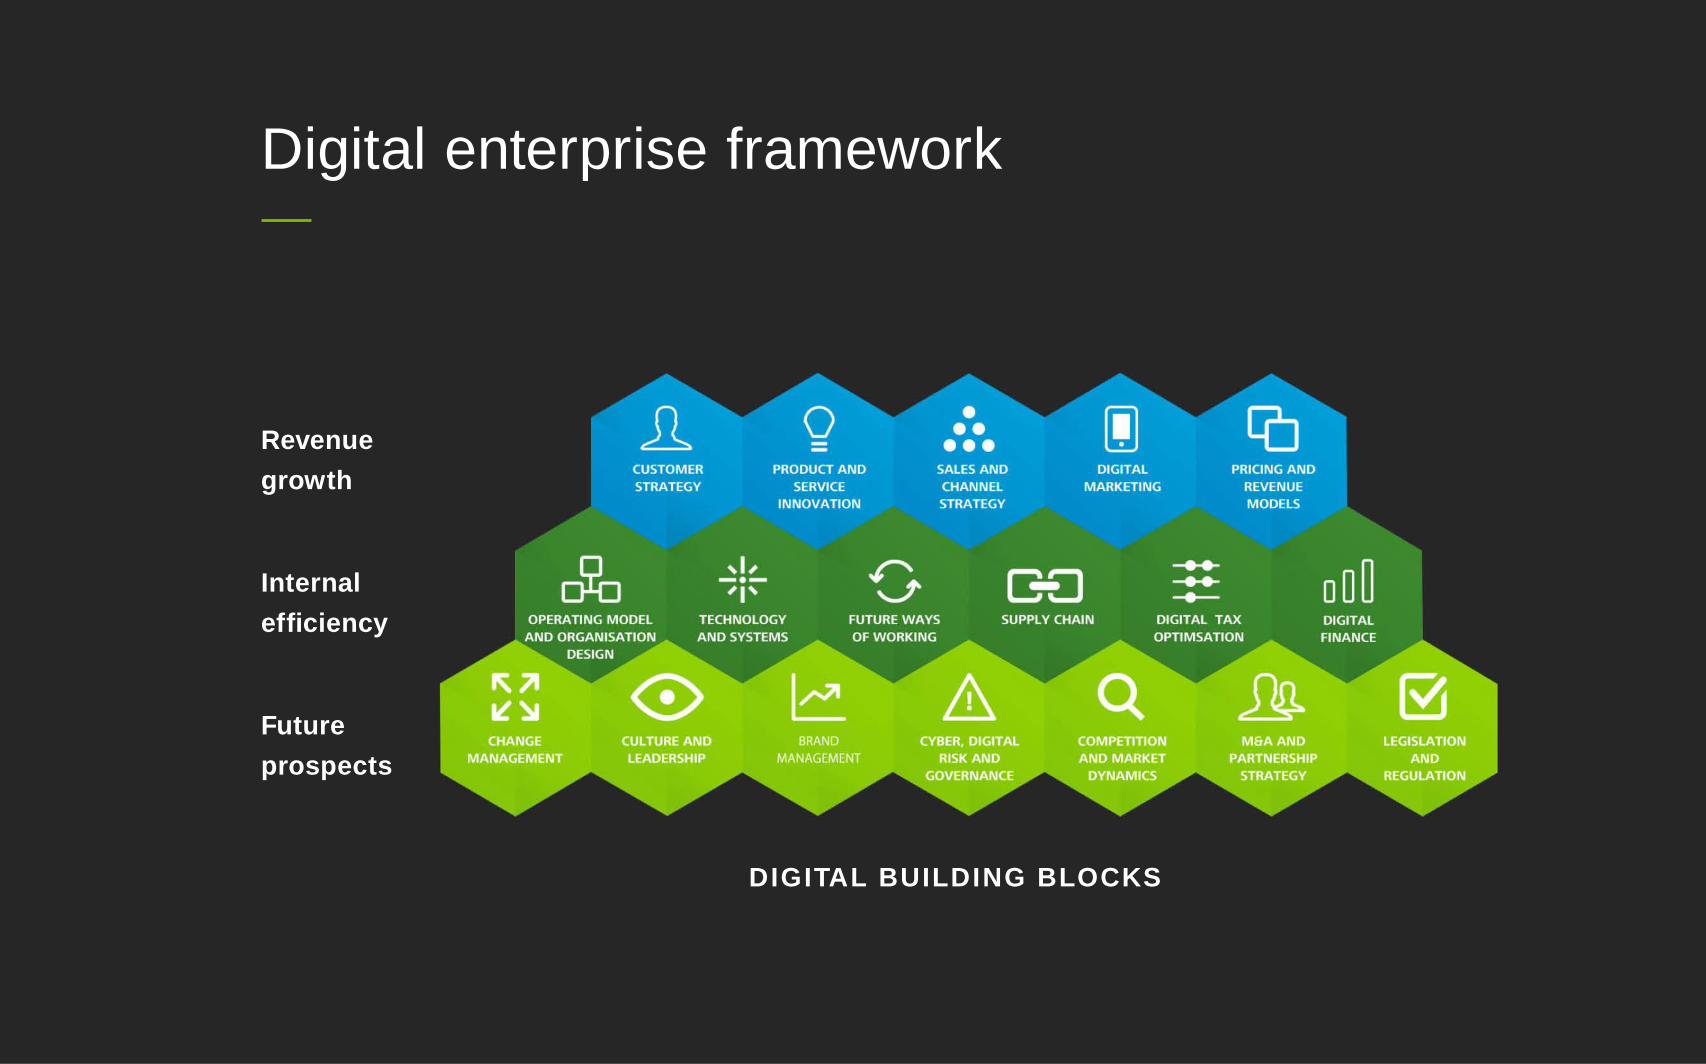
Digital enterprise framework
Revenue
growth
Internal
efficiency
Future
prospects
DIGITAL BUILDING BLOCKS

FUNDING DEVELOP MARKETINGLOGISTICSDESIGN
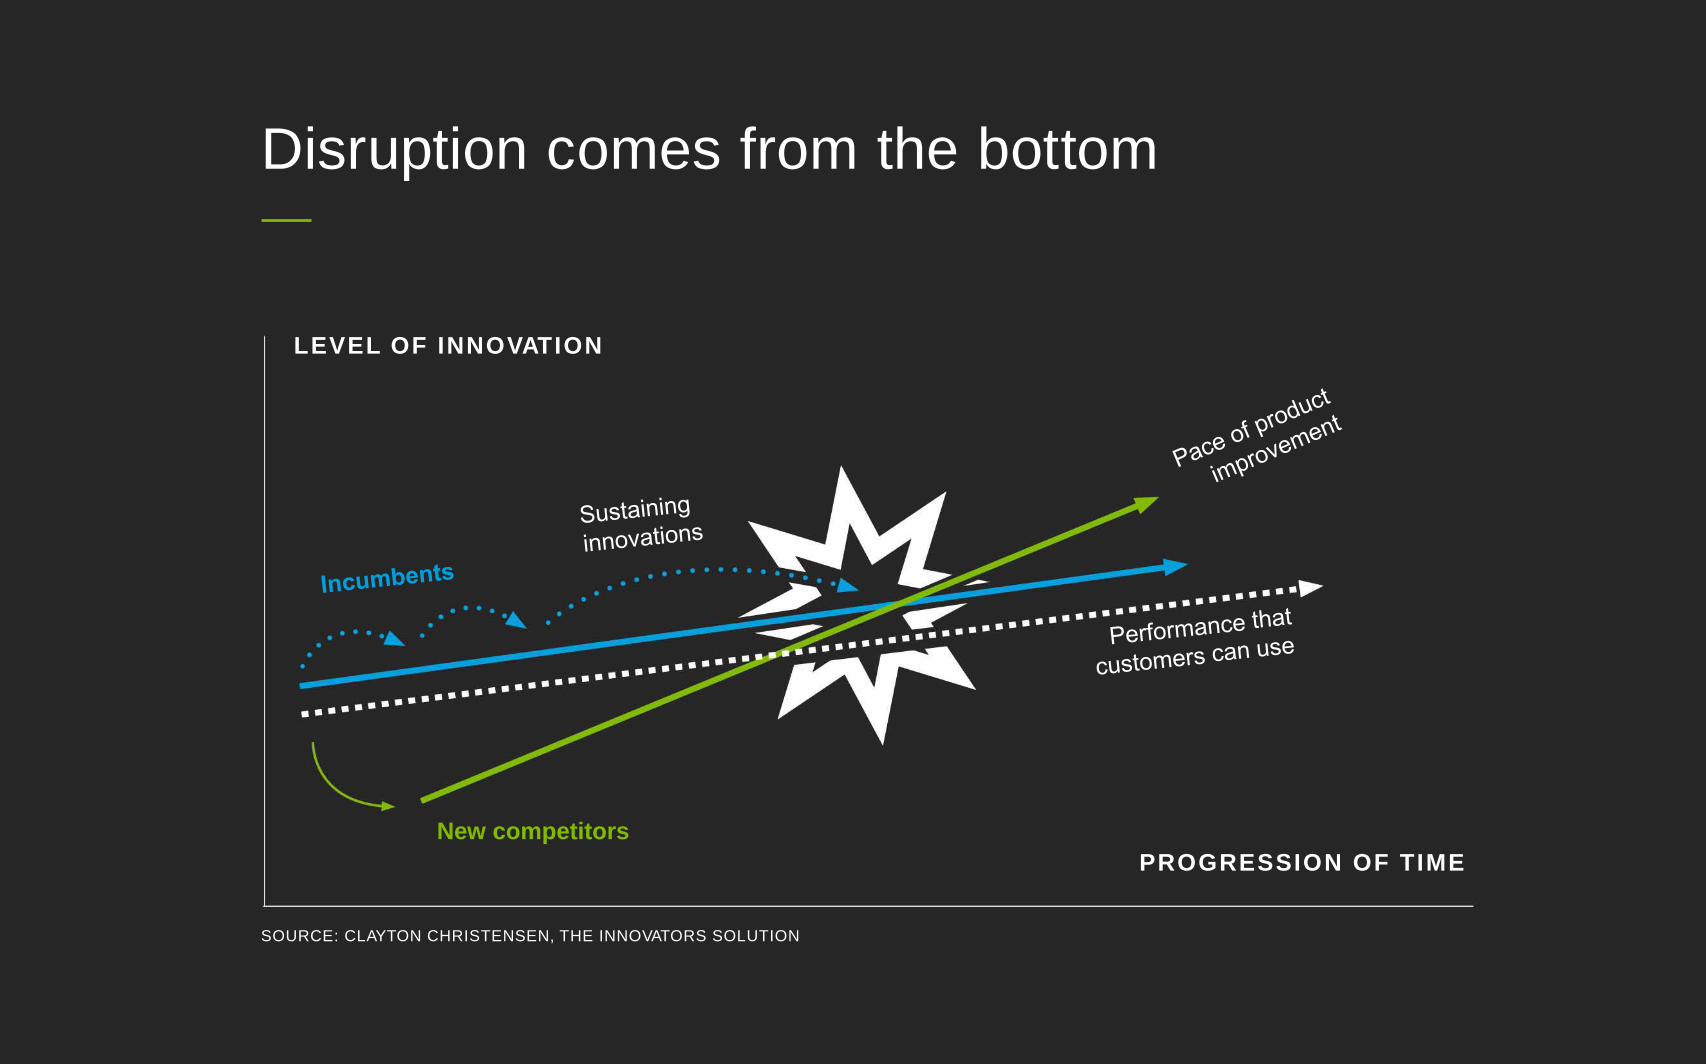
LEVEL OF INNOVATION
New competitors
PROGRESSION OF TIME
SOURCE: CLAYTON CHRISTENSEN, THE INNOVATORS SOLUTION
Disruption comes from the bottom
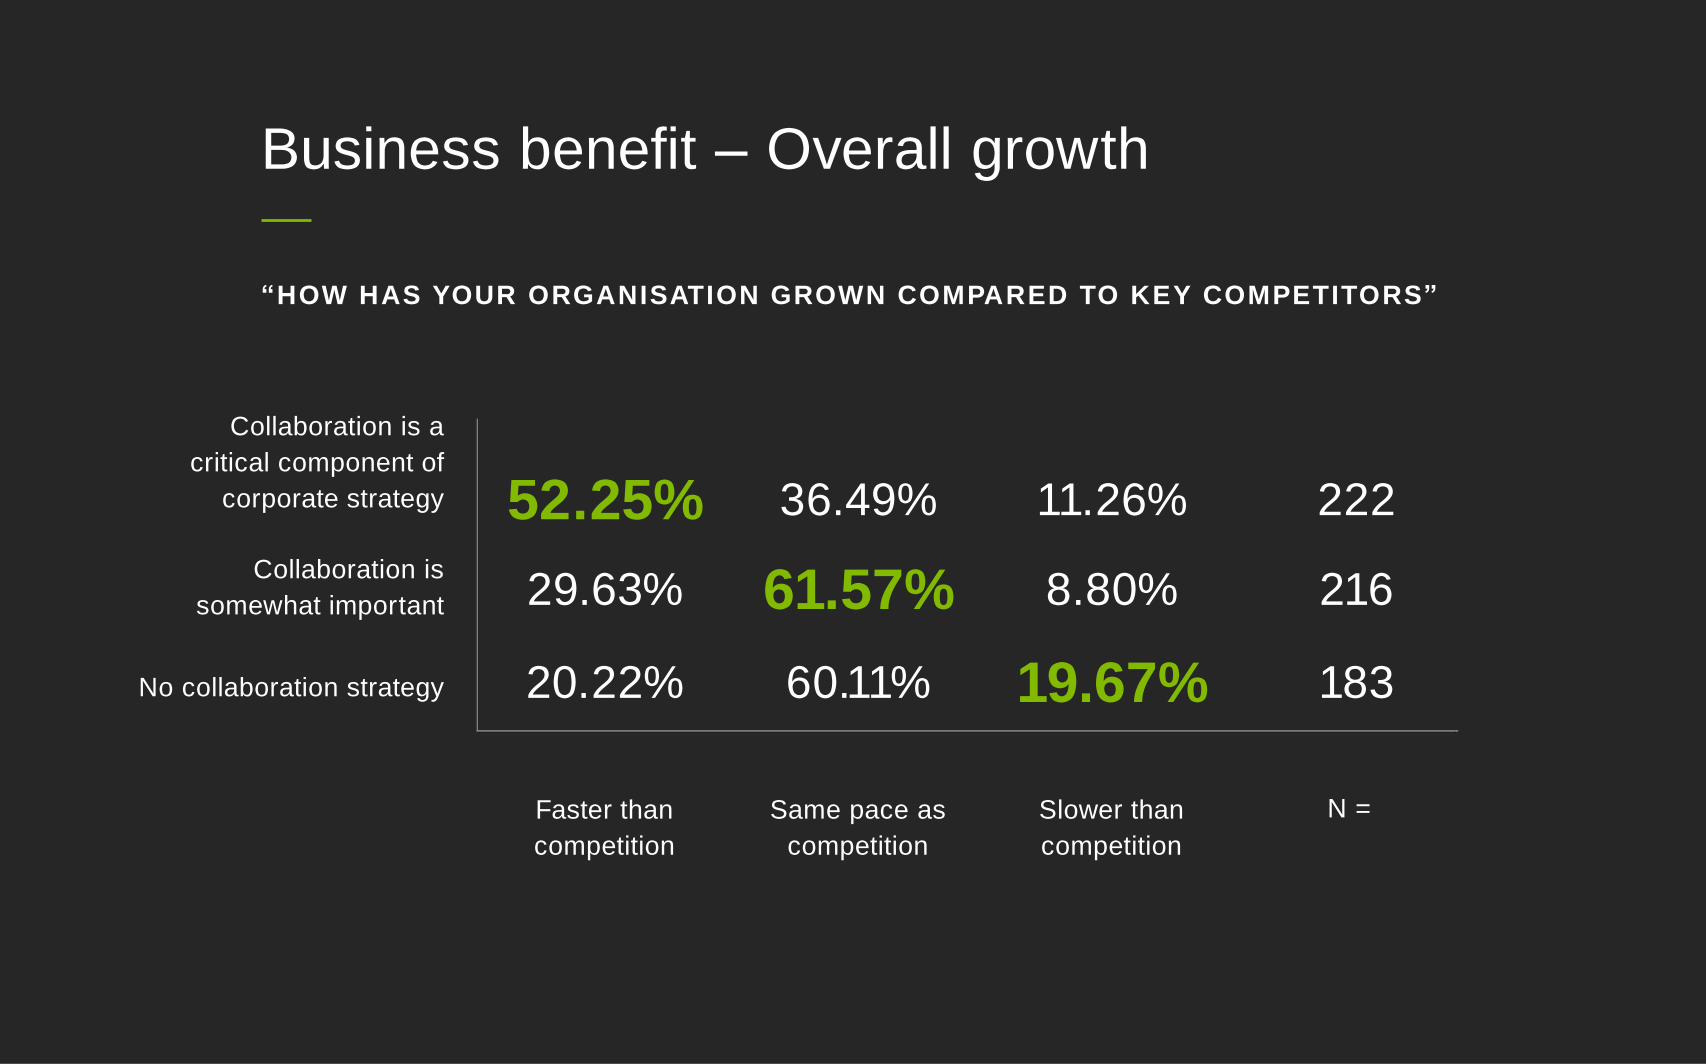
Collaboration is a
critical component of
corporate strategy
Collaboration is
somewhat important
No collaboration strategy
Faster than
competition
Same pace as
competition
52.25% 36.49% 11.26% 222
29.63% 61.57% 8.80% 216
20.22% 60.11% 19.67% 183
Slower than
competition
N =
“HOW HAS YOUR ORGANISATION GROWN COMPARED TO KEY COMPETITORS”
Business benefit – Overall growth

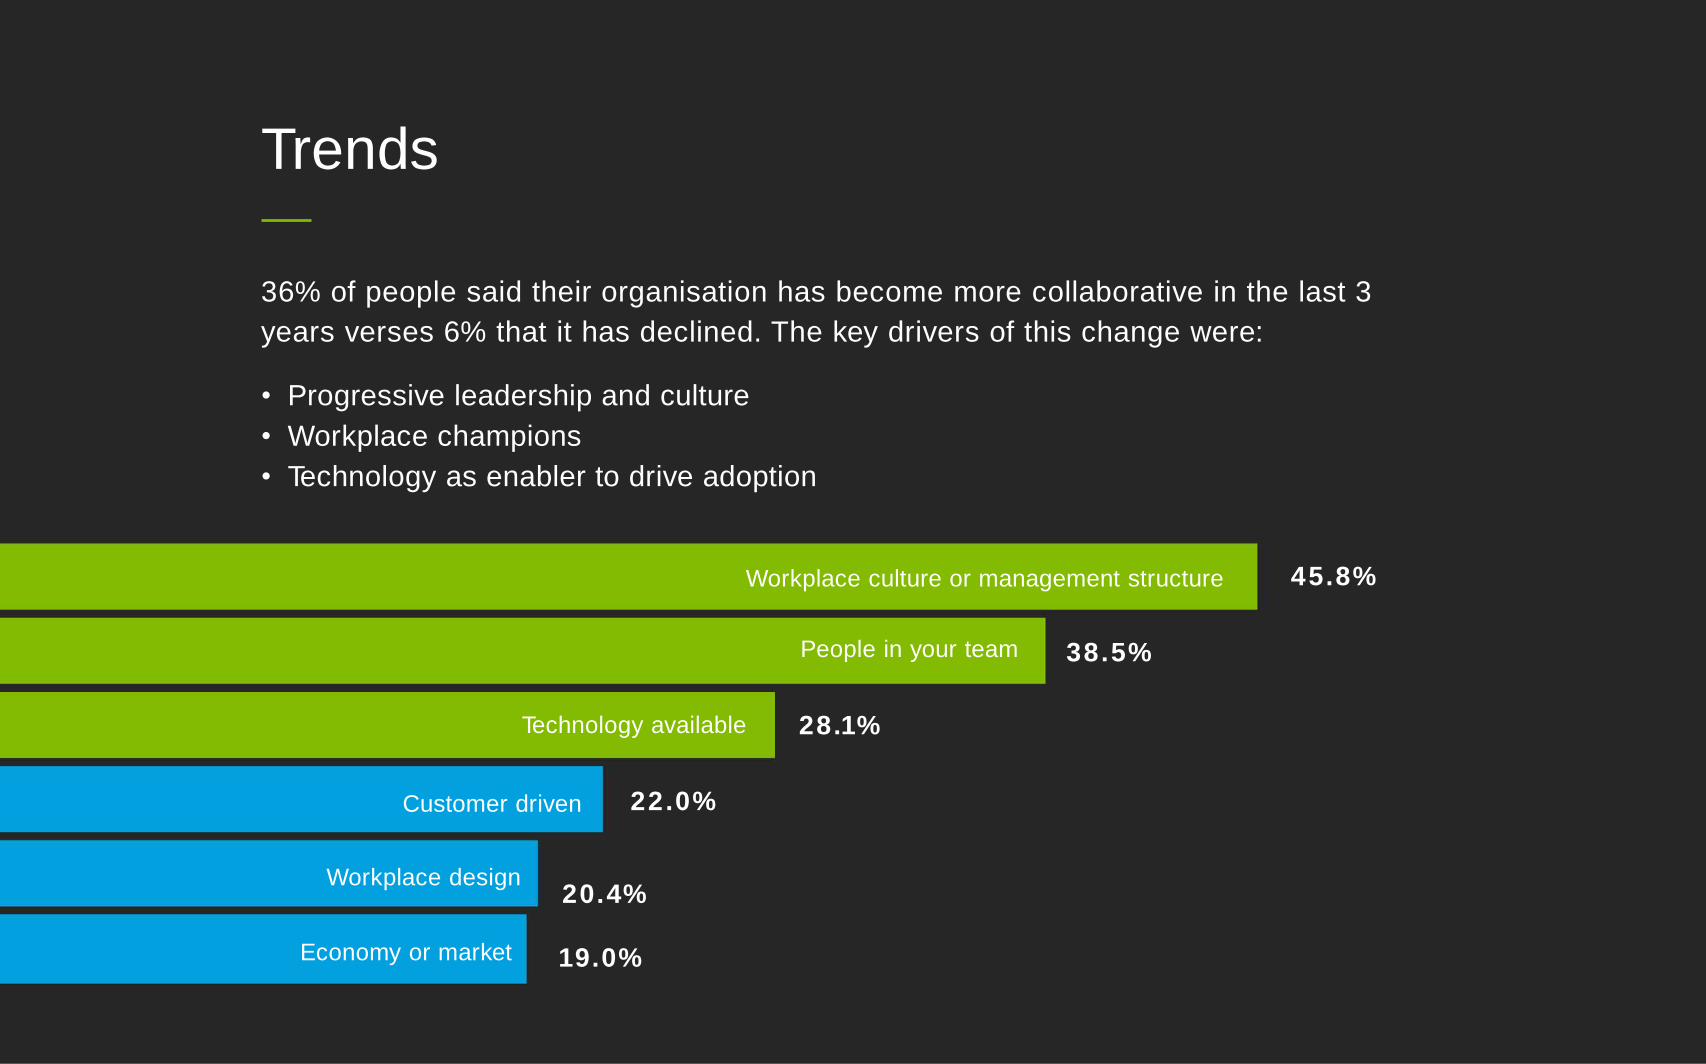
36% of people said their organisation has become more collaborative in the last 3
years verses 6% that it has declined. The key drivers of this change were:
• Progressive leadership and culture
• Workplace champions
• Technology as enabler to drive adoption
45.8%Workplace culture or management structure
People in your team
Technology available
Customer driven
Workplace design
Economy or market
38.5%
28.1%
22.0%
20.4%
19.0%
Trends
No Change
20 40 60%0
Changed my way of thinking
32%
32% 23% 4%
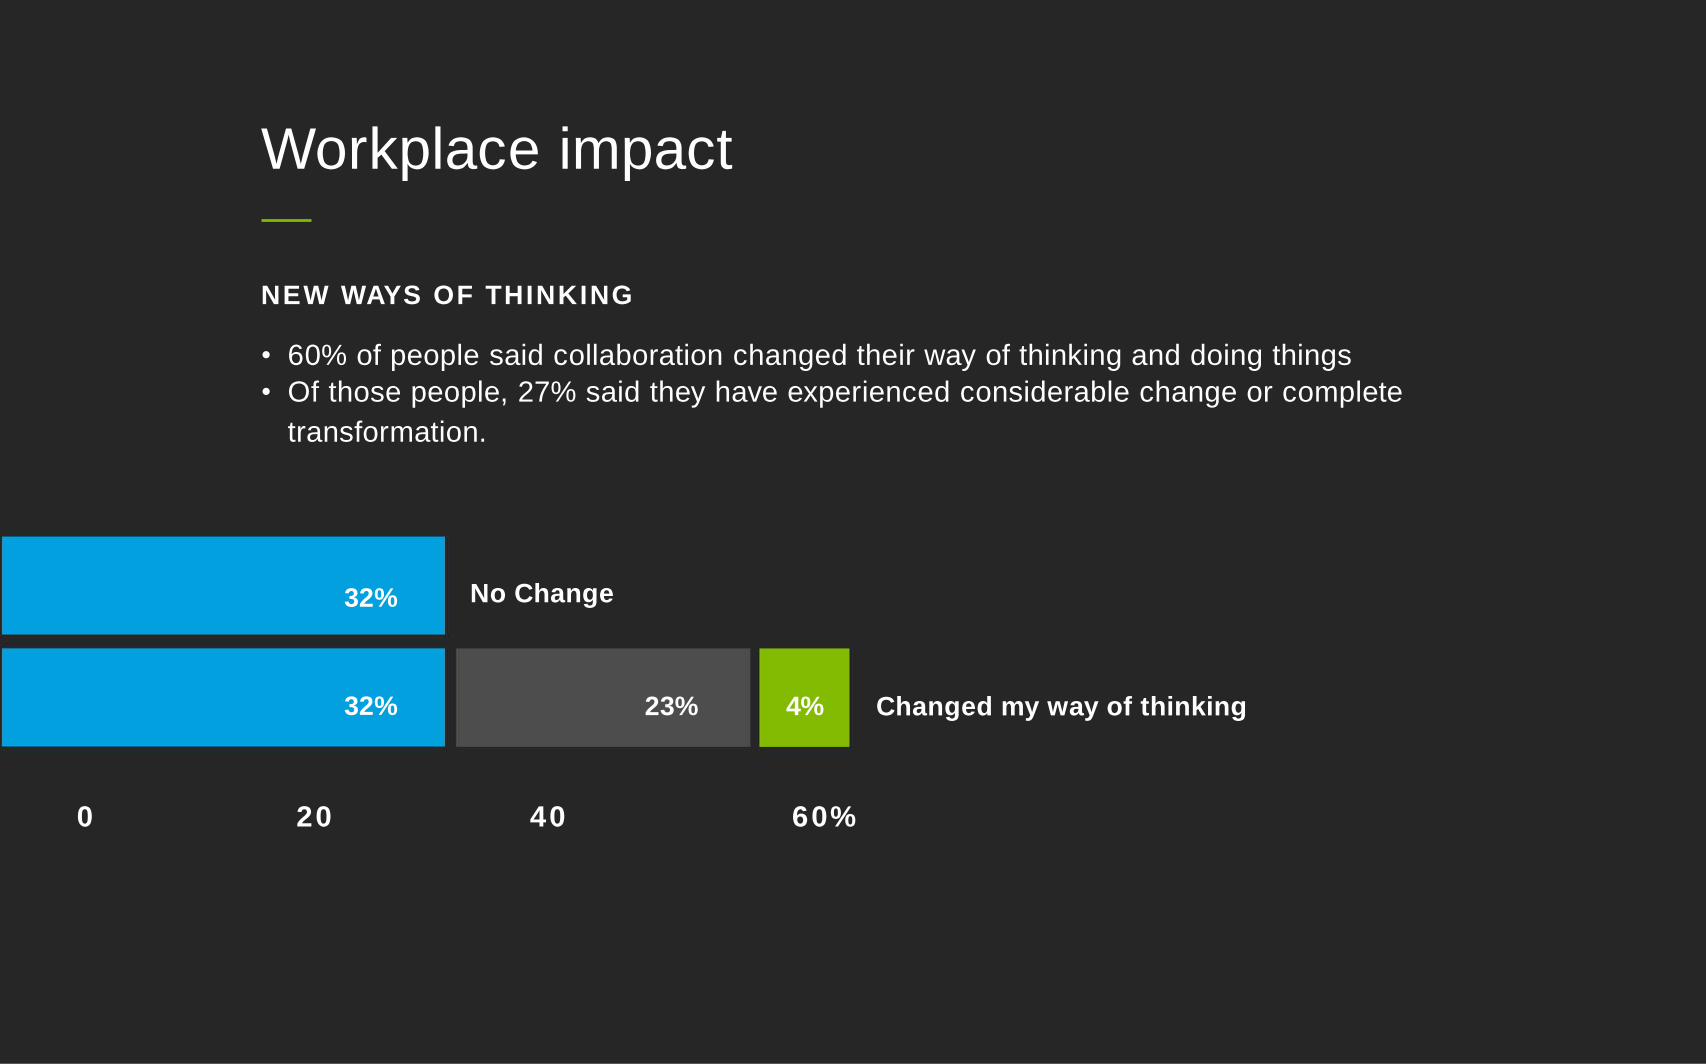
NEW WAYS OF THINKING
• 60% of people said collaboration changed their way of thinking and doing things
• Of those people, 27% said they have experienced considerable change or complete
transformation.
Workplace impact
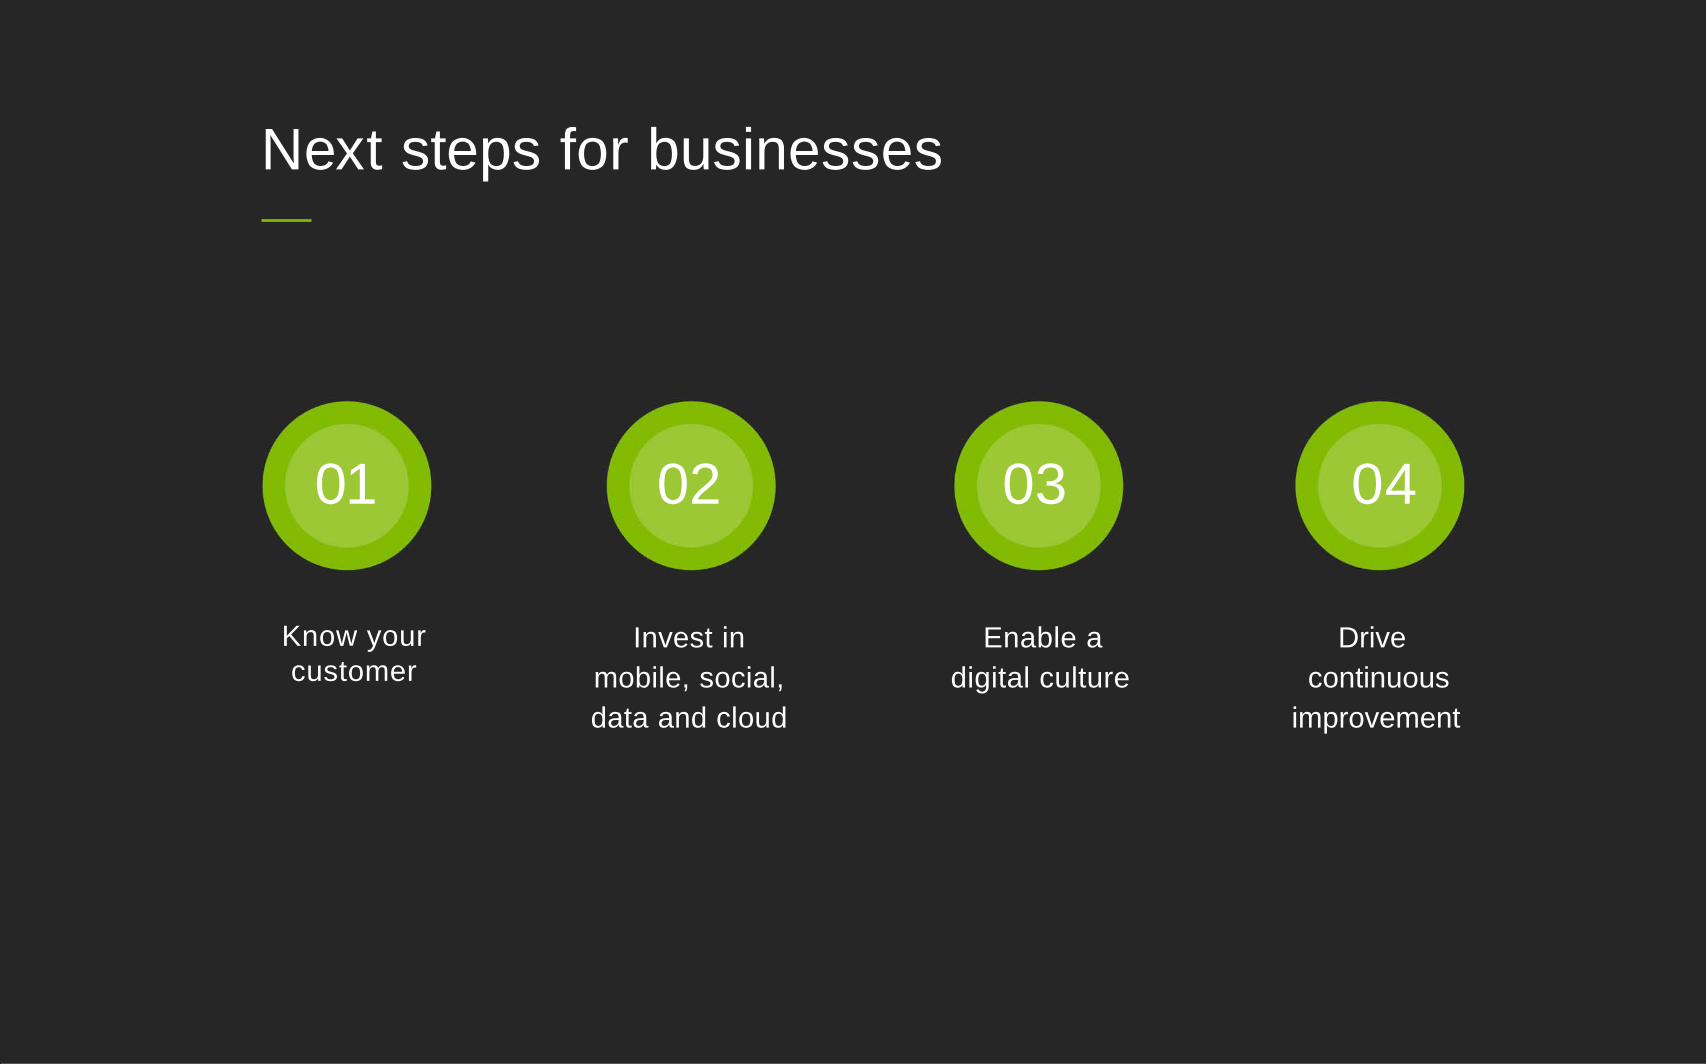
Know your
customer
01
Invest in
mobile, social,
data and cloud
02
Enable a
digital culture
03
Drive
continuous
improvement
04
Next steps for businesses

Recommended