NANOWIRE AND FIBER COMPOSITE ELECTROMECHANICAL SENSOR
by
Qian Chen
B.S., Tsinghua University, P. R. China, 2004
M.S., Tsinghua University, P. R. China, 2007
Submitted to the Graduate Faculty of
Swanson School of Engineering in partial fulfillment
of the requirements for the degree of
Doctor of Philosophy
University of Pittsburgh
2012
ii
UNIVERSITY OF PITTSBURGH
SWANSON SCHOOL OF ENGINEERING
This dissertation was presented
by
Qian Chen
It was defended on
March 16, 2012
and approved by
William S. Slaughter, PhD, Associate Professor, Department of Mechanical Engineering and
Materials Science
Patrick Smolinski, PhD, Associate Professor, Department of Mechanical Engineering and
Materials Science
Albert To, PhD, Assistant Professor, Department of Mechanical Engineering and Materials
Science
Zhi-Hong Mao, PhD, Associate Professor, Department of Electrical and Computer
Engineering and Department of Bioengineering
Dissertation Director: Qing-Ming Wang, PhD, Professor, Department of Mechanical
Engineering and Materials Science
iii
Copyright © by Qian Chen
2012
iv
Fiber or nanowire composites offer many benefits for piezoelectric sensor and actuator
applications. Piezoelectric composite is comprised of piezoelectric ceramics lain in polymer
matrix. The composite with the piezoelectric ceramics connected in one direction and the
polymer in three directions is named as 1-3 composite. 1-3 composites are most ordinary used
and the anisotropic alignment of PZT in the composite may substantially lower lateral
piezoelectric coupling and increases the sensitivity of the transducer mechanically. Piezoelectric
fiber composites are suitable for sensor applications, medical diagnostics and nondestructive
testing.
Single crystal zinc-oxide nanowires were synthesized through a simple hydrothermal
route and subsequently mixed with polyimide matrix to form ZnO nanocomposites.
Superimposed a.c. and d.c. electric fields were applied to microscopically tailor the alignment of
ZnO nanowires in polyimide matrix to form anisotropic nanocomposites. Piezoresistive property
of ZnO nanocomposite was investigated for strain sensor application. A large gauge factor was
obtained from the monotonic uniaxial stress-strain experiment for this nanocomposite and it is
much higher than that of ordinary metal strain sensor. A low frequency fiber composite vibration
sensor was fabricated and experimentally studied. The global parameters of the composite were
substituted into lumped and distributed element constituent equations for piezoelectric unimorph
to theoretically predict the sensitivity and effective frequency response range of the vibration
NANOWIRE AND FIBER COMPOSITE ELECTROMECHANICAL SENSOR
Qian Chen, PhD
University of Pittsburgh, 2012
v
sensor. An experiment was carried out to validate the result from the theoretical model. The
output voltage per unit input displacement keeps stable in a wide frequency range with a suitable
damping ratio. This PZT fiber composite sensor was also applied for soft material strain
measurement and soft biomaterial surface morphology and elastic modulus characterization.
From the theoretical evaluation and experiment result, this strain sensor is suitable for strain
measurement with high sensitivity and high softness. A rectangular breathing sensor and an
annular breathing sensor were fabricated for breathing rate and depth monitoring. Both sensors
were tested under different physiological conditions and measurement results could be utilized
for precaution and monitoring of breathing diseases. Both of them are excellent for monitoring
breathing rate and depth and be nice choices for daily use and diagnose purpose.

vi
TABLE OF CONTENTS
TABLE OF CONTENTS ........................................................................................................... VI
LIST OF TABLES ...................................................................................................................... IX
LIST OF FIGURES ..................................................................................................................... X
ACKNOWLEDGEMENTS ...................................................................................................... XV
1.0 INTRODUCTION ........................................................................................................ 1
1.1 PIEZOELECTRICITY, ELECTROSTRICTION AND THEIR
DIFFERENCES .................................................................................................................... 1
1.2 PIEZOELECTRIC CONSTITUTIVE EQUATIONS, MATERIALS AND
CONFIGURATIONS ........................................................................................................... 3
1.3 PIEZOELECTRIC FIBER COMPOSITE ....................................................... 9
1.3.1 Modeling ............................................................................................................ 9
1.3.2 Fabrication ...................................................................................................... 17
1.3.3 Electromechanical and dielectric properties ................................................ 23
1.3.4 Application ...................................................................................................... 24
1.4 PIEZORESISTIVE MATERIALS AND SENSORS ..................................... 25
1.4.1 Piezoresistive materials .................................................................................. 25
1.4.2 Piezoresistive sensors ...................................................................................... 26
2.0 RESEARCH OBJECTIVE ....................................................................................... 28
3.0 MULTIFUNCTIONAL ZNO NANOWIRES-POLYMER NANOCOMPOSITE
AND ITS APPLICATION ......................................................................................................... 29
vii
3.1 INTRODUCTION ............................................................................................. 29
3.2 FABRICATION AND ELECTRIC PROPERTIES OF ANISOTROPIC
ZNO NANOWIRES-POLYIMIDE NANOCOMPOSITE ............................................. 31
3.2.1 Fabrication and characterization .................................................................. 31
3.2.2 Hysteresis phenomena .................................................................................... 36
3.2.3 Electric properties .......................................................................................... 37
3.3 ZNO NANOWIRES-POLYIMIDE NANOCOMPOSITE
PIEZORESISTIVE STRAIN SENSOR ........................................................................... 42
3.3.1 Strain measurement methods ........................................................................ 42
3.3.2 The gauge factor of the strain sensor ............................................................ 44
3.3.3 Experimental study ......................................................................................... 47
3.3.4 Results and discussion .................................................................................... 51
3.4 CONCLUSION .................................................................................................. 53
4.0 PZT FIBER COMPOSITE SENSOR FOR VIBRATION AND STRAIN
SENSING ..................................................................................................................................... 55
4.1 LOW FREQUENCY VIBRATION SENSOR ................................................ 55
4.1.1 Introduction .................................................................................................... 55
4.1.2 Constitutive relations of in-plane PZT-fiber composite .............................. 58
4.1.3 Lumped parameter electromechanical model for piezoelectric unimorph 64
4.1.4 Distributed parameter electromechanical model for piezoelectric
unimorph ..................................................................................................................... 70
4.1.5 Experiment ...................................................................................................... 72
4.2 STRAIN SENSOR FOR SOFT MATERIAL STRAIN MEASUREMENT 75
4.2.1 Introduction .................................................................................................... 75
4.2.2 Lumped parameter transfer function ........................................................... 79

viii
4.2.3 Experiment ...................................................................................................... 88
4.3 CONCLUSION .................................................................................................. 92
5.0 PZT FIBER COMPOSITE SENSOR FOR MEDICAL APPLICATION ........... 94
5.1 INTRODUCTION ............................................................................................. 94
5.2 RECTANGULAR PZT FIBER COMPOSITE BREATHING SENSOR .... 97
5.2.1 Theoretical derivation .................................................................................... 97
5.2.2 Experiment .................................................................................................... 109
5.2.3 Discussion ...................................................................................................... 112
5.3 ANNULAR PZT FIBER COMPOSITE BREATHING SENSOR ............. 113
5.3.1 Theoretical derivation .................................................................................. 113
5.3.2 Experiment .................................................................................................... 123
5.3.3 Discussion ...................................................................................................... 125
5.4 CONCLUSION ................................................................................................ 128
6.0 CONCLUSIONS AND FUTURE WORK ............................................................. 130
6.1 MAJOR ACCOMPLISHMENTS .................................................................. 130
6.2 FUTURE WORK ............................................................................................. 133
BIBLIOGRAPHY ..................................................................................................................... 136

ix
LIST OF TABLES
Table 1.1. Comparison of 1-3 Composite and PZT-5H ................................................................ 11
Table 1.2. Properties of piezoceramics fibers [28] ....................................................................... 22
Table 1.3. Properties of PZT fibers deduced by extrapolation of measured data [28] ................. 23
Table 4.1. Composite component and global material properties ................................................ 63
Table 4.2. Geometric properties of PZT fiber, MFCs and sheet metal substrates ........................ 64
Table 4.3. MFCs and sheet metal substrates material properties .................................................. 64
Table 4.4. Geometric properties of bimorph, MFCs and substrates ............................................. 83
Table 4.5. Material properties of bimorph, MFCs and substrates ................................................ 84
Table 5.1. Composite component and global material properties .............................................. 103
Table 5.2. Geometric properties of PZT fiber, MFCs and sheet metal substrate ....................... 103
Table 5.3. MFCs and sheet metal substrate material properties ................................................. 103
Table 5.4. Geometric properties of PZT fiber, polyimide substrate and annular IDT electrode 115
Table 5.5. Single PZT fiber, polyimide and composite material properties ............................... 115
x
LIST OF FIGURES
Figure 1.1. Strain vs. electric field for piezoelectric and electrostrictive materials [3] .................. 2
Figure 1.2. Electrostrictive material with maintained static bias field E0 and static strain S0 and
the alternating field E1 follows a minor hysteresis loop and causes an alternating strain S1 [3] .... 3
Figure 1.3. Polarization and strain vs. electric field showing remnant polarization, P0 (a), and
remnant strain, S0 (b), when the field is removed. Application of the alternating field E1 then
causes alternating strain S1 about the remnant strain S0. [3] ........................................................... 4
Figure 1.4. The 33 mode piezoelectric longitudinal vibrator with working strain parallel to poling
direction and electrodes on the ends of the plate ............................................................................ 7
Figure 1.5. The 31 mode piezoelectric longitudinal vibrator with working strain perpendicular to
poling direction and electrodes on the sides of the plate ................................................................ 8
Figure 1.6. Three piezocomposite configurations in current use for transducers [3] ..................... 9
Figure 1.7. Model for 1-3 composite [3]....................................................................................... 10
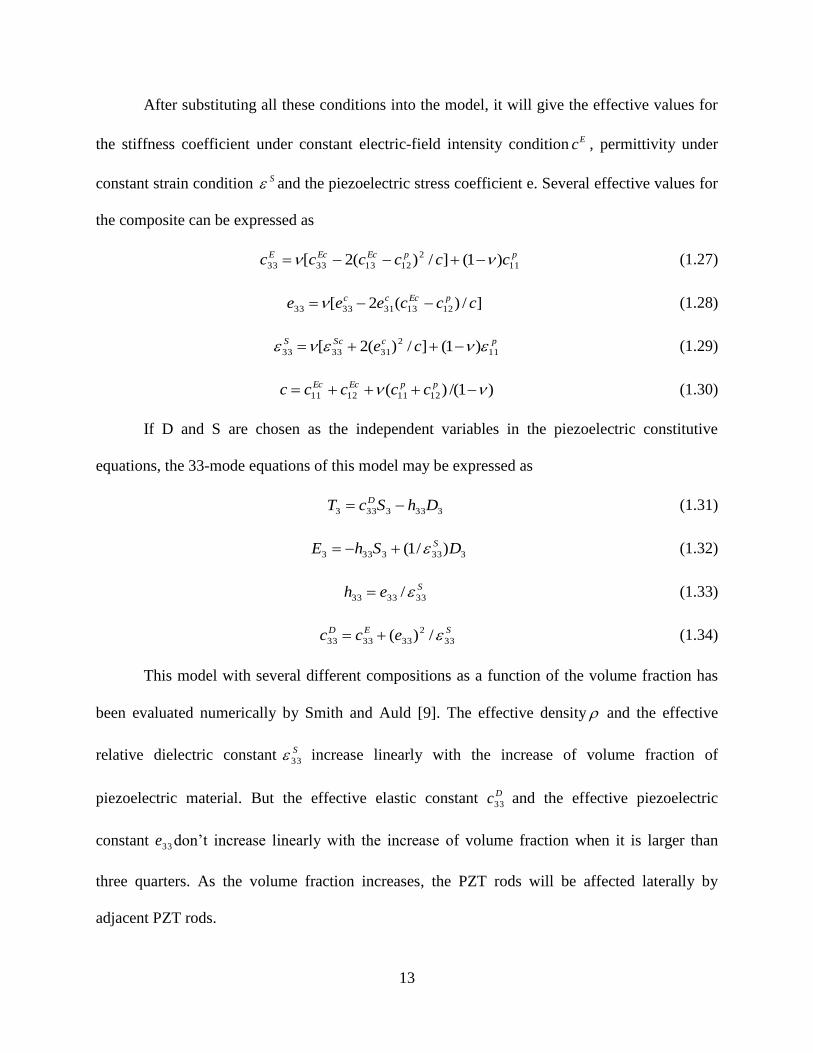
Figure 1.8. 1-3 composite model for sensor [3] ............................................................................ 14
Figure 1.9. Simplified low frequency piezoelectric sensor equivalent circuit [3] ........................ 17
Figure 1.10. Process chart of 1-3 fiber composite fabrication using sol-gel-derived PZT fibers
[28] ................................................................................................................................................ 19
Figure 1.11. Slip casting process using reusable soft plastic molds to manufacture 1-3 composites
[28] ................................................................................................................................................ 20
Figure 1.12. Process chart of 1-3 fiber composite fabrication using powder-derived PZT fibers
[28] ................................................................................................................................................ 21
Figure 1.13. Sintered PZT fibers ready for composite fabrication [28]........................................ 22
Figure 3.1. Top SEM images of ZnO nanowires on the substrate grown by hydrothermal method
....................................................................................................................................................... 31
xi
Figure 3.2. SEM images of broken ZnO nanowires growing for 3 days ...................................... 32
Figure 3.3. Schematic of ZnO nanowires alignment by superimposed a.c. and d.c. fields .......... 34
Figure 3.4. Optical images of ZnO nanowires before (isotropic) and after (anisotropic) alignment
....................................................................................................................................................... 34
Figure 3.5. SPM images of (a) pure polyimide and ZnO nanowires-polyimide nanocomposite
with (b) 10% (c) 20% weight ratios of ZnO nanowires ................................................................ 35
Figure 3.6. P-E loops for pure polyimide and nanocomposite with different weight ratios of ZnO
nanowires ...................................................................................................................................... 37
Figure 3.7. I-V curves for the nanocomposite with (a) low (b) high weight ratios of ZnO
nanowires ...................................................................................................................................... 38
Figure 3.8. Cole-Cole plot for the nanocomposites with different weight ratios of ZnO nanowires
....................................................................................................................................................... 39
Figure 3.9. The equivalent circuit for the ZnO nanowires-polyimide nanocomposite ................. 40
Figure 3.10. The nanocomposite conductivity and dielectric constant versus ZnO nanowires
weight ratios .................................................................................................................................. 41
Figure 3.11. One type of Wheatstone bridge circuit for resistance measurement ........................ 46
Figure 3.12. The stress/strain apparatus with the nanocomposite sample mounted on it ............. 48
Figure 3.13. Schematic of the strain sensor bonded on the cantilever beam ................................ 49
Figure 3.14. The block diagram for using the nanocomposite strain sensor for cantilever beam
strain measurement ....................................................................................................................... 49
Figure 3.15. The cantilever beam holder and micro-positioning meter for the static strain
measurement ................................................................................................................................. 50
Figure 3.16. The dynamic strain measurement experiment setup ................................................ 50
Figure 3.17. The resistance change versus strain curves for the nanocomposites with different
weight ratios of ZnO nanowires .................................................................................................... 52
Figure 3.18. The force versus strain curve for the nanocomposite with 15% weight ratio of ZnO
nanowires ...................................................................................................................................... 52
Figure 3.19. The gauge factors for the nanocomposites with different compositions under 4‰
strain .............................................................................................................................................. 52
xii
Figure 3.20. The gauge factors for the nanocomposites with different compositions under 4%
strain .............................................................................................................................................. 53
Figure 4.1. The schematic and photo of the MFCs sample .......................................................... 57
Figure 4.2. The ratios of the effective elastic stiffness coefficient in different directions over the
original elastic stiffness coefficient change with fibers’ volume fraction .................................... 62
Figure 4.3. The ratios of the effective piezoelectric coefficient in different directions over the
original piezoelectric coefficient change with fibers’ volume fraction ........................................ 62
Figure 4.4. The schematic of the MFCs unimorph vibration sensor ............................................ 65
Figure 4.5. A simple mass-spring-damper structure for the vibration sensor ............................... 66
Figure 4.6. The equivalent circuit of the PZT fiber composite ..................................................... 66
Figure 4.7. The frequency response of the magnitude X of the output voltage divided by the input
vibration amplitude with different damping ratios ....................................................................... 66
Figure 4.8. The voltage generation coefficient change with the thickness ratio B for different
substrate materials ......................................................................................................................... 69
Figure 4.9. The experiment setup with one MFCs glued on a sheet metal substrate and clamed to
a LDS shaker ................................................................................................................................. 74
Figure 4.10. The block diagram of the experiment measurement system .................................... 74
Figure 4.11. Experimental and calculation results of the frequency response of output voltage per
unit vibration amplitude for a MFCs unimorph ............................................................................ 74
Figure 4.12. The schematic and photo of the MFCs sample ........................................................ 78
Figure 4.13. The schematic of the test bench for high resolution soft material strain measurement
....................................................................................................................................................... 79
Figure 4.14. The schematic of the MFCs unimorph strain sensor ................................................ 81
Figure 4.15. A simple mass-spring-damper structure for the strain sensor .................................. 81
Figure 4.16. The equivalent circuit of the PZT fiber composite ................................................... 81
Figure 4.17. Voltage sensitivity of the strain sensor change with the thickness ratio B with
different substrate materials .......................................................................................................... 84
xiii
Figure 4.18. Charge sensitivity of the strain sensor change with the thickness ratio B with
different substrate materials .......................................................................................................... 84
Figure 4.19. Spring constant of the strain sensor change with the thickness ratio B with different
substrate materials ......................................................................................................................... 85
Figure 4.20. Voltage sensitivity relative ratio of the unimorph to the bimorph change with the
thickness ratio B with different substrate materials ...................................................................... 87
Figure 4.21. Spring constant relative ratio of the unimorph to the bimorph change with the
thickness ratio B with different substrate materials ...................................................................... 87
Figure 4.22. The experiment setup for the high resolution displacement measurement .............. 89
Figure 4.23. The block diagram of the measurement system for the strain and electrostrictive
coefficient of soft polymer material .............................................................................................. 90
Figure 4.24. The strain versus the square of electric field at the frequency 10Hz for the PDMS
sheet .............................................................................................................................................. 90
Figure 4.25. The electrostrictive coefficient of the PDMS thin film at different frequencies ...... 90
Figure 4.26. The displacement error caused by the force from the sensor tip .............................. 92
Figure 5.1. The MFCs sample....................................................................................................... 98
Figure 5.2. A photograph of the MFCs breathing sensor ............................................................. 98
Figure 5.3. Normalized effective elastic stiffness coefficients change with PZT fiber volume
fraction ........................................................................................................................................ 102
Figure 5.4. Normalized effective piezoelectric coefficients change with PZT fiber volume
fraction ........................................................................................................................................ 102
Figure 5.5. The equivalent circuit of the PZT fiber composite ................................................... 105
Figure 5.6. The schematic of the breathing sensor ..................................................................... 106
Figure 5.7. A simple mass-spring-damper structure for the breathing sensor ............................ 106
Figure 5.8. The frequency response of the magnitude X of the output voltage divided by the input
breathing pressure with different damping ratios ....................................................................... 106
Figure 5.9. The voltage generation coefficients versus the thickness ratio B for the breathing
sensors with different substrate materials ................................................................................... 109
xiv
Figure 5.10. The block diagram of the respiration measurement system ................................... 110
Figure 5.11. Normal breathing signals comparison for different persons .................................. 111
Figure 5.12. Normal and fast breathing signals comparison for the same person ...................... 111
Figure 5.13. A photograph of the annular PZT fiber composite ................................................. 114
Figure 5.14. A photograph of the annular PZT fiber composite breathing sensor ..................... 114
Figure 5.15. A photograph of the annular IDT electrode ........................................................... 115
Figure 5.16. A schematic configuration of the annular breathing sensor: (a) A lateral view with
uniform breathing pressure, (b) A lateral view with an equivalent concentrated force .............. 116
Figure 5.17. The sensitivity of the breathing sensor change with the inner radius to outer radius
ratio ............................................................................................................................................. 122
Figure 5.18. The sensitivity of the breathing sensor change with fibers’ volume fraction in the
composite .................................................................................................................................... 122
Figure 5.19. A block diagram of the respiration measurement system ...................................... 124
Figure 5.20. Normal breathing signals comparison for different persons .................................. 125
Figure 5.21. Normal and fast breathing signals comparison for the same person ...................... 125
Figure 5.22. A photograph of the mask for fixing the PZT fibers .............................................. 127
xv
ACKNOWLEDGEMENTS
Over the past three and a half years, I have learned a tremendous amount. I am grateful to
everyone whom I have learned something from. In particular I thank my supervisor, Professor
Qing-Ming Wang, for all of his support and guidance in this work. I am very thankful to Dr.
William S. Slaughter, Dr. Patrick Smolinski, Dr. Albert To and Dr. Zhi-Hong Mao for their
kindly consenting to be my committee members, helpful suggestions and useful discussions.
I thank my closest collaborators, Dr. Lifeng Qin, Dr. Hongbin Cheng, and Dr.
Chengliang Sun here in University of Pittsburgh for their help in my research work. Especially, I
would like to thank Dr. Lifeng Qin for his patient discussion and cooperation in every part of my
research work.
I thank my friends Chenzhi Wang, Jie Bao, Zijing Zeng, and Minmin Zhang who gave
me much help during my living in Pittsburgh.
I thank my families who have always been a great support for me. I thank Peiyuan Wang
for always supporting me, sharing happiness and pressure with me. I could not have progressed
without all of you.
1
1.0 INTRODUCTION
In this chapter, some basic concepts including piezoelectricity, electrostriction, piezoelectric
constitutive equations, piezoelectric configurations, piezoelectric materials, and piezoelectric
fiber composite will be introduced. Fabrication, electromechanical and dielectric properties, and
application of fiber composite will be focused and detailed. Piezoresistive materials and their
sensor applications will also be introduced.
1.1 PIEZOELECTRICITY, ELECTROSTRICTION AND THEIR DIFFERENCES
First, the distinction between electrostriction and piezoelectricity will be clarified and it will be
helpful to understand piezoelectricity. “It is this reversal of sign of strain with sign of field that
distinguishes piezoelectricity from electrostriction” is the difference stated by Cady [1].
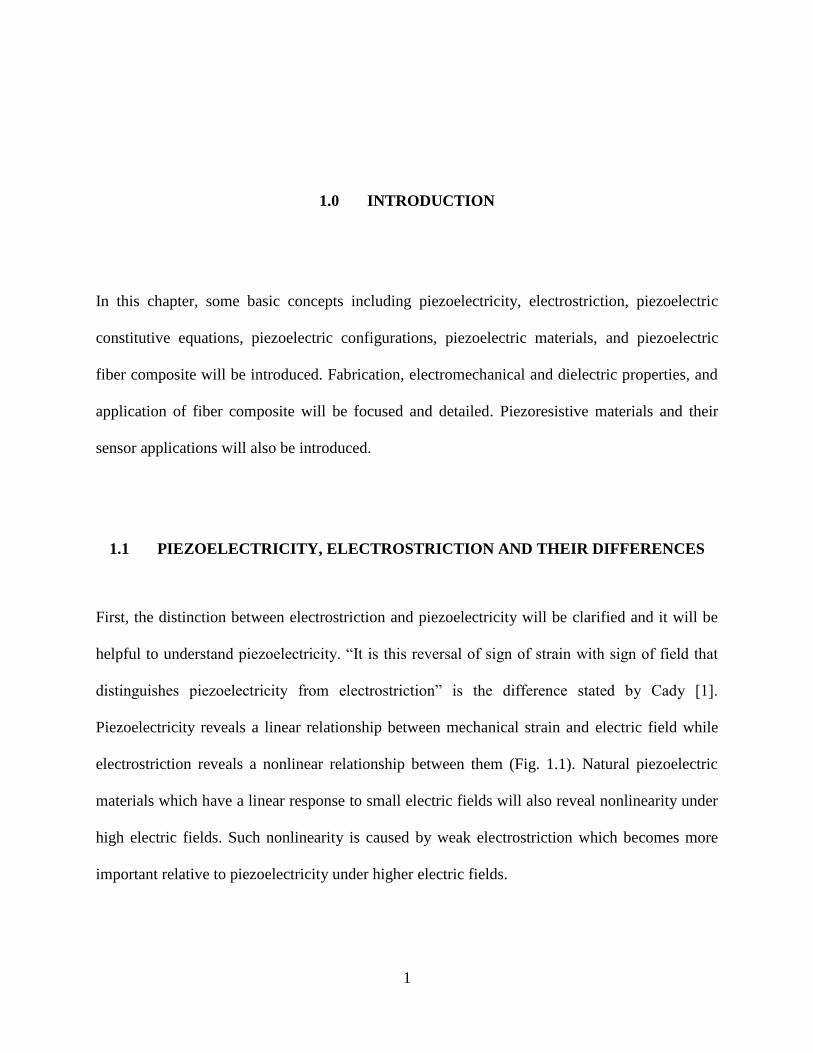
Piezoelectricity reveals a linear relationship between mechanical strain and electric field while
electrostriction reveals a nonlinear relationship between them (Fig. 1.1). Natural piezoelectric
materials which have a linear response to small electric fields will also reveal nonlinearity under
high electric fields. Such nonlinearity is caused by weak electrostriction which becomes more
important relative to piezoelectricity under higher electric fields.
2
Figure 1.1. Strain vs. electric field for piezoelectric and electrostrictive materials [3]
Curie brothers observed piezoelectric effect first. Mechanical stress caused generation of
electric charge is called the direct piezoelectric effect and the length change of materials in an
electric field is called the inverse piezoelectric effect. Piezoelectricity occurs in crystal structures
which don’t have central symmetry [2]. If an electric field is applied parallel to the length of a
bar of piezoelectric crystal, the bar will get longer with the electric field applied in one direction
and become shorter with the electric field applied in the opposite direction. A polycrystalline
piezoelectric material reveals no macroscopic piezoelectric effect because the piezoelectric
effects in randomly-oriented piezoelectric crystallites cancel. For piezoelectric single crystal, it
does have piezoelectric effect. Quartz was the first discovered piezoelectric material, followed by
others such as Rochelle salt, lithium sulfate and so on.
Electrostriction occurs in all dielectric materials. But only in ferroelectric materials which
contain domains, the electrostriction effect is big enough for practical use [3]. The electric field
can align the domains in these materials and will cause significant dimensional changes. If an
electric field is applied parallel to the length of a bar of electrostrictive material, it will get longer
regardless of the direction of the field. Thus the mechanical response is not proportional to the
electric field but relies on the square and higher even powers of the field. And if a mechanical
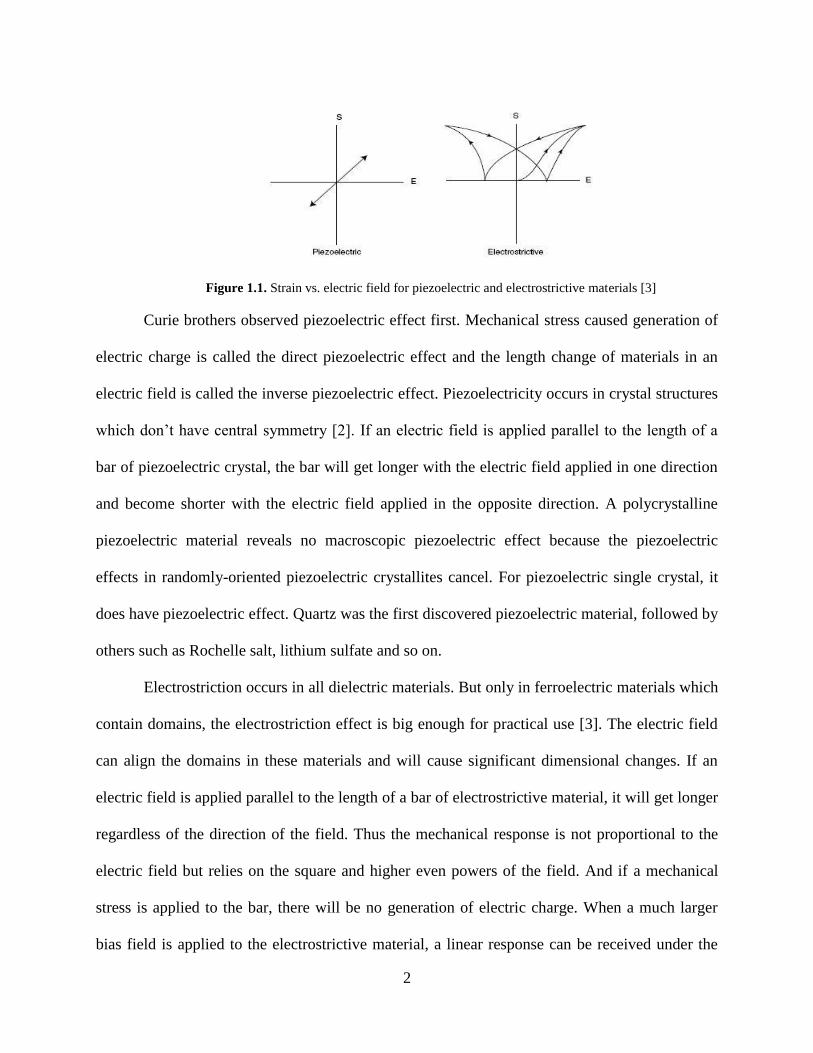
stress is applied to the bar, there will be no generation of electric charge. When a much larger
bias field is applied to the electrostrictive material, a linear response can be received under the
3
applied alternating drive field. The bias field creates a polar axis of symmetry and causes a stable
displacement along that axis. Then a superimposed alternating drive field causes an alternating
displacement around the stable displacement. The approximately linear, reciprocal mechanical
response generated from the alternating drive field can be seen in Fig. 1.2. The isotropic
polycrystalline electrostrictive material is converted to isotropic material in planes vertical to the
polar axis by the bias voltage. This biased electrostrictive material can be seen as a piezoelectric
material.
Figure 1.2. Electrostrictive material with maintained static bias field E0 and static strain S0 and the
alternating field E1 follows a minor hysteresis loop and causes an alternating strain S1 [3]
1.2 PIEZOELECTRIC CONSTITUTIVE EQUATIONS, MATERIALS AND
CONFIGURATIONS
Familiar piezoelectric materials include piezoelectric single crystals and piezoelectric textures.
Piezoelectric single crystals include quartz, tourmaline, gallium orthophosphate, crystals of the
Ca3Ga2Ge4O14 (CGG) group, Rochelle salt, lithium sulfate and several other piezoelectric single
crystals. Piezoelectric textures include piezoelectric ceramics and piezoelectric polymers, such as
PVDF and related copolymers. Piezoelectric ceramics include PZT family, lead metaniobate,
KNN family, bismuth titanate family, perovskite layer structure, AlN, ZnO piezoelectric thin
4
film and so on. Lead zirconate titanate (PZT) exhibits outstanding piezoelectric properties, and
has been widely used in industry, science, medicine and communications fields.
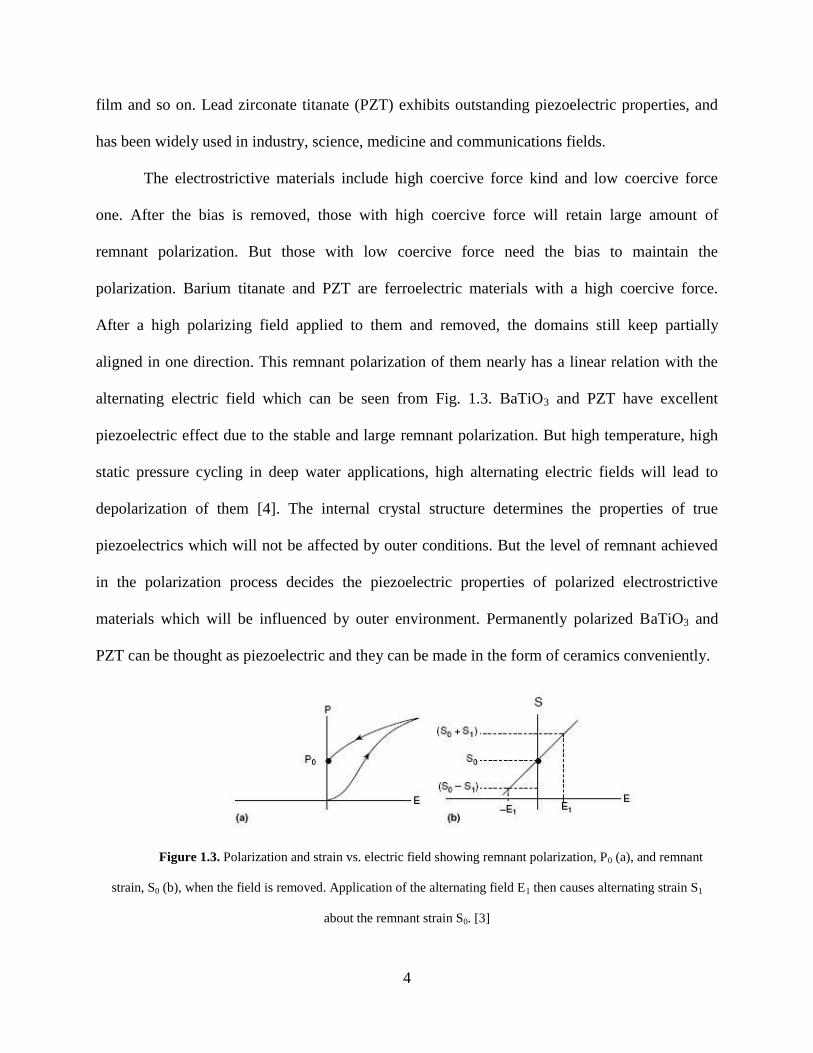
The electrostrictive materials include high coercive force kind and low coercive force
one. After the bias is removed, those with high coercive force will retain large amount of
remnant polarization. But those with low coercive force need the bias to maintain the
polarization. Barium titanate and PZT are ferroelectric materials with a high coercive force.
After a high polarizing field applied to them and removed, the domains still keep partially
aligned in one direction. This remnant polarization of them nearly has a linear relation with the
alternating electric field which can be seen from Fig. 1.3. BaTiO3 and PZT have excellent
piezoelectric effect due to the stable and large remnant polarization. But high temperature, high
static pressure cycling in deep water applications, high alternating electric fields will lead to
depolarization of them [4]. The internal crystal structure determines the properties of true
piezoelectrics which will not be affected by outer conditions. But the level of remnant achieved
in the polarization process decides the piezoelectric properties of polarized electrostrictive
materials which will be influenced by outer environment. Permanently polarized BaTiO3 and
PZT can be thought as piezoelectric and they can be made in the form of ceramics conveniently.
Figure 1.3. Polarization and strain vs. electric field showing remnant polarization, P0 (a), and remnant
strain, S0 (b), when the field is removed. Application of the alternating field E1 then causes alternating strain S1
about the remnant strain S0. [3]
5
Lead magnesium niobate (PMN), lead zirconium niobate (PZN) and mixtures with lead
titanate (PMN-PT) or (PZN-PT) are ferroelectric materials with strong electrostrictive properties
but low coercive force. The remnant polarization in them can be utilized for low field
applications. If a steady electric bias applied to them, they are suitable for high field applications
with a linear response.
The piezoelectric constitutive equations in this discussion are restricted to linear effect.
So a set of linear equations which relate stress tensor T , strain tensor S , electric field intensity
tensor E , and electric displacement tensor D can be utilized to describe the piezoelectric effect.
Adiabatic conditions are assumed in most of the situations and temperature and entropy variables
will be neglected in these equations. But the coefficients in these equations are temperature
dependent. Only six independent components in symmetric second rank tensors T and S will be
considered. The phenomenological equations will be written as two matrix equations:
EdTD
EdTsST
tE
(1.1)
EeSD
EeScTS
tE
(1.2)
DgTE
DgTsST
tD
(1.3)
DhSE
DhScTS
tD
(1.4)
where the matrixes with superscript “t” are transpose of these matrixes. Ds and Es are elastic
compliance coefficient tensors under constant electrical displacement and constant electric-field
intensity conditions respectively; d is the piezoelectric strain coefficient tensor; T and S are
permittivity tensors under constant stress and constant strain conditions respectively; Dc and Ec
6
are the stiffness coefficient tensors under constant electric displacement and constant electric-
field intensity conditions respectively; e is the piezoelectric stress coefficient tensor; g is the
piezoelectric voltage coefficient tensor; h is the piezoelectric charge coefficient tensor; and T
and S are permittivity tensors under constant stress and constant strain conditions respectively.
Each of them is proportional to a partial derivative when the superscript variable keeps being
constant. For example, the permittivity tensor under constant stress can be measured from the
slope of the curve of electrical displacement versus electric-field intensity while the stress is held
to be constant. Because d = (∂D/∂T)E = (∂S/∂E)T which can be derived from thermodynamic
potentials, the superscript for parameter d is omitted. This is the reason for the electromechanical
reciprocity. These coefficients have some general relationships which can convert results
obtained from one pair of equations to the notations in another pair. There are totally 40 different
coefficients, but they are not independent.
Familiar piezoelectric configurations include 33-mode longitudinal plate, 31-mode
longitudinal plate, 31-mode ring, 33-mode ring, spherical, piston, tonpilz, hybrid, transmission
line, composite, flextensional, flexural, bender bar, bender disk, slotted cylinder, bender mode X-
spring and so on. And a brief discussion will be given on 33-mode and 31-mode longitudinal
plate, which are the most ordinary structures.
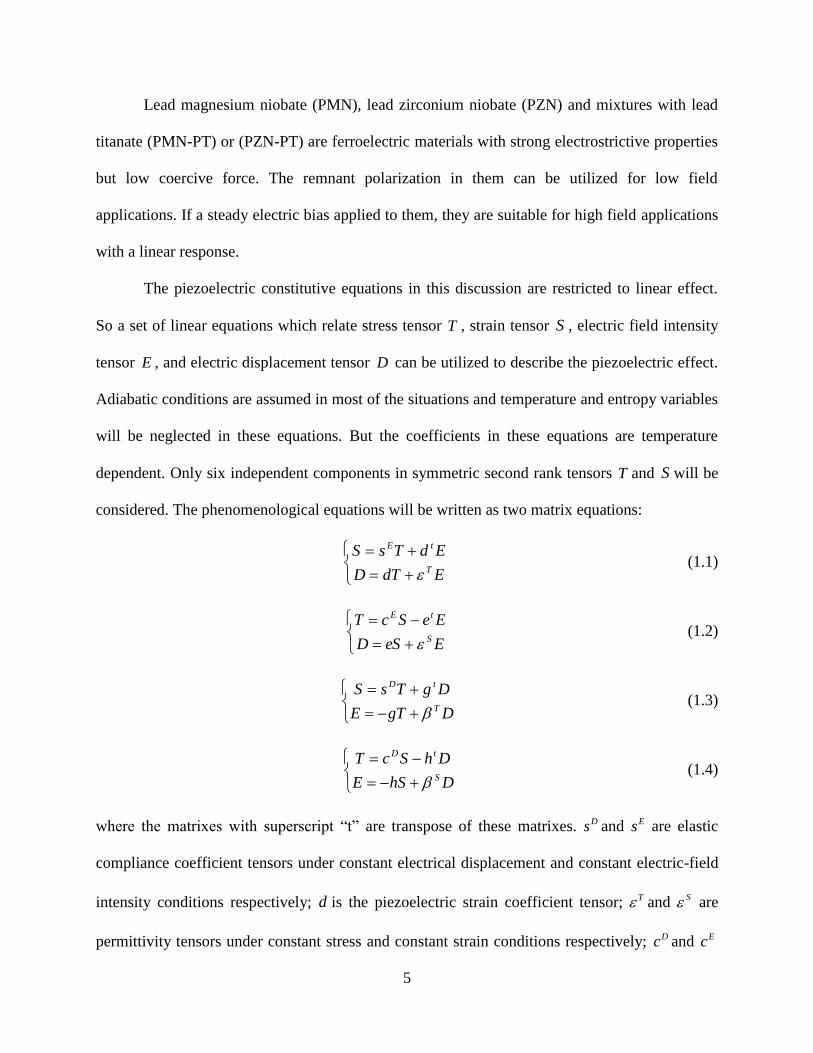
A one-dimensional longitudinal vibration piezoelectric ceramic plate will be analyzed in
the following part. It has a length L which is assumed to be less than a quarter wave length of
longitudinal waves in the ceramic. A stress T acts on the surface of the plate along the 3 direction
(Fig. 1.4). Two electrodes are attached to the ends of the plate to polarize it and establish the
polar axis along the length direction. An alternating electric field E3 is created parallel to the
polarization direction by applying an alternating voltage V to the plate. Electric fields E1, E2 can
7
be assumed to be zero across the plate and the longitudinal electric field does not generate shear
stresses. So equation 1.1 will be
3313132121111 EdTsTsTsS EEE (1.5)
3313132111122 EdTsTsTsS EEE (1.6)
3333332131133 EdTsTsTsS EEE (1.7)
3333332311313 ETdTdTdD T (1.8)
Figure 1.4. The 33 mode piezoelectric longitudinal vibrator with working strain parallel to poling direction
and electrodes on the ends of the plate
The stresses T1 and T2 are zero on the surfaces of the sides and throughout the plate.
Because the sides of the plate are not restricted by anything and the lateral dimensions are small
compared to the length. So these equations can be changed to:
3313131 EdTsS E (1.9)
3313132 EdTsS E (1.10)
3333333 EdTsS E (1.11)
3333333 ETdD T (1.12)
These lateral strains are caused by the main strain modified by the Poisson ratio effect. But they
have no real effect to the actual application.
8
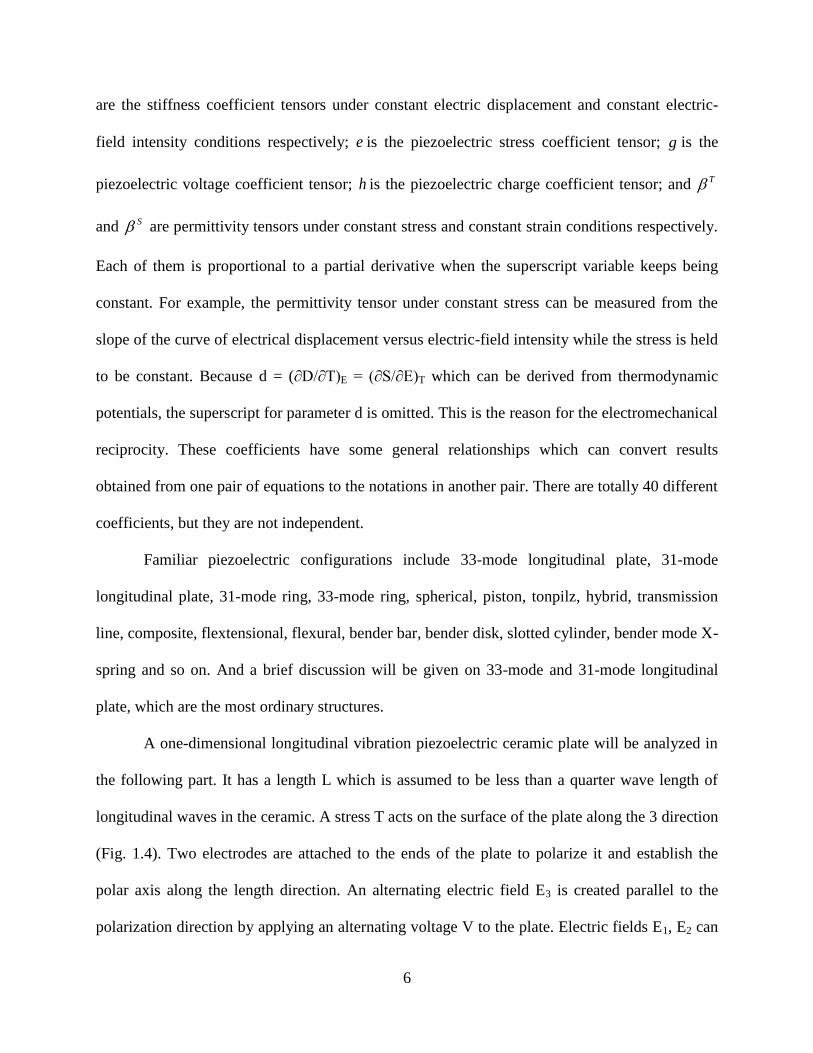
Another longitudinal vibration piezoelectric ceramic plate is the same with the above one,
but excited in 31-mode. It has lower coupling coefficient but also with lower possibility to be
depolarized by static pressure cycling because the polarization direction is vertical to the static
stress direction [4, 5]. A plate with lateral dimensions h and w which has been polarized along
length direction is shown in Fig. 1.5. Now the polar axis is parallel to the length direction and
vertical to side direction. A stress T acts on the surface of the plate along the 1 direction. T1 is the
only stress component that is not zero and E3 is the only electric field component that has value.
In this situation, equation (1.1) can be expanded to
3311111 EdTsS E (1.13)
3311122 EdTsS E (1.14)
3331133 EdTsS E (1.15)
3331313 ETdD T (1.16)
Figure 1.5. The 31 mode piezoelectric longitudinal vibrator with working strain perpendicular to poling
direction and electrodes on the sides of the plate
9
1.3 PIEZOELECTRIC FIBER COMPOSITE
1.3.1 Modeling
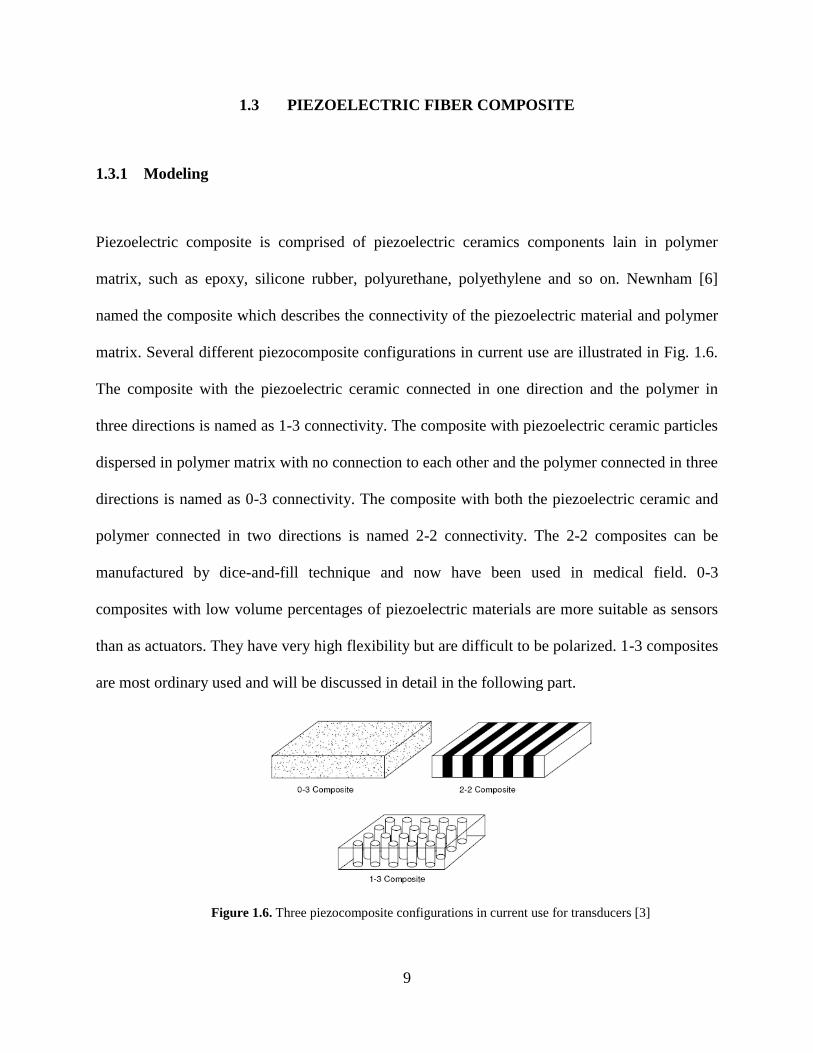
Piezoelectric composite is comprised of piezoelectric ceramics components lain in polymer
matrix, such as epoxy, silicone rubber, polyurethane, polyethylene and so on. Newnham [6]
named the composite which describes the connectivity of the piezoelectric material and polymer
matrix. Several different piezocomposite configurations in current use are illustrated in Fig. 1.6.
The composite with the piezoelectric ceramic connected in one direction and the polymer in
three directions is named as 1-3 connectivity. The composite with piezoelectric ceramic particles
dispersed in polymer matrix with no connection to each other and the polymer connected in three
directions is named as 0-3 connectivity. The composite with both the piezoelectric ceramic and
polymer connected in two directions is named 2-2 connectivity. The 2-2 composites can be
manufactured by dice-and-fill technique and now have been used in medical field. 0-3
composites with low volume percentages of piezoelectric materials are more suitable as sensors
than as actuators. They have very high flexibility but are difficult to be polarized. 1-3 composites
are most ordinary used and will be discussed in detail in the following part.
Figure 1.6. Three piezocomposite configurations in current use for transducers [3]
10
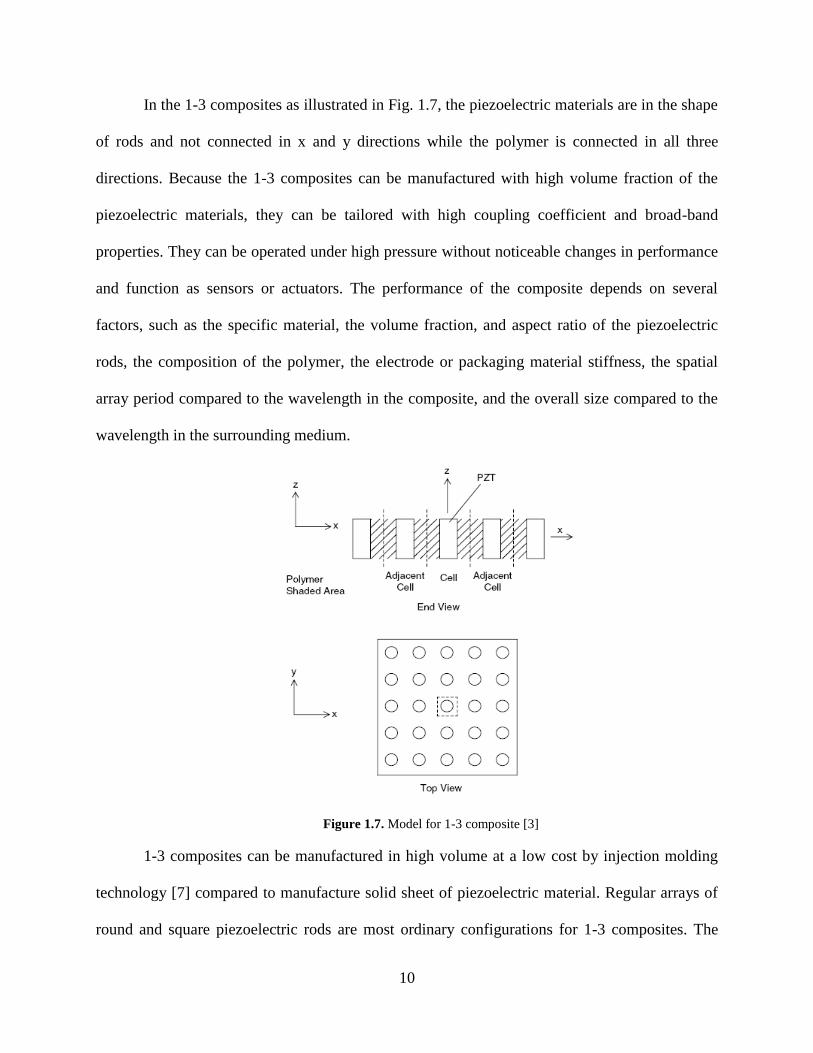
In the 1-3 composites as illustrated in Fig. 1.7, the piezoelectric materials are in the shape
of rods and not connected in x and y directions while the polymer is connected in all three
directions. Because the 1-3 composites can be manufactured with high volume fraction of the
piezoelectric materials, they can be tailored with high coupling coefficient and broad-band
properties. They can be operated under high pressure without noticeable changes in performance
and function as sensors or actuators. The performance of the composite depends on several
factors, such as the specific material, the volume fraction, and aspect ratio of the piezoelectric
rods, the composition of the polymer, the electrode or packaging material stiffness, the spatial
array period compared to the wavelength in the composite, and the overall size compared to the
wavelength in the surrounding medium.
Figure 1.7. Model for 1-3 composite [3]
1-3 composites can be manufactured in high volume at a low cost by injection molding
technology [7] compared to manufacture solid sheet of piezoelectric material. Regular arrays of
round and square piezoelectric rods are most ordinary configurations for 1-3 composites. The
11
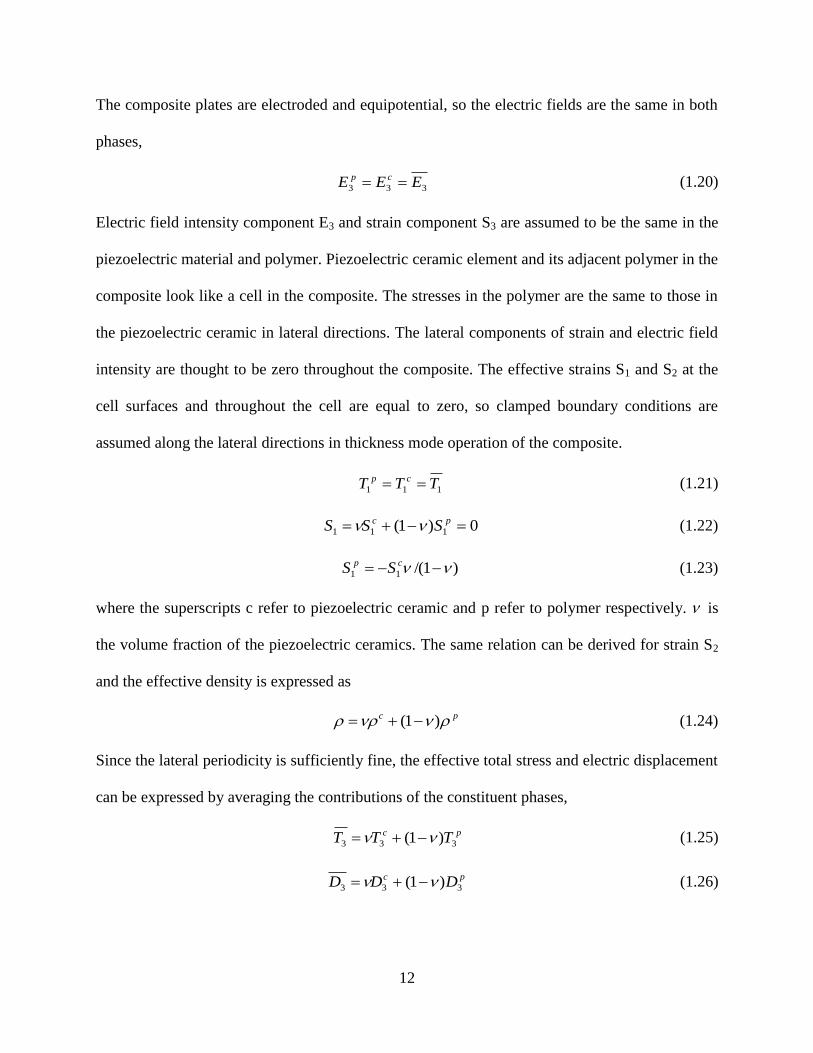
width of the rod ranges from 20μm to 5 mm. 1-3 composite with 15% PZT-5H and 85% polymer
matrix is compared with solid piezoelectric ceramic PZT-5H in Table 1.1 [8].
Table 1.1. Comparison of 1-3 Composite and PZT-5H
Property Units 1-3 Composite PZT-5H
Relative Dielectric Constant 460 3200
Dissipation Factor 0.02 0.02
Coupling Coefficient kt 0.63 0.51
Mechanical Q 20 65
d33 (pC/N) 550 650
Impedance (Mrayls) 6 30
Density (kg/m3) 1800 7500
Smith and Auld [9] developed a thickness mode model to calculate the essential
parameters of the 1-3 piezoelectric fiber polymers composite. These parameters can be expressed
as a function of the volume fraction of the piezoelectric ceramics. Avellaneda and Swart [10]
also developed a tensor model which is more complicated and will not be detailed here. In the
Smith-Auld model, piezoelectric constitutive equations in the 3 direction are utilized as origin
and strain and electric field components are selected to express the stress and electric
displacement components:
3333333 EeScT tE
(1.17)
3333333 ESeD S
(1.18)
Some assumptions and approximations are proposed here to simplify the derivation of the
expressions for all the coefficients. The ceramic and polymer are assumed to move together in a
uniform thickness oscillation and the strains in the 3 direction are the same in both phases,
333 SSS cp
(1.19)
12
The composite plates are electroded and equipotential, so the electric fields are the same in both
phases,
333 EEE cp
(1.20)
Electric field intensity component E3 and strain component S3 are assumed to be the same in the
piezoelectric material and polymer. Piezoelectric ceramic element and its adjacent polymer in the
composite look like a cell in the composite. The stresses in the polymer are the same to those in
the piezoelectric ceramic in lateral directions. The lateral components of strain and electric field
intensity are thought to be zero throughout the composite. The effective strains S1 and S2 at the
cell surfaces and throughout the cell are equal to zero, so clamped boundary conditions are
assumed along the lateral directions in thickness mode operation of the composite.
111 TTT cp
(1.21)
0)1( 111 pc SSS (1.22)
)1/(11 cp SS (1.23)
where the superscripts c refer to piezoelectric ceramic and p refer to polymer respectively. is
the volume fraction of the piezoelectric ceramics. The same relation can be derived for strain S2
and the effective density is expressed as
pc )1( (1.24)
Since the lateral periodicity is sufficiently fine, the effective total stress and electric displacement
can be expressed by averaging the contributions of the constituent phases,
pc TTT 333 )1(
(1.25)
pc DDD 333 )1(
(1.26)
13
After substituting all these conditions into the model, it will give the effective values for
the stiffness coefficient under constant electric-field intensity condition Ec , permittivity under
constant strain condition S and the piezoelectric stress coefficient e. Several effective values for
the composite can be expressed as
ppEcEcE cccccc 11
2
12133333 )1(]/)(2[ (1.27)
]/)(2[ 1213313333 ccceee pEccc (1.28)
pcScS ce 11
2
313333 )1(]/)(2[ (1.29)
)1/()( 12111211 ppEcEc ccccc (1.30)
If D and S are chosen as the independent variables in the piezoelectric constitutive
equations, the 33-mode equations of this model may be expressed as
3333333 DhScT D (1.31)
3333333 )/1( DShE S (1.32)
Seh 333333 / (1.33)
SED ecc 33
2
333333 /)( (1.34)
This model with several different compositions as a function of the volume fraction has
been evaluated numerically by Smith and Auld [9]. The effective density and the effective
relative dielectric constant S
33 increase linearly with the increase of volume fraction of
piezoelectric material. But the effective elastic constant Dc33 and the effective piezoelectric
constant 33e don’t increase linearly with the increase of volume fraction when it is larger than
three quarters. As the volume fraction increases, the PZT rods will be affected laterally by
adjacent PZT rods.
14
This model may be used to describe the composite piezoelectric sensor (Fig. 1.8) if the
sensor only operates in 33-mode. If any lateral effect applies on the sensor synchronously, the
sensitivity will be lowered. If a piezoelectric sensor made of block material is immersed in an
acoustic pressure field and small compared to the wavelength, the pressure on every surface is
nearly the same and the sensor output will be nearly zero. The output signal includes all the three
modes- 31, 32, and 33 modes and the 31 and 32 modes have the same g constants which is nearly
minus half times of the g constant of 33 mode. If a 1-3 composite sensor is exposed to the same
environment, the influences of 31 and 32 modes will be very low and a much larger sensitivity
can be obtained from the sensor. From the hydrostatic model by Smith [11], the effective d33
value and d31 value will decrease 20% and 40% which will lead to an improvement for hd .
Figure 1.8. 1-3 composite model for sensor [3]
The sensitivity for the composite sensor below resonance can be written as
tgtggpVM h )2(/ 3133 (1.35)
where V is the open circuit output voltage, p is the acoustic pressure and t is the thickness along
the polarization direction. The effective piezoelectric voltage constant g is
T
hh dggg 333133 /2 (1.36)
3133 2dddh (1.37)

15
This hydrostatic model is derived from the piezoelectric constitutive equations 1.1, with
the same definitions for Es , T and d and nearly similar assumptions as that for actuator
thickness model. The lateral spatial scale of the composite is so fine that the vertical strains are
the same in both phases,
333 SSS cp
(1.38)
The composite plate is electroded and equipotential, so the electric plates are the same in both
phases,
333 EEE cp
(1.39)
The stresses in the polymer are the same to those in the piezoelectric ceramic in lateral
directions. The lateral stresses are equal in both phases,
111 TTT cp
(1.40)
One difference between these two models is that the effective lateral strain S1 is not zero in the
hydrostatic model. It is the sum of the strain in the ceramic cS1 and the strain in the
polymer pS1 proportioned to the volume fraction,
pc SSS 111 )1( (1.41)
The effective stress and electric displacement of the composite can be expressed by averaging
the contributions of the constituent phases,
pc TTT 333 )1(
(1.42)
pc DDD 333 )1(
(1.43)
After substituting all these conditions into the model, several effective values for the
composite can be derived from these assumptions and they can be expressed as
sdsd cEc /331133 (1.44)
16
sdssdd cEcEcc /))(1( 3313123131 (1.45)
sdTcTcT /)1()1( 2
33113333 (1.46)
ssss EcEcE /113333 (1.47)
ssssss EcEcEcEcE /])1([ 1233111313 (1.48)
EEcEcEcEc
EcpEcEcEcEcEcEcEE
sssss
ssssssssss
1311123313
11
2
12121133
2
1312111211
)/)1(/(2
]/)(2)[1(]/)(2[
(1.49)
EEEEE
h sssss 13121133 4)(2 (1.50)
EcEc sss 1133)1( (1.51)
This hydrostatic model has also been compared with finite element analysis calculation
results by Hayward, Bennett, and Hamilton [12]. And the model is in agreement with the
calculation on the volume fraction for maximum performance. Another tensor mode for the
composite hydrostatic model has also been developed by Avellaneda and Swart [10]. And they
get the conclusions that a polymer with embedded air-filled voids will lower the lateral mode
effectively. If the Poisson’s ratio of the polymer is smaller than -d31/d33, the sensitivity of the
lateral modes will decrease obviously and the effective hg will increase and have the largest
value.
The equivalent circuit for the composite is shown in Fig. 1.9. Here the sensor is assumed
to be operated well below the first resonance frequency of the piezoelectric composite sample.
The output voltage equals the product of effective piezoelectric voltage constant, the thickness
along the polarization direction and the acoustic pressure. If square root of the front surface area
of the composite sensor is larger than the sound wavelength in the medium, the pressure is twice
as the original value at the surface. The electrical impedance is composed of the free capacity fC
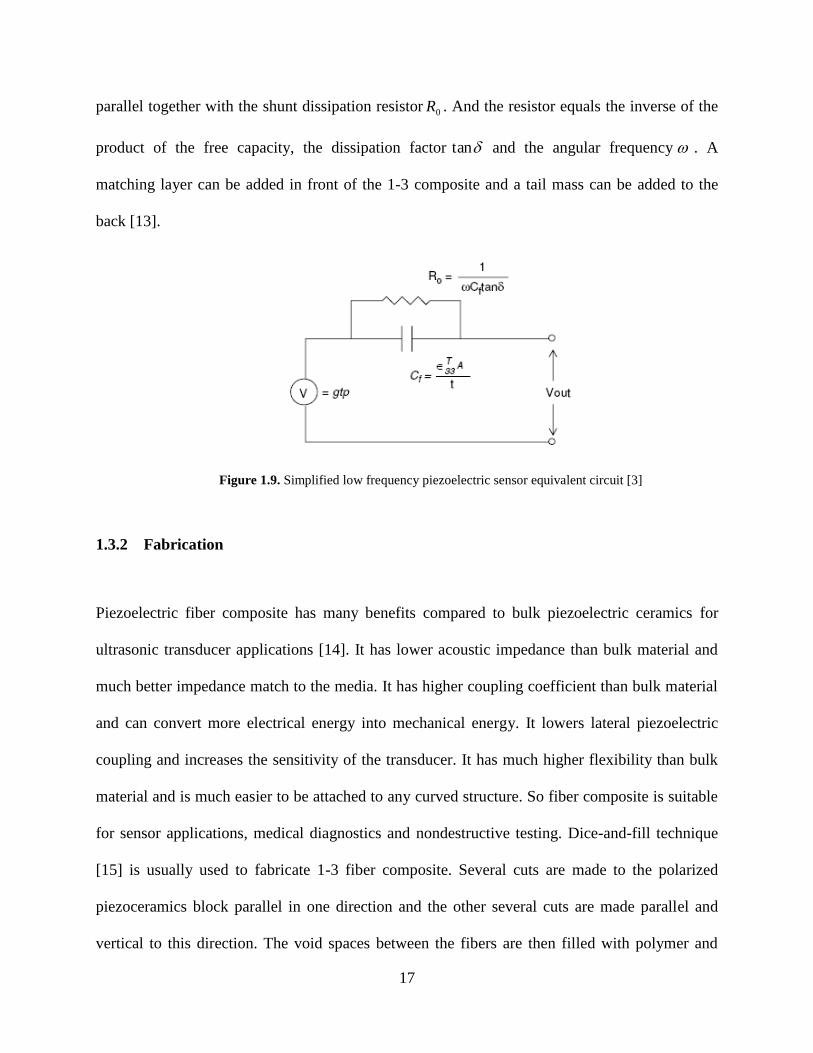
17
parallel together with the shunt dissipation resistor 0R . And the resistor equals the inverse of the
product of the free capacity, the dissipation factor tan and the angular frequency . A
matching layer can be added in front of the 1-3 composite and a tail mass can be added to the
back [13].
Figure 1.9. Simplified low frequency piezoelectric sensor equivalent circuit [3]
1.3.2 Fabrication
Piezoelectric fiber composite has many benefits compared to bulk piezoelectric ceramics for
ultrasonic transducer applications [14]. It has lower acoustic impedance than bulk material and
much better impedance match to the media. It has higher coupling coefficient than bulk material
and can convert more electrical energy into mechanical energy. It lowers lateral piezoelectric
coupling and increases the sensitivity of the transducer. It has much higher flexibility than bulk
material and is much easier to be attached to any curved structure. So fiber composite is suitable
for sensor applications, medical diagnostics and nondestructive testing. Dice-and-fill technique
[15] is usually used to fabricate 1-3 fiber composite. Several cuts are made to the polarized
piezoceramics block parallel in one direction and the other several cuts are made parallel and
vertical to this direction. The void spaces between the fibers are then filled with polymer and
18
baked at a suitable temperature. The composite block is cut into required shapes finally. This
technique usually cost a long time and the generated element is limited to regular and cube-
shaped composite structure. Several new technologies, such as injection molding [16], the lost
mold method [17, 18], the soft-mold method [19] and fiber insertion methods [20] were
developed to overcome these disadvantages.
Smart materials with embedded fibers to reinforce the structure and sense and actuate the
acoustics media inspirit the development of piezoelectric fiber composite [21]. The sol-gel
process is a promising way to fabricate thin and separated fibers at low temperature [22]. The
PZT fibers produced by several different groups with this method have diameters ranging from
10 to 50 µm [23-27]. Because the fibers can be sintered at low temperature (<1,000°C), the
fabricated fibers can be handled in the sintered state as single filaments [28]. The achieved fiber
performance can be improved by tailoring the microstructure and the chemical composition of
the solution. If lead magnesium niobate (PZT-PMN) is added into PZT to format the solid
solution, the dielectric constant and the piezoelectric charge constant can be increased
considerably.
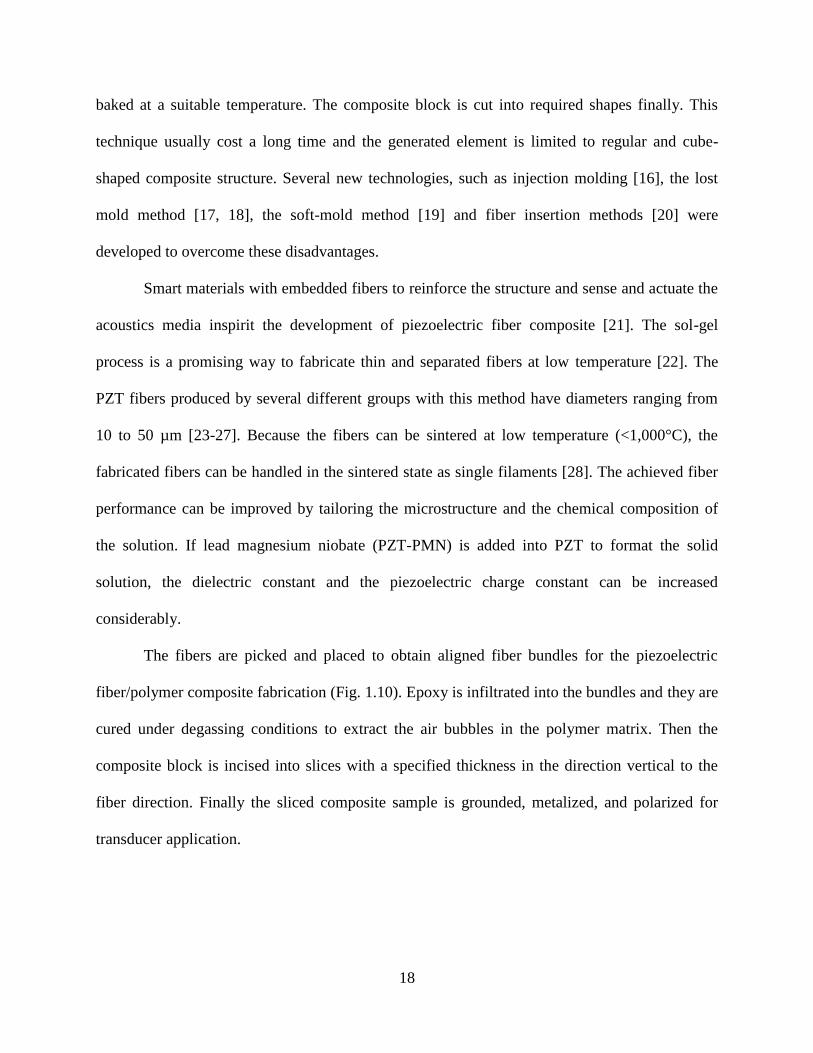
The fibers are picked and placed to obtain aligned fiber bundles for the piezoelectric
fiber/polymer composite fabrication (Fig. 1.10). Epoxy is infiltrated into the bundles and they are
cured under degassing conditions to extract the air bubbles in the polymer matrix. Then the
composite block is incised into slices with a specified thickness in the direction vertical to the
fiber direction. Finally the sliced composite sample is grounded, metalized, and polarized for
transducer application.
19
Figure 1.10. Process chart of 1-3 fiber composite fabrication using sol-gel-derived PZT fibers [28]
Because the PZT fibers from sol-gel-process have bended, twisted shape and random
diameters, the spacing between the fibers will be random in the composite. A static pressure can
be applied vertical to the fiber direction to adjust the fiber volume fraction in the composite.
Higher volume fraction and order can be obtained with larger force accompanying with higher
risk of fiber cracking.
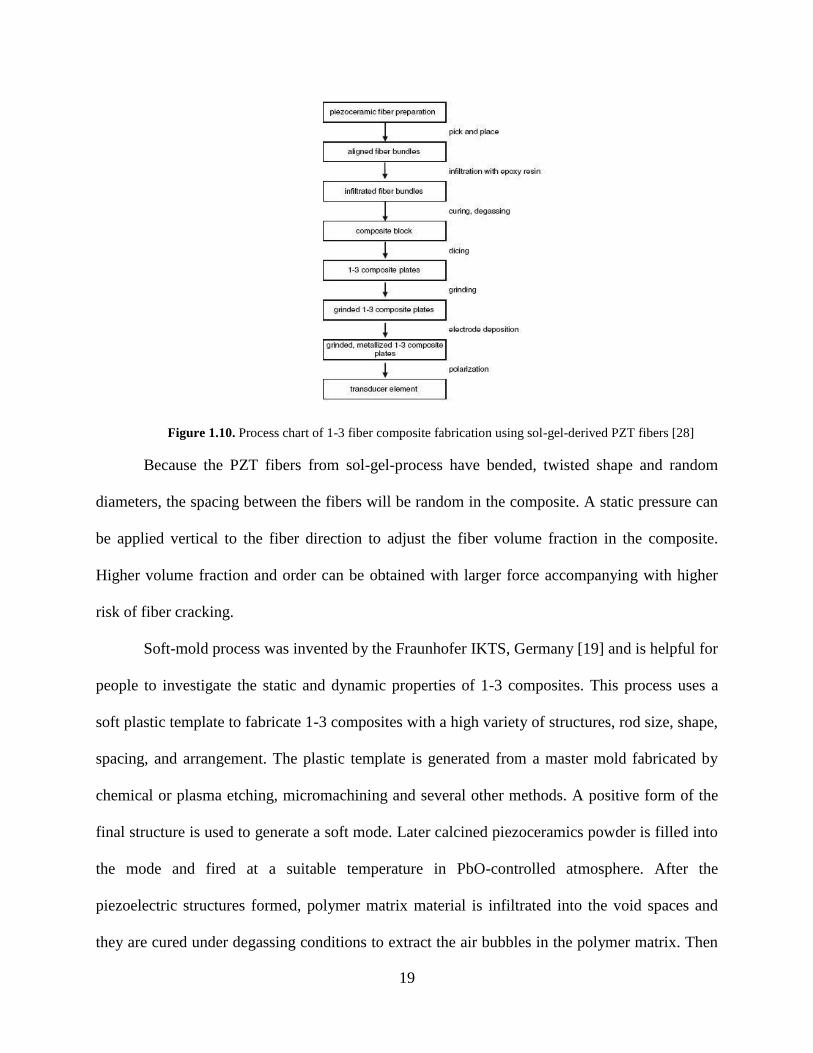
Soft-mold process was invented by the Fraunhofer IKTS, Germany [19] and is helpful for
people to investigate the static and dynamic properties of 1-3 composites. This process uses a
soft plastic template to fabricate 1-3 composites with a high variety of structures, rod size, shape,
spacing, and arrangement. The plastic template is generated from a master mold fabricated by
chemical or plasma etching, micromachining and several other methods. A positive form of the
final structure is used to generate a soft mode. Later calcined piezoceramics powder is filled into
the mode and fired at a suitable temperature in PbO-controlled atmosphere. After the
piezoelectric structures formed, polymer matrix material is infiltrated into the void spaces and
they are cured under degassing conditions to extract the air bubbles in the polymer matrix. Then
20
the composite block is incised into slices with a specified thickness in the direction vertical to the
fiber direction. Finally the sliced composite sample is grounded, metalized, and polarized for
transducer application. The process chart is shown in Fig. 1.11. Fibers as fine as 35 µm can be
fabricated in this process and the composite can be used at high frequency ranging from 4 to 8
MHz.
Compared to conventional techniques, such as die-and-fill and injection molding, the
soft-mold process has many advantages. The mold can be used several times to generate a lot of
copies of the fiber arrays. Fibers with various shapes and sizes can be manufactured by soft-mold
process. This process doesn’t need an expensive saw to cut the piezoceramics block and has no
cost to maintain the saw. This process can maintain superior quality at a reasonable price per unit
and has the capacity to manufacture high volumes. By changing the symmetry from square to
other arrangement in the mold, the periodicity and regularity of the fibers can be removed and
lateral stop band resonance modes can be suppressed or shifted to higher frequencies.
Figure 1.11. Slip casting process using reusable soft plastic molds to manufacture 1-3 composites [28]
21
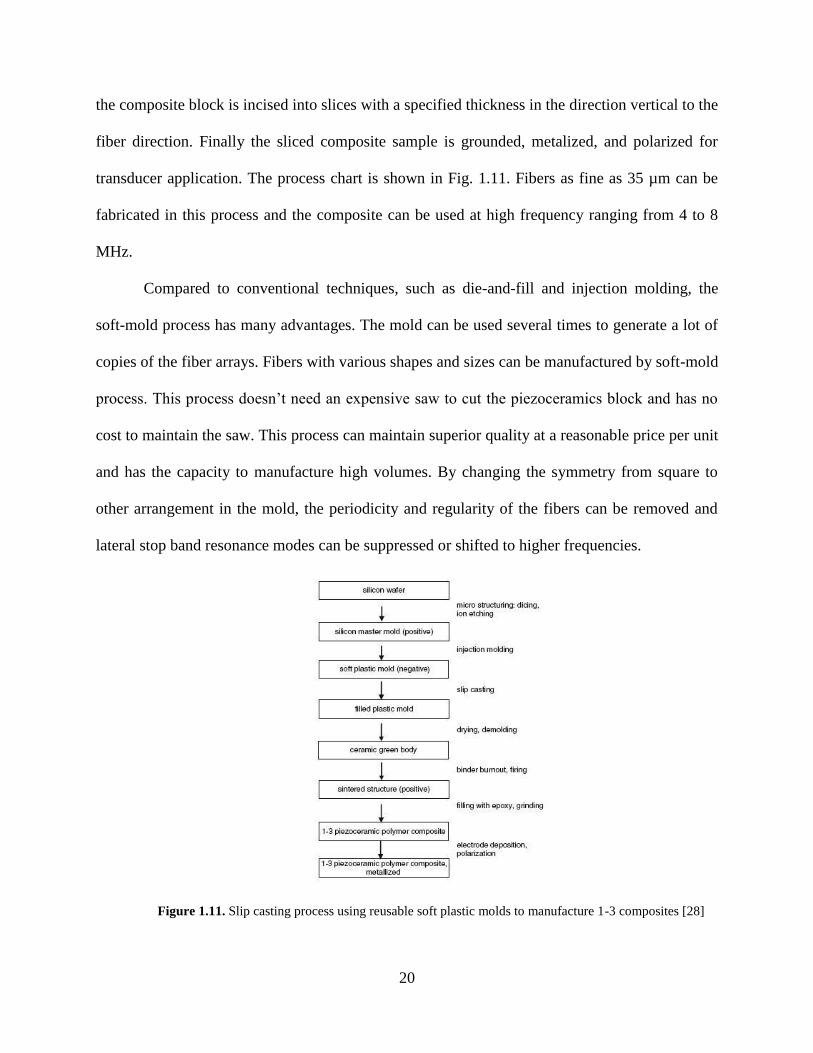
Fibers with diameters ranging from 100 to 800µm can be manufactured by powder
suspension extrusion [29] and suspension spinning [30, 31] technique. The suspension spinning
technique is suitable for mass production. The fibers fabricated by this method can be arranged
with regular space or not. Epoxy is infiltrated into the bundles and they are cured under
degassing conditions to extract the air bubbles in the polymer matrix. Then the composite block
is incised into slices with a specified thickness in the direction vertical to the fiber direction (Fig.
1.12). The composite can also be cut into any other shape or size. Finally the sliced composite
sample is grounded, metalized, and polarized for transducer application. The piezoceramics fiber
fabrication and arrangement, epoxy selection and the curing step are key points to acquire fiber
composite with high quality and this process has been commercialized by Smart Material Corp.
Figure 1.12. Process chart of 1-3 fiber composite fabrication using powder-derived PZT fibers [28]
Straight fiber with homogeneous consistency is an important factor for the high quality of
the fiber composite. Powder suspension extrusion and spinning process assure the high quality of
PZT fibers and this process is suitable for industrial batch manufacturing. Fibers with different
components, shapes and even hollow fibers have been successfully fabricated. Sintered PZT
22
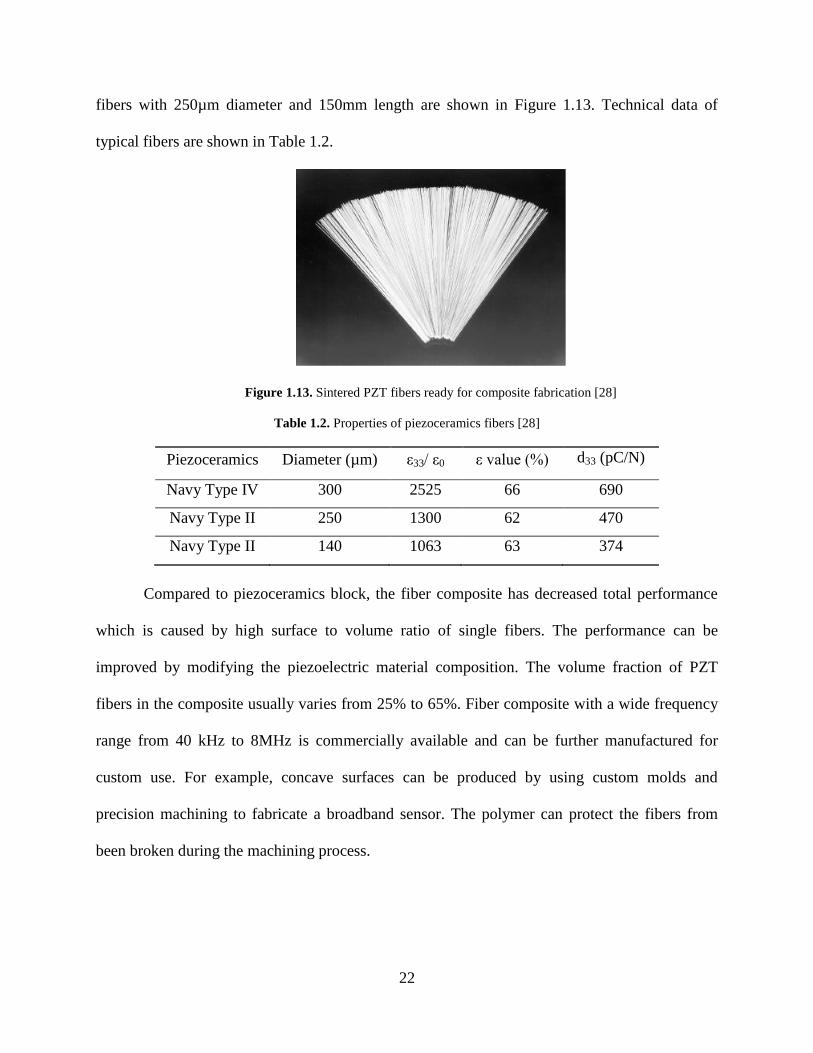
fibers with 250µm diameter and 150mm length are shown in Figure 1.13. Technical data of
typical fibers are shown in Table 1.2.
Figure 1.13. Sintered PZT fibers ready for composite fabrication [28]
Table 1.2. Properties of piezoceramics fibers [28]
Piezoceramics Diameter (µm) ε33/ ε0 ε value (%) d33 (pC/N)
Navy Type IV 300 2525 66 690
Navy Type II 250 1300 62 470
Navy Type II 140 1063 63 374
Compared to piezoceramics block, the fiber composite has decreased total performance
which is caused by high surface to volume ratio of single fibers. The performance can be
improved by modifying the piezoelectric material composition. The volume fraction of PZT
fibers in the composite usually varies from 25% to 65%. Fiber composite with a wide frequency
range from 40 kHz to 8MHz is commercially available and can be further manufactured for
custom use. For example, concave surfaces can be produced by using custom molds and
precision machining to fabricate a broadband sensor. The polymer can protect the fibers from
been broken during the machining process.
23
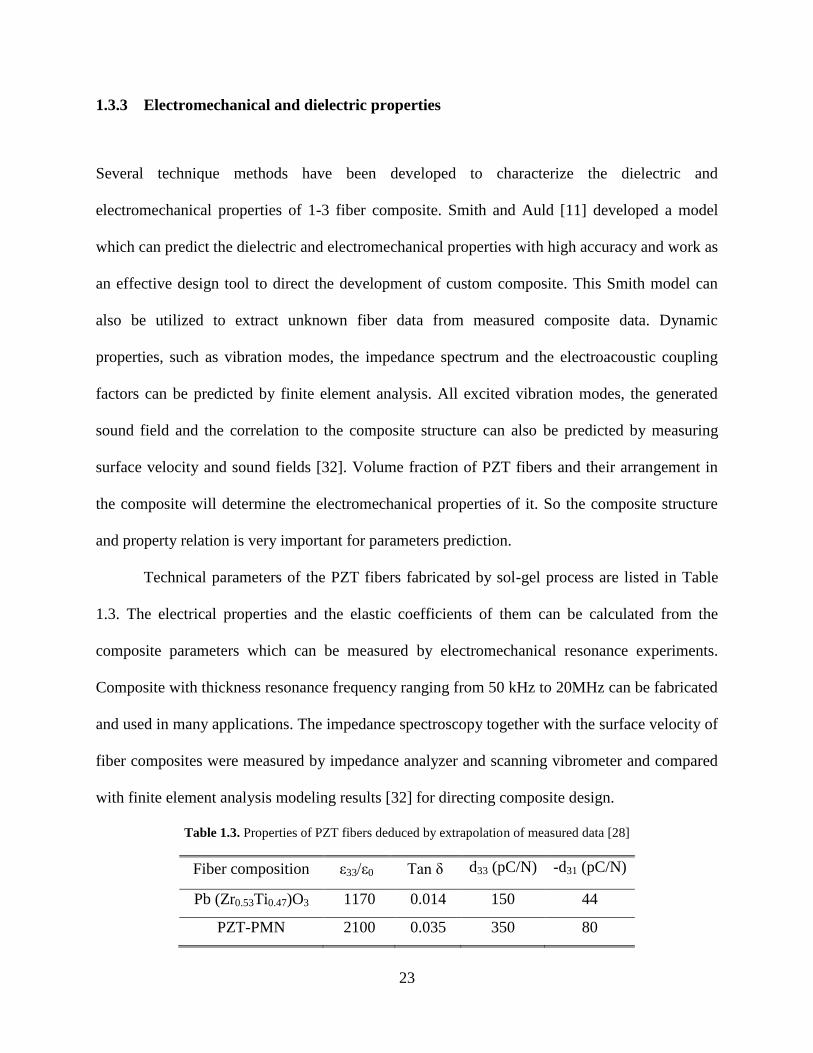
1.3.3 Electromechanical and dielectric properties
Several technique methods have been developed to characterize the dielectric and
electromechanical properties of 1-3 fiber composite. Smith and Auld [11] developed a model
which can predict the dielectric and electromechanical properties with high accuracy and work as
an effective design tool to direct the development of custom composite. This Smith model can
also be utilized to extract unknown fiber data from measured composite data. Dynamic
properties, such as vibration modes, the impedance spectrum and the electroacoustic coupling
factors can be predicted by finite element analysis. All excited vibration modes, the generated
sound field and the correlation to the composite structure can also be predicted by measuring
surface velocity and sound fields [32]. Volume fraction of PZT fibers and their arrangement in
the composite will determine the electromechanical properties of it. So the composite structure
and property relation is very important for parameters prediction.
Technical parameters of the PZT fibers fabricated by sol-gel process are listed in Table
1.3. The electrical properties and the elastic coefficients of them can be calculated from the
composite parameters which can be measured by electromechanical resonance experiments.
Composite with thickness resonance frequency ranging from 50 kHz to 20MHz can be fabricated
and used in many applications. The impedance spectroscopy together with the surface velocity of
fiber composites were measured by impedance analyzer and scanning vibrometer and compared
with finite element analysis modeling results [32] for directing composite design.
Table 1.3. Properties of PZT fibers deduced by extrapolation of measured data [28]
Fiber composition ε33/ε0 Tan δ d33 (pC/N) -d31 (pC/N)
Pb (Zr0.53Ti0.47)O3 1170 0.014 150 44
PZT-PMN 2100 0.035 350 80
24
1.3.4 Application
Piezoelectric fiber composite is a unique and cost-efficient transducer fabrication technology.
They combine the sensing and actuating properties of piezoelectric fibers and the softness
properties of polymer to improve the performance of the ultrasonic transducer. These devices can
have the benefits, such as high coupling coefficient, low acoustic impedance, broader bandwidth,
greater sensitivity, minimized lateral mode coupling and an intermediate dielectric constant.
The fiber composite transducer can work in the frequency range from 40 kHz to 6MHz
with spurious modes suppressed. The acoustic impedance can be adjusted to satisfy the needs for
several applications, including nondestructive testing, biomedical diagnosis, sonar application
and so on. Matching or backing layers are not needed because of their excellent impedance
match with the acoustics media. This can help to save space, cost and decrease the total weight
of the overall transducer. The fiber composite transducer can also be designed in special shapes
to match non planar surfaces which will increase its application field. For example, a broadband
transducer is required in guided wave inspections, where curved surfaces are required to be
inspected without extensive scanning. The fiber composite piezoelectric transducer can satisfy
the requirements and has an excellent impedance match to the test sample.
Both of the piezoelectric fiber composite and piezoelectric bulk materials have
applications under certain circumstances. Both of them are needed in the ultrasound transducer
industry and the fiber composite will not entirely replace the bulk materials. The fiber composite
transducers are suitable to be used in the frequency domain with a resonant frequency from 4
MHz to 6 MHz. Bulk materials are suitable for the applications out of this range. Usually
piezoelectric composites cost more than bulk materials but they don’t need matching and
backing layers and have better performances in special applications.

25
1.4 PIEZORESISTIVE MATERIALS AND SENSORS
1.4.1 Piezoresistive materials
Piezoresistivity is a common electromechanical sensing method for micromachined sensors.
Doped silicon has excellent piezoresistive characteristics among all piezoresistive materials [33,
34]. A number of representative piezoresistive materials will be introduced here.
Metal strain gauges are often in the form of metal-clad plastic patches which can be glued
to surfaces of mechanical structures. Resistors are etched with a zigzagged path to increase the
resistor length and the resistance amount in a given area. Metal strain gauges are often not made
of pure metal thin films but of metal alloys for actual commercial applications. Metal strain
gauges usually have the gauge factors ranging from 0.8 to 3.0. Monolithic integration processes
are used to fabricate the micromachined strain gauges on mechanical beams and membranes to
acquire small size. Metal strain gauges do not have large piezoresistive gauge factors but can still
be applied in many situations. They don’t need doping and lengthy process steps and they can be
deposited and processed under much lower temperature than that for doping semiconductors.
They also can sustain a much larger elongation before fracture.
Selectively doped silicon can be used to make semiconductor strain gauges [33-35]. The
relative orientation of a doped single-crystal silicon piezoresistor to crystallographic directions
will influence the piezoresistive coefficients of it. Its piezoresistive coefficients will also be
influenced by the doping concentration, type of dopant, and temperature of the substrate [36, 37].
Different elements of the piezoresistive coefficients matrix are affected by temperature and
doping concentrations differently. The piezoresistive coefficients decrease with increasing
temperature and doping concentrations for both p- and n-type silicon. For single-crystalline
26
silicon under certain doping concentration and dopant types, the piezoresistive coefficients have
been characterized experimentally [38]. If the x-, y-, and z-axes of the crystal are not aligned to
the axial directions of the coordinate, the piezoresistive coefficients matrix will change. Young’s
modulus of silicon is also a function of the crystal directions. By multiplying the piezoresistive
coefficient with Young’s modulus in the applied strain direction, the piezoresistive gauge factors
can be acquired. The piezoresistive sensitivity is not exactly a constant.
A successful silicon piezoresistors design will have an appreciable resistance value, a
maximum gauge factor, and minimum temperature effects. The doping concentration will affect
all of these three performance parameters. For piezoresistors made of doped silicon, the gauge
factor and the temperature coefficient of resistance are both functions of the doping
concentration. Appropriate doping concentrations must be carefully selected for silicon
piezoresistors designs.
Polysilicon which can be deposited on a wide range of substrates offers a number of
advantages over single-crystalline silicon for MEMS piezoresistors [39]. The gauge factor of
polycrystalline silicon is much smaller than that of single crystalline. But it does not depend on
the orientation of the resistor in the substrate plane. The gauge factors for n- and p-type
polycrystalline silicon substrates are strongly influenced by the doping concentration and will
reach peak magnitude at particular concentrations.
1.4.2 Piezoresistive sensors
Piezoresistive materials have been used for many kinds of sensor applications in these years. A
few examples will be discussed here. These examples illustrate the unique device designs,
fabrication processes, and achievable specific performances. A proof mass will experience an
27
inertial force under an applied acceleration, which introduces stress and strain to the mechanical
support elements connected to the proof mass. The acceleration value can be acquired by
measuring the magnitude of the stress. This is the basic principle of piezoresistive
accelerometers. Tactile sensors are used to characterize surface profiles and morphology and to
measure contact forces. High integrated tactile sensors can be manufactured by micromachined
fabrication process. Micro piezoresistors can also be used for flow sensing applications. Their
small physical sizes can minimize the impact on the flow field under test. Fluid flow around a
microstructure can generate a lifting force [40, 41], a drag force [42], or momentum transfer on a
floating element [43, 44]. These forces will deform the microstructure; change the stress in the
floating element or the structures supporting it. By measuring the resistance of the piezoresistors
located on these structures, the bending of the structures and the fluid parameters can be
predicted.
The pressure sensor was the earliest demonstration fabricated by micromachining
technology. The fabrication technology for pressure sensors advances quickly. Both bulk and
surface micromachining can be used in the fabrication process. Bulk microfabricated pressure
sensors are still the dominated products today. They incorporate thin deformable diaphragms
which are made of single crystal silicon. Bulk silicon micromachining steps are used to make the
diaphragm with embedded piezoresistors. Selectively doping the silicon diaphragm is used to
make the piezoresistors. Piezoresistors are located in the center of four edges where the
maximum tensile stress occurs during the bending of the diaphragm. A uniformly applied
pressure difference across the diaphragm was utilized to bend the diaphragm.
28
2.0 RESEARCH OBJECTIVE
As discussed in chapter 1, piezoelectric fiber composite has been proven to be a powerful tool
for transducer applications in wide areas with excellent characters, such as high coupling
coefficient, low acoustic impedance, broader bandwidth, greater sensitivity, minimized lateral
mode coupling and an intermediate dielectric constant. Hence, my PhD research work will focus
on this topic and will include two parts, one objective is to fabricate and characterize ZnO
nanowires-polymer nanocomposite and experimentally investigate the piezoelectric and
piezoresistive properties of this novel nanocomposite; the other objective is to use theoretical
modeling and experiment validation to investigate PZT fiber composite and develop their
physical and medical applications.
Therefore, the overall objective of this dissertation is on the modeling and experimental
study of fiber composite sensor, which has three specific aims:
ZnO nanowires-polymer nanocomposite piezoelectric and piezoresistive
properties investigation
PZT fiber composite sensor for vibration and strain sensing
PZT fiber composite sensor for medical applications
29
3.0 MULTIFUNCTIONAL ZNO NANOWIRES-POLYMER NANOCOMPOSITE
AND ITS APPLICATION
3.1 INTRODUCTION
Nanowires and nanotubes may become the basic building blocks for nanoscale electronic, optical
and biological systems, since they can function as miniaturized devices as well as electrical
interconnects [45]. With some unique optoelectronic, electrical, piezoelectric and photochemical
properties, ZnO nanowires have been extensively investigated in the past few years for use in
UV lighting-emitting devices [46, 47], gas sensor [48], solar cells [49], and field emitter [50].
Meanwhile, polymer nanocomposites with nanomaterials dispersed in polymer matrix have been
studied to develop materials with improved electrical and mechanical properties [51, 52].
It is expected that nanocomposites that make use of the intrinsic properties of the ZnO
crystal, the scaling properties of ZnO nanowires, and the induced electric polarization of the
dielectric polymeric phase will open a novel route to design and fabricate multifunctional
electroactive polymer composite with micro-tailorable properties that single component material
cannot achieve. So far, polymer-based dielectrics with a high dielectric constant (high K) have
been studied for capacitor and charge-storage device applications [53-56]. Many high-K ceramic
fillers are used as additives to improve the K of polymers. Percolative composite capacitors are
fabricated by using conductive fillers as another strategy to improve the K [56, 57]. Core/shell
30
hybrid particles with metal Ag cores coated by organic dielectric shells are also used as additives
[58], which can keep a stable high-K, but rather low dielectric loss (tan ) of the polymer
dielectrics. Polymer-based nanocomposites are becoming an attractive set of organic-inorganic
materials due to their multifunctionality and many potential applications.
In this work, ZnO nanowires are added into polyimide matrix to form polymer matrix
composites, in which the ZnO nanowires are tailored by electric field assisted alignment by using
in-plane interdigital transducer (IDT) electrodes to achieve anisotropic properties. The degree of
nanowires’ distribution in a dielectric polymer matrix, the orientation of nanowires and the
binding between nanowires and polymer matrix, will determine the properties of the composite
materials. ZnO single crystal nanowires are usually with hexagonal cross-section and the
crystalline c-axis (polarization axis) is along the length direction of the nanowires. Strong
piezoelectric and pyroelectric properties are observed along the c-axis of the ZnO with wurtzite
structure. Thus alignment of nanowires along the length direction in the nanocomposites is of
importance to explore the materials multi-functionality. Electric and material properties of this
novel nanocomposite have been characterized with related instruments. High dielectric constant
is acquired by experiment and the percolation threshold of the nanocomposite is about 15% ZnO
nanowire weight ratio in the nanocomposite. The nanocomposites, with tailorable microscale
morphology and high dielectric constant, will be found use in smart materials and structures as
electromechanical sensors and actuators, as well as for charge-storage devices and other
electronic applications. The piezoresistive property of this nanocomposite without electric field
alignment was also investigated for strain sensor application. Large gauge factor caused by
semiconductor property of ZnO nanowires was obtained and high flexibility of the
nanocomposite sensor made it easy to be attached to any curved structures for strain

31
measurement. This novel nanocomposite piezoresistive strain sensor with high gauge factor is
expected to be widely applied to various occasions, including industrial, civil, medical, and
aerospace domains.
3.2 FABRICATION AND ELECTRIC PROPERTIES OF ANISOTROPIC ZNO
NANOWIRES-POLYIMIDE NANOCOMPOSITE
3.2.1 Fabrication and characterization
ZnO nanowires were synthesized according to a two-step hydrothermal method [59]. The
substrate with ZnO nanowires was characterized under a scanning electron microscope (SEM) to
image the surface topography, composition of it, diameter and length of nanowires. The top SEM
image of the substrate is shown in Fig. 3.1. To complete this procedure, the substrate with ZnO
nanowires array was sonicated in ethanol for 4 hours to break down the ZnO nanowires from the
substrate. The ZnO nanowires-ethanol solution was heated to 120°C and held at this temperature
for one hour to evaporate the ethanol. SEM image of broken ZnO nanowires is shown in Fig. 3.2.
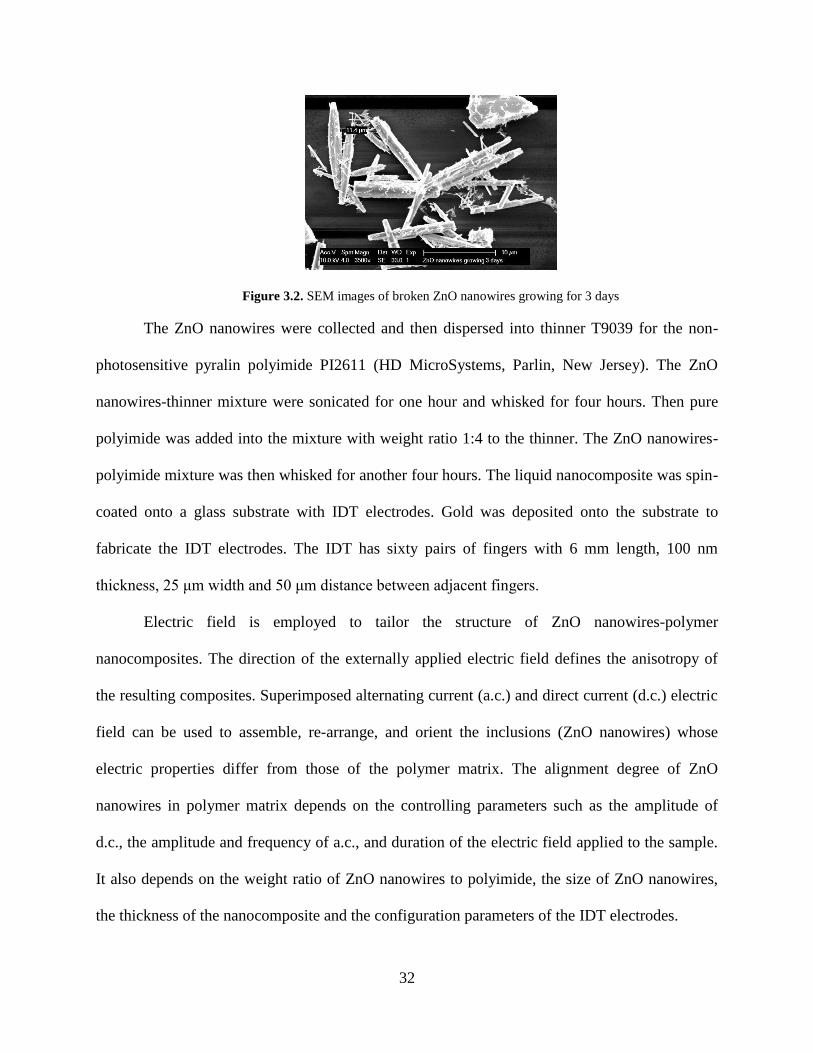
The average length of the ZnO nanowires is nearly 10 μm.
Figure 3.1. Top SEM images of ZnO nanowires on the substrate grown by hydrothermal method
32
Figure 3.2. SEM images of broken ZnO nanowires growing for 3 days
The ZnO nanowires were collected and then dispersed into thinner T9039 for the non-
photosensitive pyralin polyimide PI2611 (HD MicroSystems, Parlin, New Jersey). The ZnO
nanowires-thinner mixture were sonicated for one hour and whisked for four hours. Then pure
polyimide was added into the mixture with weight ratio 1:4 to the thinner. The ZnO nanowires-
polyimide mixture was then whisked for another four hours. The liquid nanocomposite was spin-
coated onto a glass substrate with IDT electrodes. Gold was deposited onto the substrate to
fabricate the IDT electrodes. The IDT has sixty pairs of fingers with 6 mm length, 100 nm
thickness, 25 μm width and 50 μm distance between adjacent fingers.
Electric field is employed to tailor the structure of ZnO nanowires-polymer
nanocomposites. The direction of the externally applied electric field defines the anisotropy of
the resulting composites. Superimposed alternating current (a.c.) and direct current (d.c.) electric
field can be used to assemble, re-arrange, and orient the inclusions (ZnO nanowires) whose
electric properties differ from those of the polymer matrix. The alignment degree of ZnO
nanowires in polymer matrix depends on the controlling parameters such as the amplitude of
d.c., the amplitude and frequency of a.c., and duration of the electric field applied to the sample.
It also depends on the weight ratio of ZnO nanowires to polyimide, the size of ZnO nanowires,
the thickness of the nanocomposite and the configuration parameters of the IDT electrodes.
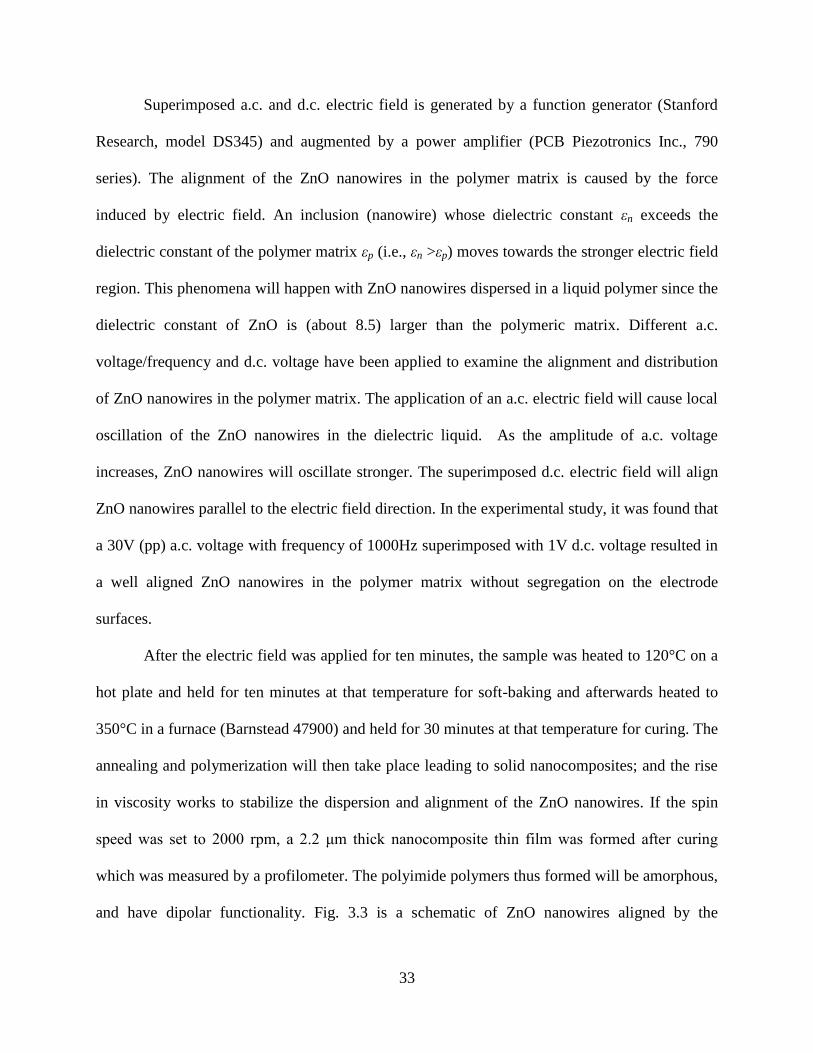
33
Superimposed a.c. and d.c. electric field is generated by a function generator (Stanford
Research, model DS345) and augmented by a power amplifier (PCB Piezotronics Inc., 790
series). The alignment of the ZnO nanowires in the polymer matrix is caused by the force
induced by electric field. An inclusion (nanowire) whose dielectric constant εn exceeds the
dielectric constant of the polymer matrix εp (i.e., εn >εp) moves towards the stronger electric field
region. This phenomena will happen with ZnO nanowires dispersed in a liquid polymer since the
dielectric constant of ZnO is (about 8.5) larger than the polymeric matrix. Different a.c.
voltage/frequency and d.c. voltage have been applied to examine the alignment and distribution
of ZnO nanowires in the polymer matrix. The application of an a.c. electric field will cause local
oscillation of the ZnO nanowires in the dielectric liquid. As the amplitude of a.c. voltage
increases, ZnO nanowires will oscillate stronger. The superimposed d.c. electric field will align
ZnO nanowires parallel to the electric field direction. In the experimental study, it was found that
a 30V (pp) a.c. voltage with frequency of 1000Hz superimposed with 1V d.c. voltage resulted in
a well aligned ZnO nanowires in the polymer matrix without segregation on the electrode
surfaces.
After the electric field was applied for ten minutes, the sample was heated to 120°C on a
hot plate and held for ten minutes at that temperature for soft-baking and afterwards heated to
350°C in a furnace (Barnstead 47900) and held for 30 minutes at that temperature for curing. The
annealing and polymerization will then take place leading to solid nanocomposites; and the rise
in viscosity works to stabilize the dispersion and alignment of the ZnO nanowires. If the spin
speed was set to 2000 rpm, a 2.2 μm thick nanocomposite thin film was formed after curing
which was measured by a profilometer. The polyimide polymers thus formed will be amorphous,
and have dipolar functionality. Fig. 3.3 is a schematic of ZnO nanowires aligned by the
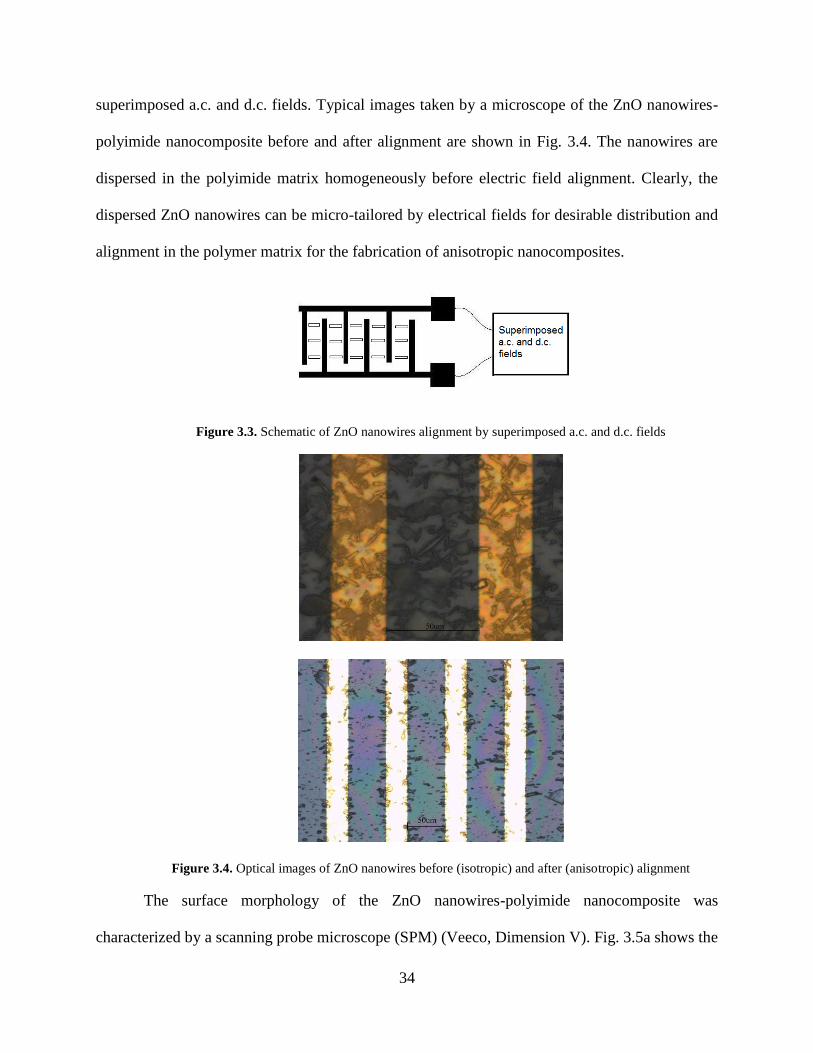
34
superimposed a.c. and d.c. fields. Typical images taken by a microscope of the ZnO nanowires-
polyimide nanocomposite before and after alignment are shown in Fig. 3.4. The nanowires are
dispersed in the polyimide matrix homogeneously before electric field alignment. Clearly, the
dispersed ZnO nanowires can be micro-tailored by electrical fields for desirable distribution and
alignment in the polymer matrix for the fabrication of anisotropic nanocomposites.
Figure 3.3. Schematic of ZnO nanowires alignment by superimposed a.c. and d.c. fields
Figure 3.4. Optical images of ZnO nanowires before (isotropic) and after (anisotropic) alignment
The surface morphology of the ZnO nanowires-polyimide nanocomposite was
characterized by a scanning probe microscope (SPM) (Veeco, Dimension V). Fig. 3.5a shows the
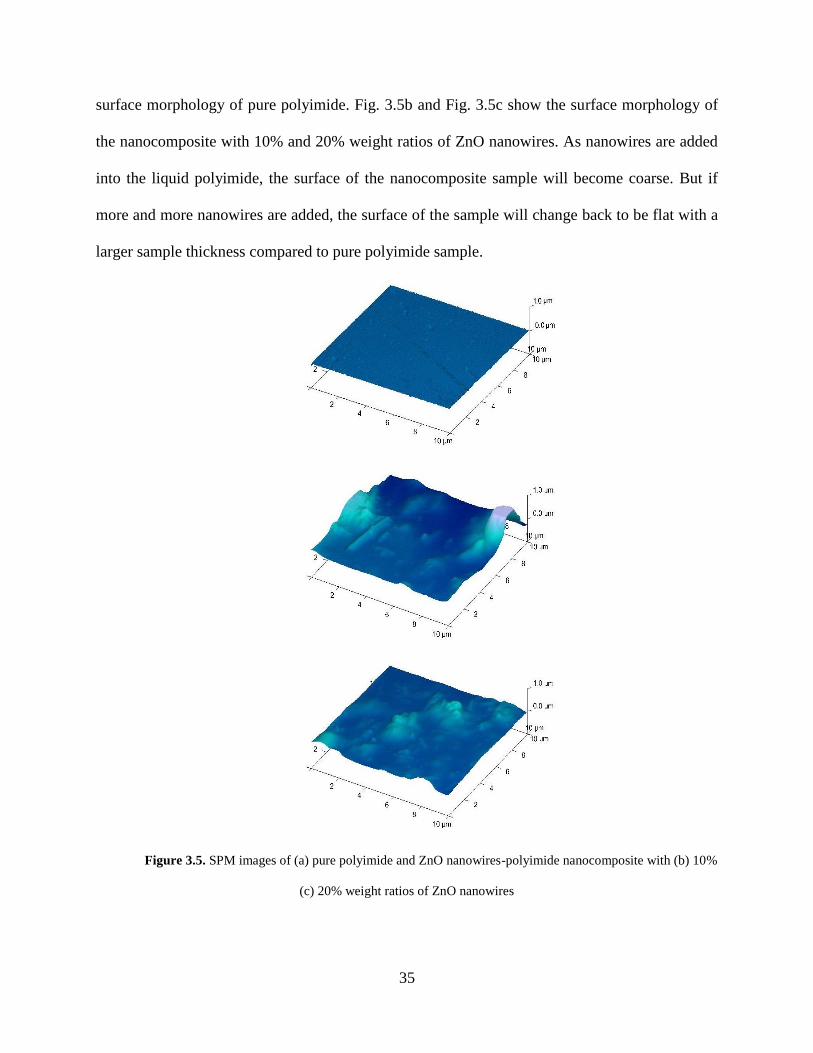
35
surface morphology of pure polyimide. Fig. 3.5b and Fig. 3.5c show the surface morphology of
the nanocomposite with 10% and 20% weight ratios of ZnO nanowires. As nanowires are added
into the liquid polyimide, the surface of the nanocomposite sample will become coarse. But if
more and more nanowires are added, the surface of the sample will change back to be flat with a
larger sample thickness compared to pure polyimide sample.
Figure 3.5. SPM images of (a) pure polyimide and ZnO nanowires-polyimide nanocomposite with (b) 10%
(c) 20% weight ratios of ZnO nanowires
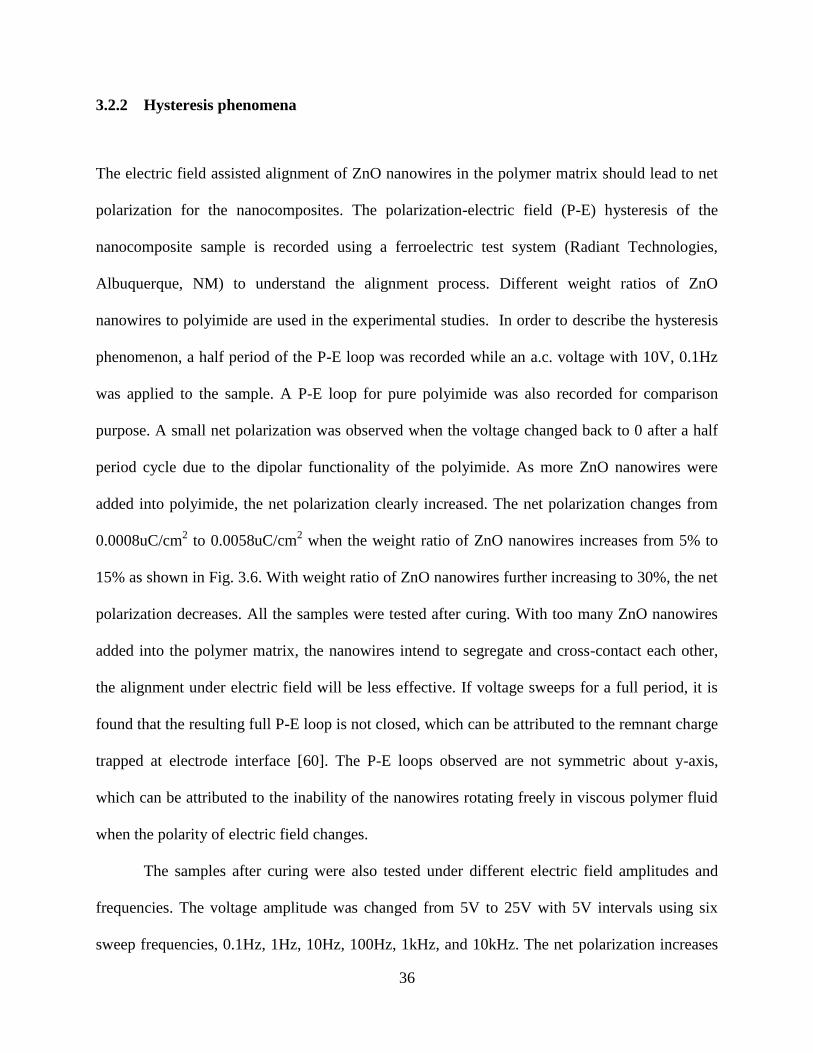
36
3.2.2 Hysteresis phenomena
The electric field assisted alignment of ZnO nanowires in the polymer matrix should lead to net
polarization for the nanocomposites. The polarization-electric field (P-E) hysteresis of the
nanocomposite sample is recorded using a ferroelectric test system (Radiant Technologies,
Albuquerque, NM) to understand the alignment process. Different weight ratios of ZnO
nanowires to polyimide are used in the experimental studies. In order to describe the hysteresis
phenomenon, a half period of the P-E loop was recorded while an a.c. voltage with 10V, 0.1Hz
was applied to the sample. A P-E loop for pure polyimide was also recorded for comparison
purpose. A small net polarization was observed when the voltage changed back to 0 after a half
period cycle due to the dipolar functionality of the polyimide. As more ZnO nanowires were
added into polyimide, the net polarization clearly increased. The net polarization changes from
0.0008uC/cm2 to 0.0058uC/cm
2 when the weight ratio of ZnO nanowires increases from 5% to
15% as shown in Fig. 3.6. With weight ratio of ZnO nanowires further increasing to 30%, the net
polarization decreases. All the samples were tested after curing. With too many ZnO nanowires
added into the polymer matrix, the nanowires intend to segregate and cross-contact each other,
the alignment under electric field will be less effective. If voltage sweeps for a full period, it is
found that the resulting full P-E loop is not closed, which can be attributed to the remnant charge
trapped at electrode interface [60]. The P-E loops observed are not symmetric about y-axis,
which can be attributed to the inability of the nanowires rotating freely in viscous polymer fluid
when the polarity of electric field changes.
The samples after curing were also tested under different electric field amplitudes and
frequencies. The voltage amplitude was changed from 5V to 25V with 5V intervals using six
sweep frequencies, 0.1Hz, 1Hz, 10Hz, 100Hz, 1kHz, and 10kHz. The net polarization increases
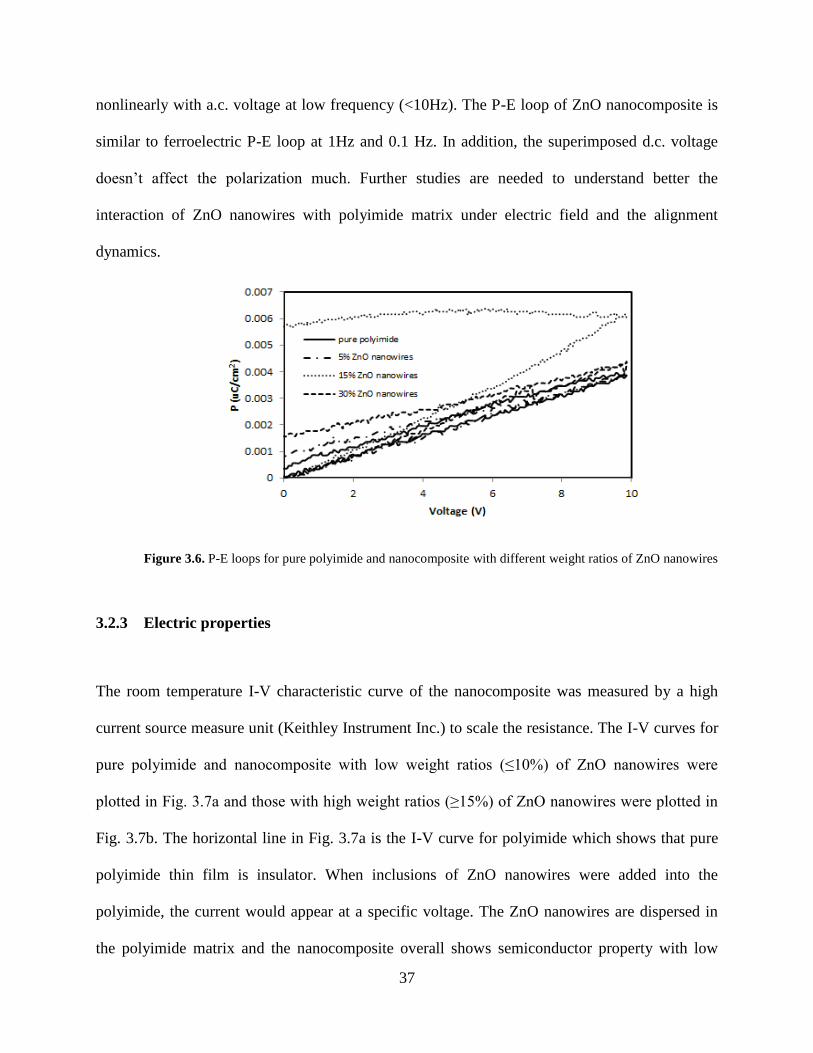
37
nonlinearly with a.c. voltage at low frequency (<10Hz). The P-E loop of ZnO nanocomposite is
similar to ferroelectric P-E loop at 1Hz and 0.1 Hz. In addition, the superimposed d.c. voltage
doesn’t affect the polarization much. Further studies are needed to understand better the
interaction of ZnO nanowires with polyimide matrix under electric field and the alignment
dynamics.
Figure 3.6. P-E loops for pure polyimide and nanocomposite with different weight ratios of ZnO nanowires
3.2.3 Electric properties
The room temperature I-V characteristic curve of the nanocomposite was measured by a high
current source measure unit (Keithley Instrument Inc.) to scale the resistance. The I-V curves for
pure polyimide and nanocomposite with low weight ratios (≤10%) of ZnO nanowires were
plotted in Fig. 3.7a and those with high weight ratios (≥15%) of ZnO nanowires were plotted in
Fig. 3.7b. The horizontal line in Fig. 3.7a is the I-V curve for polyimide which shows that pure
polyimide thin film is insulator. When inclusions of ZnO nanowires were added into the
polyimide, the current would appear at a specific voltage. The ZnO nanowires are dispersed in
the polyimide matrix and the nanocomposite overall shows semiconductor property with low
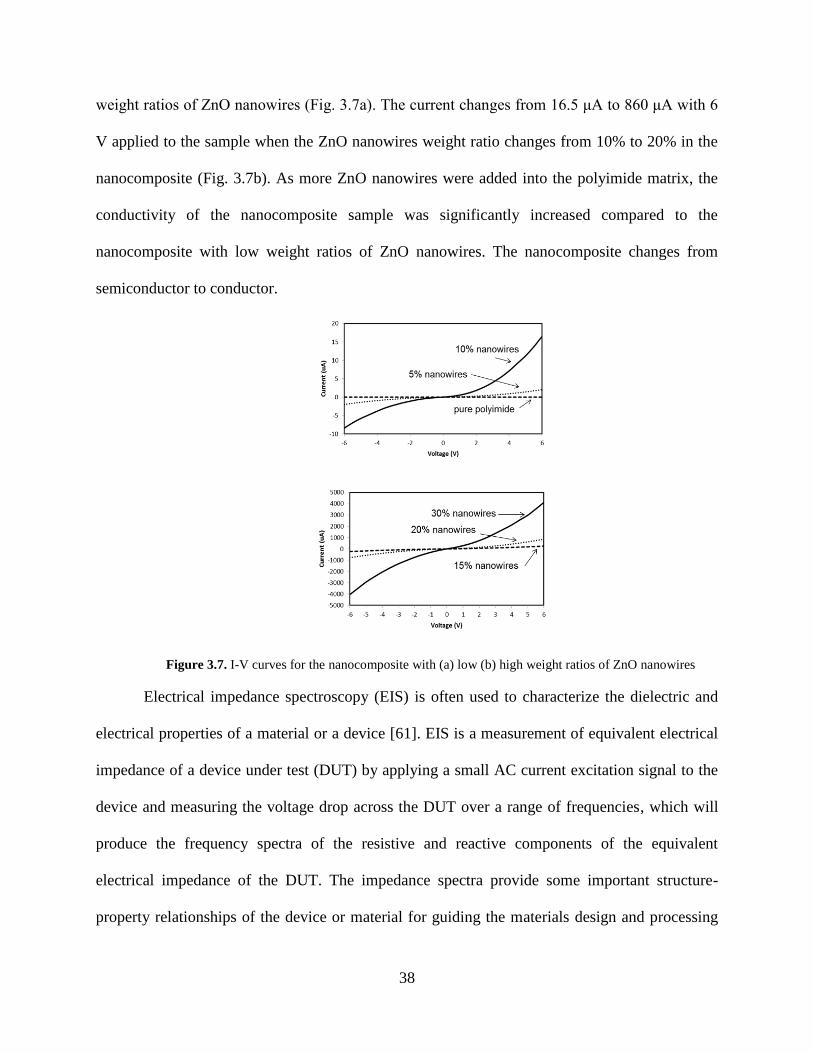
38
weight ratios of ZnO nanowires (Fig. 3.7a). The current changes from 16.5 μA to 860 μA with 6
V applied to the sample when the ZnO nanowires weight ratio changes from 10% to 20% in the
nanocomposite (Fig. 3.7b). As more ZnO nanowires were added into the polyimide matrix, the
conductivity of the nanocomposite sample was significantly increased compared to the
nanocomposite with low weight ratios of ZnO nanowires. The nanocomposite changes from
semiconductor to conductor.
Figure 3.7. I-V curves for the nanocomposite with (a) low (b) high weight ratios of ZnO nanowires
Electrical impedance spectroscopy (EIS) is often used to characterize the dielectric and
electrical properties of a material or a device [61]. EIS is a measurement of equivalent electrical
impedance of a device under test (DUT) by applying a small AC current excitation signal to the
device and measuring the voltage drop across the DUT over a range of frequencies, which will
produce the frequency spectra of the resistive and reactive components of the equivalent
electrical impedance of the DUT. The impedance spectra provide some important structure-
property relationships of the device or material for guiding the materials design and processing
39
for device applications. EIS can also be used to establish common equivalent circuit models of
the sample. The model parameters can be extracted from the complex impedance values. The
equivalent circuit models and model parameters together are useful in the sample analysis and
modification.
Data obtained from EIS are usually expressed graphically in a complex impedance plot or
Cole-Cole plot [62]. In a complex impedance plot, the impedance is plotted as a function of the
log frequency on the X-axis, showing the absolute values of both the resistance and the reactance
on the Y-axis. If the resistance value is plotted on the X-axis and the negative reactance value is
plotted on the Y-axis of a chart, a Cole-Cole plot is generated. Low frequency data are on the
right side and high frequency data are on the left side of the chart for an ordinary Cole-Cole plot.
EIS measurement for the ZnO nanocomposites was performed by using an impedance analyzer
(Agilent 4294A). The Cole-Cole plot for the nanocomposites with 15%, 20% and 30% weight
ratios of ZnO nanowires was shown in Fig. 3.8.
Figure 3.8. Cole-Cole plot for the nanocomposites with different weight ratios of ZnO nanowires
From the Cole-Cole plot of EIS, many useful data can be obtained. The maximum ReZ
value (ReZ at the lowest frequency, or dc resistance) represents the summation of the series
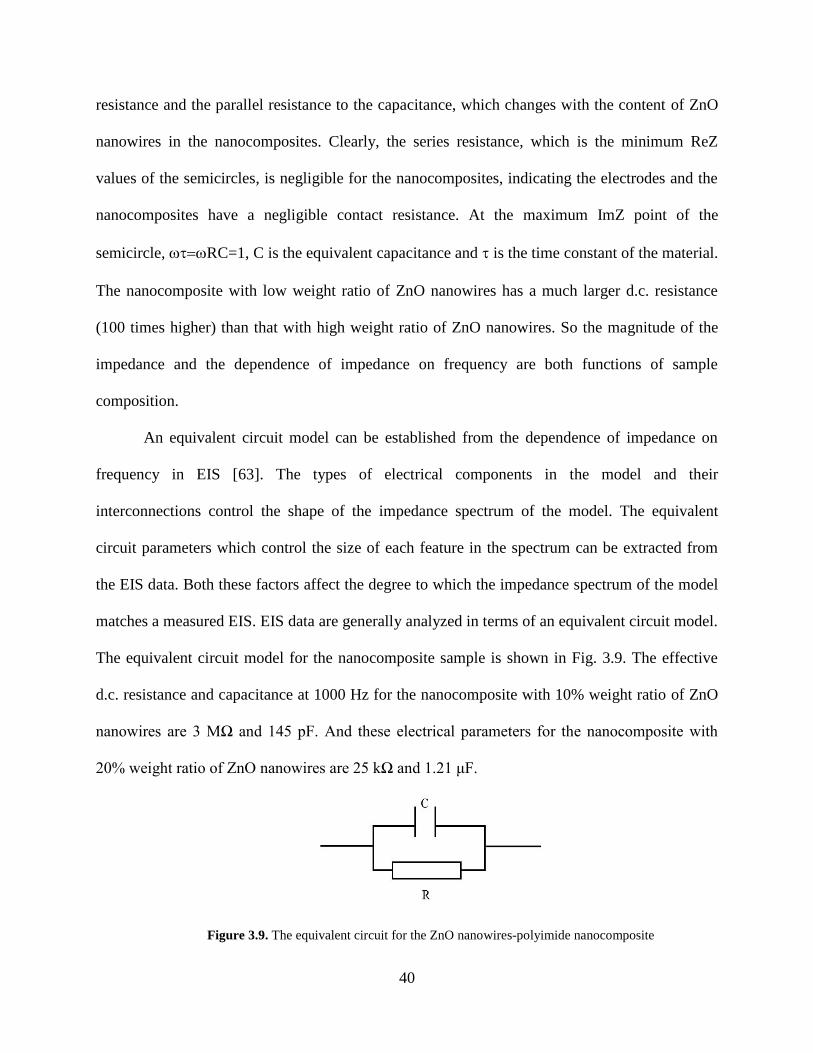
40
resistance and the parallel resistance to the capacitance, which changes with the content of ZnO
nanowires in the nanocomposites. Clearly, the series resistance, which is the minimum ReZ
values of the semicircles, is negligible for the nanocomposites, indicating the electrodes and the
nanocomposites have a negligible contact resistance. At the maximum ImZ point of the
semicircle, RC=1, C is the equivalent capacitance and is the time constant of the material.
The nanocomposite with low weight ratio of ZnO nanowires has a much larger d.c. resistance
(100 times higher) than that with high weight ratio of ZnO nanowires. So the magnitude of the
impedance and the dependence of impedance on frequency are both functions of sample
composition.
An equivalent circuit model can be established from the dependence of impedance on
frequency in EIS [63]. The types of electrical components in the model and their
interconnections control the shape of the impedance spectrum of the model. The equivalent
circuit parameters which control the size of each feature in the spectrum can be extracted from
the EIS data. Both these factors affect the degree to which the impedance spectrum of the model
matches a measured EIS. EIS data are generally analyzed in terms of an equivalent circuit model.
The equivalent circuit model for the nanocomposite sample is shown in Fig. 3.9. The effective
d.c. resistance and capacitance at 1000 Hz for the nanocomposite with 10% weight ratio of ZnO
nanowires are 3 MΩ and 145 pF. And these electrical parameters for the nanocomposite with
20% weight ratio of ZnO nanowires are 25 kΩ and 1.21 μF.
Figure 3.9. The equivalent circuit for the ZnO nanowires-polyimide nanocomposite
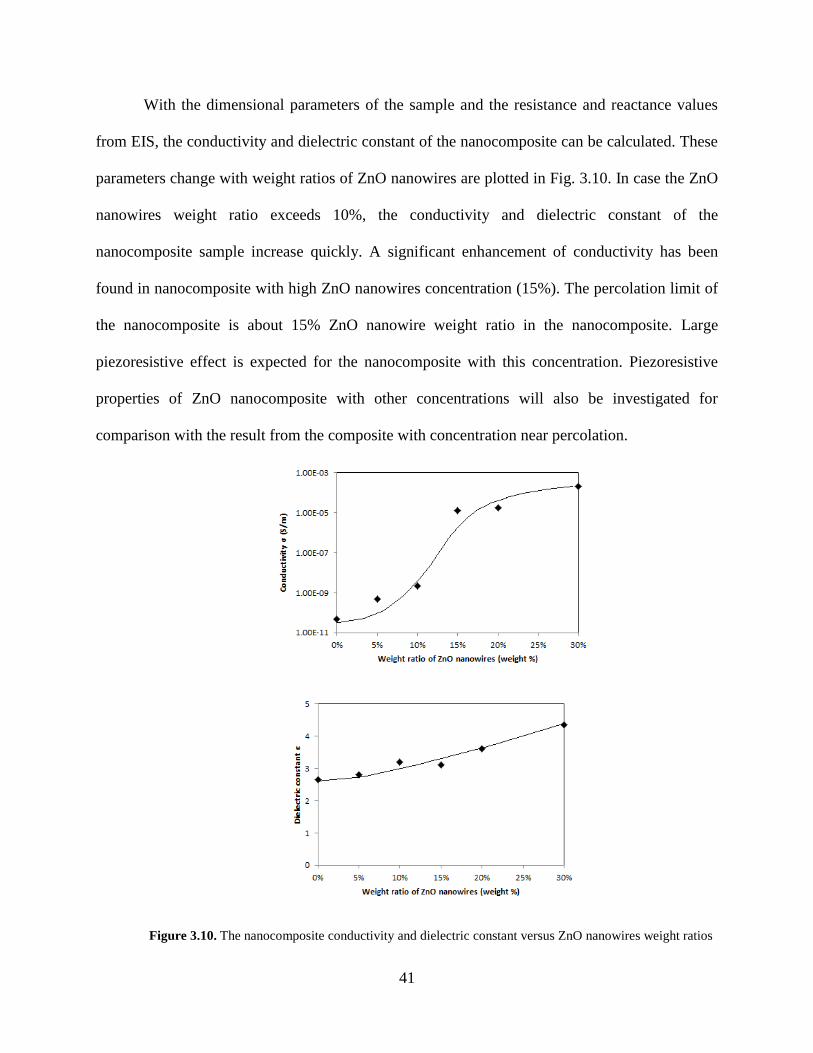
41
With the dimensional parameters of the sample and the resistance and reactance values
from EIS, the conductivity and dielectric constant of the nanocomposite can be calculated. These
parameters change with weight ratios of ZnO nanowires are plotted in Fig. 3.10. In case the ZnO
nanowires weight ratio exceeds 10%, the conductivity and dielectric constant of the
nanocomposite sample increase quickly. A significant enhancement of conductivity has been
found in nanocomposite with high ZnO nanowires concentration (15%). The percolation limit of
the nanocomposite is about 15% ZnO nanowire weight ratio in the nanocomposite. Large
piezoresistive effect is expected for the nanocomposite with this concentration. Piezoresistive
properties of ZnO nanocomposite with other concentrations will also be investigated for
comparison with the result from the composite with concentration near percolation.
Figure 3.10. The nanocomposite conductivity and dielectric constant versus ZnO nanowires weight ratios
42
3.3 ZNO NANOWIRES-POLYIMIDE NANOCOMPOSITE PIEZORESISTIVE
STRAIN SENSOR
3.3.1 Strain measurement methods
Polymer-based nanocomposites are becoming an attractive set of organic-inorganic materials.
Due to their structural flexibility, easiness in processing, and possibility of combining multi-
functionality, polymer matrix nanocomposites with improved sensing and actuation capability
are highly desirable for many smart materials and structure applications [51, 52]. Such examples
include piezoresistive sensors and piezoelectric transducers used for structural health monitoring
and vibration control in numerous industrial, civil, medical and aerospace fields. Real time
monitoring of mechanical strain/stress variation is needed to ensure the reliability of the
structures in these applications. The incorporation of functional nanocomposite and devices into
the mechanical structures becomes a natural approach, in which the electrical property of the
nanocomposite device changes with the stress/strain condition, providing the transduction
mechanism to characterize the structural response to the loading situation. Conventionally, strain
(or displacement) response in a mechanical structure can be characterized by various techniques,
which can be grouped into two categories: the noncontact methods and contact methods [64].
In the case that noncontact methods such as the laser strain micrometry are used, two
laser beams are needed to focus on the opposite faces of the sample for the out-of-plane strain
measurement. Furthermore, the laser beam should be reflected at the ends of the structure or
sample in characterizing the transverse strain response of them. The major benefit for this
method is its non-contact nature. The measurement results of the laser are very accurate based on
the requirements that the laser beam is aligned properly and the measured surface of the sample
43
can reflect enough light. However, a laser instrument is usually too bulky to be easily carried on
and the technique is so delicate that laboratory conditions are required for its use. Furthermore,
flexural vibration mode in the structure may be excited in the strain measurement for thin and
soft sample, which will cause errors to the final result [65]. An optical microscope is another
noncontact instrument which can only characterize the strain response at low strain response
region for its limited resolution [66].
The contact methods such as a differential capacitive sensor or a linear variable
differential transformer (LVDT) have been developed for strain/displacement measurement.
These two techniques measure either the output voltage of two differential parallel plate
capacitors or that of two differential transformers to reflect the structure displacement change.
But complex circuit requirements and sensitivity to vibration keep these two methods from being
very practical for strain measurement. In the situation that a strain gauge is used and it will not
affect the original structure, the strain of the structure can be acquired by measuring the electric
voltage change in the strain gauge with external stress exerted on the structure. Piezoresistive
and piezoelectric materials are commonly used for strain sensors and vibration sensors. Several
piezoresistive materials, such as metal film, single-crystal silicon and polycrystalline silicon,
have been widely used to characterize static or dynamic strain variations in mechanical or civil
structures [67]. A piezoresistive material is usually sandwiched between two insulation layers to
fabricate a strain sensor. Adhesives are used to attach the strain sensor to the host structure prior
to measurement. This method is very simple for large structures but may not be suitable for small
ones. The size of the strain sensor and even the thickness of the adhesives can influence the
behavior of small structures under test. So small strain sensors are expected to minimize their
effects to the structure, yet still provide high sensing resolution.
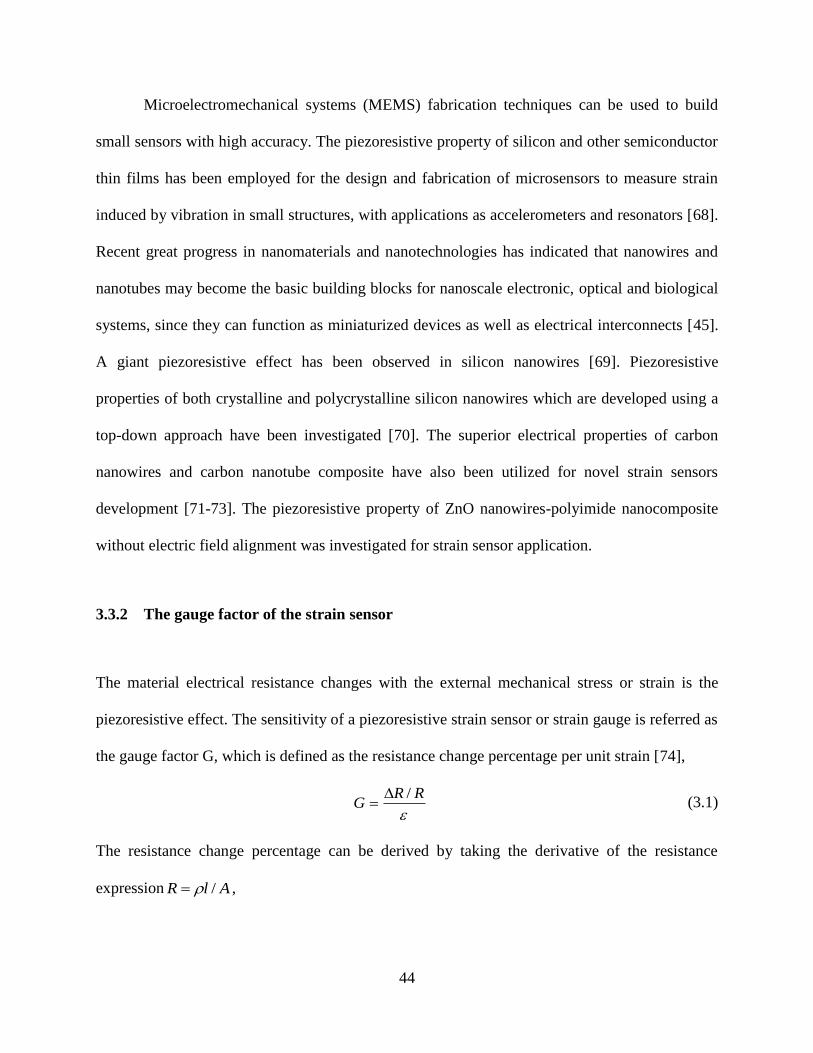
44
Microelectromechanical systems (MEMS) fabrication techniques can be used to build
small sensors with high accuracy. The piezoresistive property of silicon and other semiconductor
thin films has been employed for the design and fabrication of microsensors to measure strain
induced by vibration in small structures, with applications as accelerometers and resonators [68].
Recent great progress in nanomaterials and nanotechnologies has indicated that nanowires and
nanotubes may become the basic building blocks for nanoscale electronic, optical and biological
systems, since they can function as miniaturized devices as well as electrical interconnects [45].
A giant piezoresistive effect has been observed in silicon nanowires [69]. Piezoresistive
properties of both crystalline and polycrystalline silicon nanowires which are developed using a
top-down approach have been investigated [70]. The superior electrical properties of carbon
nanowires and carbon nanotube composite have also been utilized for novel strain sensors
development [71-73]. The piezoresistive property of ZnO nanowires-polyimide nanocomposite
without electric field alignment was investigated for strain sensor application.
3.3.2 The gauge factor of the strain sensor
The material electrical resistance changes with the external mechanical stress or strain is the
piezoresistive effect. The sensitivity of a piezoresistive strain sensor or strain gauge is referred as
the gauge factor G, which is defined as the resistance change percentage per unit strain [74],
RRG
/ (3.1)
The resistance change percentage can be derived by taking the derivative of the resistance
expression AlR / ,
45
)(A
A
l
l
R
R
(3.2)
where l , A , and are the strain gauge length, cross-section area and resistivity, respectively.
The cross-section area change percentage can be written as
1)1( 2
A
A (3.3)
where is the Poisson’s ratio of the substrate material. Because the strain varies in a small range,
a linear approximation can be applied to this equation,
2
A
A (3.4)
and the resistance change percentage can be expressed as
l
l
R
R)21( (3.5)
So the gauge factor from the definition can be acquired
lG )21( (3.6)
where l is the longitude piezoresistive coefficient.
Wheatstone bridge circuits are usually utilized for the resistance change measurement
and several variations of Wheatstone bridge circuits have been developed for applications under
different circumstances. Four resistors connected in a loop form a basic bridge configuration. An
input voltage is applied across two junctions with two resistors connecting them. The output is
the voltage difference across the other two junctions. One or more resistors in the bridge loop
may work as the strain sensing resistors, whose resistances will change with the external
variables [67]. If only one resistor is used as variable, the other resistors can be located in special
regions without any strain. One of the configurations with only one piezoresistor implemented
into the Wheatstone bridge circuit was shown in Fig. 3.11. When the sensor resistance changes
46
with external force due to piezoresistive effect, the voltage between the voltage divider will also
change with it. If this voltage change is compared with the original value, the resistance change
and the amount of strain can be calculated [64].
Figure 3.11. One type of Wheatstone bridge circuit for resistance measurement
The output voltage can be related to the input voltage by the following equation [67],
inout VRR
R
RR
RV )(
43
4
21
2
(3.7)
All four resistors have the same resistance value R in many practical applications and the
resistance of the variable resistor (strain sensor) can be represented as
RRR ' (3.8)
So the output voltage and the input voltage have the following linear relation,
inout VRR
RV )
2(
(3.9)
Most piezoresistors are sensitive to temperature variations and the Wheatstone bridge circuit is
an effective way to eliminate the temperature related resistance change. For all resistors in the
bridge will change resistance at the same ratio with the environmental temperature, the
temperature effects from every part will cancel each other.
If the strain sensor is used for the cantilever beam strain measurement, the strain sensor
will be bonded onto the clamped end of the cantilever beam. A static force can be applied at the
47
free end of the cantilever beam for strain generation. The dynamic strain in the cantilever beam
can also be inspected by applying an impulse or a sinusoidal force to the free end of the
cantilever beam to generate an excited vibration of it. Both of these two methods are based on
cantilever beam theory. When a force is applied to the free end of a cantilever beam, the tip
vertical deflection z can be calculated from [64],
FEI
Lz
3
3
2 (3.10)
where F , E , I and 2L are the applied force, Young’s modulus of the beam, second moment of
area for beam cross-section, effective beam length, respectively. The strain in the beam is
calculated by the following equation,
EI
tFL
2
1 (3.11)
where t and 1L are the beam thickness and the distance from the tip to the strain gauge location,
respectively. So the strain-tip vertical deflection relation can be acquired,
3
2
1
2
3
L
tzL (3.12)
The strain keeps a linear relation with the tip vertical deflection z .
3.3.3 Experimental study
The strain for the piezoresistive property measurement was generated by monotonic uniaxial
stress-strain tests. The experiment setup for measuring the gauge factor G of the nanocomposite
piezoresistive strain sensor was shown in Fig. 3.12. The polyimide substrates for spin coating the
nanocomposites were cut to long strips to obtain samples with high aspect ratio for minimizing
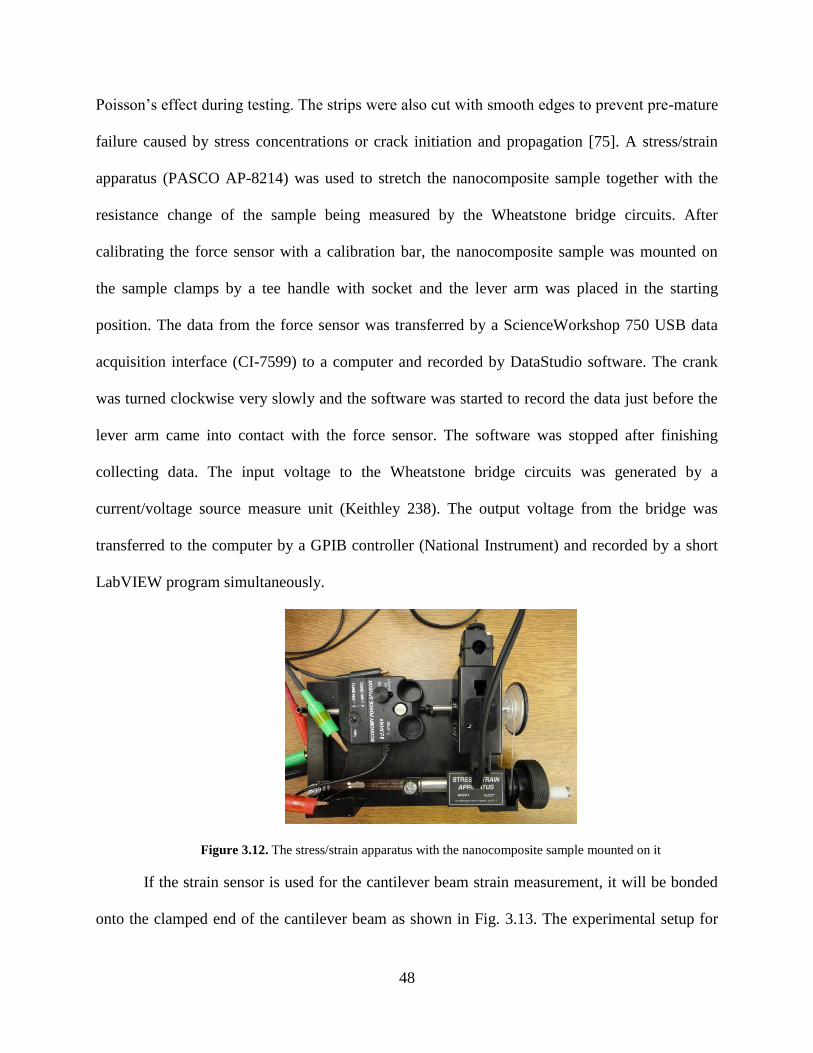
48
Poisson’s effect during testing. The strips were also cut with smooth edges to prevent pre-mature
failure caused by stress concentrations or crack initiation and propagation [75]. A stress/strain
apparatus (PASCO AP-8214) was used to stretch the nanocomposite sample together with the
resistance change of the sample being measured by the Wheatstone bridge circuits. After
calibrating the force sensor with a calibration bar, the nanocomposite sample was mounted on
the sample clamps by a tee handle with socket and the lever arm was placed in the starting
position. The data from the force sensor was transferred by a ScienceWorkshop 750 USB data
acquisition interface (CI-7599) to a computer and recorded by DataStudio software. The crank
was turned clockwise very slowly and the software was started to record the data just before the
lever arm came into contact with the force sensor. The software was stopped after finishing
collecting data. The input voltage to the Wheatstone bridge circuits was generated by a
current/voltage source measure unit (Keithley 238). The output voltage from the bridge was
transferred to the computer by a GPIB controller (National Instrument) and recorded by a short
LabVIEW program simultaneously.
Figure 3.12. The stress/strain apparatus with the nanocomposite sample mounted on it
If the strain sensor is used for the cantilever beam strain measurement, it will be bonded
onto the clamped end of the cantilever beam as shown in Fig. 3.13. The experimental setup for
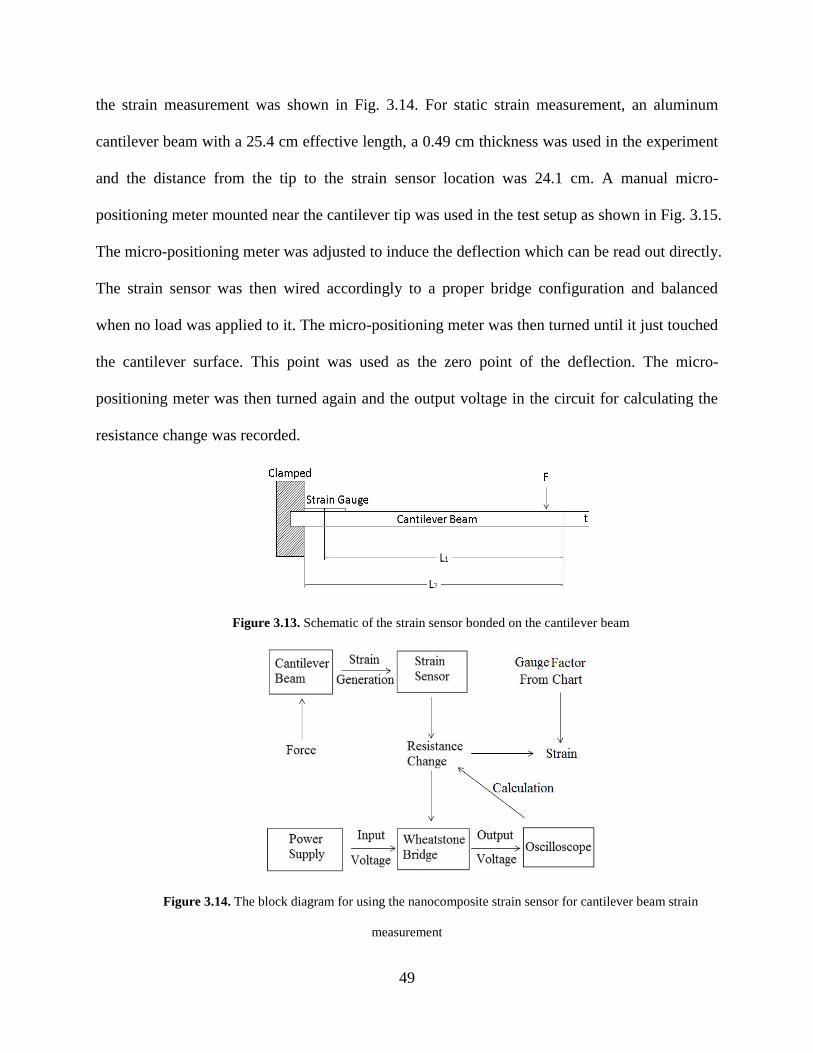
49
the strain measurement was shown in Fig. 3.14. For static strain measurement, an aluminum
cantilever beam with a 25.4 cm effective length, a 0.49 cm thickness was used in the experiment
and the distance from the tip to the strain sensor location was 24.1 cm. A manual micro-
positioning meter mounted near the cantilever tip was used in the test setup as shown in Fig. 3.15.
The micro-positioning meter was adjusted to induce the deflection which can be read out directly.
The strain sensor was then wired accordingly to a proper bridge configuration and balanced
when no load was applied to it. The micro-positioning meter was then turned until it just touched
the cantilever surface. This point was used as the zero point of the deflection. The micro-
positioning meter was then turned again and the output voltage in the circuit for calculating the
resistance change was recorded.
Figure 3.13. Schematic of the strain sensor bonded on the cantilever beam
Figure 3.14. The block diagram for using the nanocomposite strain sensor for cantilever beam strain
measurement
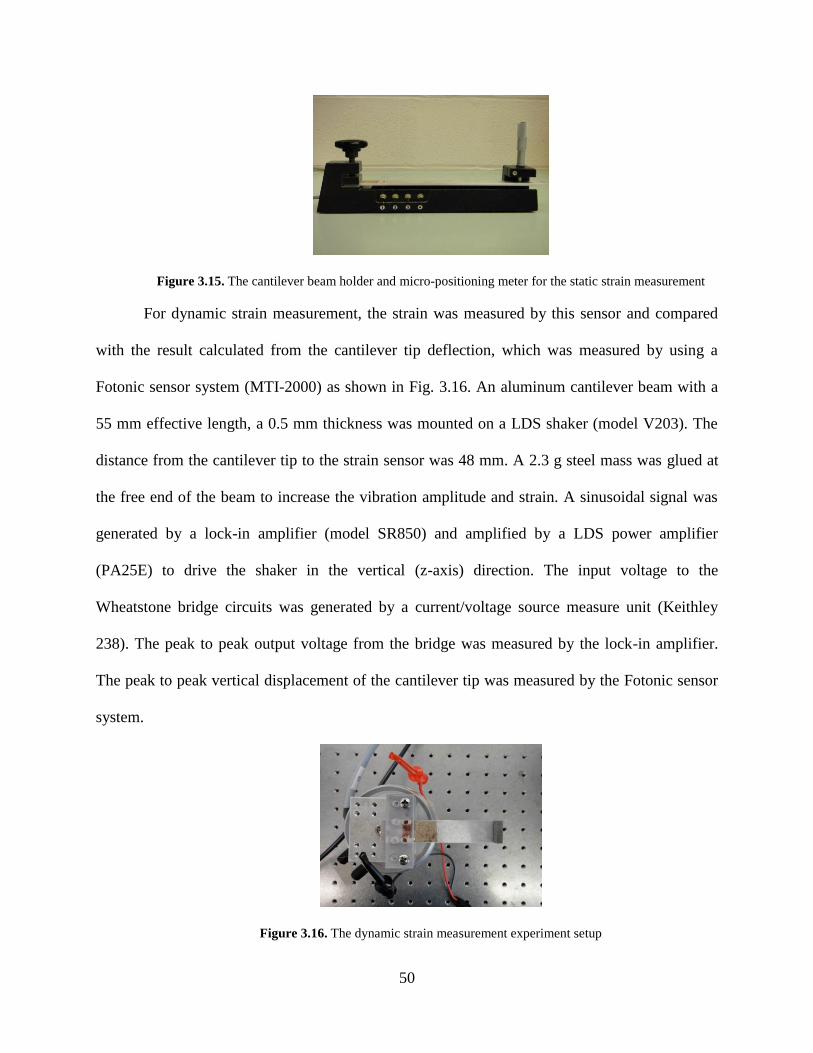
50
Figure 3.15. The cantilever beam holder and micro-positioning meter for the static strain measurement
For dynamic strain measurement, the strain was measured by this sensor and compared
with the result calculated from the cantilever tip deflection, which was measured by using a
Fotonic sensor system (MTI-2000) as shown in Fig. 3.16. An aluminum cantilever beam with a
55 mm effective length, a 0.5 mm thickness was mounted on a LDS shaker (model V203). The
distance from the cantilever tip to the strain sensor was 48 mm. A 2.3 g steel mass was glued at
the free end of the beam to increase the vibration amplitude and strain. A sinusoidal signal was
generated by a lock-in amplifier (model SR850) and amplified by a LDS power amplifier
(PA25E) to drive the shaker in the vertical (z-axis) direction. The input voltage to the
Wheatstone bridge circuits was generated by a current/voltage source measure unit (Keithley
238). The peak to peak output voltage from the bridge was measured by the lock-in amplifier.
The peak to peak vertical displacement of the cantilever tip was measured by the Fotonic sensor
system.
Figure 3.16. The dynamic strain measurement experiment setup
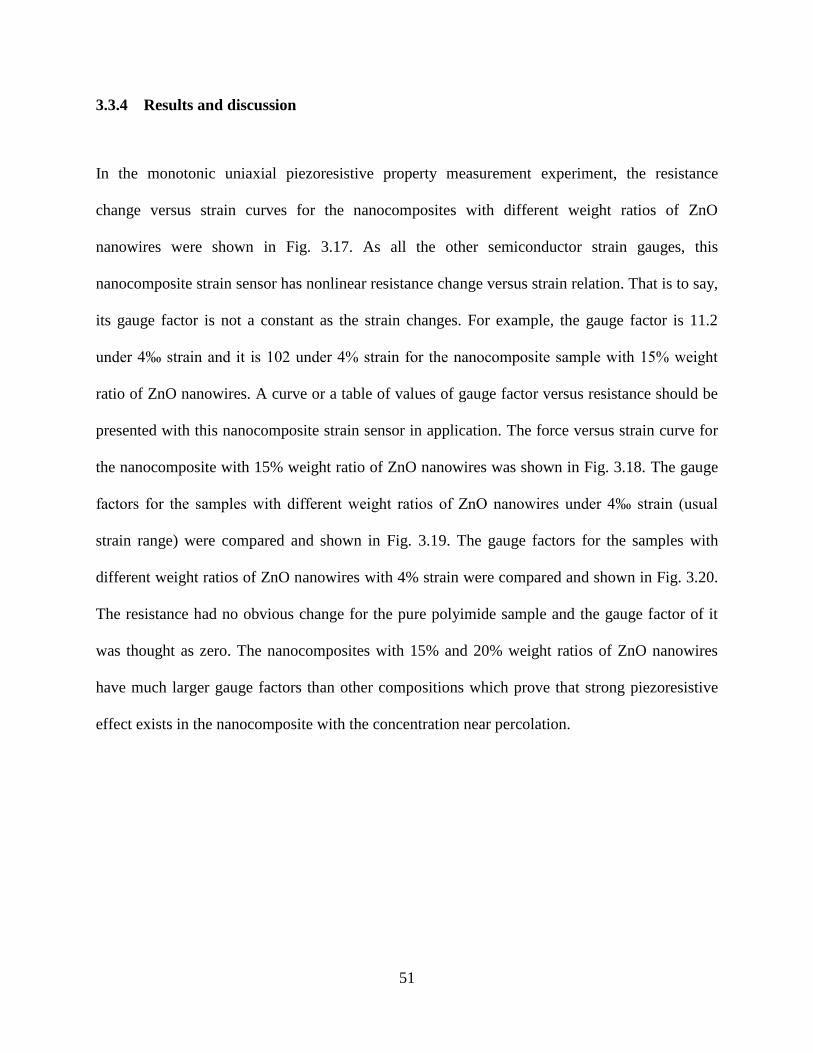
51
3.3.4 Results and discussion
In the monotonic uniaxial piezoresistive property measurement experiment, the resistance
change versus strain curves for the nanocomposites with different weight ratios of ZnO
nanowires were shown in Fig. 3.17. As all the other semiconductor strain gauges, this
nanocomposite strain sensor has nonlinear resistance change versus strain relation. That is to say,
its gauge factor is not a constant as the strain changes. For example, the gauge factor is 11.2
under 4‰ strain and it is 102 under 4% strain for the nanocomposite sample with 15% weight
ratio of ZnO nanowires. A curve or a table of values of gauge factor versus resistance should be
presented with this nanocomposite strain sensor in application. The force versus strain curve for
the nanocomposite with 15% weight ratio of ZnO nanowires was shown in Fig. 3.18. The gauge
factors for the samples with different weight ratios of ZnO nanowires under 4‰ strain (usual
strain range) were compared and shown in Fig. 3.19. The gauge factors for the samples with
different weight ratios of ZnO nanowires with 4% strain were compared and shown in Fig. 3.20.
The resistance had no obvious change for the pure polyimide sample and the gauge factor of it
was thought as zero. The nanocomposites with 15% and 20% weight ratios of ZnO nanowires
have much larger gauge factors than other compositions which prove that strong piezoresistive
effect exists in the nanocomposite with the concentration near percolation.
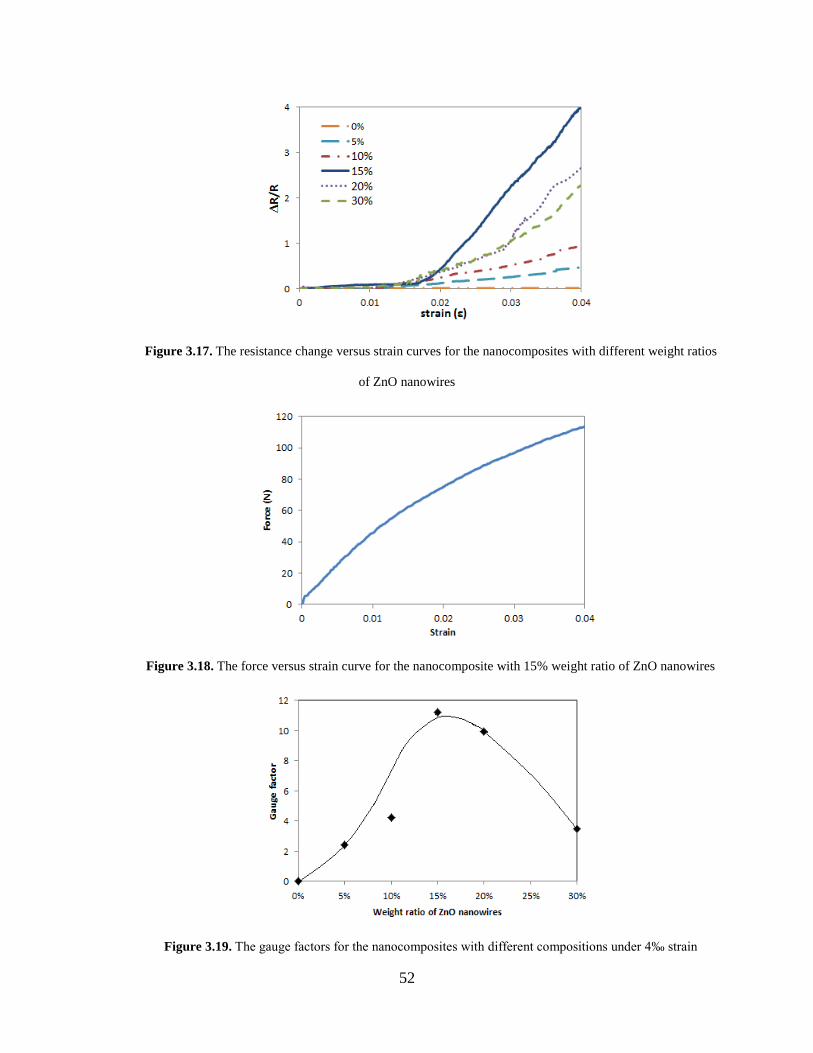
52
Figure 3.17. The resistance change versus strain curves for the nanocomposites with different weight ratios
of ZnO nanowires
Figure 3.18. The force versus strain curve for the nanocomposite with 15% weight ratio of ZnO nanowires
Figure 3.19. The gauge factors for the nanocomposites with different compositions under 4‰ strain
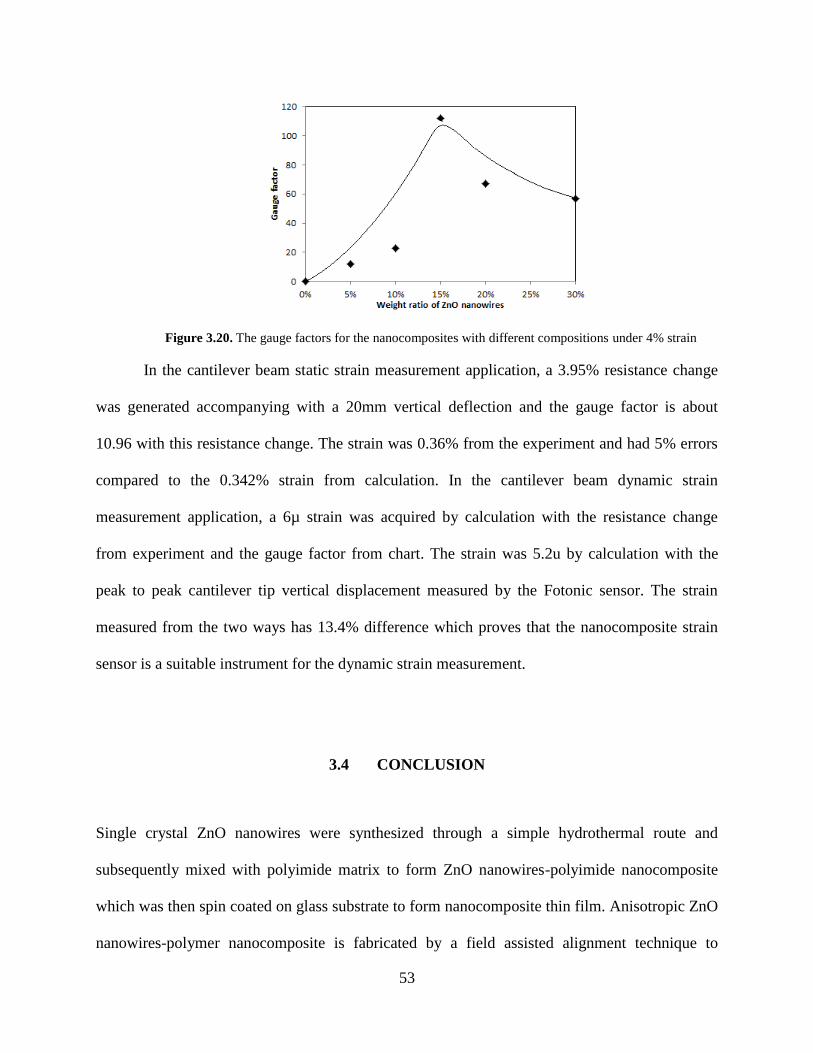
53
Figure 3.20. The gauge factors for the nanocomposites with different compositions under 4% strain
In the cantilever beam static strain measurement application, a 3.95% resistance change
was generated accompanying with a 20mm vertical deflection and the gauge factor is about
10.96 with this resistance change. The strain was 0.36% from the experiment and had 5% errors
compared to the 0.342% strain from calculation. In the cantilever beam dynamic strain
measurement application, a 6µ strain was acquired by calculation with the resistance change
from experiment and the gauge factor from chart. The strain was 5.2u by calculation with the
peak to peak cantilever tip vertical displacement measured by the Fotonic sensor. The strain
measured from the two ways has 13.4% difference which proves that the nanocomposite strain
sensor is a suitable instrument for the dynamic strain measurement.
3.4 CONCLUSION
Single crystal ZnO nanowires were synthesized through a simple hydrothermal route and
subsequently mixed with polyimide matrix to form ZnO nanowires-polyimide nanocomposite
which was then spin coated on glass substrate to form nanocomposite thin film. Anisotropic ZnO
nanowires-polymer nanocomposite is fabricated by a field assisted alignment technique to
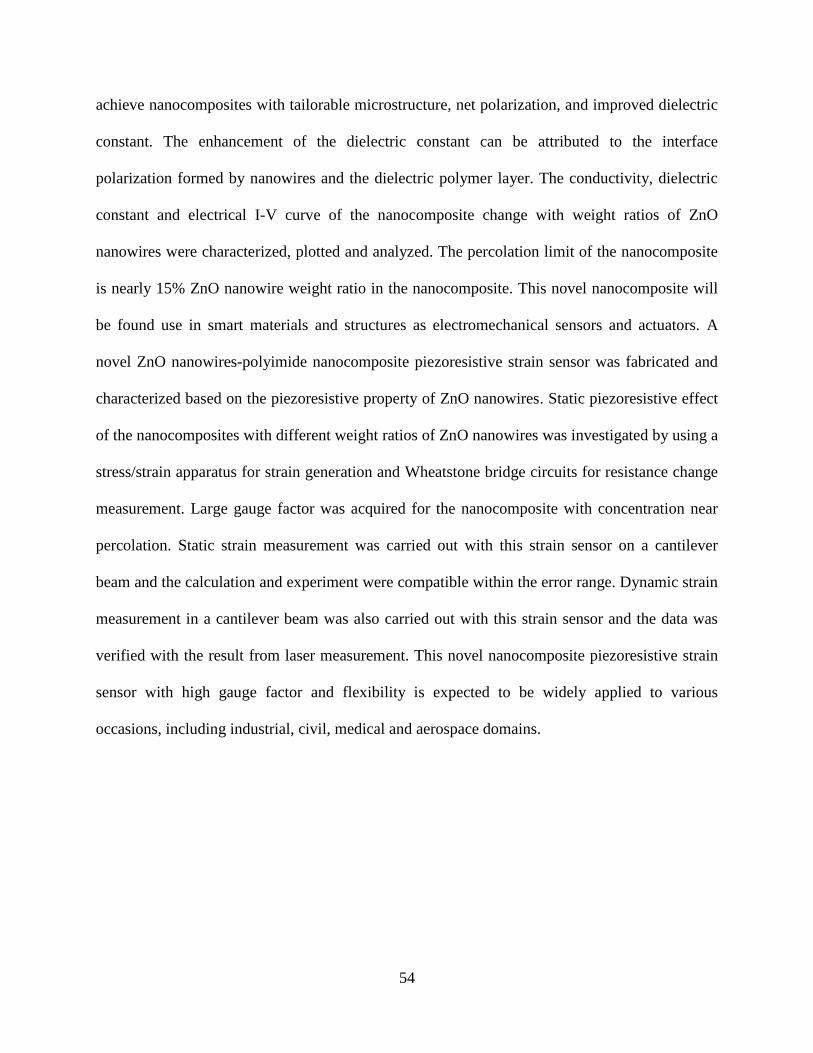
54
achieve nanocomposites with tailorable microstructure, net polarization, and improved dielectric
constant. The enhancement of the dielectric constant can be attributed to the interface
polarization formed by nanowires and the dielectric polymer layer. The conductivity, dielectric
constant and electrical I-V curve of the nanocomposite change with weight ratios of ZnO
nanowires were characterized, plotted and analyzed. The percolation limit of the nanocomposite
is nearly 15% ZnO nanowire weight ratio in the nanocomposite. This novel nanocomposite will
be found use in smart materials and structures as electromechanical sensors and actuators. A
novel ZnO nanowires-polyimide nanocomposite piezoresistive strain sensor was fabricated and
characterized based on the piezoresistive property of ZnO nanowires. Static piezoresistive effect
of the nanocomposites with different weight ratios of ZnO nanowires was investigated by using a
stress/strain apparatus for strain generation and Wheatstone bridge circuits for resistance change
measurement. Large gauge factor was acquired for the nanocomposite with concentration near
percolation. Static strain measurement was carried out with this strain sensor on a cantilever
beam and the calculation and experiment were compatible within the error range. Dynamic strain
measurement in a cantilever beam was also carried out with this strain sensor and the data was
verified with the result from laser measurement. This novel nanocomposite piezoresistive strain
sensor with high gauge factor and flexibility is expected to be widely applied to various
occasions, including industrial, civil, medical and aerospace domains.
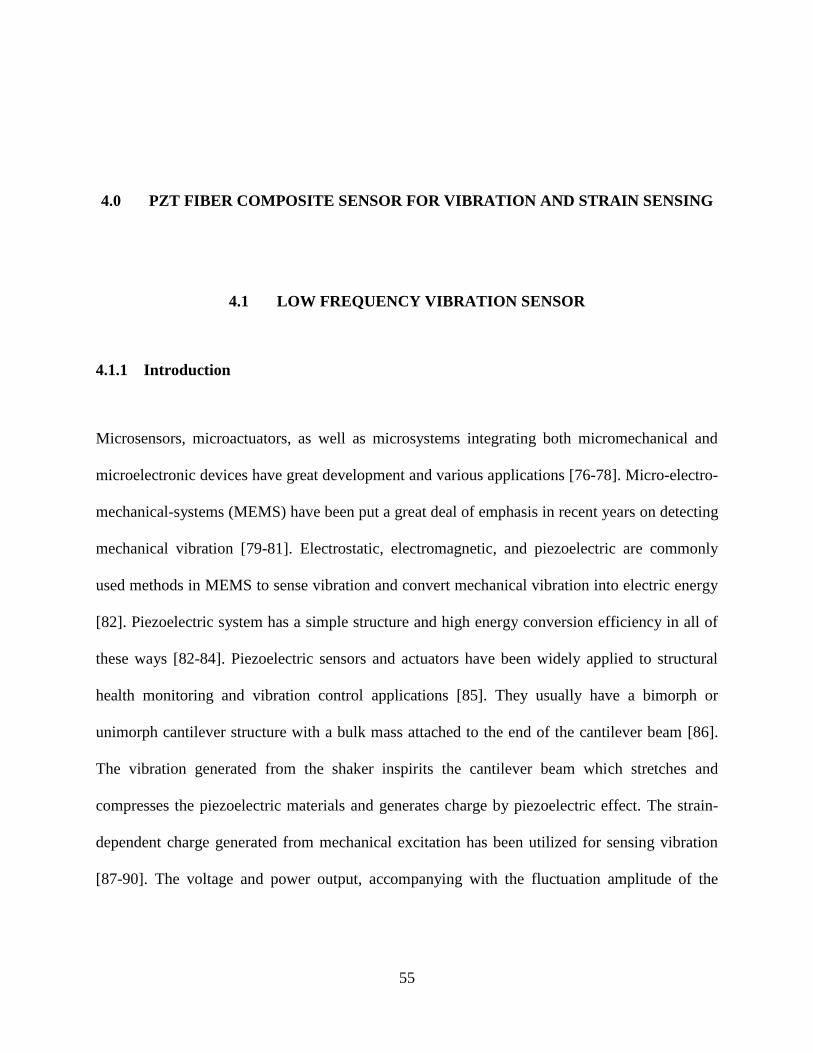
55
4.0 PZT FIBER COMPOSITE SENSOR FOR VIBRATION AND STRAIN SENSING
4.1 LOW FREQUENCY VIBRATION SENSOR
4.1.1 Introduction
Microsensors, microactuators, as well as microsystems integrating both micromechanical and
microelectronic devices have great development and various applications [76-78]. Micro-electro-
mechanical-systems (MEMS) have been put a great deal of emphasis in recent years on detecting
mechanical vibration [79-81]. Electrostatic, electromagnetic, and piezoelectric are commonly
used methods in MEMS to sense vibration and convert mechanical vibration into electric energy
[82]. Piezoelectric system has a simple structure and high energy conversion efficiency in all of
these ways [82-84]. Piezoelectric sensors and actuators have been widely applied to structural
health monitoring and vibration control applications [85]. They usually have a bimorph or
unimorph cantilever structure with a bulk mass attached to the end of the cantilever beam [86].
The vibration generated from the shaker inspirits the cantilever beam which stretches and
compresses the piezoelectric materials and generates charge by piezoelectric effect. The strain-
dependent charge generated from mechanical excitation has been utilized for sensing vibration
[87-90]. The voltage and power output, accompanying with the fluctuation amplitude of the
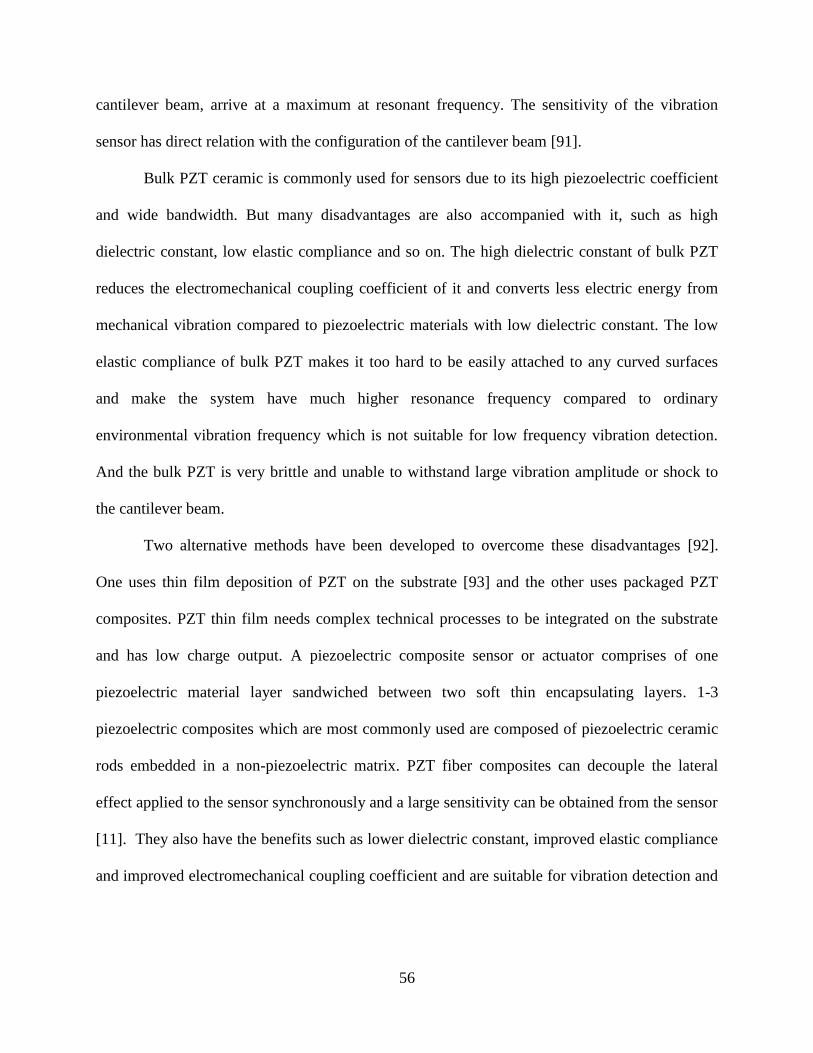
56
cantilever beam, arrive at a maximum at resonant frequency. The sensitivity of the vibration
sensor has direct relation with the configuration of the cantilever beam [91].
Bulk PZT ceramic is commonly used for sensors due to its high piezoelectric coefficient
and wide bandwidth. But many disadvantages are also accompanied with it, such as high
dielectric constant, low elastic compliance and so on. The high dielectric constant of bulk PZT
reduces the electromechanical coupling coefficient of it and converts less electric energy from
mechanical vibration compared to piezoelectric materials with low dielectric constant. The low
elastic compliance of bulk PZT makes it too hard to be easily attached to any curved surfaces
and make the system have much higher resonance frequency compared to ordinary
environmental vibration frequency which is not suitable for low frequency vibration detection.
And the bulk PZT is very brittle and unable to withstand large vibration amplitude or shock to
the cantilever beam.
Two alternative methods have been developed to overcome these disadvantages [92].
One uses thin film deposition of PZT on the substrate [93] and the other uses packaged PZT
composites. PZT thin film needs complex technical processes to be integrated on the substrate
and has low charge output. A piezoelectric composite sensor or actuator comprises of one
piezoelectric material layer sandwiched between two soft thin encapsulating layers. 1-3
piezoelectric composites which are most commonly used are composed of piezoelectric ceramic
rods embedded in a non-piezoelectric matrix. PZT fiber composites can decouple the lateral
effect applied to the sensor synchronously and a large sensitivity can be obtained from the sensor
[11]. They also have the benefits such as lower dielectric constant, improved elastic compliance
and improved electromechanical coupling coefficient and are suitable for vibration detection and
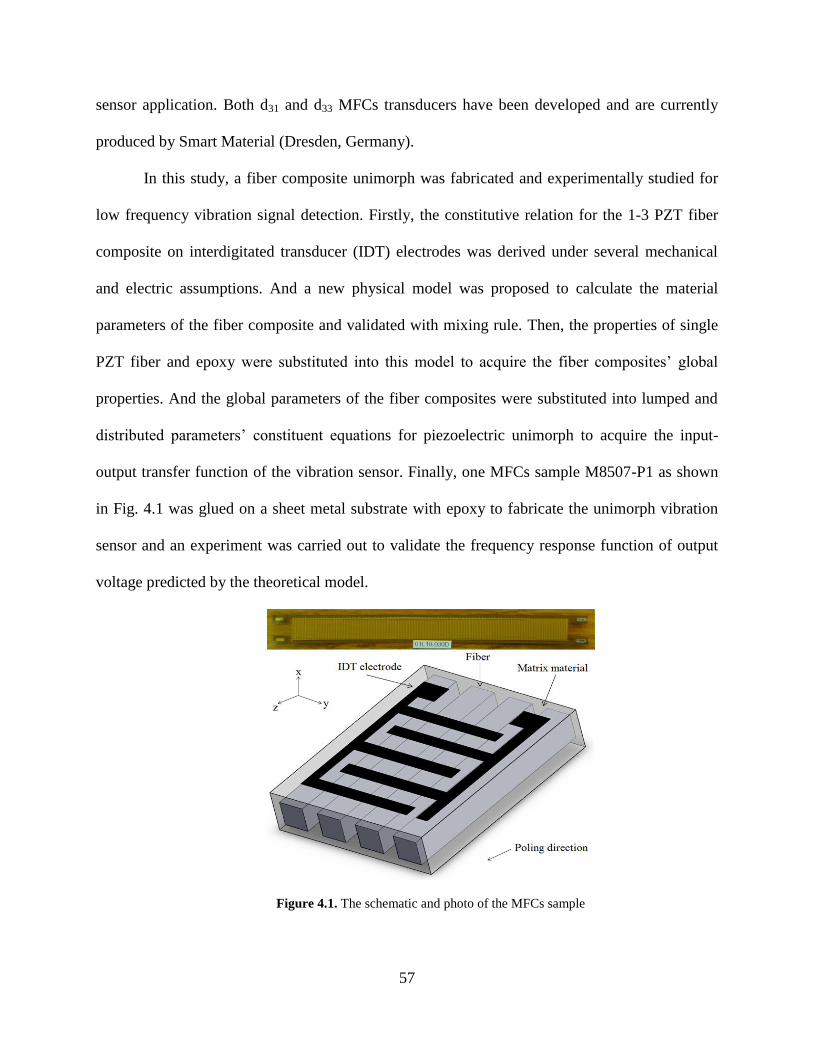
57
sensor application. Both d31 and d33 MFCs transducers have been developed and are currently
produced by Smart Material (Dresden, Germany).
In this study, a fiber composite unimorph was fabricated and experimentally studied for
low frequency vibration signal detection. Firstly, the constitutive relation for the 1-3 PZT fiber
composite on interdigitated transducer (IDT) electrodes was derived under several mechanical
and electric assumptions. And a new physical model was proposed to calculate the material
parameters of the fiber composite and validated with mixing rule. Then, the properties of single
PZT fiber and epoxy were substituted into this model to acquire the fiber composites’ global
properties. And the global parameters of the fiber composites were substituted into lumped and
distributed parameters’ constituent equations for piezoelectric unimorph to acquire the input-
output transfer function of the vibration sensor. Finally, one MFCs sample M8507-P1 as shown
in Fig. 4.1 was glued on a sheet metal substrate with epoxy to fabricate the unimorph vibration
sensor and an experiment was carried out to validate the frequency response function of output
voltage predicted by the theoretical model.
Figure 4.1. The schematic and photo of the MFCs sample
58
4.1.2 Constitutive relations of in-plane PZT-fiber composite
A physical model will be briefly presented here for the material parameters of the 1-3 PZT fiber
composite on interdigitated transducer (IDT) electrodes. To describe the in-plane longitudinal
vibration of the fiber composite, the effective constitutive relations for this homogeneous
medium will be derived. The strain and electric field are chosen as the independent coordinates
and the composite plate is laid in the y-z plane with the fibers lying along the z axes. The
constitutive relations for the composite will give the stress and electric displacement for every
point in the plate. Several approximations will be utilized to simplify the analysis and extract the
essential physics. During ordinary excitation of the fiber composite, the shear mode vibration is
thought to be suppressed and will not be coupled with the normal mode vibration. In an average
sense, the electric field is independent of x and y coordinates throughout the individual phases.
And the x and y components of the electric fields are thought to be zero for the longitudinal
vibration modeling. The piezoelectric ceramic is poled along the fiber direction, and the
constitutive relations in the ceramic phase are [9],
3313132121111 EeScScScT EEE (4.1a)
3313132111122 EeScScScT EEE (4.1b)
3333332131133 EeScScScT EEE (4.1c)
3333332311313 ESeSeSeD S (4.1d)
The elastic and dielectric constants of the ceramic phase will be distinguished from those
of the polymer phase by the superscripts E and S, respectively. The stress, strain, field, and
displacement in the different phases will be distinguished by a superscript p for the polymer
phase and a superscript c for the ceramic phase in the following expressions. In the y direction,
59
the two different phases have the same stress value but opposite signs and strain will be replaced
by stress as the independent coordinate for expressing essential physics meaning reasonably. The
constitutive relations within the ceramic phase will be changed to [94],
c
E
EEc
E
EEEEc
E
Ec
E
EEEEc E
c
ececS
c
ccccT
c
cS
c
ccccT 3
11
311131123
11
121311132
11
121
11
121211111
(4.2a)
c
E
c
E
Ec
E
c
E
Ec E
c
eS
c
cT
cS
c
cS 3
11
313
11
132
11
1
11
122
1 (4.2b)
c
E
EEc
E
EEEEc
E
Ec
E
EEEEc E
c
ececS
c
ccccT
c
cS
c
ccccT 3
11
33113113
3
11
13131133
2
11
13
1
11
12131113
3
(4.2c)
c
E
SEc
E
EEc
E
c
E
EEc E
c
ceeS
c
ececT
c
eS
c
ececD 3
11
331131313
11
311333112
11
311
11
311231113
(4.2d)
The strains are the same in ceramic and polymer during longitudinal vibration along the z
direction when the composite has such fine spatial scale that stop-band resonances are at much
higher frequencies than the longitudinal resonance.
333 SSS cp (4.3)
The electric fields are also the same in both phases for the composite are applied voltage by IDT
and equipotential.
333 EEE cp (4.4)
Along x direction, the composite as a whole moves together and the strains are the same in both
phases. The lateral stresses are equal in both phases along y direction. These are the lateral
interaction conditions between the phases.
111 SSS cp (4.5)
222 TTT cp (4.6)

60
Since the lateral periodicity is sufficiently fine, the effective total stress along x or z
direction, total strain along y direction and total electric displacement along z direction can be
acquired by averaging the contributions of the constituent phases. The average value is the sum
of values in the two phases, where the contribution for each phase is in proportion to the volume
fraction of each phase.
pc TTT 111 )1( (4.7a)
pc SSS 222 )1( (4.7b)
pc TTT 333 )1( (4.7c)
pc DDD 333 )1( (4.7d)
where υ and (1- υ) are the volume fractions of ceramic and polymer in the composite.
Equation (4.7) can be written in a matrix format when the combinations for all variables
are simultaneously carried out,
3
3
2
1
3
3
2
1
3
3
2
1
))1((
E
S
T
S
A
E
S
T
S
AA
D
T
S
T
pc (4.8)
where cA is the coefficient matrix for the ceramic phase and pA is the coefficient matrix for the
polymer phase from equation (4.2). A is the combined coefficient matrix of the two phases.
Equation (4.8) can be rewritten in the original form,
3
3
2
1
33333231
33332313
32232212
31131211
3
3
2
1
E
S
S
S
eee
eccc
eccc
eccc
D
T
T
T
A
(4.9)
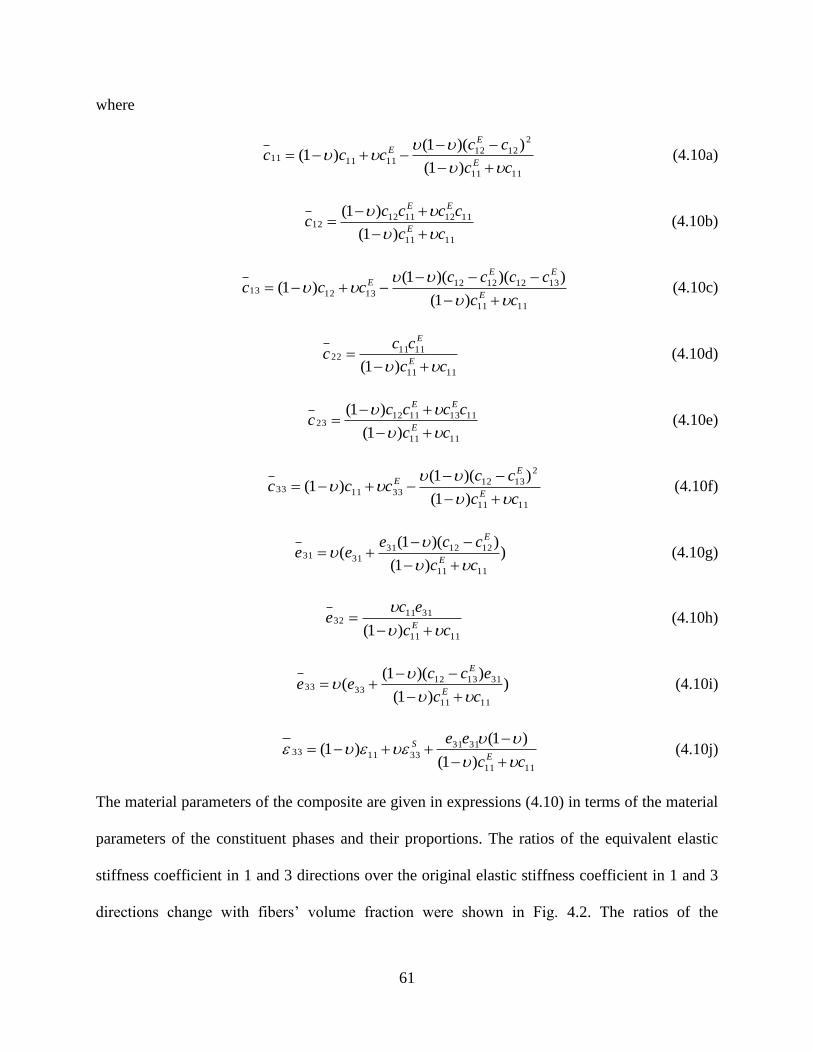
61
where
1111
2
1212111111
)1(
))(1()1(
cc
ccccc
E
EE
(4.10a)
1111
1112111212
)1(
)1(
cc
ccccc
E
EE
(4.10b)
1111
13121212
131213
)1(
))()(1()1(
cc
ccccccc
E
EEE
(4.10c)
1111
111122
)1( cc
ccc
E
E
(4.10d)
1111
1113111223
)1(
)1(
cc
ccccc
E
EE
(4.10e)
1111
2
1312
331133
)1(
))(1()1(
cc
ccccc
E
EE
(4.10f)
))1(
))(1((
1111
121231
3131
cc
cceee
E
E
(4.10g)
1111
311132
)1( cc
ece
E
(4.10h)
))1(
))(1((
1111
311312
3333
cc
eccee
E
E
(4.10i)
1111
3131
331133
)1(
)1()1(
cc
eeE
S
(4.10j)
The material parameters of the composite are given in expressions (4.10) in terms of the material
parameters of the constituent phases and their proportions. The ratios of the equivalent elastic
stiffness coefficient in 1 and 3 directions over the original elastic stiffness coefficient in 1 and 3
directions change with fibers’ volume fraction were shown in Fig. 4.2. The ratios of the

62
equivalent piezoelectric coefficient in 1 and 3 directions over the original piezoelectric
coefficient in 1 and 3 directions change with fibers’ volume fraction were shown in Fig. 4.3.
From these figures, the piezoelectric coefficient in the longitudinal direction increases much
quicker than the elastic stiffness coefficient in the longitudinal direction for the composite with
low proportion of piezoelectric material. The material properties of the composite could be
adjusted by changing the volume fraction of the piezoelectric fibers. The device property such as
the sensitivity of the vibration sensor could be optimized by choosing suitable proportion of
piezoelectric material.
Figure 4.2. The ratios of the effective elastic stiffness coefficient in different directions over the original
elastic stiffness coefficient change with fibers’ volume fraction
Figure 4.3. The ratios of the effective piezoelectric coefficient in different directions over the original
piezoelectric coefficient change with fibers’ volume fraction
The PZT fiber composite sample includes 17 PZT fibers and the fibers’ volume fraction υ
is nearly 0.51 by calculation. Unlike the piezo-fibers in Active-Fiber Composites (AFCs), the
63
piezo-fibers in MFCs have rectangular cross section, which increases the electrode contact and
capacitance of the MFCs compared to AFCs. Elastic stiffness, piezoelectric coefficient and
dielectric constants of single PZT fiber and epoxy (the polymer phase) were cited from the data
in references [92, 94] and listed in Table 4.1. The geometry parameters of single PZT fiber and
the PZT fiber composite were acquired from the website of Smart Material and listed in Table
4.2. The distance between IDT electrodes is 0.4mm, which is twice the thickness of the fibers. So
the x and y components of the electric fields can nearly be thought to be zero for the longitudinal
vibration modeling. With these coefficients and geometry parameters, the global properties of the
PZT fiber composite can be calculated from expressions (4.10) and were listed in Table 4.1.
These property parameters of the fiber composite were changed to piezoelectric strain coefficient
33d , tensile modulus E and listed in Table 4.3. If they are compared with the standard data from
the technical brochure of Smart Material, the piezoelectric strain coefficient matches the official
data very well and the Young’s modulus and Poisson’s ratio have a little difference with them.
The difference may be caused by different material properties between the reference and the
fiber composite sample.
Table 4.1. Composite component and global material properties
PZT 5H fiber Ec11(1010
N/m2) 12.7 Fiber composite
11c (1010
N/m2) 4.29
Ec12 (1010
N/m2) 8.0
12c (1010
N/m2) 0.47
Ec13(1010
N/m2) 8.5
13c (1010
N/m2) 1.96
Ec33 (1010
N/m2) 11.7
22c (1010
N/m2) 0.58
31e (C/m
2) -4.4
23c (1010
N/m2) 0.48
33e (C/m
2) 15.5
33c (1010
N/m2) 3.47
033 S 1400
31e (C/m2) -0.91
Epoxy 11c (10
10 N/m
2) 0.29
32e (C/m2) -0.10
12c (10
10 N/m
2) 0.29
33e (C/m2) 9.32
011 4.25
033 717
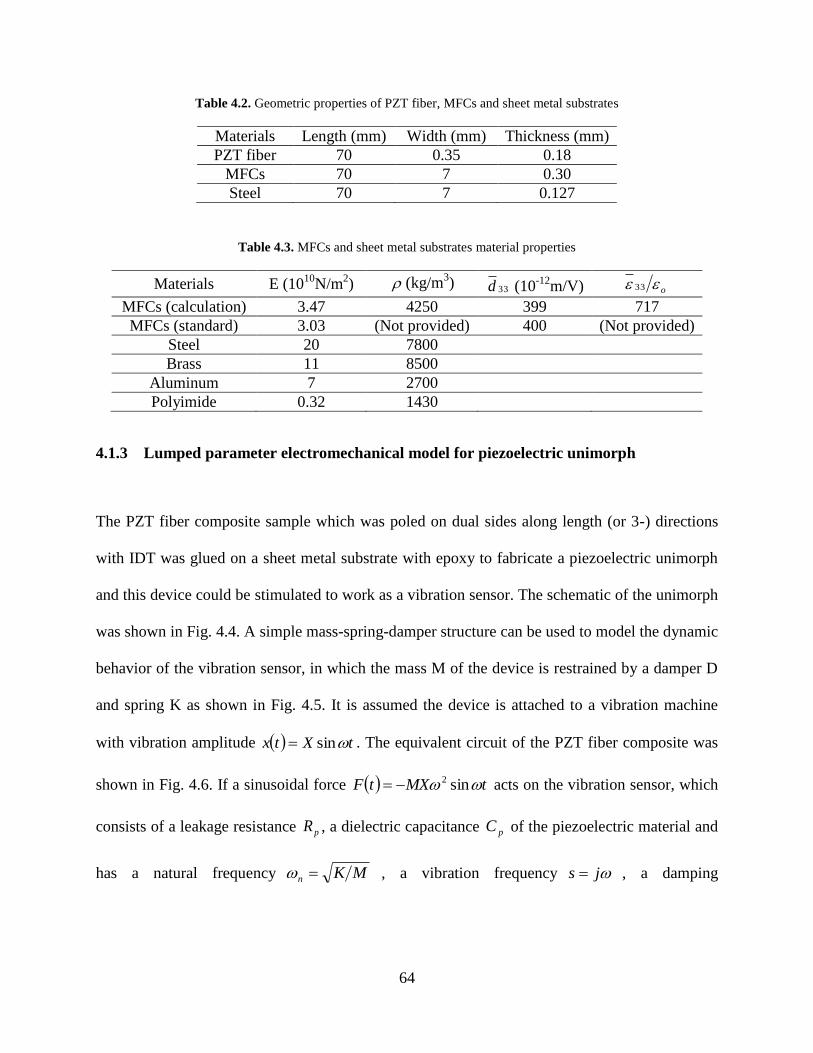
64
Table 4.2. Geometric properties of PZT fiber, MFCs and sheet metal substrates
Materials Length (mm) Width (mm) Thickness (mm)
PZT fiber 70 0.35 0.18
MFCs 70 7 0.30
Steel 70 7 0.127
Table 4.3. MFCs and sheet metal substrates material properties
Materials E (1010
N/m2) (kg/m
3)
33d (10-12
m/V) o 33
MFCs (calculation) 3.47 4250 399 717
MFCs (standard) 3.03 (Not provided) 400 (Not provided)
Steel 20 7800
Brass 11 8500
Aluminum 7 2700
Polyimide 0.32 1430
4.1.3 Lumped parameter electromechanical model for piezoelectric unimorph
The PZT fiber composite sample which was poled on dual sides along length (or 3-) directions
with IDT was glued on a sheet metal substrate with epoxy to fabricate a piezoelectric unimorph
and this device could be stimulated to work as a vibration sensor. The schematic of the unimorph
was shown in Fig. 4.4. A simple mass-spring-damper structure can be used to model the dynamic
behavior of the vibration sensor, in which the mass M of the device is restrained by a damper D
and spring K as shown in Fig. 4.5. It is assumed the device is attached to a vibration machine
with vibration amplitude tXtx sin . The equivalent circuit of the PZT fiber composite was
shown in Fig. 4.6. If a sinusoidal force tMXtF sin2 acts on the vibration sensor, which
consists of a leakage resistance pR , a dielectric capacitance pC of the piezoelectric material and
has a natural frequency MKn , a vibration frequency js , a damping
65
ratio KMD 2 , and a time constant ppCR , the instantaneous open-circuit voltage in
frequency domain can be related to the input force with the following transfer function [95],
12 22
2
s
s
ssKC
K
F
sV
nn
n
p
q
(4.11)
Applying the dimensionless frequency ratio n , equation (4.11) becomes,
121 2
2
s
s
jC
K
X
sV
p
q
(4.12)
where qK is the charge generated per unit tip displacement, pC is the capacitance of the
piezoelectric unimorph, K is the spring constant. The output voltage of the unimorph vibration
sensor depends on the static term (the materials properties and device structure), the dynamic
term (second term), time constant of the equivalent RC circuit (third term), and vibration
frequency. The frequency response of the output voltage for the vibration sensor can be
calculated with different damping ratios and time constants. The frequency response of the
magnitude X of the output voltage divided by the input vibration amplitude with different
damping ratios was shown in Fig. 4.7. The time constant for the fiber composite sample is 769s
in our study.
Figure 4.4. The schematic of the MFCs unimorph vibration sensor
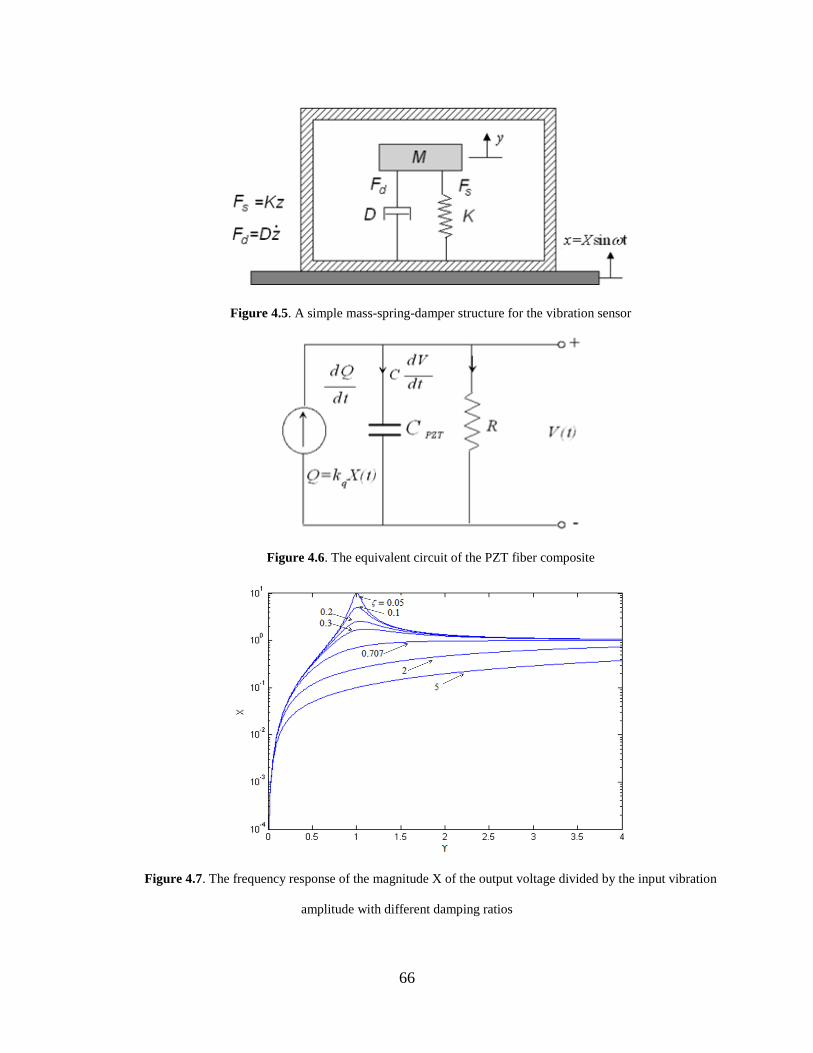
66
Figure 4.5. A simple mass-spring-damper structure for the vibration sensor
Figure 4.6. The equivalent circuit of the PZT fiber composite
Figure 4.7. The frequency response of the magnitude X of the output voltage divided by the input vibration
amplitude with different damping ratios
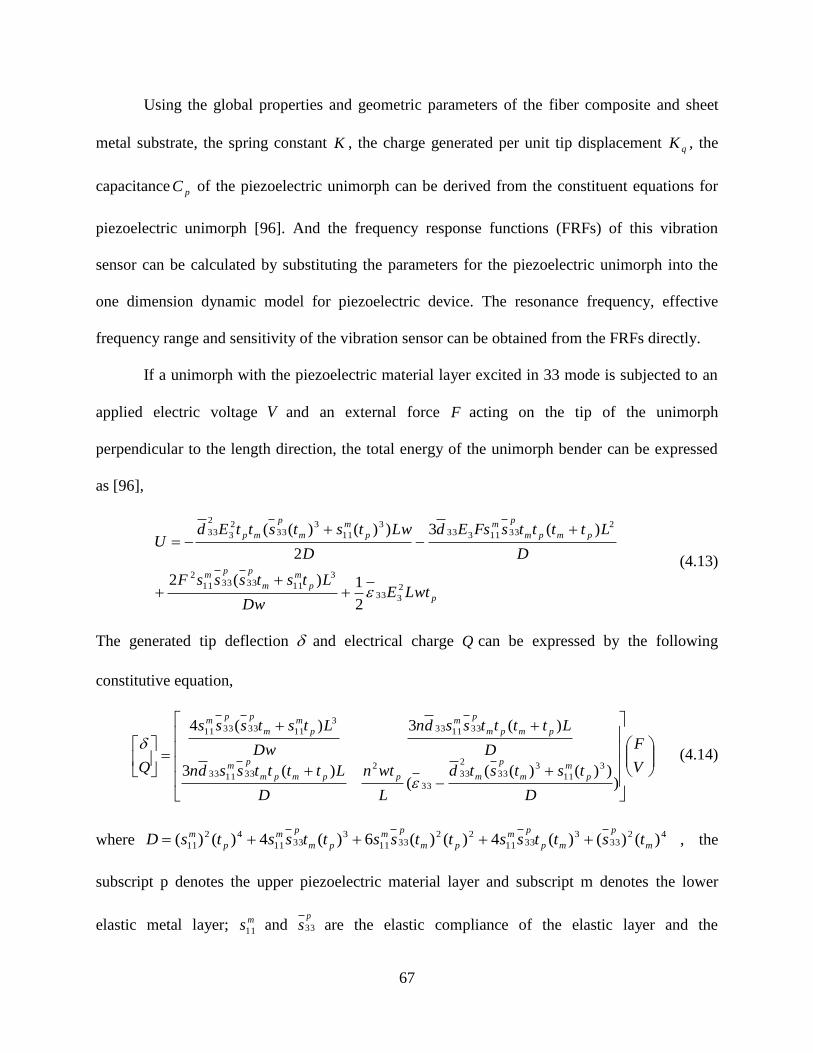
67
Using the global properties and geometric parameters of the fiber composite and sheet
metal substrate, the spring constant K , the charge generated per unit tip displacement qK , the
capacitance pC of the piezoelectric unimorph can be derived from the constituent equations for
piezoelectric unimorph [96]. And the frequency response functions (FRFs) of this vibration
sensor can be calculated by substituting the parameters for the piezoelectric unimorph into the
one dimension dynamic model for piezoelectric device. The resonance frequency, effective
frequency range and sensitivity of the vibration sensor can be obtained from the FRFs directly.
If a unimorph with the piezoelectric material layer excited in 33 mode is subjected to an
applied electric voltage V and an external force F acting on the tip of the unimorph
perpendicular to the length direction, the total energy of the unimorph bender can be expressed
as [96],
p
p
m
m
ppm
pmpm
pm
p
m
m
p
mp
LwtEDw
LtstsssF
D
LttttsFsEd
D
LwtststtEdU
2
333
3
11333311
2
23311333
3
11
333
2
3
2
33
2
1)(2
)(3
2
))()((
(4.13)
The generated tip deflection and electrical charge Q can be expressed by the following
constitutive equation,
V
F
D
tststd
L
wtn
D
Lttttssdn
D
Lttttssdn
Dw
Ltstsss
Qp
m
m
p
mppmpm
pm
pmpm
pm
p
m
m
ppm
)))()((
()(3
)(3)(4
3
11
333
2
33
33
2331133
3311333
11333311
(4.14)
where42
333
3311
223311
33311
42
11 )()()(4)()(6)(4)()( m
p
mp
pm
pm
pm
pm
pm
p
m tsttssttssttsstsD , the
subscript p denotes the upper piezoelectric material layer and subscript m denotes the lower
elastic metal layer; ms11 and p
s33 are the elastic compliance of the elastic layer and the
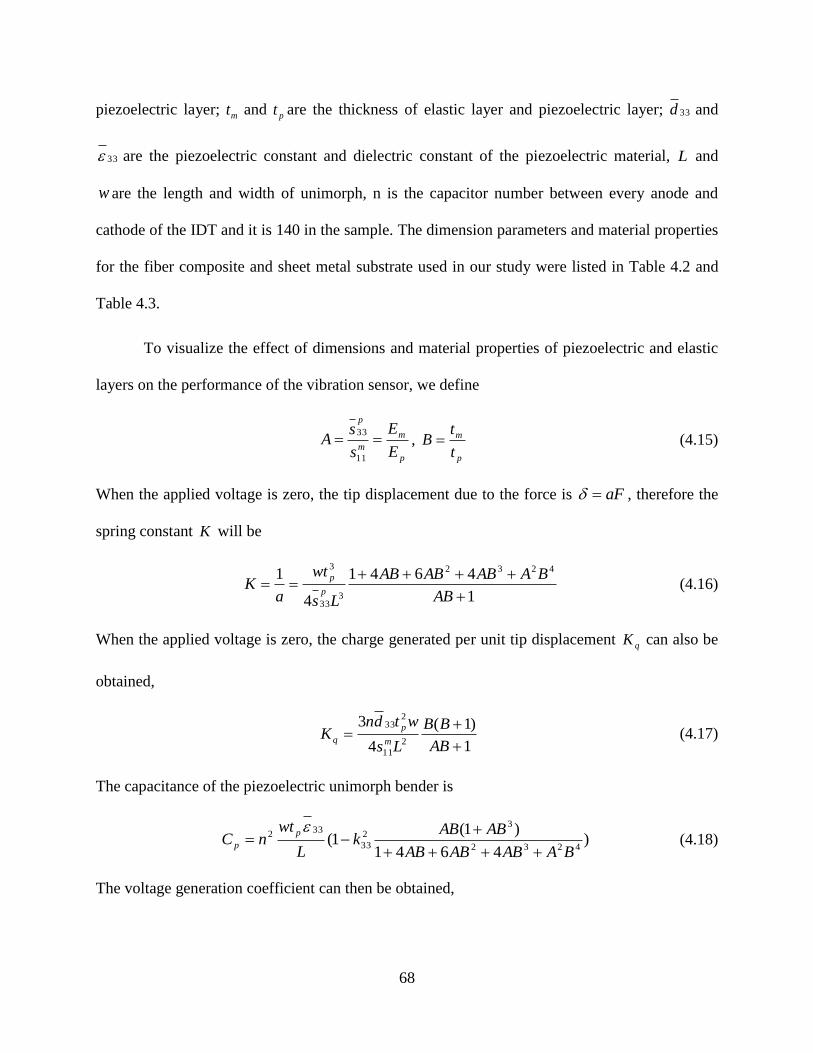
68
piezoelectric layer; mt and pt are the thickness of elastic layer and piezoelectric layer; 33d and
33 are the piezoelectric constant and dielectric constant of the piezoelectric material, L and
w are the length and width of unimorph, n is the capacitor number between every anode and
cathode of the IDT and it is 140 in the sample. The dimension parameters and material properties
for the fiber composite and sheet metal substrate used in our study were listed in Table 4.2 and
Table 4.3.
To visualize the effect of dimensions and material properties of piezoelectric and elastic
layers on the performance of the vibration sensor, we define
p
m
m
p
E
E
s
sA
11
33,
p
m
t
tB (4.15)
When the applied voltage is zero, the tip displacement due to the force is aF , therefore the
spring constant K will be
1
4641
4
1 4232
333
3
AB
BAABABAB
Ls
wt
aK
p
p (4.16)
When the applied voltage is zero, the charge generated per unit tip displacement qK can also be
obtained,
1
)1(
4
32
11
233
AB
BB
Ls
wtdnK
m
p
q (4.17)
The capacitance of the piezoelectric unimorph bender is
)4641
)1(1(
4232
32
33
332
BAABABAB
ABABk
L
wtnC
p
p
(4.18)
The voltage generation coefficient can then be obtained,
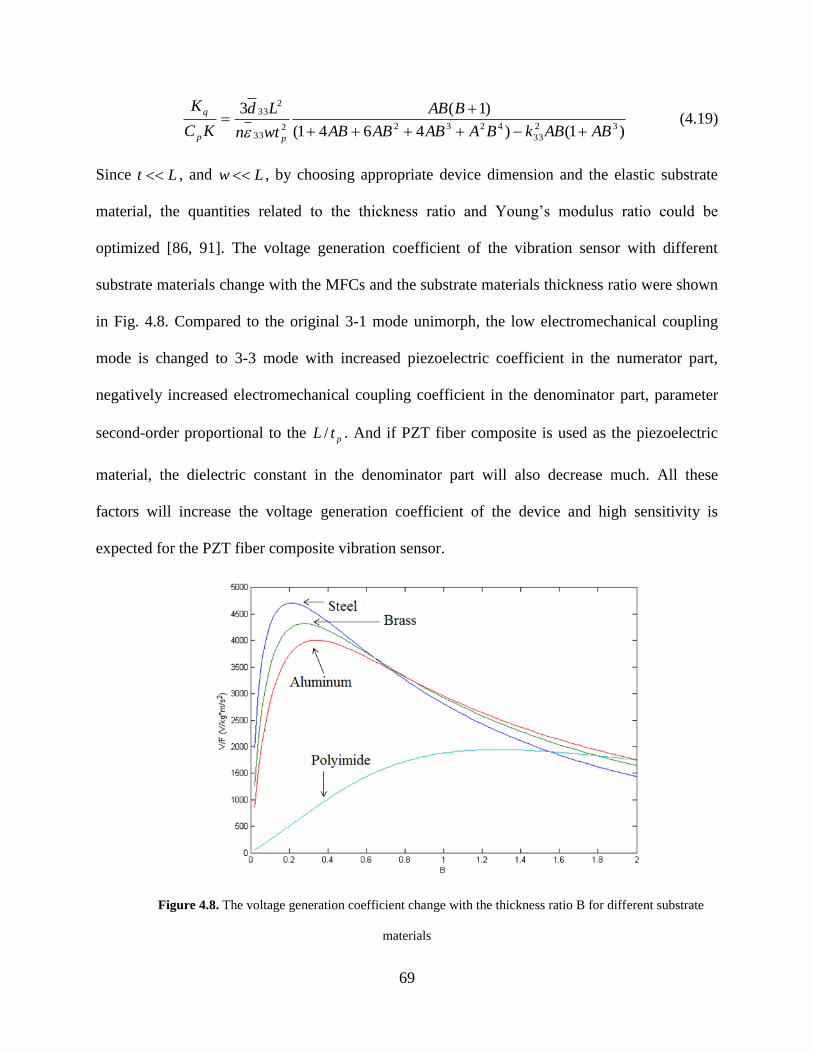
69
)1()4641(
)1(332
33
4232233
233
ABABkBAABABAB
BAB
wtn
Ld
KC
K
pp
q
(4.19)
Since Lt , and Lw , by choosing appropriate device dimension and the elastic substrate
material, the quantities related to the thickness ratio and Young’s modulus ratio could be
optimized [86, 91]. The voltage generation coefficient of the vibration sensor with different
substrate materials change with the MFCs and the substrate materials thickness ratio were shown
in Fig. 4.8. Compared to the original 3-1 mode unimorph, the low electromechanical coupling
mode is changed to 3-3 mode with increased piezoelectric coefficient in the numerator part,
negatively increased electromechanical coupling coefficient in the denominator part, parameter
second-order proportional to the ptL / . And if PZT fiber composite is used as the piezoelectric
material, the dielectric constant in the denominator part will also decrease much. All these
factors will increase the voltage generation coefficient of the device and high sensitivity is
expected for the PZT fiber composite vibration sensor.
Figure 4.8. The voltage generation coefficient change with the thickness ratio B for different substrate
materials

70
The fundamental bending resonance frequency of a piezoelectric unimorph is given by
[97],
2/14232
2 )1)(1(
4641
32
52.3
ABBC
BAABABABE
L
t
p
pp
n
(4.20)
where C is the density ratio pm / of the elastic layer and the piezoelectric layer. A low
resonance frequency is often desirable for the working mode of the vibration sensor. Flexural
vibration mode or bending mode is often chosen since it has the lowest resonance frequency
compared to other mode.
4.1.4 Distributed parameter electromechanical model for piezoelectric unimorph
A distributed parameter electromechanical model was also proposed for cantilevered
piezoelectric energy harvesters [98]. In this model, the piezoelectric material is excited in 3-1
mode and exact analytical solution can be acquired with Euler-Bernoulli beam assumptions. This
model can also be utilized to analyze piezoelectric unimorph vibration sensors. After
modification, the FRF of the steady state output voltage for the piezoelectric unimorph excited in
3-3 mode can be expressed as [98],
tj
c
c
r rrr
rr
r rrr
w
rr
eYj
j
j
j
jm
t
0
122
122
3
2
2)(
(4.21)
where 0Y is the amplitude of the base translation, m is the mass per unit length of the beam,
is the driving frequency.
71
Lx
r
p
pcp
rdx
xd
t
LtEd
)(
33
33
(4.22)
L
xr
w
r dxx0
)( (4.23)
where pct is the distance from the center of the PZT layer to the neutral plane,
)1(2
)1(
AB
BAtt m
pc
(4.24)
)sin(sinhcoscosh
1)( x
Lx
Lx
Lx
LmLx rr
rrr
r
(4.25)
is the rth mode mass normalized eigenfunction of the clamped-free beam. The r ’s are the
dimensionless frequency numbers obtained from the characteristic equation given by
0coshcos1 (4.26)
and r is expressed as
rr
rrr
coscosh
sinsinh
(4.27)
4
2
mL
YIrr (4.28)
is the rth mode undamped natural frequency and YI is the bending stiffness of the composite
cross section given by,
3
)()( 3333
bcpabm ttEttEwYI (4.29)
)1(2
)21( 2
AB
ABBtt
p
a
(4.30)
)1(2
)1( 2
AB
ABtt
p
b
(4.31)
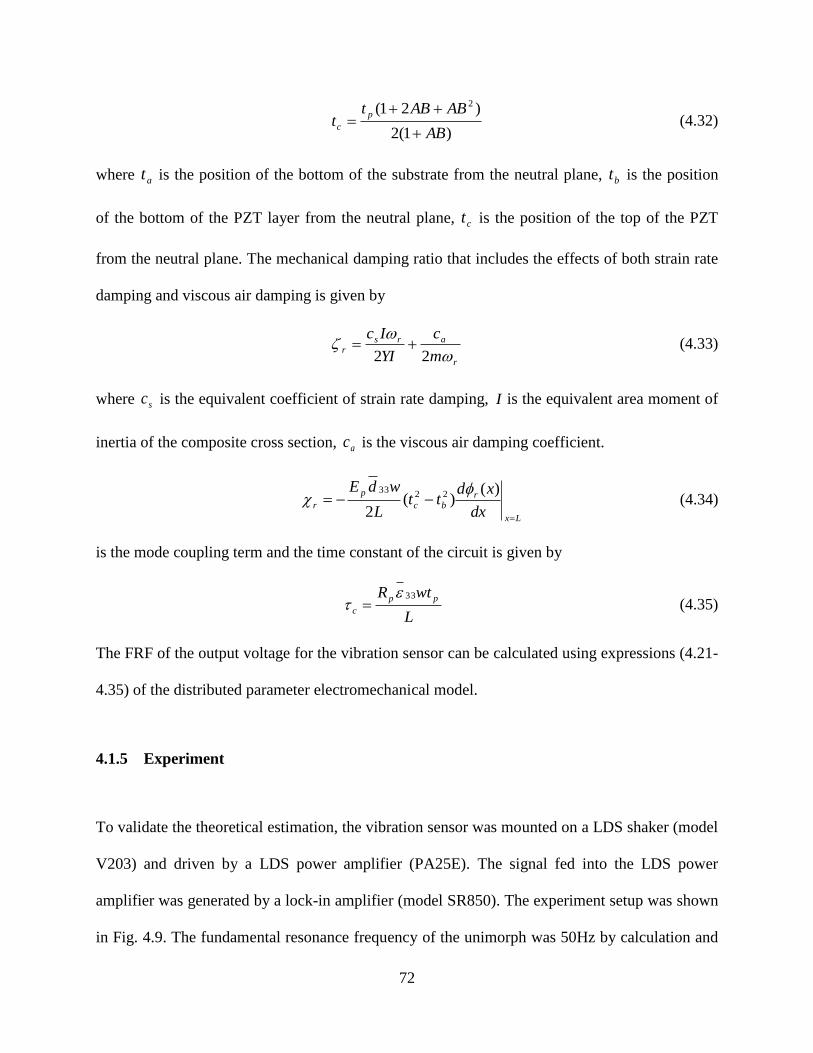
72
)1(2
)21( 2
AB
ABABtt
p
c
(4.32)
where at is the position of the bottom of the substrate from the neutral plane, bt is the position
of the bottom of the PZT layer from the neutral plane, ct is the position of the top of the PZT
from the neutral plane. The mechanical damping ratio that includes the effects of both strain rate
damping and viscous air damping is given by
r
arsr
m
c
YI
Ic
22 (4.33)
where sc is the equivalent coefficient of strain rate damping, I is the equivalent area moment of
inertia of the composite cross section, ac is the viscous air damping coefficient.
Lx
rbc
p
rdx
xdtt
L
wdE
)(
)(2
2233
(4.34)
is the mode coupling term and the time constant of the circuit is given by
L
wtR pp
c
33 (4.35)
The FRF of the output voltage for the vibration sensor can be calculated using expressions (4.21-
4.35) of the distributed parameter electromechanical model.
4.1.5 Experiment
To validate the theoretical estimation, the vibration sensor was mounted on a LDS shaker (model
V203) and driven by a LDS power amplifier (PA25E). The signal fed into the LDS power
amplifier was generated by a lock-in amplifier (model SR850). The experiment setup was shown
in Fig. 4.9. The fundamental resonance frequency of the unimorph was 50Hz by calculation and
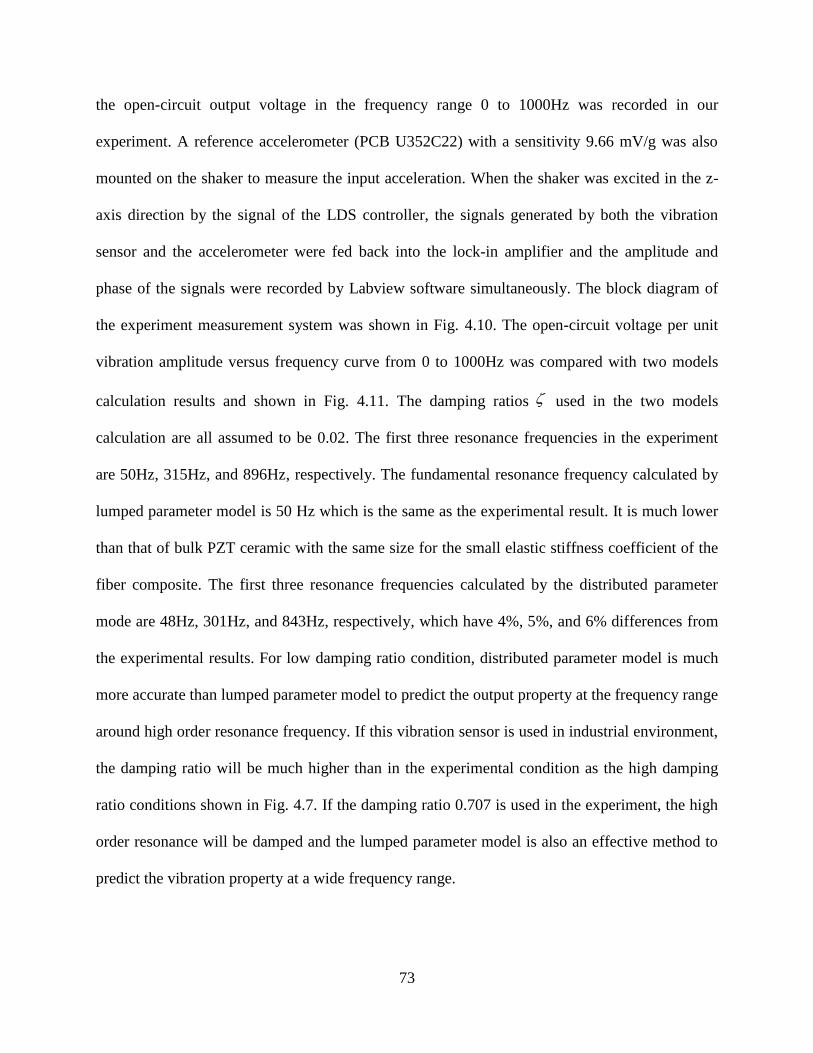
73
the open-circuit output voltage in the frequency range 0 to 1000Hz was recorded in our
experiment. A reference accelerometer (PCB U352C22) with a sensitivity 9.66 mV/g was also
mounted on the shaker to measure the input acceleration. When the shaker was excited in the z-
axis direction by the signal of the LDS controller, the signals generated by both the vibration
sensor and the accelerometer were fed back into the lock-in amplifier and the amplitude and
phase of the signals were recorded by Labview software simultaneously. The block diagram of
the experiment measurement system was shown in Fig. 4.10. The open-circuit voltage per unit
vibration amplitude versus frequency curve from 0 to 1000Hz was compared with two models
calculation results and shown in Fig. 4.11. The damping ratios used in the two models
calculation are all assumed to be 0.02. The first three resonance frequencies in the experiment
are 50Hz, 315Hz, and 896Hz, respectively. The fundamental resonance frequency calculated by
lumped parameter model is 50 Hz which is the same as the experimental result. It is much lower
than that of bulk PZT ceramic with the same size for the small elastic stiffness coefficient of the
fiber composite. The first three resonance frequencies calculated by the distributed parameter
mode are 48Hz, 301Hz, and 843Hz, respectively, which have 4%, 5%, and 6% differences from
the experimental results. For low damping ratio condition, distributed parameter model is much
more accurate than lumped parameter model to predict the output property at the frequency range
around high order resonance frequency. If this vibration sensor is used in industrial environment,
the damping ratio will be much higher than in the experimental condition as the high damping
ratio conditions shown in Fig. 4.7. If the damping ratio 0.707 is used in the experiment, the high
order resonance will be damped and the lumped parameter model is also an effective method to
predict the vibration property at a wide frequency range.
74
Figure 4.9. The experiment setup with one MFCs glued on a sheet metal substrate and clamed to a LDS
shaker
Figure 4.10. The block diagram of the experiment measurement system
Figure 4.11. Experimental and calculation results of the frequency response of output voltage per unit
vibration amplitude for a MFCs unimorph
75
4.2 STRAIN SENSOR FOR SOFT MATERIAL STRAIN MEASUREMENT
4.2.1 Introduction
Polymeric materials have been widely used in electronic and electromechanical transduction
field [99]. The behavior of the material under an external electric field is important for material
selection. Because the polymer material to be characterized is very soft, the external electric field
induced strain in thin polymer film is still very difficult to be determined accurately without any
constraint being imposed to the sample. And typical mechanical testing is destructive for
tissue/soft material and specimens are required to be cut to a suitable shape to fit the tester [100].
Conventionally, strain (or displacement) response in a mechanical structure of material can be
characterized by various techniques, which can be grouped into two categories: the noncontact
methods and contact methods [64].
In the case of noncontact methods such as the laser strain micrometry are used, two laser
beams are needed to focus on the opposite faces of the sample for the out-of-plane strain
measurement. Furthermore, the laser beam should be reflected at the ends of the structure or
sample in characterizing the transverse strain response of it. The major benefit for this method is
its non-contact nature. The measurement results of the laser are very accurate based on the
requirements that the laser beam is aligned properly and the measured surface of the sample can
reflect enough light. However, a laser instrument is usually too bulky to be easily carried on and
the technique is so delicate that laboratory conditions are required for its use. Furthermore,
flexural vibration mode in the structure may be excited in the strain measurement for thin and
soft sample, which will cause errors to the final result [65]. An optical microscope is another

76
noncontact instrument, which can only characterize the strain response at low strain response
region, due to its limited resolution [66].
The contact methods such as differential capacitive sensor or linear variable differential
transformer (LVDT) have been developed for strain/displacement measurement. These two
techniques either measures the voltage output of two differential parallel plate capacitors or that
of two differential transformers to reflect the displacement change of structure. But complex
circuit requirements and sensitivity to vibration keep these two methods from being very
practical for strain measurement. In the situation where a strain gauge is used and the sensor will
not affect the original structure, the strain can be acquired by measuring the electric voltage
change with external stress exerted on the structure. Piezoresistive and piezoelectric materials are
commonly used for strain sensors. Adhesives are used to attach the strain sensor to the host
structure prior to measurement [101]. This method is very simple for large structures but may not
be suitable for smaller ones. The size of the strain sensor and even the thickness of the adhesives
can influence the behavior of small structures under test.
Atomic force microscope using a cantilever beam with high sensitivity in detecting small
force has inspired the idea that using piezoelectric bimorph cantilever beam to characterize the
electric field induced strain in soft and thin polymeric samples without imposing large stress or
mechanical constrains in the sample [102, 103]. A bimorph based dilatometer was then
developed to characterize the electric field induced strain response in soft and thin free standing
polymer films in the out of plane direction [104]. This dilatometer can work over a relatively
wide frequency range from 0.1 Hz to1 kHz and it is capable of detecting displacement down to
subangstrom range with high accuracy. And another dilatometer was developed for the
measurement of the transverse strain response in electrostrictive PVDF film [105]. Many other
77
works also focused to compare the design of the dilatometer using different sensor heads and
platforms and to improve the performance as stability and reliability of it [106]. The sensitivity
of the piezoelectric bimorph dilatometer depends on the design and assembles of the
piezoelectric configuration and amplification device strongly [107]. And careful preparation of
piezoelectric device will be very important for the final performance of the device. The bimorph
based dilatometer is a suitable choice for measuring the field induced strain at low frequencies in
thin and soft polymer films under high voltage [108].
The bulk PZT ceramic in the original piezoelectric bimorph design is commonly used for
sensors due to its high piezoelectric coefficient and wide bandwidth. But several disadvantages
are also accompanied with it, such as high dielectric constant, low elastic compliance and so on.
The high dielectric constant of bulk PZT reduces the electromechanical coupling coefficient of it
and converts less electric energy from the same mechanical deformation compared to
piezoelectric materials with low dielectric constant [86]. The low elastic compliance of bulk PZT
makes it too hard to be applied for very soft polymer material. And the bulk PZT is very brittle
and unable to withstand large deformation of the sample which limits its strain measurement
range.
Two alternative methods have been developed to overcome these disadvantages [92].
One uses thin film deposition of PZT on the substrate [93] and the other uses packaged PZT
composites. PZT thin film needs complex technical processes to be integrated on the substrate
and has low charge output. A piezoelectric composite sensor or actuator comprises of one
piezoelectric material layer sandwiched between two soft thin encapsulating layers. 1-3
piezoelectric composites which are most commonly used are composed of piezoelectric ceramic
rods embedded in a non-piezoelectric matrix [10]. PZT fiber composites can decouple the lateral
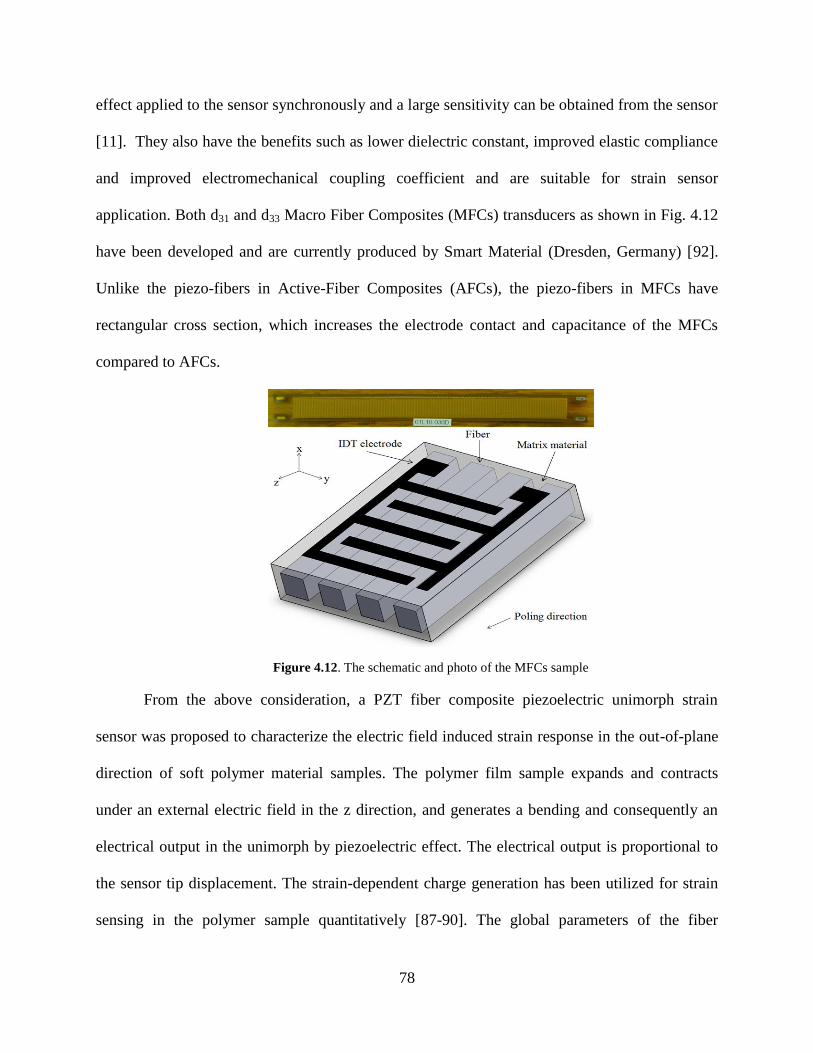
78
effect applied to the sensor synchronously and a large sensitivity can be obtained from the sensor
[11]. They also have the benefits such as lower dielectric constant, improved elastic compliance
and improved electromechanical coupling coefficient and are suitable for strain sensor
application. Both d31 and d33 Macro Fiber Composites (MFCs) transducers as shown in Fig. 4.12
have been developed and are currently produced by Smart Material (Dresden, Germany) [92].
Unlike the piezo-fibers in Active-Fiber Composites (AFCs), the piezo-fibers in MFCs have
rectangular cross section, which increases the electrode contact and capacitance of the MFCs
compared to AFCs.
Figure 4.12. The schematic and photo of the MFCs sample
From the above consideration, a PZT fiber composite piezoelectric unimorph strain
sensor was proposed to characterize the electric field induced strain response in the out-of-plane
direction of soft polymer material samples. The polymer film sample expands and contracts
under an external electric field in the z direction, and generates a bending and consequently an
electrical output in the unimorph by piezoelectric effect. The electrical output is proportional to
the sensor tip displacement. The strain-dependent charge generation has been utilized for strain
sensing in the polymer sample quantitatively [87-90]. The global parameters of the fiber
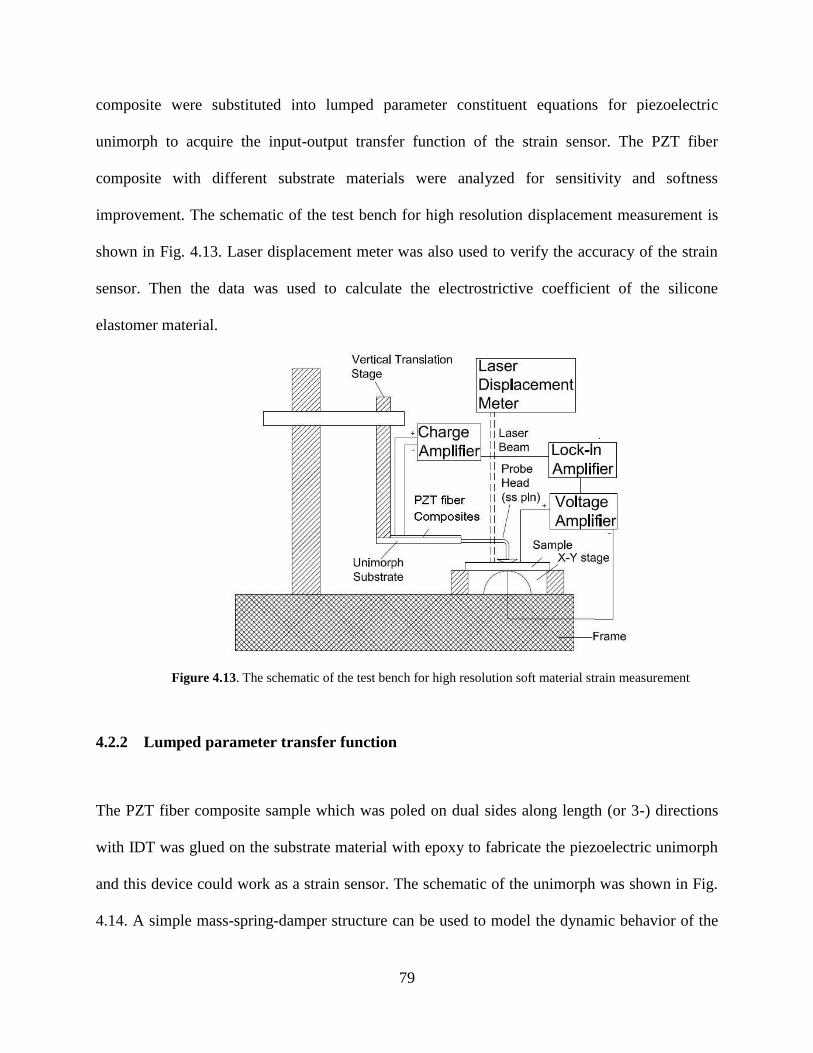
79
composite were substituted into lumped parameter constituent equations for piezoelectric
unimorph to acquire the input-output transfer function of the strain sensor. The PZT fiber
composite with different substrate materials were analyzed for sensitivity and softness
improvement. The schematic of the test bench for high resolution displacement measurement is
shown in Fig. 4.13. Laser displacement meter was also used to verify the accuracy of the strain
sensor. Then the data was used to calculate the electrostrictive coefficient of the silicone
elastomer material.
Figure 4.13. The schematic of the test bench for high resolution soft material strain measurement
4.2.2 Lumped parameter transfer function
The PZT fiber composite sample which was poled on dual sides along length (or 3-) directions
with IDT was glued on the substrate material with epoxy to fabricate the piezoelectric unimorph
and this device could work as a strain sensor. The schematic of the unimorph was shown in Fig.
4.14. A simple mass-spring-damper structure can be used to model the dynamic behavior of the
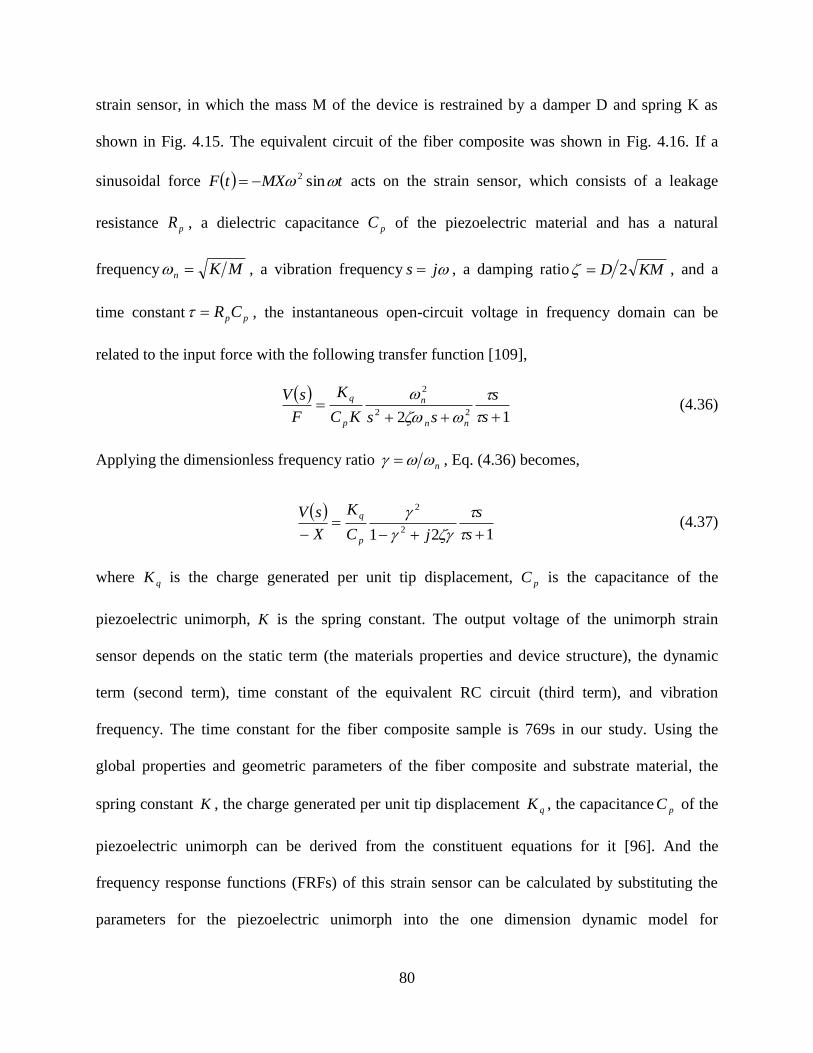
80
strain sensor, in which the mass M of the device is restrained by a damper D and spring K as
shown in Fig. 4.15. The equivalent circuit of the fiber composite was shown in Fig. 4.16. If a
sinusoidal force tMXtF sin2 acts on the strain sensor, which consists of a leakage
resistance pR , a dielectric capacitance pC of the piezoelectric material and has a natural
frequency MKn , a vibration frequency js , a damping ratio KMD 2 , and a
time constant ppCR , the instantaneous open-circuit voltage in frequency domain can be
related to the input force with the following transfer function [109],
12 22
2
s
s
ssKC
K
F
sV
nn
n
p
q
(4.36)
Applying the dimensionless frequency ratio n , Eq. (4.36) becomes,
121 2
2
s
s
jC
K
X
sV
p
q
(4.37)
where qK is the charge generated per unit tip displacement, pC is the capacitance of the
piezoelectric unimorph, K is the spring constant. The output voltage of the unimorph strain
sensor depends on the static term (the materials properties and device structure), the dynamic
term (second term), time constant of the equivalent RC circuit (third term), and vibration
frequency. The time constant for the fiber composite sample is 769s in our study. Using the
global properties and geometric parameters of the fiber composite and substrate material, the
spring constant K , the charge generated per unit tip displacement qK , the capacitance pC of the
piezoelectric unimorph can be derived from the constituent equations for it [96]. And the
frequency response functions (FRFs) of this strain sensor can be calculated by substituting the
parameters for the piezoelectric unimorph into the one dimension dynamic model for
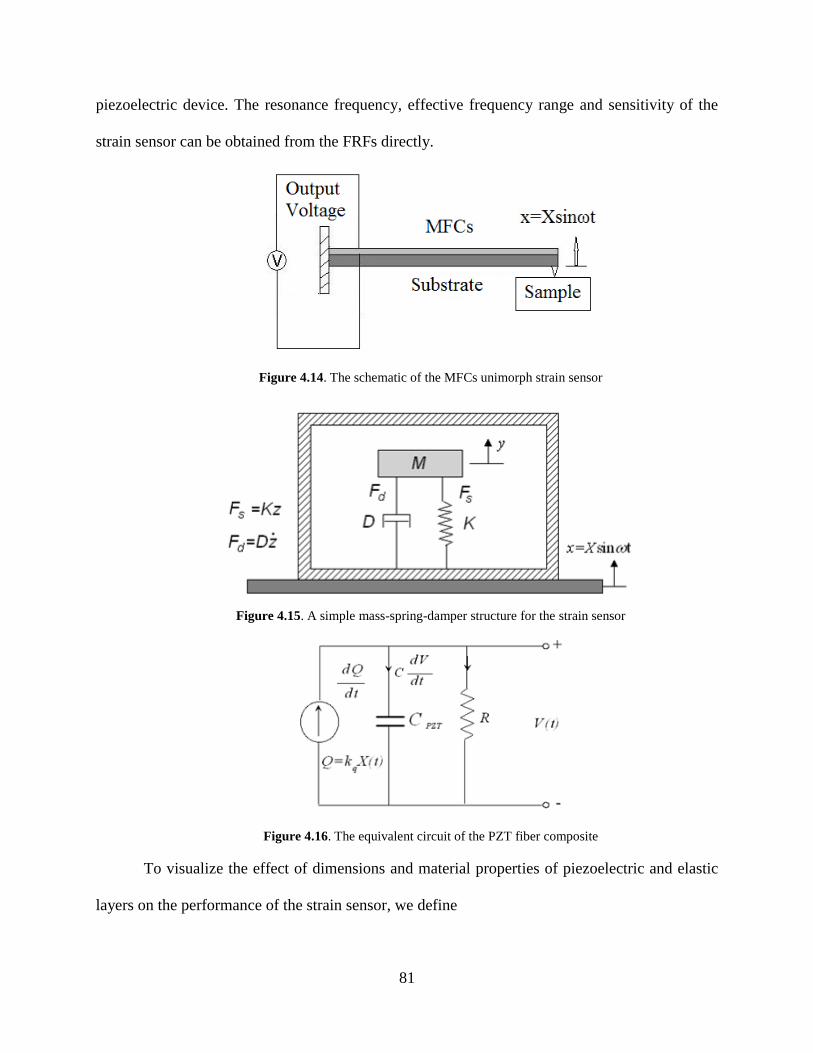
81
piezoelectric device. The resonance frequency, effective frequency range and sensitivity of the
strain sensor can be obtained from the FRFs directly.
Figure 4.14. The schematic of the MFCs unimorph strain sensor
Figure 4.15. A simple mass-spring-damper structure for the strain sensor
Figure 4.16. The equivalent circuit of the PZT fiber composite
To visualize the effect of dimensions and material properties of piezoelectric and elastic
layers on the performance of the strain sensor, we define
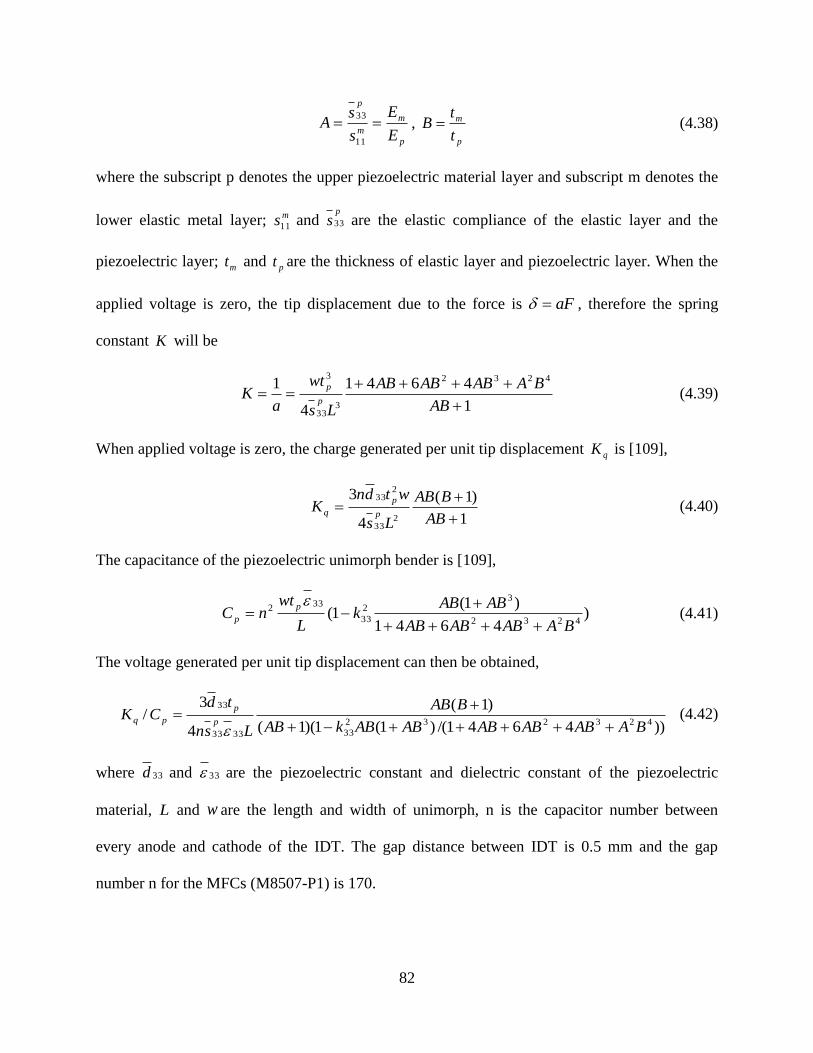
82
p
m
m
p
E
E
s
sA
11
33,
p
m
t
tB (4.38)
where the subscript p denotes the upper piezoelectric material layer and subscript m denotes the
lower elastic metal layer; ms11 and p
s 33 are the elastic compliance of the elastic layer and the
piezoelectric layer; mt and pt are the thickness of elastic layer and piezoelectric layer. When the
applied voltage is zero, the tip displacement due to the force is aF , therefore the spring
constant K will be
1
4641
4
1 4232
333
3
AB
BAABABAB
Ls
wt
aK
p
p (4.39)
When applied voltage is zero, the charge generated per unit tip displacement qK is [109],
1
)1(
4
3
233
233
AB
BAB
Ls
wtdnK
p
p
q (4.40)
The capacitance of the piezoelectric unimorph bender is [109],
)4641
)1(1(
4232
32
33
332
BAABABAB
ABABk
L
wtnC
p
p
(4.41)
The voltage generated per unit tip displacement can then be obtained,
))4641/()1(1)(1(
)1(
4
3/
423232
333333
33
BAABABABABABkAB
BAB
Lsn
tdCK
p
p
pq
(4.42)
where 33d and 33 are the piezoelectric constant and dielectric constant of the piezoelectric
material, L and w are the length and width of unimorph, n is the capacitor number between
every anode and cathode of the IDT. The gap distance between IDT is 0.5 mm and the gap
number n for the MFCs (M8507-P1) is 170.
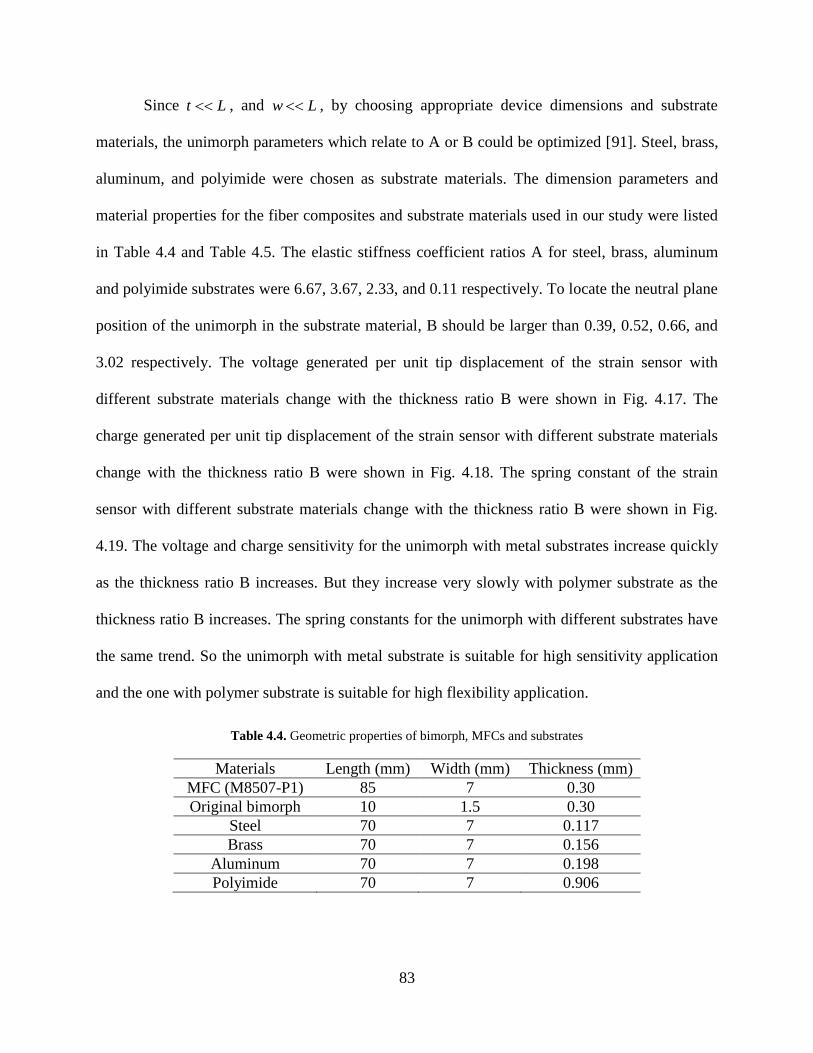
83
Since Lt , and Lw , by choosing appropriate device dimensions and substrate
materials, the unimorph parameters which relate to A or B could be optimized [91]. Steel, brass,
aluminum, and polyimide were chosen as substrate materials. The dimension parameters and
material properties for the fiber composites and substrate materials used in our study were listed
in Table 4.4 and Table 4.5. The elastic stiffness coefficient ratios A for steel, brass, aluminum
and polyimide substrates were 6.67, 3.67, 2.33, and 0.11 respectively. To locate the neutral plane
position of the unimorph in the substrate material, B should be larger than 0.39, 0.52, 0.66, and
3.02 respectively. The voltage generated per unit tip displacement of the strain sensor with
different substrate materials change with the thickness ratio B were shown in Fig. 4.17. The
charge generated per unit tip displacement of the strain sensor with different substrate materials
change with the thickness ratio B were shown in Fig. 4.18. The spring constant of the strain
sensor with different substrate materials change with the thickness ratio B were shown in Fig.
4.19. The voltage and charge sensitivity for the unimorph with metal substrates increase quickly
as the thickness ratio B increases. But they increase very slowly with polymer substrate as the
thickness ratio B increases. The spring constants for the unimorph with different substrates have
the same trend. So the unimorph with metal substrate is suitable for high sensitivity application
and the one with polymer substrate is suitable for high flexibility application.
Table 4.4. Geometric properties of bimorph, MFCs and substrates
Materials Length (mm) Width (mm) Thickness (mm)
MFC (M8507-P1) 85 7 0.30
Original bimorph 10 1.5 0.30
Steel 70 7 0.117
Brass 70 7 0.156
Aluminum 70 7 0.198
Polyimide 70 7 0.906
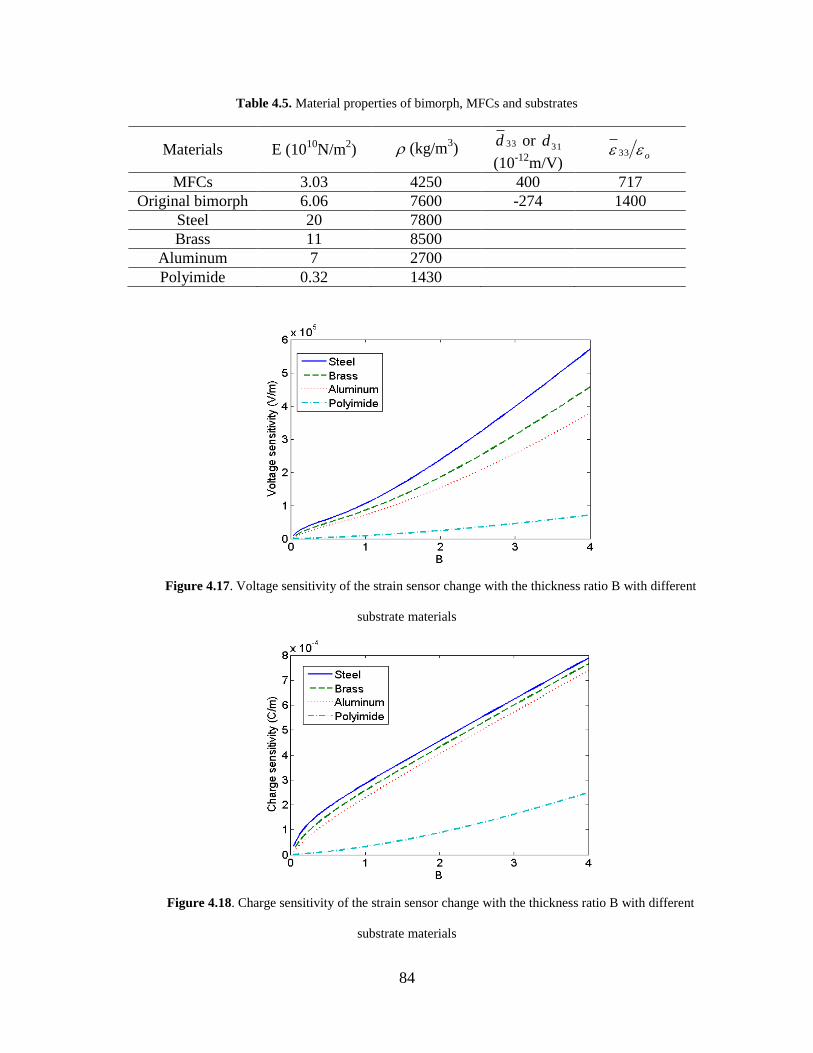
84
Table 4.5. Material properties of bimorph, MFCs and substrates
Materials E (1010
N/m2) (kg/m
3) 33d or 31d
(10-12
m/V) o 33
MFCs 3.03 4250 400 717
Original bimorph 6.06 7600 -274 1400
Steel 20 7800
Brass 11 8500
Aluminum 7 2700
Polyimide 0.32 1430
Figure 4.17. Voltage sensitivity of the strain sensor change with the thickness ratio B with different
substrate materials
Figure 4.18. Charge sensitivity of the strain sensor change with the thickness ratio B with different
substrate materials
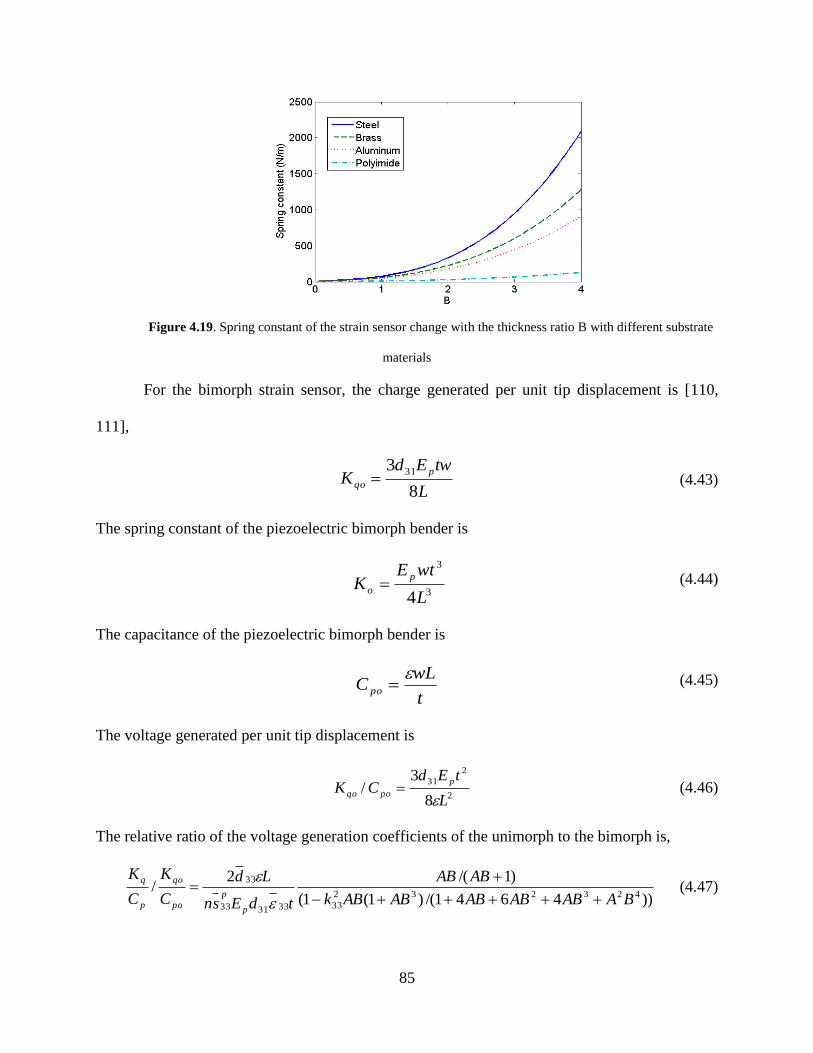
85
Figure 4.19. Spring constant of the strain sensor change with the thickness ratio B with different substrate
materials
For the bimorph strain sensor, the charge generated per unit tip displacement is [110,
111],
L
twEdK
p
qo8
3 31 (4.43)
The spring constant of the piezoelectric bimorph bender is
3
3
4L
wtEK
p
o (4.44)
The capacitance of the piezoelectric bimorph bender is
t
wLC po
(4.45)
The voltage generated per unit tip displacement is
2
2
31
8
3/
L
tEdCK
p
poqo
(4.46)
The relative ratio of the voltage generation coefficients of the unimorph to the bimorph is,
))4641/()1(1(
)1/(2/
423232
33333133
33
BAABABABABABk
ABAB
tdEsn
Ld
C
K
C
K
p
p
po
qo
p
q
(4.47)
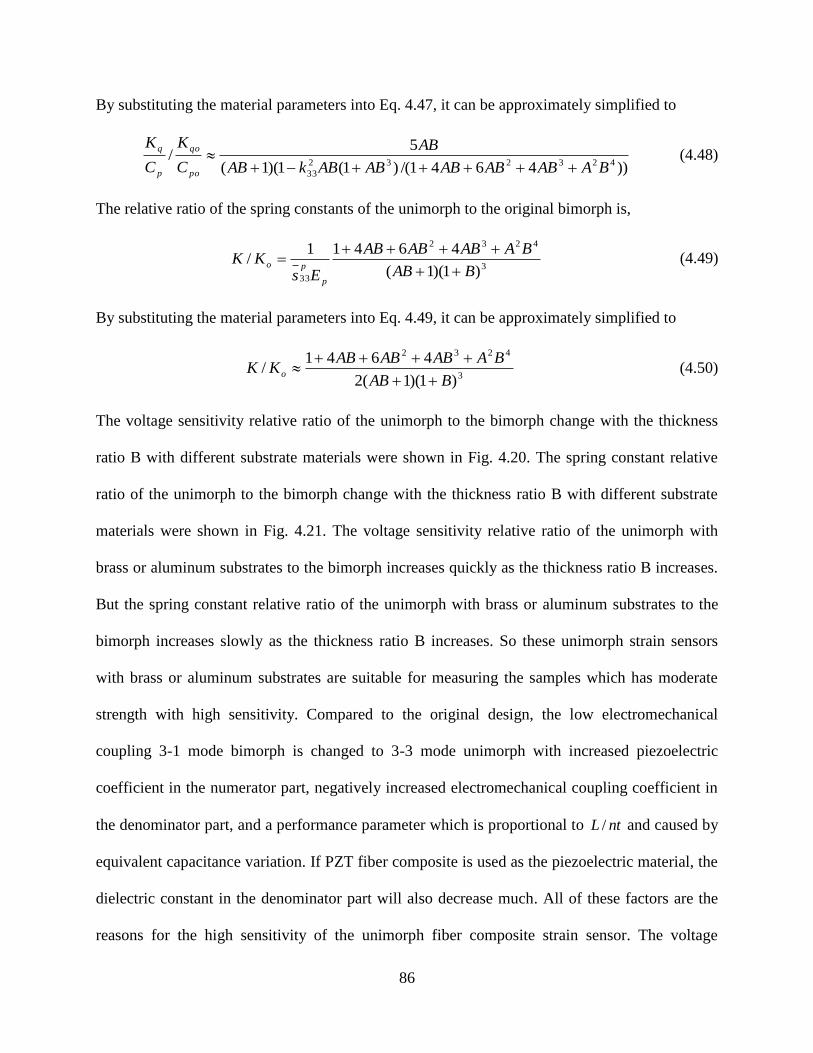
86
By substituting the material parameters into Eq. 4.47, it can be approximately simplified to
))4641/()1(1)(1(
5/
423232
33 BAABABABABABkAB
AB
C
K
C
K
po
qo
p
q
(4.48)
The relative ratio of the spring constants of the unimorph to the original bimorph is,
3
4232
33)1)(1(
46411/
BAB
BAABABAB
EsKK
p
po
(4.49)
By substituting the material parameters into Eq. 4.49, it can be approximately simplified to
3
4232
)1)(1(2
4641/
BAB
BAABABABKK o
(4.50)
The voltage sensitivity relative ratio of the unimorph to the bimorph change with the thickness
ratio B with different substrate materials were shown in Fig. 4.20. The spring constant relative
ratio of the unimorph to the bimorph change with the thickness ratio B with different substrate
materials were shown in Fig. 4.21. The voltage sensitivity relative ratio of the unimorph with
brass or aluminum substrates to the bimorph increases quickly as the thickness ratio B increases.
But the spring constant relative ratio of the unimorph with brass or aluminum substrates to the
bimorph increases slowly as the thickness ratio B increases. So these unimorph strain sensors
with brass or aluminum substrates are suitable for measuring the samples which has moderate
strength with high sensitivity. Compared to the original design, the low electromechanical
coupling 3-1 mode bimorph is changed to 3-3 mode unimorph with increased piezoelectric
coefficient in the numerator part, negatively increased electromechanical coupling coefficient in
the denominator part, and a performance parameter which is proportional to ntL / and caused by
equivalent capacitance variation. If PZT fiber composite is used as the piezoelectric material, the
dielectric constant in the denominator part will also decrease much. All of these factors are the
reasons for the high sensitivity of the unimorph fiber composite strain sensor. The voltage
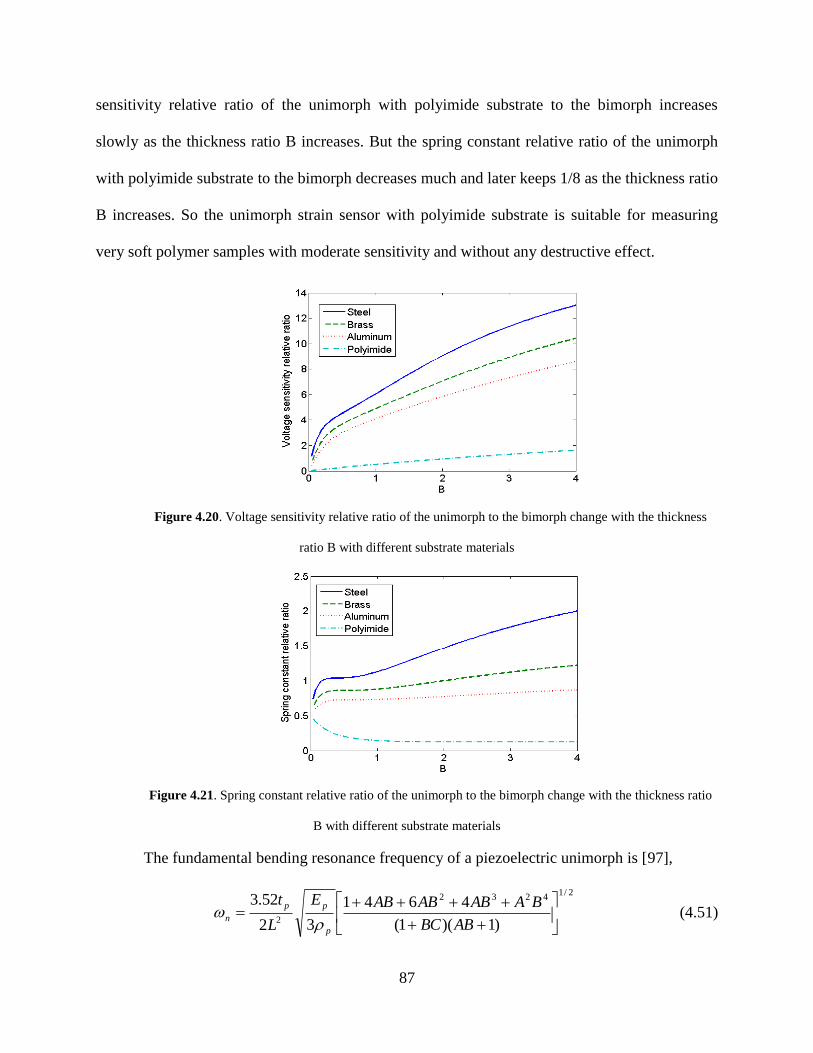
87
sensitivity relative ratio of the unimorph with polyimide substrate to the bimorph increases
slowly as the thickness ratio B increases. But the spring constant relative ratio of the unimorph
with polyimide substrate to the bimorph decreases much and later keeps 1/8 as the thickness ratio
B increases. So the unimorph strain sensor with polyimide substrate is suitable for measuring
very soft polymer samples with moderate sensitivity and without any destructive effect.
Figure 4.20. Voltage sensitivity relative ratio of the unimorph to the bimorph change with the thickness
ratio B with different substrate materials
Figure 4.21. Spring constant relative ratio of the unimorph to the bimorph change with the thickness ratio
B with different substrate materials
The fundamental bending resonance frequency of a piezoelectric unimorph is [97],
2/14232
2 )1)(1(
4641
32
52.3
ABBC
BAABABABE
L
t
p
pp
n
(4.51)
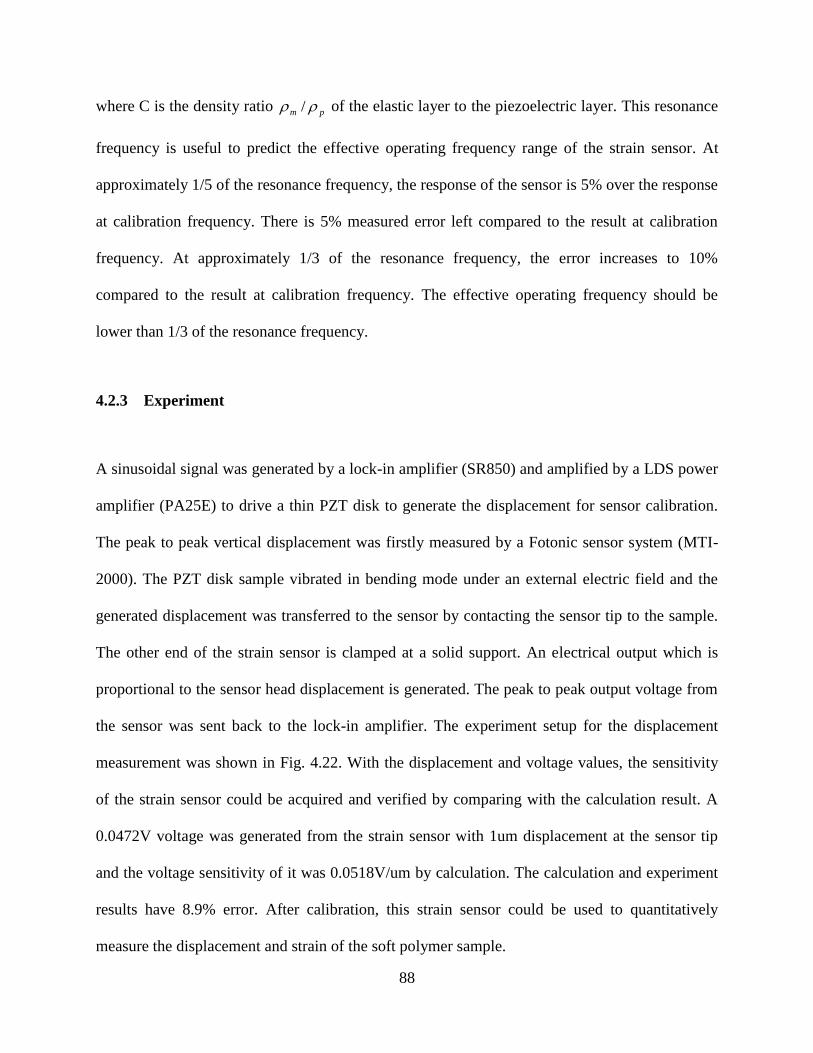
88
where C is the density ratio pm / of the elastic layer to the piezoelectric layer. This resonance
frequency is useful to predict the effective operating frequency range of the strain sensor. At
approximately 1/5 of the resonance frequency, the response of the sensor is 5% over the response
at calibration frequency. There is 5% measured error left compared to the result at calibration
frequency. At approximately 1/3 of the resonance frequency, the error increases to 10%
compared to the result at calibration frequency. The effective operating frequency should be
lower than 1/3 of the resonance frequency.
4.2.3 Experiment
A sinusoidal signal was generated by a lock-in amplifier (SR850) and amplified by a LDS power
amplifier (PA25E) to drive a thin PZT disk to generate the displacement for sensor calibration.
The peak to peak vertical displacement was firstly measured by a Fotonic sensor system (MTI-
2000). The PZT disk sample vibrated in bending mode under an external electric field and the
generated displacement was transferred to the sensor by contacting the sensor tip to the sample.
The other end of the strain sensor is clamped at a solid support. An electrical output which is
proportional to the sensor head displacement is generated. The peak to peak output voltage from
the sensor was sent back to the lock-in amplifier. The experiment setup for the displacement
measurement was shown in Fig. 4.22. With the displacement and voltage values, the sensitivity
of the strain sensor could be acquired and verified by comparing with the calculation result. A
0.0472V voltage was generated from the strain sensor with 1um displacement at the sensor tip
and the voltage sensitivity of it was 0.0518V/um by calculation. The calculation and experiment
results have 8.9% error. After calibration, this strain sensor could be used to quantitatively
measure the displacement and strain of the soft polymer sample.
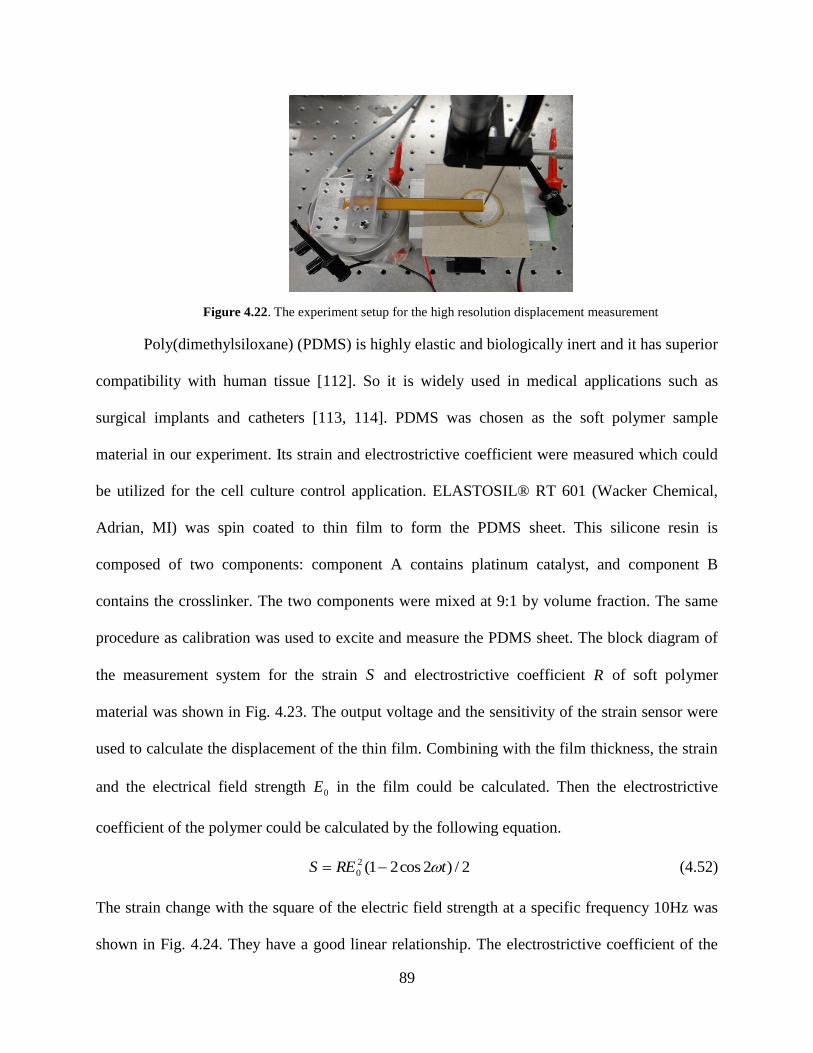
89
Figure 4.22. The experiment setup for the high resolution displacement measurement
Poly(dimethylsiloxane) (PDMS) is highly elastic and biologically inert and it has superior
compatibility with human tissue [112]. So it is widely used in medical applications such as
surgical implants and catheters [113, 114]. PDMS was chosen as the soft polymer sample
material in our experiment. Its strain and electrostrictive coefficient were measured which could
be utilized for the cell culture control application. ELASTOSIL® RT 601 (Wacker Chemical,
Adrian, MI) was spin coated to thin film to form the PDMS sheet. This silicone resin is
composed of two components: component A contains platinum catalyst, and component B
contains the crosslinker. The two components were mixed at 9:1 by volume fraction. The same
procedure as calibration was used to excite and measure the PDMS sheet. The block diagram of
the measurement system for the strain S and electrostrictive coefficient R of soft polymer
material was shown in Fig. 4.23. The output voltage and the sensitivity of the strain sensor were
used to calculate the displacement of the thin film. Combining with the film thickness, the strain
and the electrical field strength 0E in the film could be calculated. Then the electrostrictive
coefficient of the polymer could be calculated by the following equation.
2/)2cos21(2
0 tRES (4.52)
The strain change with the square of the electric field strength at a specific frequency 10Hz was
shown in Fig. 4.24. They have a good linear relationship. The electrostrictive coefficient of the
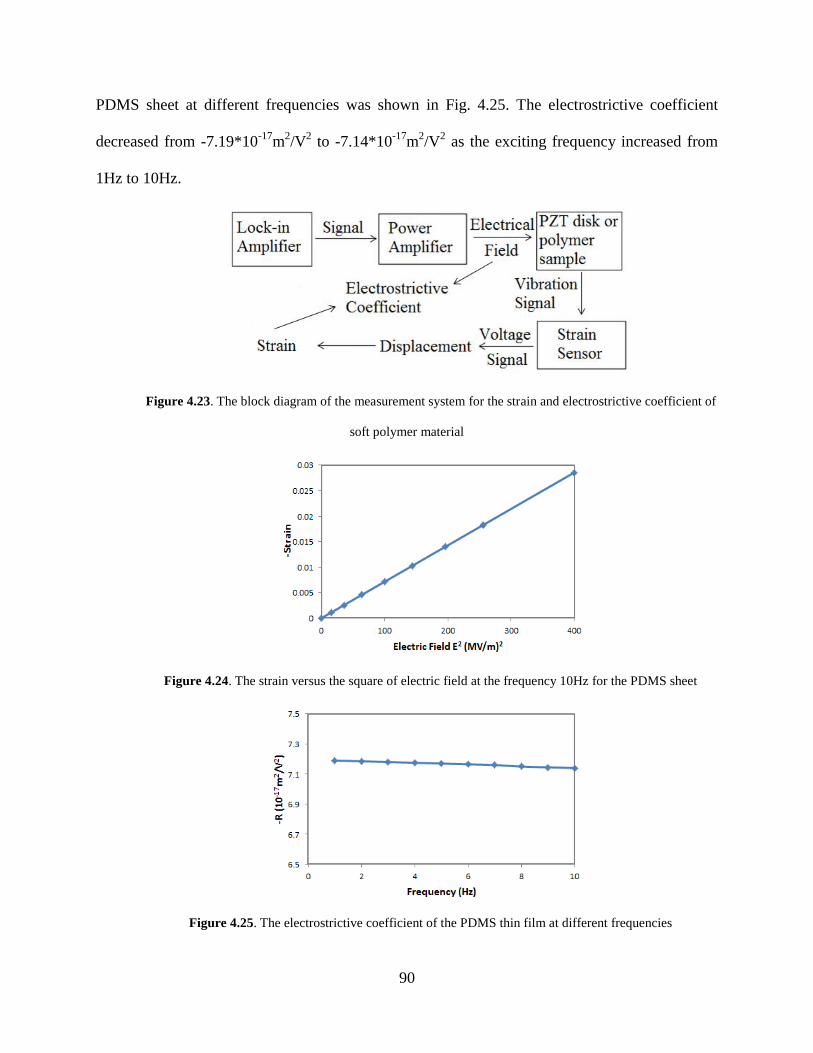
90
PDMS sheet at different frequencies was shown in Fig. 4.25. The electrostrictive coefficient
decreased from -7.19*10-17
m2/V
2 to -7.14*10
-17m
2/V
2 as the exciting frequency increased from
1Hz to 10Hz.
Figure 4.23. The block diagram of the measurement system for the strain and electrostrictive coefficient of
soft polymer material
Figure 4.24. The strain versus the square of electric field at the frequency 10Hz for the PDMS sheet
Figure 4.25. The electrostrictive coefficient of the PDMS thin film at different frequencies
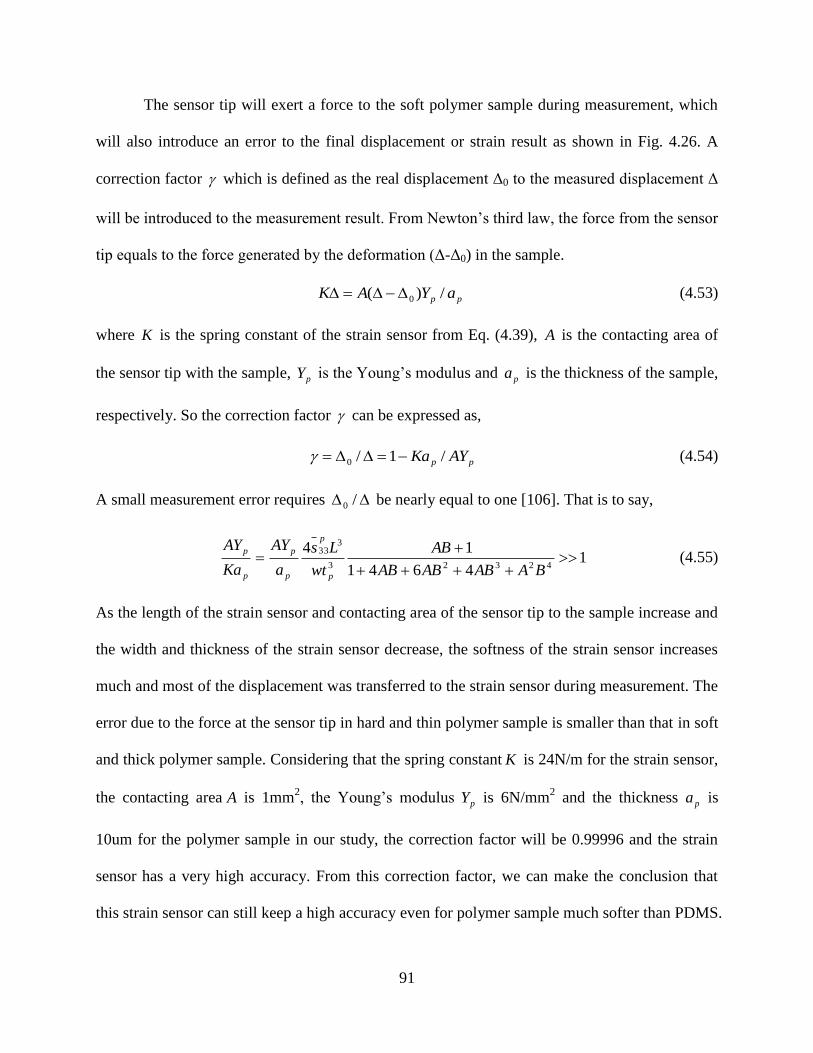
91
The sensor tip will exert a force to the soft polymer sample during measurement, which
will also introduce an error to the final displacement or strain result as shown in Fig. 4.26. A
correction factor which is defined as the real displacement Δ0 to the measured displacement Δ
will be introduced to the measurement result. From Newton’s third law, the force from the sensor
tip equals to the force generated by the deformation (Δ-Δ0) in the sample.
pp aYAK /)( 0 (4.53)
where K is the spring constant of the strain sensor from Eq. (4.39), A is the contacting area of
the sensor tip with the sample, pY is the Young’s modulus and pa is the thickness of the sample,
respectively. So the correction factor can be expressed as,
pp AYKa /1/0 (4.54)
A small measurement error requires /0 be nearly equal to one [106]. That is to say,
14641
1442323
333
BAABABAB
AB
wt
Ls
a
AY
Ka
AY
p
p
p
p
p
p (4.55)
As the length of the strain sensor and contacting area of the sensor tip to the sample increase and
the width and thickness of the strain sensor decrease, the softness of the strain sensor increases
much and most of the displacement was transferred to the strain sensor during measurement. The
error due to the force at the sensor tip in hard and thin polymer sample is smaller than that in soft
and thick polymer sample. Considering that the spring constant K is 24N/m for the strain sensor,
the contacting area A is 1mm2, the Young’s modulus pY is 6N/mm
2 and the thickness pa is
10um for the polymer sample in our study, the correction factor will be 0.99996 and the strain
sensor has a very high accuracy. From this correction factor, we can make the conclusion that
this strain sensor can still keep a high accuracy even for polymer sample much softer than PDMS.
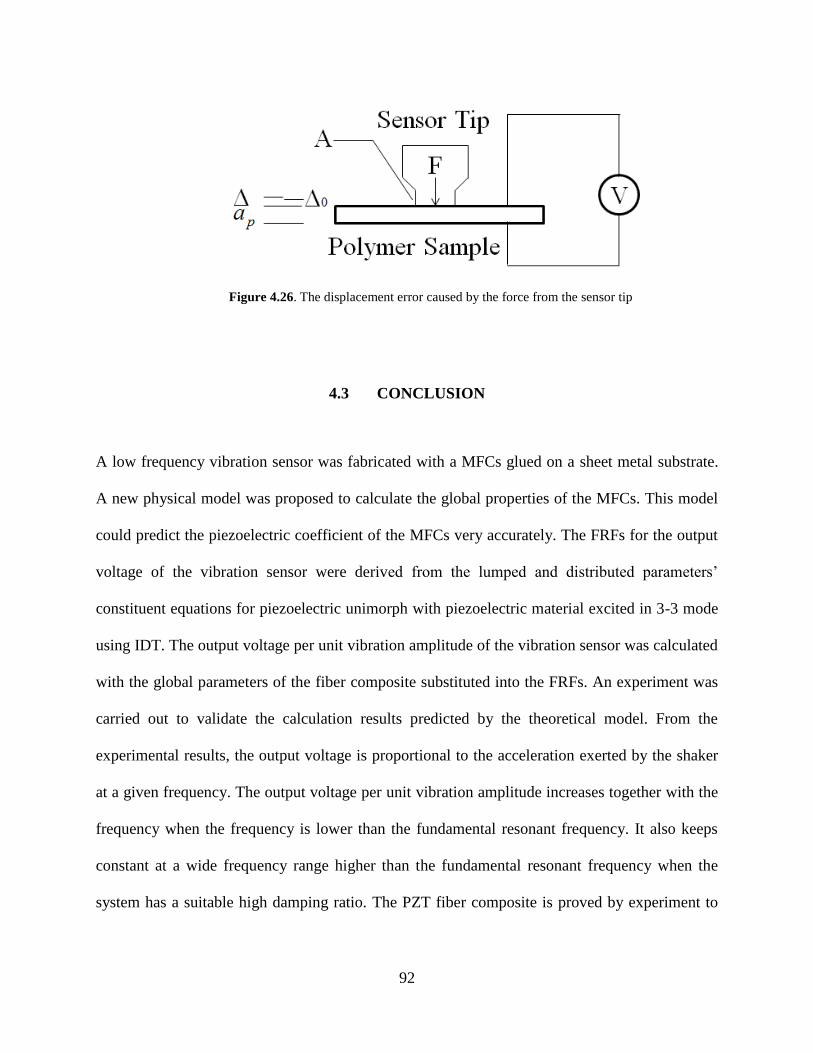
92
Figure 4.26. The displacement error caused by the force from the sensor tip
4.3 CONCLUSION
A low frequency vibration sensor was fabricated with a MFCs glued on a sheet metal substrate.
A new physical model was proposed to calculate the global properties of the MFCs. This model
could predict the piezoelectric coefficient of the MFCs very accurately. The FRFs for the output
voltage of the vibration sensor were derived from the lumped and distributed parameters’
constituent equations for piezoelectric unimorph with piezoelectric material excited in 3-3 mode
using IDT. The output voltage per unit vibration amplitude of the vibration sensor was calculated
with the global parameters of the fiber composite substituted into the FRFs. An experiment was
carried out to validate the calculation results predicted by the theoretical model. From the
experimental results, the output voltage is proportional to the acceleration exerted by the shaker
at a given frequency. The output voltage per unit vibration amplitude increases together with the
frequency when the frequency is lower than the fundamental resonant frequency. It also keeps
constant at a wide frequency range higher than the fundamental resonant frequency when the
system has a suitable high damping ratio. The PZT fiber composite is proved by experiment to
93
be a suitable choice for low frequency vibration sensors and works well as a self-standing active
device.
A strain sensor was also proposed with this fiber composite unimorph to characterize
electric field induced strain response in the out-of-plane direction of soft polymer material
sample. It is also suitable for surface morphology and soft material elastic modulus
characterization. By changing the substrate material and its relative thickness ratio to the fiber
composite, the design of the strain sensor could be optimized for sensitivity or softness
improvement. Compared to the original bimorph design, this new design can keep high
sensitivity and high flexibility features simultaneously. This newly developed strain sensor
worked well over a suitable frequency range. The experiment result was also validated with the
calculation and the result from a laser displacement meter. The consistency among three of them
indicates that this strain sensor is suitable for strain, elastic modulus and surface morphology
measurement with high sensitivity and reliability, especially for soft material with low elastic
modulus.

94
5.0 PZT FIBER COMPOSITE SENSOR FOR MEDICAL APPLICATION
5.1 INTRODUCTION
Hypertension, heart diseases, diabetes, and obesity have seriously threatened human’s healthy
life. They are usually caused by dietary habits, lack of exercise, and the daily living stresses of
modern society. So daily everyday monitoring of some physiological parameters, including pulse
rate, blood pressure and breathing, will help to prevent illnesses and offer valuable information
for the diagnosis and treatment of these diseases [115].
Breathing is an important physiological activity to maintain human life, provide oxygen
to the body and exhale carbon dioxide. Several physiological problems, such as respiratory
diseases, epilepsy, and neuromuscular diseases which may cause respiratory failure, will cause
breathing cessation or obstructive apnea, which may eventually develop into a life-threatening
condition. And irregular cardiac rhythms and breathing cessation are usually thought to be the
causes for sudden infant death syndrome (SIDS or cot death) and sudden adult death syndrome
(SADS) [116]. As an illustration of the magnitude of the population affected by breathing apnea,
more than 18 million American adults have sleep apnea. In the National Science Foundation
(NSF) released 2005 Sleep in America poll, more than one in four respondents (26%) are at risk
for sleep apnea, or pauses in breathing during sleep. Sleep apnea is a serious sleep disorder
associated with hypertension and stroke. 8% of respondents experienced or had been observed

95
having pauses in their breathing during sleep at least three nights per week [117]. Therefore it is
necessary to detect breathing cessation and introduce medical therapy timely. Breathing airflow
monitoring is an effective method to detect and monitor respiratory disorders or cessation [118].
Respiratory rate and depth are also important parameters during respiration. Respiratory rate is
the number of breaths taken by a people within a certain amount of time. Respiratory depth can
be estimated by the volume of air inhaled or exhaled. Average respiratory rate for a healthy adult
at rest usually ranges from 12 to 20 times per minute (0.2-0.33Hz) [119, 120]. And it will arrive
35-45 times for adults during strenuous exercise. With such a slow rate, more accurate records
will be acquired by counting the number of breaths over a long time. Clearly, there is an urgent
need for suitable breathing sensors which are portable, reliable, and easy for daily use.
Several kinds of technologies and devices have been developed to monitor and measure
breathing, such as inductive pneumotachograph, thermistors and thermocouples, oximetry, nasal
prongs, and thoraco-abdominal band [121]. Airflow can be sensed by changes of temperature,
humidity, component, or sound in breathed air [122]. Thermistors and thermocouples are most
ordinary used devices for measuring the temperature change caused by exhalation and inhalation
[123]. These devices have the capability to detect total airflow absence such as apneas with a
very time-consuming process, and their low sensitivity to respiratory airflow makes quantitative
information and detailed diagnosis of breathing disorders impossible [124]. Oximetry technique
detects infrared light absorbed by oxygen in blood to predict breathing condition. This method
uses signal emitter and receiver powered by outer energy source which is not convenient and
power efficient. Nasal prongs and oesophageal manometry pressure sensor sometimes are very
uncomfortable and cannot be tolerated by patients [125]. Pneumotachograph needs to combine
other recording instrument and is not suitable for routine diagnosis. Electrical impedance
96
plethysmography measures impedance variations across the chest accompanying with expansion
and contraction of the chest provoked by breathing to discover respiration indirectly [126]. The
impedance plethysmography signal has strong background noise and is easily to be disturbed by
patient movement or change in posture [127]. The last two methods are suitable to be performed
in hospital, but are not practical in homecare. A respiratory measurement system is expected to
be developed, which is small, portable, comfort, low-cost, home-based, active (without outer
energy source), and can monitor breathing quantitatively.
Piezoelectric sensors and actuators have been widely applied to vibration detection and
control applications for their simple structures and high energy conversion efficiency. Bimorph
or unimorph are typical structures for pressure, impact, acceleration and vibration measurements
[128]. Piezoelectric single crystals, piezoelectric ceramics, and polymers are usually chosen for
electromechanical sensors and actuators applications. Piezoelectric lead zirconate titanate (PZT)
ceramics are commonly used for sensors and transducers due to their high piezoelectric
coefficients and large bandwidth. But the brittleness and hardness of bulk PZT piezoelectric
ceramics make them difficult to be used on curved, movable, and unstable structure that is
subjected to large deformation. Fateful errors in measurement can happen due to brittle fracture.
In addition, the mismatch of acoustic impedances makes it less effective to use PZT ceramics
device for human physiological activity monitoring. Piezoelectric polymers with high flexibility
can keep a steady contact onto the human body [129]. But their low electromechanical coupling
coefficient leads to low sensitivity in detecting subtle physiological signals. Two alternative
methods have been developed to overcome these disadvantages [92]. One uses thin film
deposition of PZT on the substrate [93] and the other uses packaged PZT composites. PZT thin
film needs complex technical processes to be integrated on the substrate and has low charge

97
output. Compared to piezoelectric membrane, piezoelectric composites can be much thicker and
generate much more charge. High flexibility can also be expected for PZT composites by
choosing appropriate polymer matrix, thus they can be used to develop wearable and comfortable
biomedical sensors without disturbing daily activities [130]. Devices made up of piezoelectric
composites may provide better sensitivity to detect detailed information with diagnostic value.
Piezoelectric composites usually comprise of one piezoelectric material layer between
two soft thin encapsulating layers. 1-3 piezoelectric composites which are most commonly used
are composed of piezoelectric ceramic rods embedded in a non-piezoelectric matrix. PZT fiber
composites can substantially decouple the lateral effect applied to the sensor synchronously and
a large sensitivity can be obtained from the sensor [11]. The benefits of using PZT fiber
composites membrane include lower dielectric constant, improved elastic compliance and
improved electromechanical coupling coefficient that are well suitable for vibration detection
and sensor application. Both d31 and d33 MFCs transducers have been developed and are
currently produced by Smart Material Corp, Sarasota, Florida. This MFCs transducer can also be
used as force, strain, pressure, acceleration, acoustics emission sensors and applied to several
different fields, including medical diagnosis, physiological monitoring, and so on [131, 132].
5.2 RECTANGULAR PZT FIBER COMPOSITE BREATHING SENSOR
5.2.1 Theoretical derivation
In this study, a fiber composite breathing sensor was fabricated and experimentally studied for
monitoring respiratory rate and depth under different physiological conditions. Firstly, the
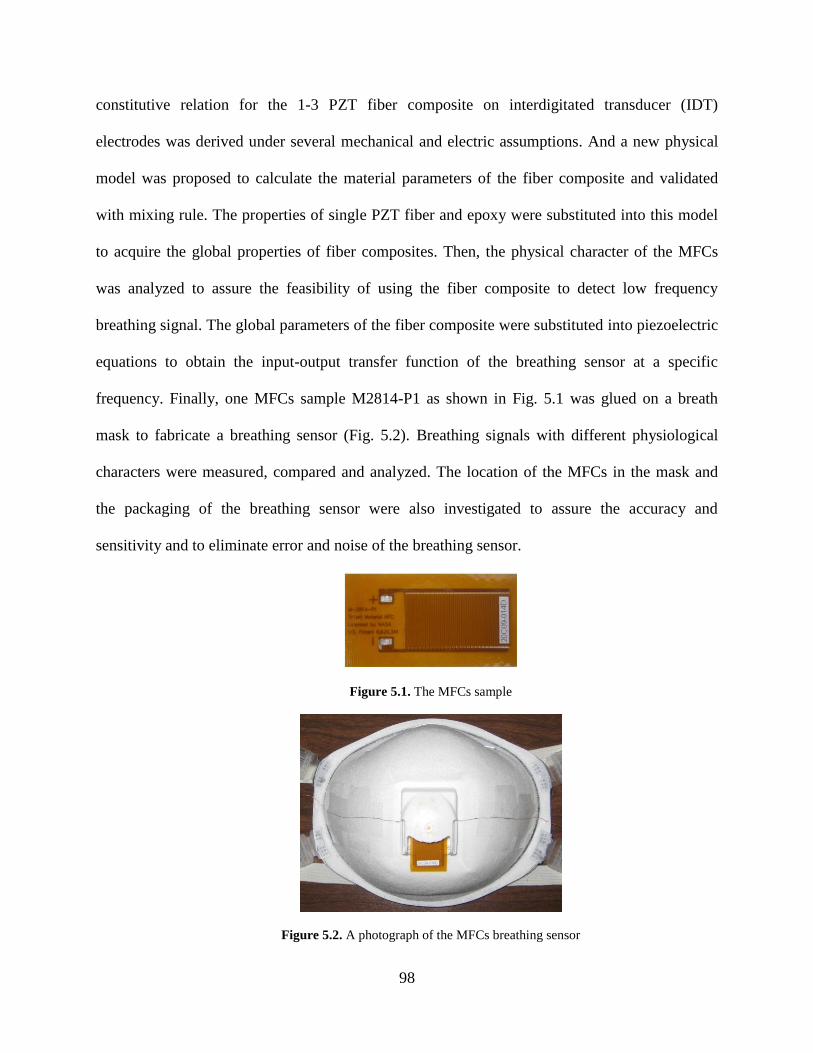
98
constitutive relation for the 1-3 PZT fiber composite on interdigitated transducer (IDT)
electrodes was derived under several mechanical and electric assumptions. And a new physical
model was proposed to calculate the material parameters of the fiber composite and validated
with mixing rule. The properties of single PZT fiber and epoxy were substituted into this model
to acquire the global properties of fiber composites. Then, the physical character of the MFCs
was analyzed to assure the feasibility of using the fiber composite to detect low frequency
breathing signal. The global parameters of the fiber composite were substituted into piezoelectric
equations to obtain the input-output transfer function of the breathing sensor at a specific
frequency. Finally, one MFCs sample M2814-P1 as shown in Fig. 5.1 was glued on a breath
mask to fabricate a breathing sensor (Fig. 5.2). Breathing signals with different physiological
characters were measured, compared and analyzed. The location of the MFCs in the mask and
the packaging of the breathing sensor were also investigated to assure the accuracy and
sensitivity and to eliminate error and noise of the breathing sensor.
Figure 5.1. The MFCs sample
Figure 5.2. A photograph of the MFCs breathing sensor
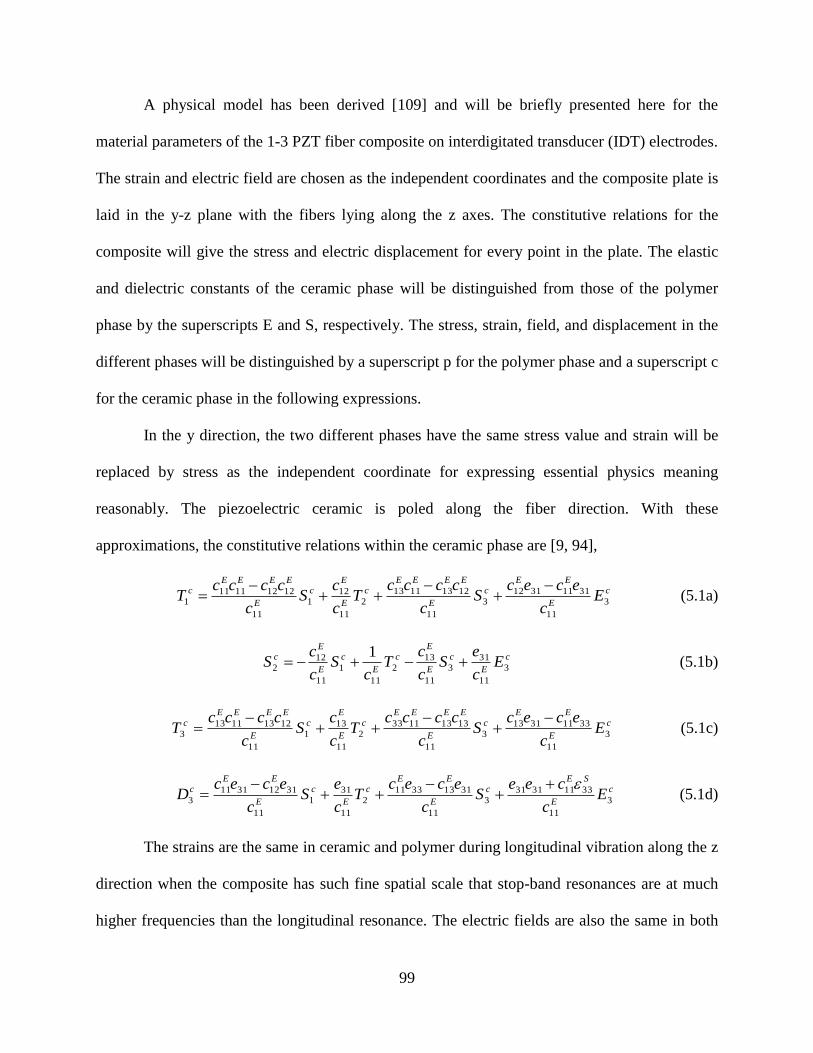
99
A physical model has been derived [109] and will be briefly presented here for the
material parameters of the 1-3 PZT fiber composite on interdigitated transducer (IDT) electrodes.
The strain and electric field are chosen as the independent coordinates and the composite plate is
laid in the y-z plane with the fibers lying along the z axes. The constitutive relations for the
composite will give the stress and electric displacement for every point in the plate. The elastic
and dielectric constants of the ceramic phase will be distinguished from those of the polymer
phase by the superscripts E and S, respectively. The stress, strain, field, and displacement in the
different phases will be distinguished by a superscript p for the polymer phase and a superscript c
for the ceramic phase in the following expressions.
In the y direction, the two different phases have the same stress value and strain will be
replaced by stress as the independent coordinate for expressing essential physics meaning
reasonably. The piezoelectric ceramic is poled along the fiber direction. With these
approximations, the constitutive relations within the ceramic phase are [9, 94],
c
E
EEc
E
EEEEc
E
Ec
E
EEEEc E
c
ececS
c
ccccT
c
cS
c
ccccT 3
11
311131123
11
121311132
11
121
11
121211111
(5.1a)
c
E
c
E
Ec
E
c
E
Ec E
c
eS
c
cT
cS
c
cS 3
11
313
11
132
11
1
11
122
1 (5.1b)
c
E
EEc
E
EEEEc
E
Ec
E
EEEEc E
c
ececS
c
ccccT
c
cS
c
ccccT 3
11
33113113
3
11
13131133
2
11
13
1
11
12131113
3
(5.1c)
c
E
SEc
E
EEc
E
c
E
EEc E
c
ceeS
c
ececT
c
eS
c
ececD 3
11
331131313
11
311333112
11
311
11
311231113
(5.1d)
The strains are the same in ceramic and polymer during longitudinal vibration along the z
direction when the composite has such fine spatial scale that stop-band resonances are at much
higher frequencies than the longitudinal resonance. The electric fields are also the same in both
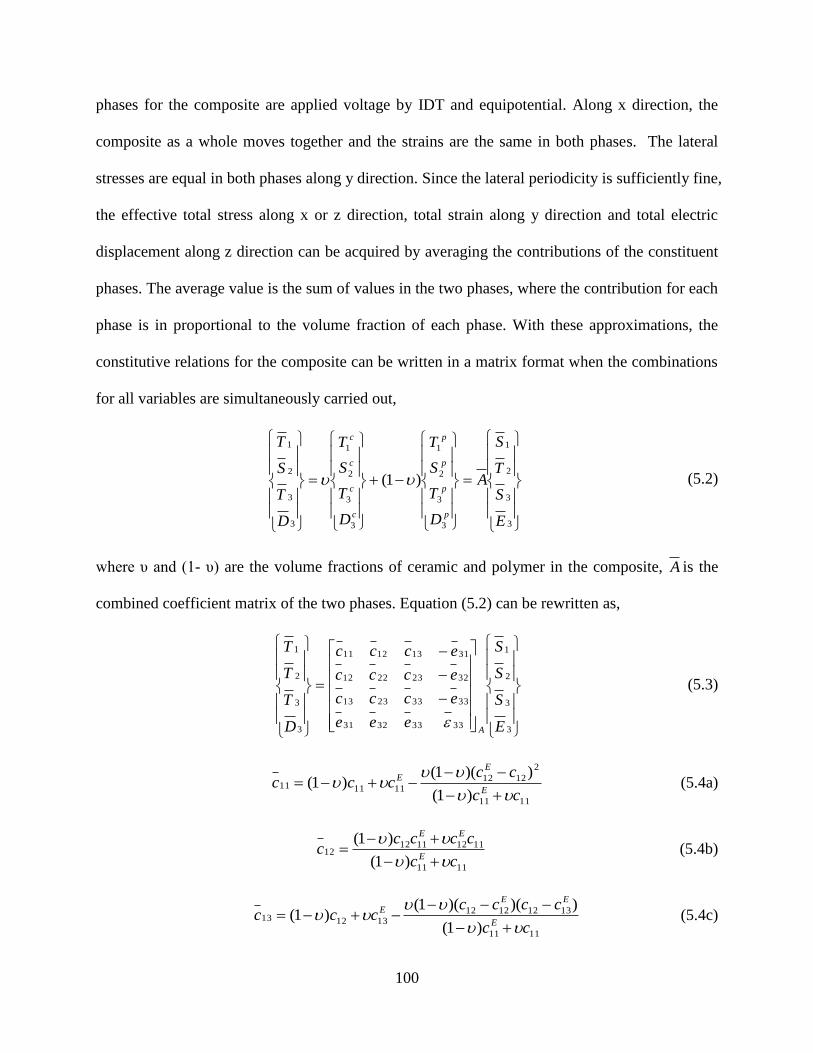
100
phases for the composite are applied voltage by IDT and equipotential. Along x direction, the
composite as a whole moves together and the strains are the same in both phases. The lateral
stresses are equal in both phases along y direction. Since the lateral periodicity is sufficiently fine,
the effective total stress along x or z direction, total strain along y direction and total electric
displacement along z direction can be acquired by averaging the contributions of the constituent
phases. The average value is the sum of values in the two phases, where the contribution for each
phase is in proportional to the volume fraction of each phase. With these approximations, the
constitutive relations for the composite can be written in a matrix format when the combinations
for all variables are simultaneously carried out,
3
3
2
1
3
3
2
1
3
3
2
1
3
3
2
1
)1(
E
S
T
S
A
D
T
S
T
D
T
S
T
D
T
S
T
p
p
p
p
c
c
c
c
(5.2)
where υ and (1- υ) are the volume fractions of ceramic and polymer in the composite, A is the
combined coefficient matrix of the two phases. Equation (5.2) can be rewritten as,
3
3
2
1
33333231
33332313
32232212
31131211
3
3
2
1
E
S
S
S
eee
eccc
eccc
eccc
D
T
T
T
A
(5.3)
1111
2
1212111111
)1(
))(1()1(
cc
ccccc
E
EE
(5.4a)
1111
1112111212
)1(
)1(
cc
ccccc
E
EE
(5.4b)
1111
13121212
131213
)1(
))()(1()1(
cc
ccccccc
E
EEE
(5.4c)

101
1111
111122
)1( cc
ccc
E
E
(5.4d)
1111
1113111223
)1(
)1(
cc
ccccc
E
EE
(5.4e)
1111
2
1312
331133
)1(
))(1()1(
cc
ccccc
E
EE
(5.4f)
))1(
))(1((
1111
121231
3131
cc
cceee
E
E
(5.4g)
1111
311132
)1( cc
ece
E
(5.4h)
))1(
))(1((
1111
311312
3333
cc
eccee
E
E
(5.4i)
1111
3131
331133
)1(
)1()1(
cc
eeE
S
(5.4j)
The composite's material parameters are given in expressions (5.4) in terms of the material
parameters of the constituent phases and their proportions. The ratios of the equivalent elastic
stiffness coefficient in 1 and 3 directions over the original elastic stiffness coefficient change
with PZT fiber volume fraction were shown in Fig. 5.3. The ratios of the equivalent piezoelectric
coefficient in 1 and 3 directions over the original piezoelectric coefficient change with fibers’
volume fraction were shown in Fig. 5.4.
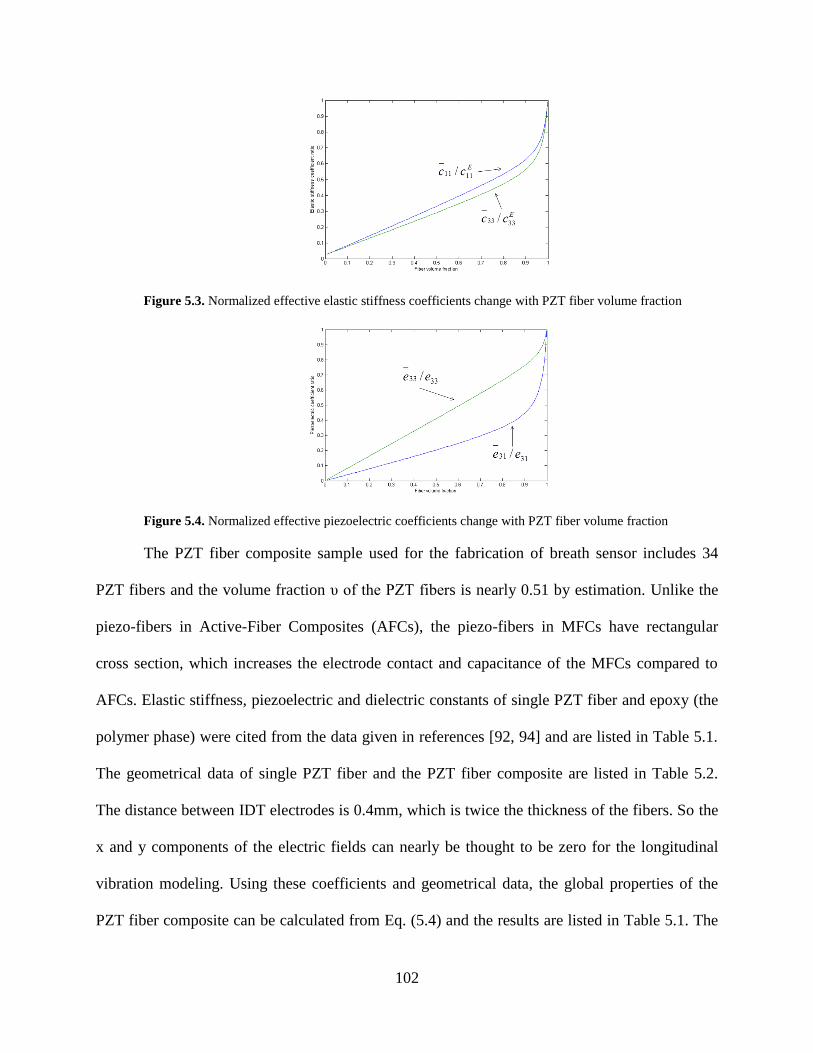
102
Figure 5.3. Normalized effective elastic stiffness coefficients change with PZT fiber volume fraction
Figure 5.4. Normalized effective piezoelectric coefficients change with PZT fiber volume fraction
The PZT fiber composite sample used for the fabrication of breath sensor includes 34
PZT fibers and the volume fraction υ of the PZT fibers is nearly 0.51 by estimation. Unlike the
piezo-fibers in Active-Fiber Composites (AFCs), the piezo-fibers in MFCs have rectangular
cross section, which increases the electrode contact and capacitance of the MFCs compared to
AFCs. Elastic stiffness, piezoelectric and dielectric constants of single PZT fiber and epoxy (the
polymer phase) were cited from the data given in references [92, 94] and are listed in Table 5.1.
The geometrical data of single PZT fiber and the PZT fiber composite are listed in Table 5.2.
The distance between IDT electrodes is 0.4mm, which is twice the thickness of the fibers. So the
x and y components of the electric fields can nearly be thought to be zero for the longitudinal
vibration modeling. Using these coefficients and geometrical data, the global properties of the
PZT fiber composite can be calculated from Eq. (5.4) and the results are listed in Table 5.1. The
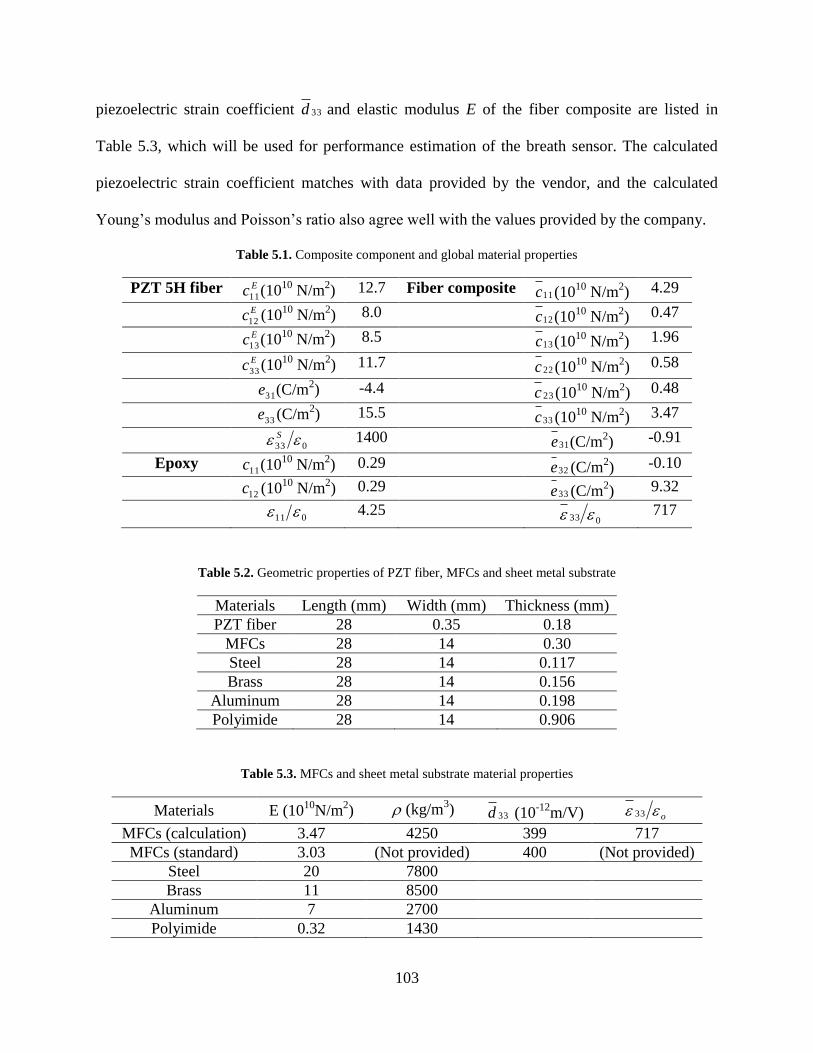
103
piezoelectric strain coefficient 33d and elastic modulus E of the fiber composite are listed in
Table 5.3, which will be used for performance estimation of the breath sensor. The calculated
piezoelectric strain coefficient matches with data provided by the vendor, and the calculated
Young’s modulus and Poisson’s ratio also agree well with the values provided by the company.
Table 5.1. Composite component and global material properties
PZT 5H fiber Ec11(1010
N/m2) 12.7 Fiber composite
11c (1010
N/m2) 4.29
Ec12 (1010
N/m2) 8.0
12c (1010
N/m2) 0.47
Ec13(1010
N/m2) 8.5
13c (1010
N/m2) 1.96
Ec33 (1010
N/m2) 11.7
22c (1010
N/m2) 0.58
31e (C/m
2) -4.4
23c (1010
N/m2) 0.48
33e (C/m
2) 15.5
33c (1010
N/m2) 3.47
033 S 1400
31e (C/m2) -0.91
Epoxy 11c (10
10 N/m
2) 0.29
32e (C/m2) -0.10
12c (10
10 N/m
2) 0.29
33e (C/m2) 9.32
011 4.25
033 717
Table 5.2. Geometric properties of PZT fiber, MFCs and sheet metal substrate
Materials Length (mm) Width (mm) Thickness (mm)
PZT fiber 28 0.35 0.18
MFCs 28 14 0.30
Steel 28 14 0.117
Brass 28 14 0.156
Aluminum 28 14 0.198
Polyimide 28 14 0.906
Table 5.3. MFCs and sheet metal substrate material properties
Materials E (1010
N/m2) (kg/m
3) 33d (10
-12m/V) o 33
MFCs (calculation) 3.47 4250 399 717
MFCs (standard) 3.03 (Not provided) 400 (Not provided)
Steel 20 7800
Brass 11 8500
Aluminum 7 2700
Polyimide 0.32 1430

104
The MFCs provided by Smart Material Corp were poled along the length direction with
IDT electrodes. It was bonded on a thin metal substrate and glued on a breath mask using epoxy
to form a cantilevered breathing sensor. The sheet metal substrate with a suitable thickness was
chosen to make the neutral plane of the unimorph locate in the substrate material. The
piezoelectric PZT fibers would experience compression or elongation when excited by periodic
air caused by breath, thus electrical output signal will record the breath signal patterns.
The equivalent circuit for the fiber composite is shown in Fig. 5.5, which consists of a
leakage resistance pR and a dielectric capacitance pC of the piezoelectric material. The
breathing sensor should not only generate sufficient amount of charge under applied pressure,
but also maintain the charge for an enough long time to be measured by an instrument. The
charge maintained time length is proportional to the time constant PPCR . Using AhR pp
and pp hAC for a piezoelectric device with resistivity , dielectric permittivity ,
thickness ph , and area A , the time constant changes to . Thus the piezoelectric material’s
properties determine the time constant. The lower frequency limit ( LLf ) of a piezoelectric device
is inversely proportional to the time constant ppLL CRf 2/1 . The signal amplitude reduces to
70% and there is a 45° phase shift between input and output signals at this frequency limit. The
amplitude error and phase shift are not acceptable below LLf for measuring the physical
parameters. The time constant for the fiber composite sample is 769s in our study. The large time
constant of the MFCs caused by high impedance of the PZT fiber is desirable for the MFCs to be
used to measure the low frequency breathing signal.

105
Figure 5.5. The equivalent circuit of the PZT fiber composite
As was shown in Fig. 5.6, one end of the breathing sensor is fixed on plastic frame of the
breath mask and the other end is free to move. The pressure generated by human respiration acts
on the sensor surface and stretches and compresses the PZT fibers in the MFCs to generate
charge by piezoelectric effect. A simple mass-spring-damper structure can be used to model the
dynamic behavior of the breathing sensor, in which the mass M of the device is restrained by a
damper D and spring K as shown in Fig. 5.7. If a breathing airflow with force F acts on the
breathing sensor, which has a natural frequency MKn , a vibration frequency js , a
damping ratio KMD 2 , and a time constant PPCR , the instantaneous open-circuit
voltage in frequency domain can be expressed as [95],
Fs
s
ssKC
KsV
nn
n
p
q
12 22
2
(5.5)
where qK is the charge generated per unit tip displacement, pC is the capacitance of the
piezoelectric unimorph, K is the spring constant. The force F is proportional to the pressure
induced by the breathing airflow,
SPF (5.6)
where S is the effective area of the breathing sensor with airflow pressure acting on. The output
voltage can be related to the input pressure as,
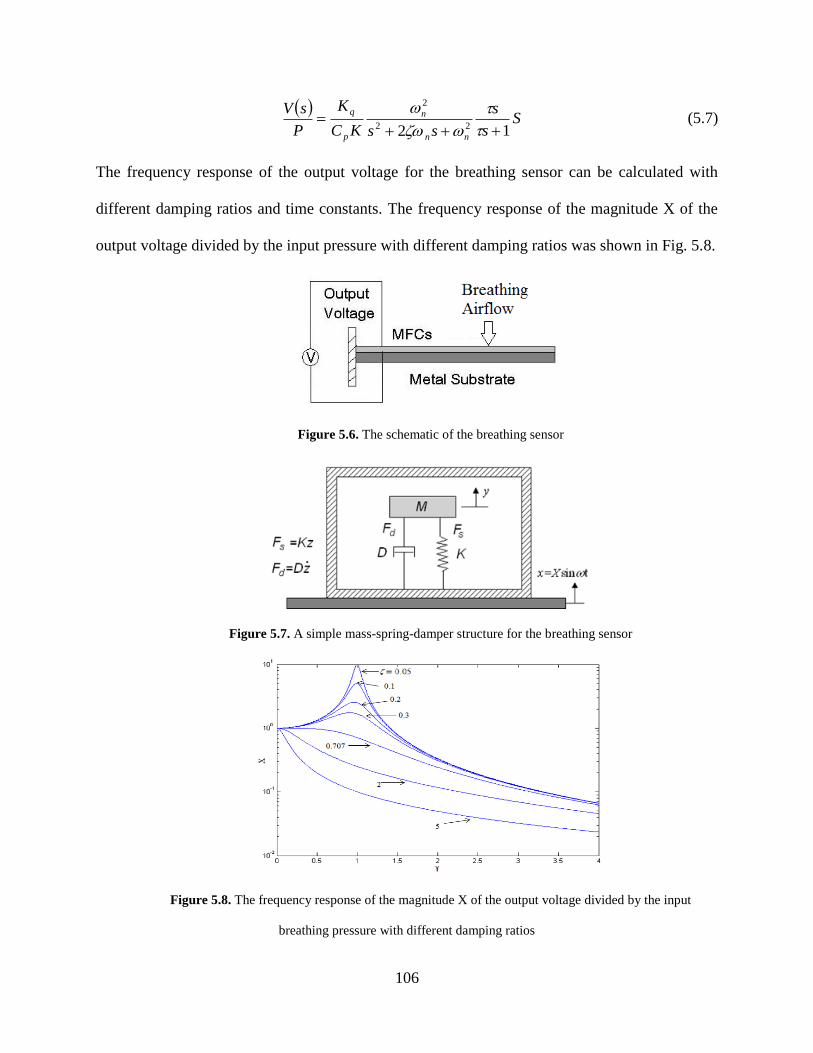
106
S
s
s
ssKC
K
P
sV
nn
n
p
q
12 22
2
(5.7)
The frequency response of the output voltage for the breathing sensor can be calculated with
different damping ratios and time constants. The frequency response of the magnitude X of the
output voltage divided by the input pressure with different damping ratios was shown in Fig. 5.8.
Figure 5.6. The schematic of the breathing sensor
Figure 5.7. A simple mass-spring-damper structure for the breathing sensor
Figure 5.8. The frequency response of the magnitude X of the output voltage divided by the input
breathing pressure with different damping ratios
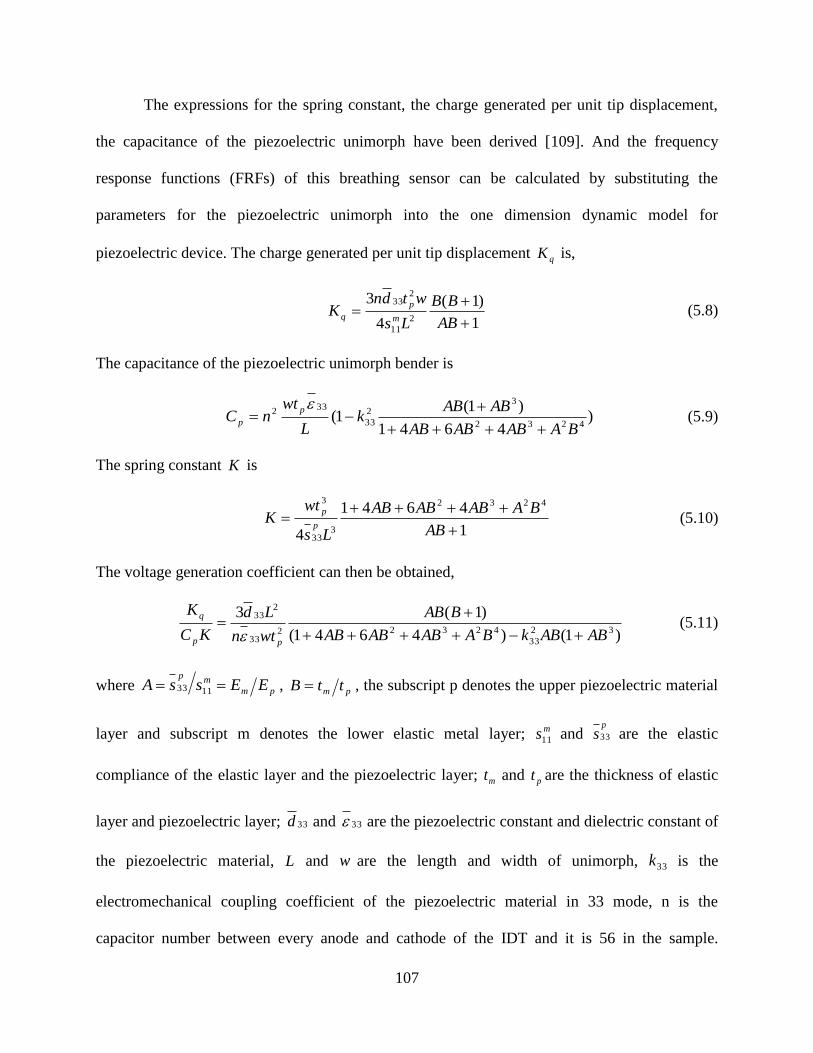
107
The expressions for the spring constant, the charge generated per unit tip displacement,
the capacitance of the piezoelectric unimorph have been derived [109]. And the frequency
response functions (FRFs) of this breathing sensor can be calculated by substituting the
parameters for the piezoelectric unimorph into the one dimension dynamic model for
piezoelectric device. The charge generated per unit tip displacement qK is,
1
)1(
4
32
11
233
AB
BB
Ls
wtdnK
m
p
q (5.8)
The capacitance of the piezoelectric unimorph bender is
)4641
)1(1(
4232
32
33
332
BAABABAB
ABABk
L
wtnC
p
p
(5.9)
The spring constant K is
1
4641
4
4232
333
3
AB
BAABABAB
Ls
wtK
p
p (5.10)
The voltage generation coefficient can then be obtained,
)1()4641(
)1(332
33
4232233
233
ABABkBAABABAB
BAB
wtn
Ld
KC
K
pp
q
(5.11)
where pm
mp
EEssA 1133 , pm ttB , the subscript p denotes the upper piezoelectric material
layer and subscript m denotes the lower elastic metal layer; ms11 and p
s33 are the elastic
compliance of the elastic layer and the piezoelectric layer; mt and pt are the thickness of elastic
layer and piezoelectric layer; 33d and 33 are the piezoelectric constant and dielectric constant of
the piezoelectric material, L and w are the length and width of unimorph, 33k is the
electromechanical coupling coefficient of the piezoelectric material in 33 mode, n is the
capacitor number between every anode and cathode of the IDT and it is 56 in the sample.
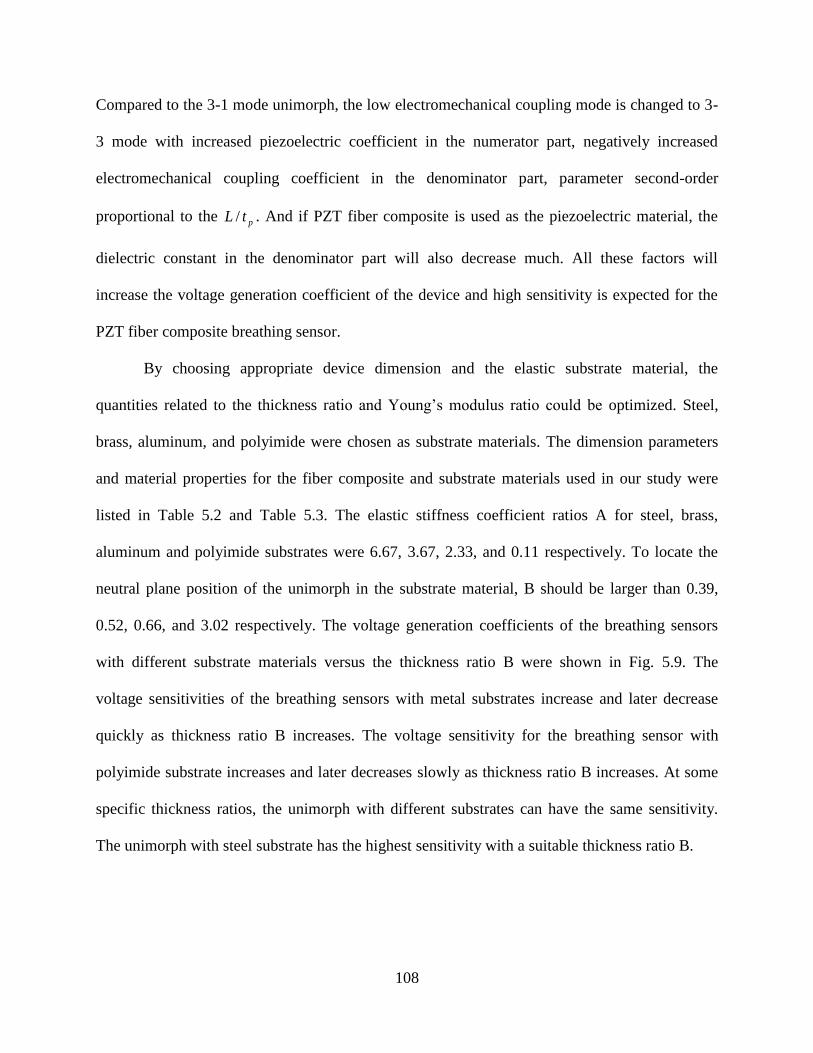
108
Compared to the 3-1 mode unimorph, the low electromechanical coupling mode is changed to 3-
3 mode with increased piezoelectric coefficient in the numerator part, negatively increased
electromechanical coupling coefficient in the denominator part, parameter second-order
proportional to the ptL / . And if PZT fiber composite is used as the piezoelectric material, the
dielectric constant in the denominator part will also decrease much. All these factors will
increase the voltage generation coefficient of the device and high sensitivity is expected for the
PZT fiber composite breathing sensor.
By choosing appropriate device dimension and the elastic substrate material, the
quantities related to the thickness ratio and Young’s modulus ratio could be optimized. Steel,
brass, aluminum, and polyimide were chosen as substrate materials. The dimension parameters
and material properties for the fiber composite and substrate materials used in our study were
listed in Table 5.2 and Table 5.3. The elastic stiffness coefficient ratios A for steel, brass,
aluminum and polyimide substrates were 6.67, 3.67, 2.33, and 0.11 respectively. To locate the
neutral plane position of the unimorph in the substrate material, B should be larger than 0.39,
0.52, 0.66, and 3.02 respectively. The voltage generation coefficients of the breathing sensors
with different substrate materials versus the thickness ratio B were shown in Fig. 5.9. The
voltage sensitivities of the breathing sensors with metal substrates increase and later decrease
quickly as thickness ratio B increases. The voltage sensitivity for the breathing sensor with
polyimide substrate increases and later decreases slowly as thickness ratio B increases. At some
specific thickness ratios, the unimorph with different substrates can have the same sensitivity.
The unimorph with steel substrate has the highest sensitivity with a suitable thickness ratio B.
109
Figure 5.9. The voltage generation coefficients versus the thickness ratio B for the breathing sensors with
different substrate materials
The fundamental bending frequency of a piezoelectric unimorph is given by [97],
2/14232
2 )1)(1(
4641
32
52.3
ABBC
BAABABABE
L
t
p
pp
n
(5.12)
where C is the density ratio pm / of the elastic layer and the piezoelectric layer.
5.2.2 Experiment
One experiment was carried out to investigate the performance of MFCs breathing sensor under
different physiological conditions. The block diagram of the respiration measurement system
was shown in Fig. 5.10. Respiratory pressure deflected the breathing sensor and the voltage
signal generated was fed into a dual mode amplifier (kistler, type 5010) to convert the high
impedance charge input (q) into a voltage output. The output voltage from the charge amplifier
was transferred to the computer by a GPIB controller (National Instrument) and recorded by a
short LabVIEW program. The input insulation resistance of the dual mode amplifier was 1014
Ω.
With the dimension parameters and resistivity (1011
Ω*m) of the PZT fibers, the resistance of the
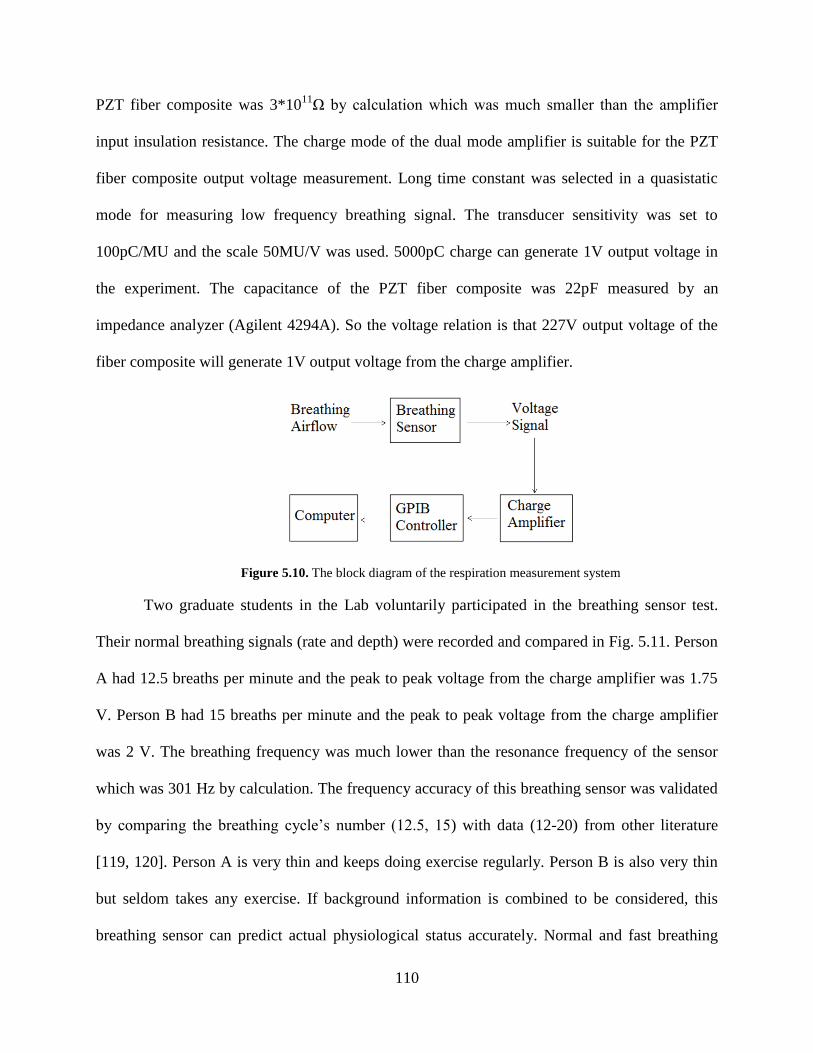
110
PZT fiber composite was 3*1011
Ω by calculation which was much smaller than the amplifier
input insulation resistance. The charge mode of the dual mode amplifier is suitable for the PZT
fiber composite output voltage measurement. Long time constant was selected in a quasistatic
mode for measuring low frequency breathing signal. The transducer sensitivity was set to
100pC/MU and the scale 50MU/V was used. 5000pC charge can generate 1V output voltage in
the experiment. The capacitance of the PZT fiber composite was 22pF measured by an
impedance analyzer (Agilent 4294A). So the voltage relation is that 227V output voltage of the
fiber composite will generate 1V output voltage from the charge amplifier.
Figure 5.10. The block diagram of the respiration measurement system
Two graduate students in the Lab voluntarily participated in the breathing sensor test.
Their normal breathing signals (rate and depth) were recorded and compared in Fig. 5.11. Person
A had 12.5 breaths per minute and the peak to peak voltage from the charge amplifier was 1.75
V. Person B had 15 breaths per minute and the peak to peak voltage from the charge amplifier
was 2 V. The breathing frequency was much lower than the resonance frequency of the sensor
which was 301 Hz by calculation. The frequency accuracy of this breathing sensor was validated
by comparing the breathing cycle’s number (12.5, 15) with data (12-20) from other literature
[119, 120]. Person A is very thin and keeps doing exercise regularly. Person B is also very thin
but seldom takes any exercise. If background information is combined to be considered, this
breathing sensor can predict actual physiological status accurately. Normal and fast breathing
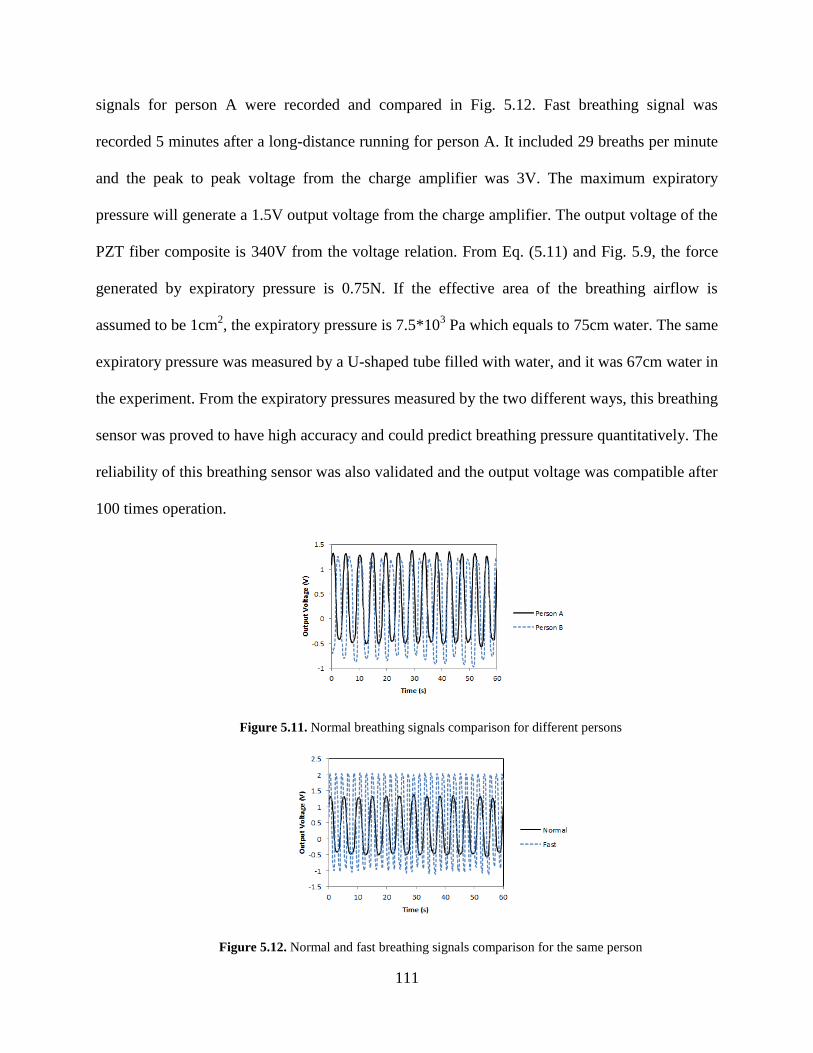
111
signals for person A were recorded and compared in Fig. 5.12. Fast breathing signal was
recorded 5 minutes after a long-distance running for person A. It included 29 breaths per minute
and the peak to peak voltage from the charge amplifier was 3V. The maximum expiratory
pressure will generate a 1.5V output voltage from the charge amplifier. The output voltage of the
PZT fiber composite is 340V from the voltage relation. From Eq. (5.11) and Fig. 5.9, the force
generated by expiratory pressure is 0.75N. If the effective area of the breathing airflow is
assumed to be 1cm2, the expiratory pressure is 7.5*10
3 Pa which equals to 75cm water. The same
expiratory pressure was measured by a U-shaped tube filled with water, and it was 67cm water in
the experiment. From the expiratory pressures measured by the two different ways, this breathing
sensor was proved to have high accuracy and could predict breathing pressure quantitatively. The
reliability of this breathing sensor was also validated and the output voltage was compatible after
100 times operation.
Figure 5.11. Normal breathing signals comparison for different persons
Figure 5.12. Normal and fast breathing signals comparison for the same person
112
5.2.3 Discussion
The location of the MFCs in the breath mask will affect the sensitivity and accuracy of the output
signal patterns significantly. For better sensitivity and repeatable monitoring results, it is
desirable that the breathing signal only comes from nose and will not be superposed by the signal
from mouth breathing. In addition, the MFCs sensor should be well positioned for effective
coupling between the breathing airflow and mechanical deflection of the device. This also
requires that the surface of the MFCs breathing sensor is perpendicular to the breathing airflow
direction. Breathing airflow can be restricted only from nose just with mouse closed.
The packaging of the breathing sensor is also an important factor to determine the final
measurement result. Suitable packaging can acquire most of the signal and eliminate noise and
error. Leakage of breathing airflow may happen in the cotton part of the mask. Plastic thin film
was glued onto the inside surface of the mask to seal it and avoid leakage. Three noise sources,
such as environment, internal, and sensor, should be considered in sensor design. Airflows from
environment may act on the sensor surface and disturb the breathing signal. The mask contains a
plastic cover in front of the MFCs to avoid them. Pyroelectric or thermoelectric effects of the
piezoelectric material caused by temperature variations may also generate noise signal to the
output voltage. Constant temperature was kept during measurement. Other physiological signals,
such as sphygmus, heart-beat, may excite vibration signal which will transmit across the body to
the sensor. The cotton part of the breath mask can isolate these signals from the MFCs and retain
the breathing signal acting on the MFCs. MOS-FET of the charge amplifier has a leakage current
lower than ±0.03 pC/s which will cause nearly a ±3mV/s signal drift. The maximum drift in one
minute time range is 0.18V which is much smaller to the output voltage. Low noise cable was
113
used to connect the breathing sensor to the charge amplifier to avoid triboelectric effect. The
sensor was fixed during measurement to eliminate vibration influence.
5.3 ANNULAR PZT FIBER COMPOSITE BREATHING SENSOR
5.3.1 Theoretical derivation
In this study, an annular structure PZT fiber composite was fabricated with PZT fibers and
polyimide thin film as shown in Fig. 5.13. It was glued onto a mask and utilized as a breathing
sensor to monitor respiratory rate and depth under different physiological conditions as shown in
Fig. 5.14. The global properties of the PZT fiber composite were predicted with mixing rule and
the composite was assumed to be a piece of homogeneous piezoelectric thin film. The inner
radius deflection and output voltage relation of this breathing sensor was derived with polar
coordinate piezoelectric constitutive equations. The breathing pressure was replaced by an
equivalent concentrated force. Then the relation between the force and the inner radius deflection
for this breathing sensor was derived for the final input-output transfer function of the breathing
pressure and the output voltage. Breathing signals under different physiological characters were
measured, compared and analyzed. The packaging of the breathing sensor was emphasized to
assure the accuracy and sensitivity of the output signal and several technical details were
considered and modified to eliminate error and lower noise. The performances of this
axisymmetric annular configuration were compared with commercial rectangular MFCs [133]
for improvement and industrial batch manufacturing feasibility analysis.
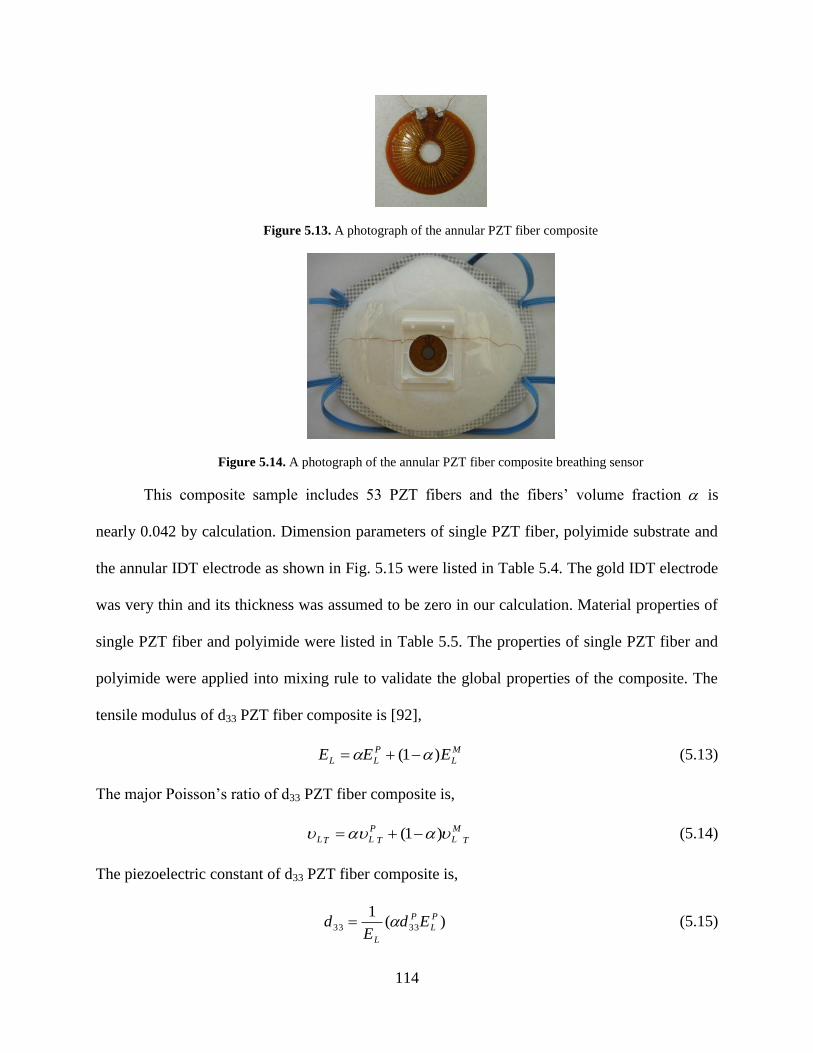
114
Figure 5.13. A photograph of the annular PZT fiber composite
Figure 5.14. A photograph of the annular PZT fiber composite breathing sensor
This composite sample includes 53 PZT fibers and the fibers’ volume fraction is
nearly 0.042 by calculation. Dimension parameters of single PZT fiber, polyimide substrate and
the annular IDT electrode as shown in Fig. 5.15 were listed in Table 5.4. The gold IDT electrode
was very thin and its thickness was assumed to be zero in our calculation. Material properties of
single PZT fiber and polyimide were listed in Table 5.5. The properties of single PZT fiber and
polyimide were applied into mixing rule to validate the global properties of the composite. The
tensile modulus of d33 PZT fiber composite is [92],
M
L
P
LL EEE )1( (5.13)
The major Poisson’s ratio of d33 PZT fiber composite is,
T
M
LT
P
LTL )1( (5.14)
The piezoelectric constant of d33 PZT fiber composite is,
)(1
3333
P
L
P
L
EdE
d (5.15)
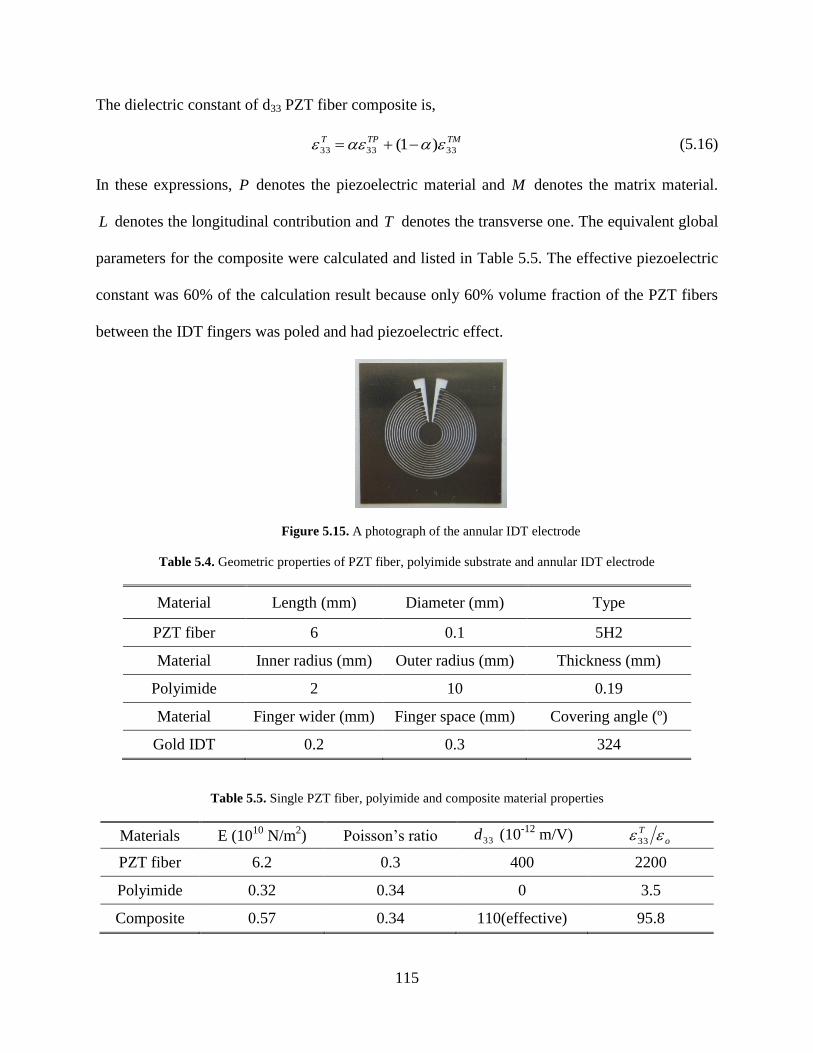
115
The dielectric constant of d33 PZT fiber composite is,
TMTPT
333333 )1( (5.16)
In these expressions, P denotes the piezoelectric material and M denotes the matrix material.
L denotes the longitudinal contribution and T denotes the transverse one. The equivalent global
parameters for the composite were calculated and listed in Table 5.5. The effective piezoelectric
constant was 60% of the calculation result because only 60% volume fraction of the PZT fibers
between the IDT fingers was poled and had piezoelectric effect.
Figure 5.15. A photograph of the annular IDT electrode
Table 5.4. Geometric properties of PZT fiber, polyimide substrate and annular IDT electrode
Material Length (mm) Diameter (mm) Type
PZT fiber 6 0.1 5H2
Material Inner radius (mm) Outer radius (mm) Thickness (mm)
Polyimide 2 10 0.19
Material Finger wider (mm) Finger space (mm) Covering angle (º)
Gold IDT 0.2 0.3 324
Table 5.5. Single PZT fiber, polyimide and composite material properties
Materials E (1010
N/m2) Poisson’s ratio 33d (10
-12 m/V)
o
T 33
PZT fiber 6.2 0.3 400 2200
Polyimide 0.32 0.34 0 3.5
Composite 0.57 0.34 110(effective) 95.8
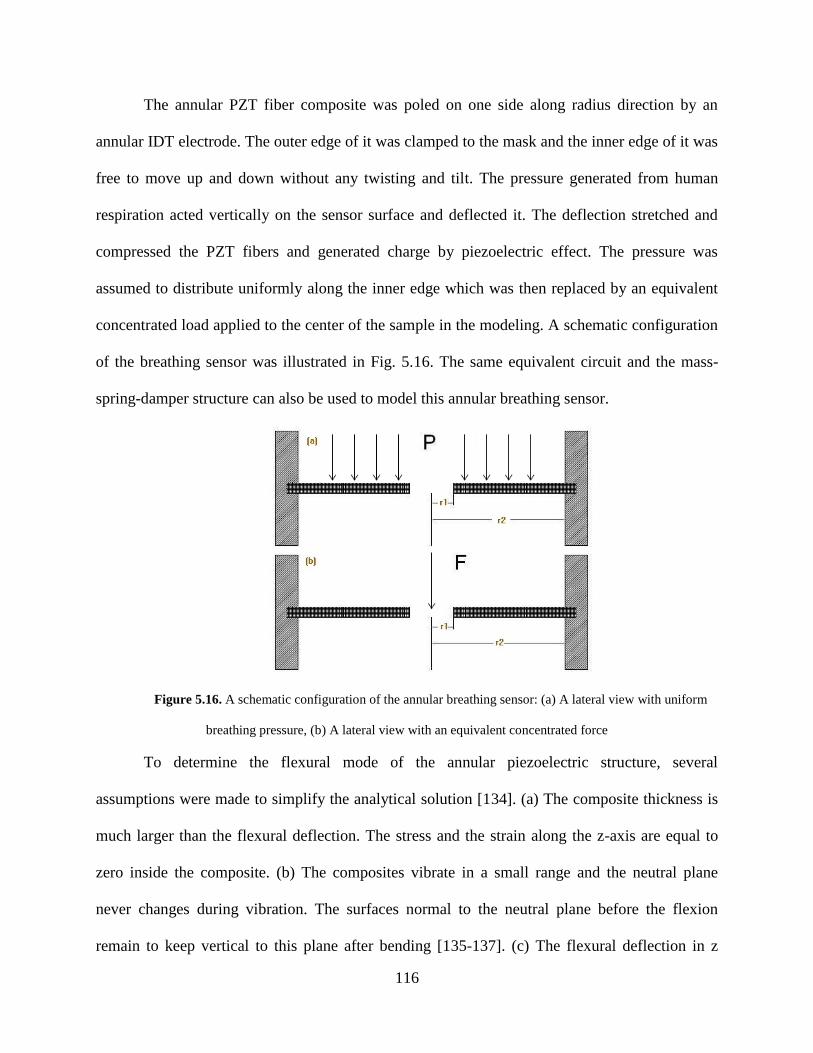
116
The annular PZT fiber composite was poled on one side along radius direction by an
annular IDT electrode. The outer edge of it was clamped to the mask and the inner edge of it was
free to move up and down without any twisting and tilt. The pressure generated from human
respiration acted vertically on the sensor surface and deflected it. The deflection stretched and
compressed the PZT fibers and generated charge by piezoelectric effect. The pressure was
assumed to distribute uniformly along the inner edge which was then replaced by an equivalent
concentrated load applied to the center of the sample in the modeling. A schematic configuration
of the breathing sensor was illustrated in Fig. 5.16. The same equivalent circuit and the mass-
spring-damper structure can also be used to model this annular breathing sensor.
Figure 5.16. A schematic configuration of the annular breathing sensor: (a) A lateral view with uniform
breathing pressure, (b) A lateral view with an equivalent concentrated force
To determine the flexural mode of the annular piezoelectric structure, several
assumptions were made to simplify the analytical solution [134]. (a) The composite thickness is
much larger than the flexural deflection. The stress and the strain along the z-axis are equal to
zero inside the composite. (b) The composites vibrate in a small range and the neutral plane
never changes during vibration. The surfaces normal to the neutral plane before the flexion
remain to keep vertical to this plane after bending [135-137]. (c) The flexural deflection in z
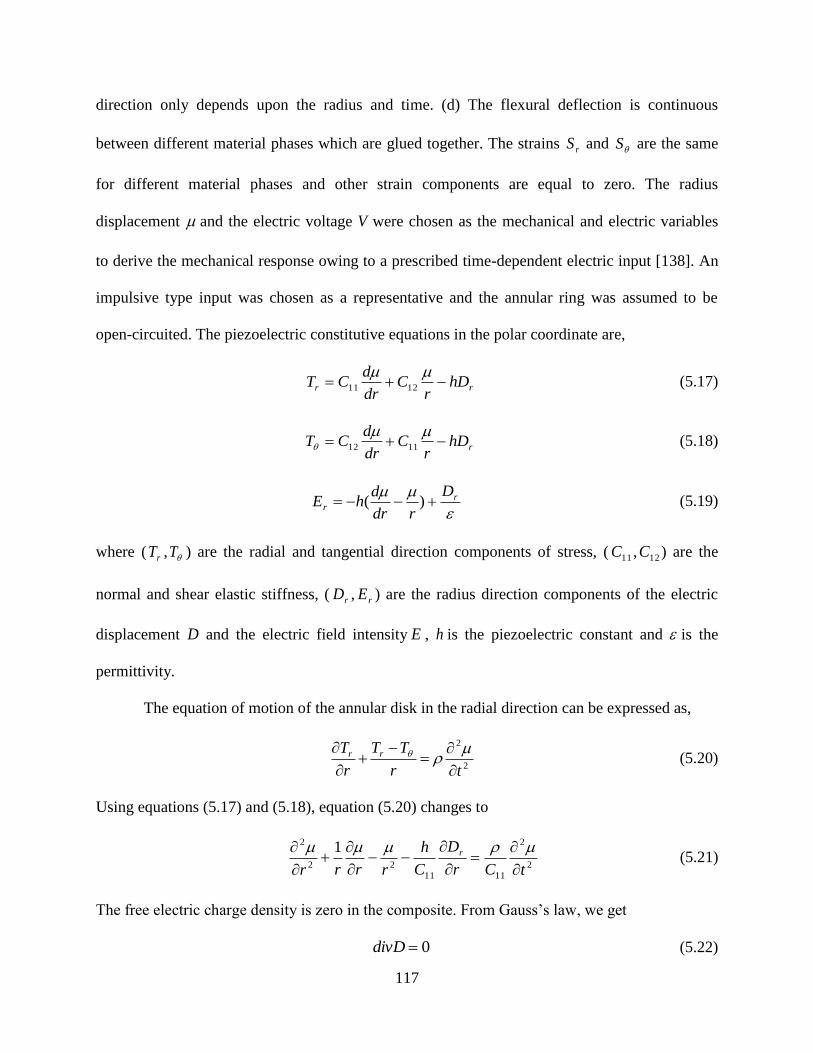
117
direction only depends upon the radius and time. (d) The flexural deflection is continuous
between different material phases which are glued together. The strains rS and S are the same
for different material phases and other strain components are equal to zero. The radius
displacement and the electric voltage V were chosen as the mechanical and electric variables
to derive the mechanical response owing to a prescribed time-dependent electric input [138]. An
impulsive type input was chosen as a representative and the annular ring was assumed to be
open-circuited. The piezoelectric constitutive equations in the polar coordinate are,
rr hDr
Cdr
dCT
1211 (5.17)
rhDr
Cdr
dCT
1112 (5.18)
rr
D
rdr
dhE )( (5.19)
where ( rT , T ) are the radial and tangential direction components of stress, ( 11C , 12C ) are the
normal and shear elastic stiffness, ( rD , rE ) are the radius direction components of the electric
displacement D and the electric field intensity E , h is the piezoelectric constant and is the
permittivity.
The equation of motion of the annular disk in the radial direction can be expressed as,
2
2
tr
TT
r
T rr
(5.20)
Using equations (5.17) and (5.18), equation (5.20) changes to
2
2
1111
22
2 1
tCr
D
C
h
rrrr
r
(5.21)
The free electric charge density is zero in the composite. From Gauss’s law, we get
0divD (5.22)
118
In polar coordinate, equation (5.22) changes to
01
D
rr
Dr (5.23)
The electric field is in radius direction and the electric displacement never varies in tangential
direction,
0
r
Dr (5.24)
Combining equations (5.21) and (5.24) together, we get
2
2
222
2 11
tvrrrr
(5.25)
2/1
11 )/( Cv (5.26)
Laplace transform is used to solve equation (5.25) to acquire the mechanical response and
input voltage relation. If is the Laplace transform (of parameter p ) of ,
dtetrpr pt
),(),(0
( p >0) (5.27)
Taking the Laplace transform of (5.25), we get
0)1
(1
22
2
2
2
rv
p
dr
d
rdr
d (5.28)
)()( 11v
prBK
v
prAI (5.29)
where 1I and 1K are first order modified Bessel functions of the first and second kind, A and B
are constants to be determined from boundary conditions. Taking the Laplace transform of (5.19),
rr
D
rdr
dhE )( (5.30)
119
For the annular ring is open-circuited, the surface charge Q is zero and rD generated from Q is
also zero. If potentials between all IDT electrode pairs are added together, the total potential V
2
1
12
2
1
])()[(
r
r
rrrr
r
r
r drr
hhdrEV
(5.31)
where 1r , 2r are the inner and outer radiuses of the ring. Submitting (5.29) into (5.31),
2
1
)/()/(
)]()()()([
11
11
21
11
21
r
r
drr
vprKB
r
vprIAh
v
prK
v
prKB
v
prI
v
prIAhV
(5.32)
The impulsive voltage introduced to the annular ring is
)(0 tVV (5.33)
where )(t is the Dirac’s delta function. For the Laplace transform of delta-function is unity,
0VV (5.34)
For the outer edge of the annular ring is rigidly fixed,
0)(2rr (5.35)
If boundary conditions (5.34) and (5.35) are substituted into equations (5.29) and (5.32),
01211 VBaAa (5.36)
0)()( 21
21
v
prBK
v
prAI (5.37)
])/(
)([2
1
11111
r
r
drr
vprIh
v
prIha (5.38)
])/(
)([2
1
11112
r
r
drr
vprKh
v
prKha (5.39)
120
A , B can be solved from equations (5.36) and (5.37),
)/()/(
)/(
21122111
210
vprIavprKa
vprKVA
(5.40)
)/()/(
)/(
21122111
210
vprIavprKa
vprIVB
(5.41)
The mechanical displacement corresponding to the impulsive voltage can be derived
by using inverse Laplace transform on equation (5.29) with A and B substituted into it. The
deflection at the inner edge 1rr can be expressed as
)/()/(
)/()/()/()/()(
21122111
1121112101 vprIavprKa
vprKvprIvprIvprKVrr
(5.42)
dpvprIavprKa
vprKvprIvprIvprKe
i
i
i
pt
rr
)]/()/([
)]/()/()/()/([
2
1)(
21122111
11211121
1 (5.43)
By several steps of calculation [138], the deflection can be expressed as
1)( rr Real part of
12
1
2
1
1121211111
)(
)]()()()()[(
n
nnnn
vti
BAh
rYrJrYrJiBAie n
(5.44)
where 1J and 1Y are first order Bessel functions of the first and second kind, nip , 1A and
1B are complicated expressions including 0J , 0Y , 1J and 1Y . By using the series expansions for
)(1 rJ n and )(1 rY n , we can derive the relation between inner edge deflection and input voltage
after Laplace transform if square and higher orders expressions of the expansions are neglected
when p is small.
)/1(2
~)/1/1(/)()//(
)//(~)( 21
0
2122121221
12210
1rr
h
V
rrrrrrrrrr
rrrr
h
Vrr
(5.45)
After taking the inverse Laplace transform, the relation changes to
htrrVrr 2/)()/1(~)( 2101 (5.46)
121
If the input signal changes to other waveforms, this deflection and voltage relation still retains
validity under small range bending or vibration.
The relation between applied force F and vertical deflection z at
1rr can be derived
from a series of expressions in references [139],
)()]1(3[
4 3
312/322
2
4
zzr
EtF
(5.47)
where t is the thickness of the ring, 1 and 3 are constants. Under small range bending,
2
2121
2
21
211
))/)(log(/()/1(
/1
rrrrrr
rr
(5.48)
0)(
)()(
)( 1313
2323
dr
rdr
dr
rdr
(5.49)
So high order expressions of z in equation (5.47) can be neglected. The relation between
vertical deflection z and radius deflection is
1)1(3 2
rrzt
(5.50)
Combining equations (5.46), (5.47), (5.50) and the annular ring area expression, the respiration
pressure and output voltage relation of the annular PZT fiber composite breathing sensor is
]))/)(log(()[(2
)1(3 2
2121
2
123
22
2 rrrrrrEt
hr
P
V
(5.51)
If the piezoelectric coefficient h is changed to 33d , equation (5.51) will change to
]))/)(log(/()/1[(2
)1(3 2
2121
2
213
4
233
2
rrrrrrt
rd
P
V
(5.52)
The sensitivity of the breathing sensor is proportional to the biquadratic of the composite
outer radius 2r and inversely proportional to the cubic of the composite thickness t . But the
breathing pressure usually focuses on a small area which sets a upper limit for 2r . The sensitivity
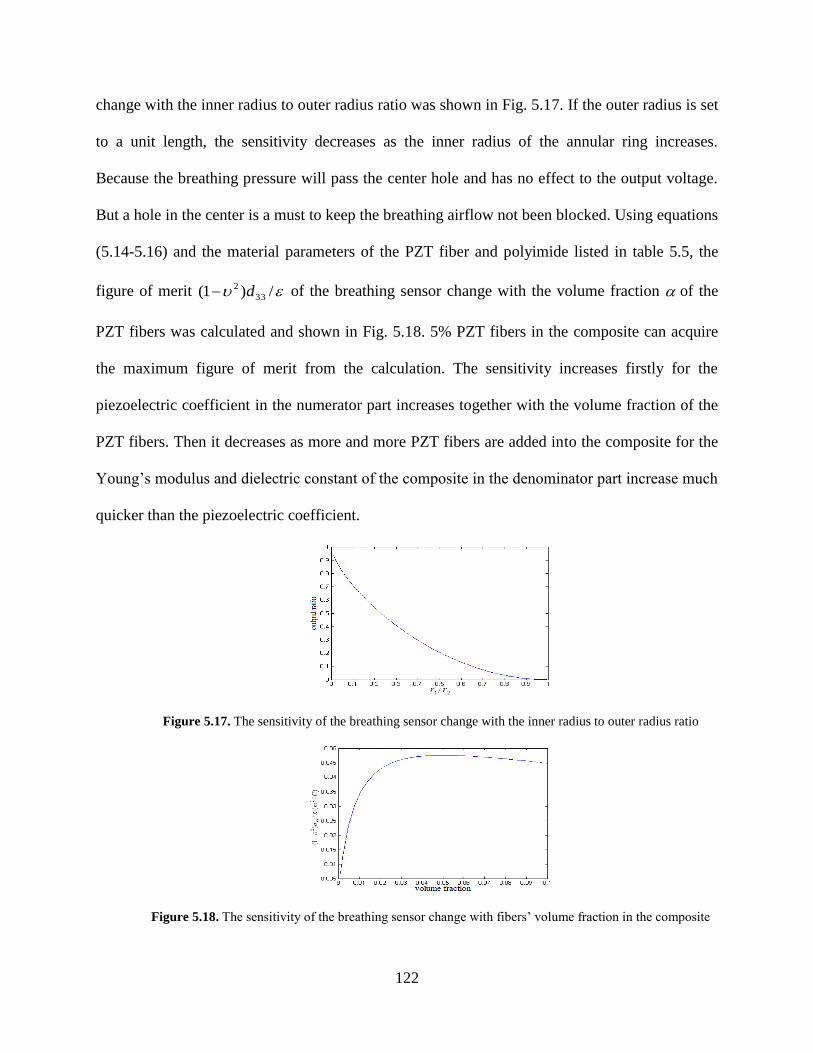
122
change with the inner radius to outer radius ratio was shown in Fig. 5.17. If the outer radius is set
to a unit length, the sensitivity decreases as the inner radius of the annular ring increases.
Because the breathing pressure will pass the center hole and has no effect to the output voltage.
But a hole in the center is a must to keep the breathing airflow not been blocked. Using equations
(5.14-5.16) and the material parameters of the PZT fiber and polyimide listed in table 5.5, the
figure of merit /)1( 33
2 d of the breathing sensor change with the volume fraction of the
PZT fibers was calculated and shown in Fig. 5.18. 5% PZT fibers in the composite can acquire
the maximum figure of merit from the calculation. The sensitivity increases firstly for the
piezoelectric coefficient in the numerator part increases together with the volume fraction of the
PZT fibers. Then it decreases as more and more PZT fibers are added into the composite for the
Young’s modulus and dielectric constant of the composite in the denominator part increase much
quicker than the piezoelectric coefficient.
Figure 5.17. The sensitivity of the breathing sensor change with the inner radius to outer radius ratio
Figure 5.18. The sensitivity of the breathing sensor change with fibers’ volume fraction in the composite
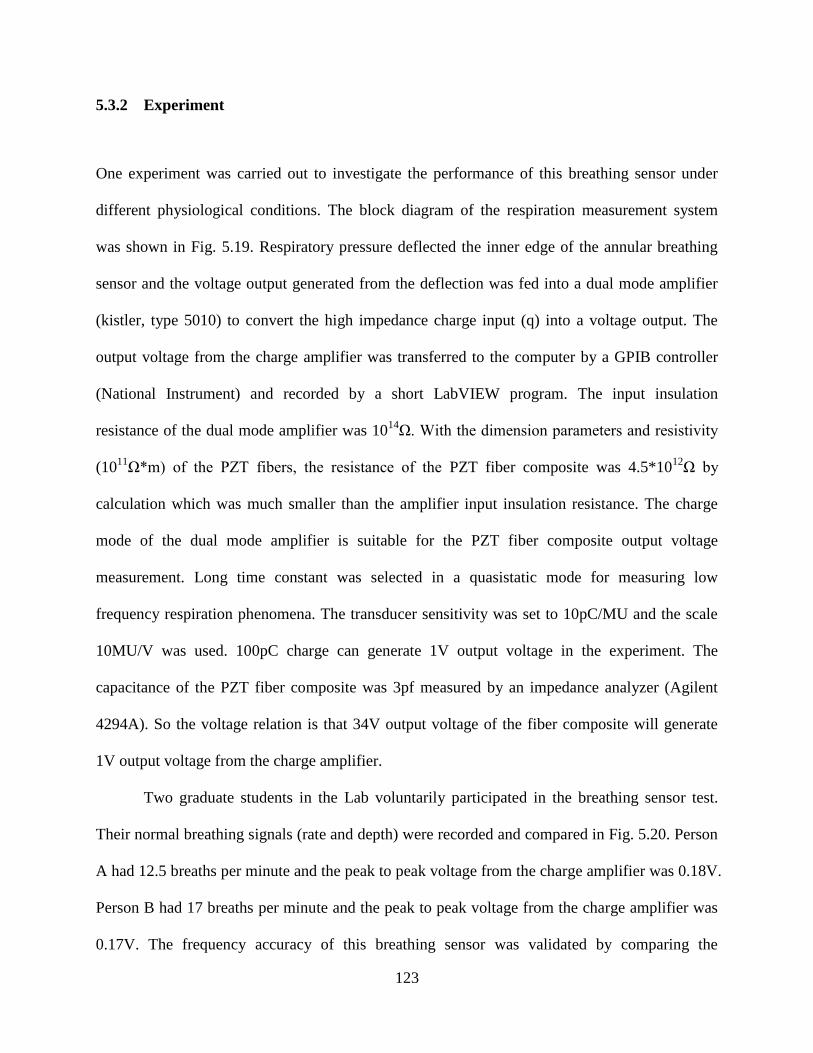
123
5.3.2 Experiment
One experiment was carried out to investigate the performance of this breathing sensor under
different physiological conditions. The block diagram of the respiration measurement system
was shown in Fig. 5.19. Respiratory pressure deflected the inner edge of the annular breathing
sensor and the voltage output generated from the deflection was fed into a dual mode amplifier
(kistler, type 5010) to convert the high impedance charge input (q) into a voltage output. The
output voltage from the charge amplifier was transferred to the computer by a GPIB controller
(National Instrument) and recorded by a short LabVIEW program. The input insulation
resistance of the dual mode amplifier was 1014
Ω. With the dimension parameters and resistivity
(1011
Ω*m) of the PZT fibers, the resistance of the PZT fiber composite was 4.5*1012
Ω by
calculation which was much smaller than the amplifier input insulation resistance. The charge
mode of the dual mode amplifier is suitable for the PZT fiber composite output voltage
measurement. Long time constant was selected in a quasistatic mode for measuring low
frequency respiration phenomena. The transducer sensitivity was set to 10pC/MU and the scale
10MU/V was used. 100pC charge can generate 1V output voltage in the experiment. The
capacitance of the PZT fiber composite was 3pf measured by an impedance analyzer (Agilent
4294A). So the voltage relation is that 34V output voltage of the fiber composite will generate
1V output voltage from the charge amplifier.
Two graduate students in the Lab voluntarily participated in the breathing sensor test.
Their normal breathing signals (rate and depth) were recorded and compared in Fig. 5.20. Person
A had 12.5 breaths per minute and the peak to peak voltage from the charge amplifier was 0.18V.
Person B had 17 breaths per minute and the peak to peak voltage from the charge amplifier was
0.17V. The frequency accuracy of this breathing sensor was validated by comparing the
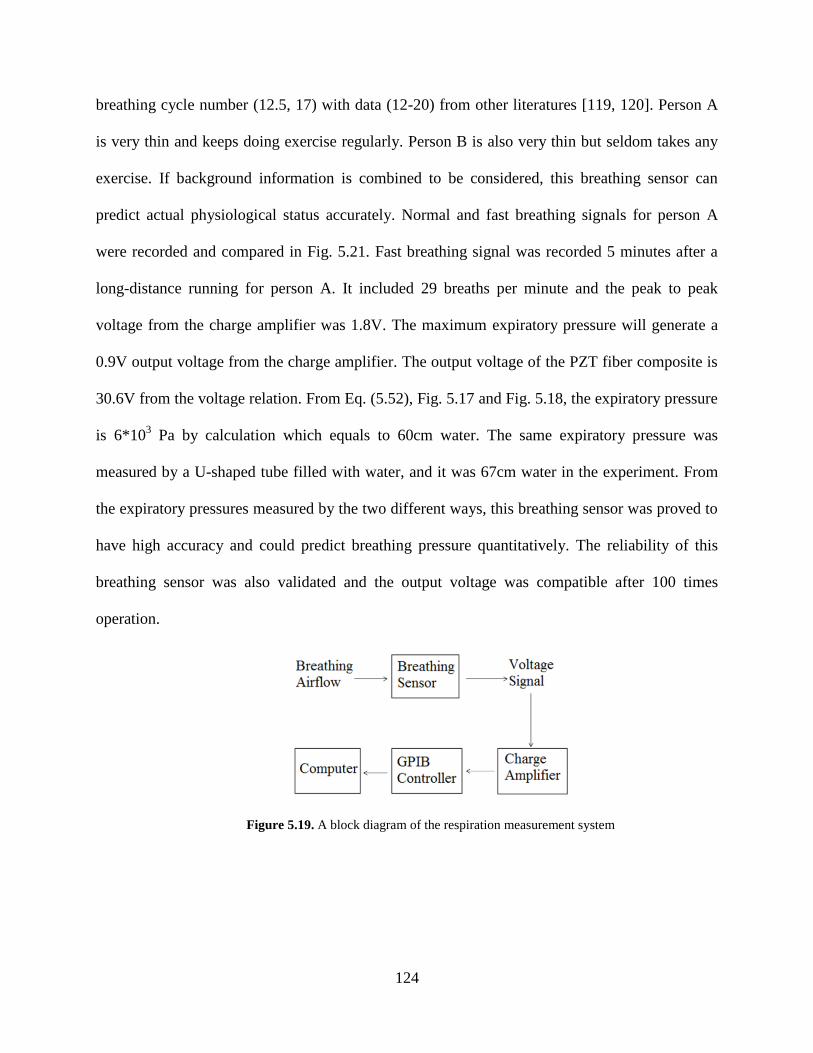
124
breathing cycle number (12.5, 17) with data (12-20) from other literatures [119, 120]. Person A
is very thin and keeps doing exercise regularly. Person B is also very thin but seldom takes any
exercise. If background information is combined to be considered, this breathing sensor can
predict actual physiological status accurately. Normal and fast breathing signals for person A
were recorded and compared in Fig. 5.21. Fast breathing signal was recorded 5 minutes after a
long-distance running for person A. It included 29 breaths per minute and the peak to peak
voltage from the charge amplifier was 1.8V. The maximum expiratory pressure will generate a
0.9V output voltage from the charge amplifier. The output voltage of the PZT fiber composite is
30.6V from the voltage relation. From Eq. (5.52), Fig. 5.17 and Fig. 5.18, the expiratory pressure
is 6*103 Pa by calculation which equals to 60cm water. The same expiratory pressure was
measured by a U-shaped tube filled with water, and it was 67cm water in the experiment. From
the expiratory pressures measured by the two different ways, this breathing sensor was proved to
have high accuracy and could predict breathing pressure quantitatively. The reliability of this
breathing sensor was also validated and the output voltage was compatible after 100 times
operation.
Figure 5.19. A block diagram of the respiration measurement system
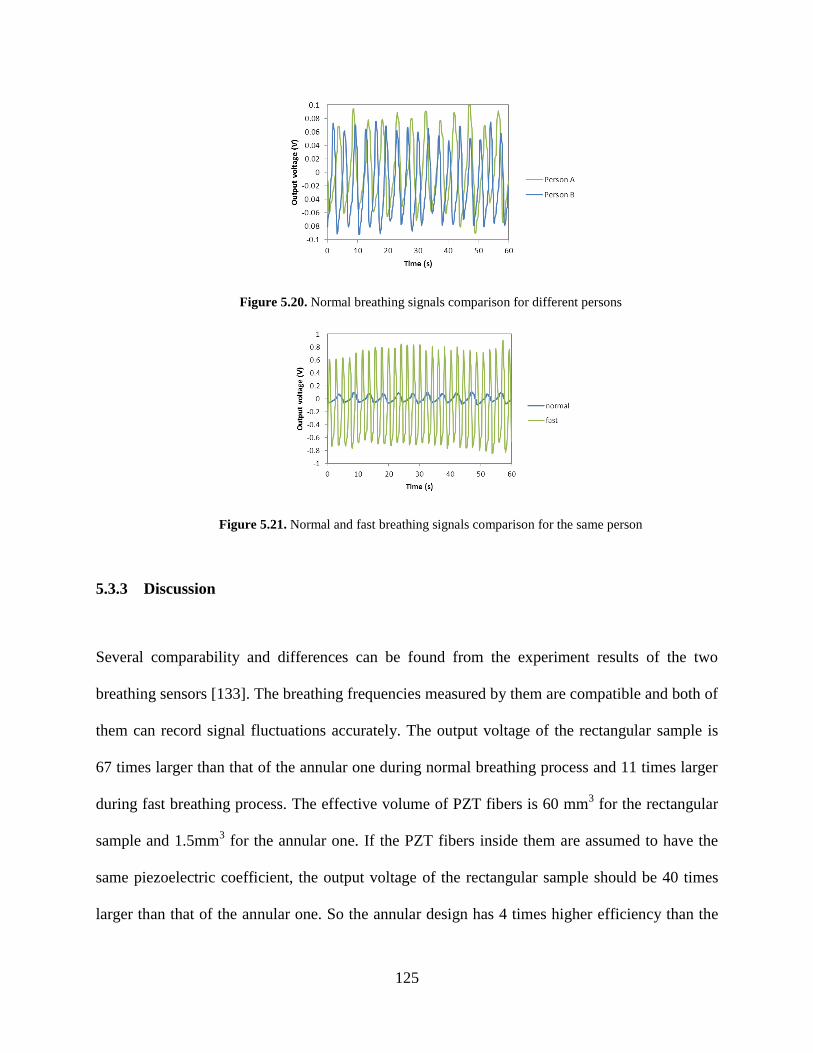
125
Figure 5.20. Normal breathing signals comparison for different persons
Figure 5.21. Normal and fast breathing signals comparison for the same person
5.3.3 Discussion
Several comparability and differences can be found from the experiment results of the two
breathing sensors [133]. The breathing frequencies measured by them are compatible and both of
them can record signal fluctuations accurately. The output voltage of the rectangular sample is
67 times larger than that of the annular one during normal breathing process and 11 times larger
during fast breathing process. The effective volume of PZT fibers is 60 mm3 for the rectangular
sample and 1.5mm3 for the annular one. If the PZT fibers inside them are assumed to have the
same piezoelectric coefficient, the output voltage of the rectangular sample should be 40 times
larger than that of the annular one. So the annular design has 4 times higher efficiency than the
126
rectangular one. This high efficiency accounts for suitable substrate material in the sample. The
rectangular fiber composite is a standard commercial product and its neutral plane locates on the
center plane of the PZT fibers. The output voltage generated from stretching effect at one side of
the neutral plane during bending counteracts that from compression effect at the other side. A
steel substrate was glued onto the fiber composite to change the neutral plane position. The
annular sample was fabricated manually with PZT fibers and a polyimide thin film glued
together. The film with suitable thickness was chosen to make the neutral plane locate at the
polyimide part. Because the fibers in the rectangular sample are much thicker than those in the
annular one, polyimide thin films with a small stiffness coefficient are not suitable for changing
the neutral plane position of the rectangular sample which will make the sample too thicker to
have practical use. The steel substrate with a large stiffness coefficient made the sample vibrate
in a small range and generated little charge which caused the low efficiency of the rectangular
breathing sensor.
The signal amplitude differences from the two breathing sensors are 67 times during
normal breathing condition and 11 times during fast breathing condition. This multiple
difference was caused by the configuration differences between them. The rectangular MFCs
were fixed to the mask with one end clamped and the other end free. So mouth airflow and nose
airflow nearly had the same effect to the final output voltage in any condition and only nose
airflow was considered in measurement. The annular PZT fiber composite located at the center
of the mask with outer edge clamped and inner edge free. Mouth respiration had much stronger
effect than nose respiration during fast breathing which accounted for the 6 times output
difference from the two breathing sensors between fast and normal breathing. The wire
connection of the annular fiber composite which will introduce noise into the output signal is an
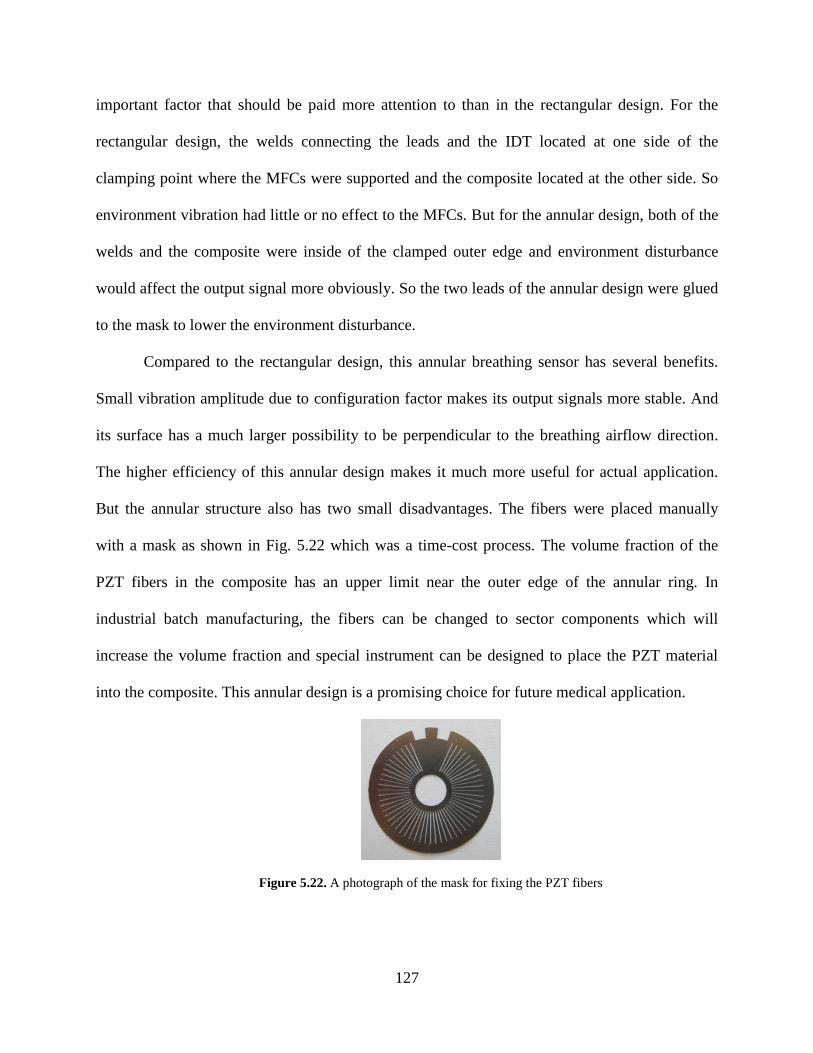
127
important factor that should be paid more attention to than in the rectangular design. For the
rectangular design, the welds connecting the leads and the IDT located at one side of the
clamping point where the MFCs were supported and the composite located at the other side. So
environment vibration had little or no effect to the MFCs. But for the annular design, both of the
welds and the composite were inside of the clamped outer edge and environment disturbance
would affect the output signal more obviously. So the two leads of the annular design were glued
to the mask to lower the environment disturbance.
Compared to the rectangular design, this annular breathing sensor has several benefits.
Small vibration amplitude due to configuration factor makes its output signals more stable. And
its surface has a much larger possibility to be perpendicular to the breathing airflow direction.
The higher efficiency of this annular design makes it much more useful for actual application.
But the annular structure also has two small disadvantages. The fibers were placed manually
with a mask as shown in Fig. 5.22 which was a time-cost process. The volume fraction of the
PZT fibers in the composite has an upper limit near the outer edge of the annular ring. In
industrial batch manufacturing, the fibers can be changed to sector components which will
increase the volume fraction and special instrument can be designed to place the PZT material
into the composite. This annular design is a promising choice for future medical application.
Figure 5.22. A photograph of the mask for fixing the PZT fibers
128
5.4 CONCLUSION
Breathing is an important physiological phenomenon and several methods and instruments can
be utilized to detect and monitor breathing signal. Piezoelectric sensor is one of the alternatives
for biomedical applications and the PZT fiber composite is chosen as the sensing component in
this study. Large electromechanical coupling coefficient of single PZT fiber and high flexibility
of polyimide make the PZT fiber composite become a suitable choice for physiological activities
monitoring. A breathing sensor was fabricated with a piece of MFCs unimorph glued onto an
ordinary mask. The MFCs global properties were calculated by substituting the properties of
single PZT fiber and epoxy into mixing rule and validated with the data from technical manual.
The MFCs are suitable for exploring low frequency breathing signal for its small lower
frequency limit and large time constant. Constitutive relations for piezoelectric unimorph and
one dimension dynamic model for piezoelectric device were used to derive the relation between
output voltage of the sensor and breathing airflow pressure. Three experiments were carried out
to compare breathing signals under different physiological conditions. Several fabrication,
packaging, and instrument details were considered to improve the accuracy and sensitivity and to
lower error and noise of this breathing sensor. The annular PZT fiber composite was fabricated
with PZT fibers glued onto polyimide thin film and the composite was glued onto a mask to
fabricate the breathing sensor. Properties of single PZT fiber and polyimide were characterized
to calculate the global properties of the composite by mixing rule. Then the composite was
assumed to be a piece of homogeneous annular piezoelectric plate and polar coordinate
piezoelectric constitutive equations were utilized to derive the inner edge deflection and output
voltage relation of this breathing sensor. The relation between the equivalent concentrated force
for the breathing pressure and the inner radius deflection was derived with plate deflection

129
expressions to acquire the final breathing pressure-output voltage relation. Experiments were
carried out to compare breathing signals under different physiological conditions. This annular
structure was also compared with rectangular configuration for performance improvement and
industrial batch manufacturing feasibility analysis. These two breathing sensors can be utilized
for breathing rate and depth monitoring and breathing diseases precaution and they are nice
choices for daily use and diagnostic purpose.
130
6.0 CONCLUSIONS AND FUTURE WORK
6.1 MAJOR ACCOMPLISHMENTS
The research work in this dissertation is focused on experimental investigation and modeling of
piezoelectric and piezoresisitive composite sensor. The following is a summary of the major
accomplishments.
(1) A novel ZnO nanowires-polymer nanocomposite was fabricated and characterized and its
piezoresistive property was utilized to work as a strain sensor
Single crystal zinc-oxide nanowires were synthesized through a simple hydrothermal
route and subsequently mixed with polyimide matrix to form ZnO nanocomposites film.
Superimposed a.c. and d.c. electric fields were applied to microscopically tailor the
alignment of ZnO nanowires in polyimide matrix by using IDT to form anisotropic
nanocomposites. Polarization-electric field loops of the nanocomposites were measured
before and after curing the samples; and the results indicate that net electric polarization
in the nanocomposites can be induced by this field-assisted alignment technique due to
the intrinsic polar property of ZnO nanowires. The conductivity, dielectric constant and
electrical I-V curve of ZnO nanocomposites change with weight ratio of ZnO nanowires
were characterized.
131
A novel ZnO nanowires-polyimide nanocomposite strain sensor was proposed based on
the piezoresistive effect of ZnO nanowires. Static piezoresistive effect of the
nanocomposite was investigated and large gauge factor was acquired for this
nanocomposite. This strain sensor was then utilized to measure the static and dynamic
strain in a cantilever beam and the results were verified with calculation and
measurement result from laser.
(2) Development of PZT fiber composite low frequency vibration sensor and strain sensor
A low frequency vibration sensor was fabricated and experimentally studied. The
constitutive relation for the 1-3 PZT fiber composite on IDT electrodes was derived and
a new physical model for the material parameters was presented and validated with
mixing rule. The properties of single PZT fiber were characterized and applied into this
model to calculate the global properties of PZT fiber composite. The global parameters
of the composite were substituted into lumped and distributed parameters’ constituent
equations for piezoelectric unimorph to theoretically predict the sensitivity and effective
frequency response range of the vibration sensor. The output voltage of the vibration
sensor is proportional to input acceleration and the voltage per unit input displacement
keeps stable in a wide frequency range with a suitable damping ratio. The PZT fiber
composite works on well as a self-standing wireless low frequency vibration sensor and
this vibration sensor can reflect vibration amplitude accurately.
A strain sensor was also proposed with this fiber composite unimorph to characterize
electric field induced strain response in the out-of-plane direction of soft polymer
material sample. It is also suitable for surface morphology and soft material elastic
modulus characterization. By changing the substrate material and its relative thickness

132
ratio to the fiber composite, the design of the strain sensor could be optimized for
sensitivity or softness improvement. Compared to the original bimorph design, this new
design can keep high sensitivity and high flexibility features simultaneously. This newly
developed strain sensor worked well over a suitable frequency range. The experiment
result was also validated with the calculation and the result from a laser displacement
meter. The consistency among three of them indicates that this strain sensor is suitable
for strain, elastic modulus and surface morphology measurement with high sensitivity
and reliability, especially for soft material with low elastic modulus.
(3) Theoretical modeling and experimental investigation of two PZT fiber composite breathing
sensors with different configurations
A rectangular breathing sensor and an annular one were fabricated for monitoring
breathing rate and depth. Properties of single PZT fiber and polyimide were
characterized and global properties for both of the fiber composites were calculated by
mixing rule. They are suitable for exploring low frequency breathing signal for their
small lower frequency limit and large time constant. Output voltage of the rectangular
breathing sensor at a specific frequency was derived with piezoelectric constituent
equations and could be utilized to direct sensor design. Polar coordinate piezoelectric
constitutive equations and plate deflection expressions were utilized to derive the
breathing pressure and output voltage relation of the annular one.
Both of these two sensors were tested under different physiological conditions. Several
fabrication, packaging, and instrument details were considered to improve the accuracy
and sensitivity and to lower error and noise of the breathing sensors. The annular design
has also been compared with the rectangular one for performance improvement and
133
industrial batch manufacturing feasibility analysis. Both of them are excellent for
monitoring breathing rate and depth and nice choices for daily use and diagnose purpose.
6.2 FUTURE WORK
Heartbeat monitoring is important in daily life of human. Sleep heartbeat monitoring [140] and
fetal heartbeat monitoring [141] are two important parts which have attracted increasing interest
in the past years. Sleep apnea syndrome (SAS) is one of the common sleep disorders and it is of
clinical importance to be able to diagnose SAS in early stage. Overnight polysomnography is
widely recognized as the gold-standard for sleep research, which simultaneously measures
airflow, body movement, electroencephalogram (EEG), electroolfactogram (EOG),
electrocardiogram (ECG), and so on [142]. However, the measurement requires attachment of
many sensors such as thermistors and electrodes, to patients’ body which may cause patients
discomfort. Several methods have been developed to assess physiological information during
sleep in non-invasive and unconstrained manners. Visual information measured with cameras
was used to achieve in-sleep respiration monitoring [143, 144]. Although these methods need no
contact with patients, there are limitations that the measurement systems are costly and not
appropriate for public healthcare and at-home medical applications.
Alternative attempts have been made to measure pressure fluctuation induced by
heartbeat and respiration during sleep, using air mattresses [145, 146], an under-pillow sensor
[147], and pressure sensors [148, 149]. In the pneumatic biomeasurement method [145], human
movements act on the air in a mattress, and a supersensitive pressure sensor is used to detect the
corresponding air pressure changes. Thin film pressure sensors made of piezoresistive polymer
134
are attached to the surface of bed, and respiration and posture signals are obtained from the
pressure distribution [148]. After the pressure fluctuation due to respiration and heartbeat has
been measured, there is another problem that how to extract these components correctly. To this
end, traditional methods are usually based on filtering with predefined frequency bands [145,
146]. On the other hand, wavelet transformation (WT) is an alternative approach [147, 149]. All
the methods mentioned have their own advantage and disadvantage.
Fetal heart rate (FHR) measurement is one of the most important approaches used for
monitoring the cardiac status of fetal human beings. In order to intensify antenatal surveillance,
the routine FHR test should be performed with a long-term monitoring device that is portable
and easy to use at home. A standard test of fetal health is the fetal nonstress test (NST),
performed routinely in hospitals by means of CW Doppler ultrasound. The instrumentation
provides a time record of the fetal heart rate, as well as indications of fetal movement, on a strip
chart recorder. A normal NST requires three separate FHR accelerations of at least 15 beats per
min over its baseline. Each acceleration event is to be stimulated by an associated fetal
movement. These three movement/acceleration events are to occur during any 20-min
observation window. The availability of a portable instrument would allow the expectant mother
to perform the NST in the home comfortably on a daily basis instead of during less frequent and
less convenient clinical visits. Furthermore, such testing at home would be more thorough from
an obstetrical surveillance point of view. Unfortunately, ultrasonic instrumentation lends itself
poorly to portable home use for two reasons: it is expensive and bulky, and it requires accurate
sensor alignment which may lie beyond the capability of nonexpert hands.
In addition, a passive acoustic approach, like the one based on the analysis of the fetal
heart sounds, where no energy is transmitted to the fetus, should be preferred to invasive
135
methods as the ultrasound cardiotocography. The acoustical method can be realized using low-
power electronic instrumentation [150] and no acoustic energy is transmitted to the body. Some
efforts were made and most of them were aimed at the development of sensitive acoustic sensors
to improve the signal-to-noise ratio of the fetal heart sound signal. Examples are the inductive-
type sensor [151], the cantilever type accelerometer [152], the optical scanning technique [153],
and the set of piezoelectric elements [154]. These instruments stimulate the interest of
developing a portable instrument based on using piezoelectric material with high piezoelectric
coefficient to detect the fetal heart sounds for the long-term monitoring of the fetus.
In this study, we propose a novel heart rate sensor for noninvasive and unconstrained
measurement of heartbeat. A flexible PZT composite thin film sensor is used for signal
acquisition. Piezoelectric film sensors are utilized in unconstrained cardio-respiratory monitoring,
for reasons that these sensors are sensitive and only respond to dynamic change of pressure. Also,
thin thickness of these sensors enables that they can be easily attached to bodies, used in daily
life, and may not affect the activities. A polyvinylidene fluoride (PVDF) piezopolymer sensor
has been developed for unconstrained in sleep cardio-respiratory monitoring [149]. However,
one major disadvantage of PVDF material is the difficulty in soldering PVDF to make electric
connection. Usually, conductive epoxy or spring clips are used which may then lead to problems
of stability and fatigue durability. The piezoelectric sensor used in this study is made of PZT thin
film. The PZT thin film is spin-coated with liquid silicon rubber for biomedical compatibility
and flexibility improvement. This sensor shows excellent thermal and chemical stability, and this
property facilitates a variety of practical applications.
136
BIBLIOGRAPHY
1. W.G. Cady, Piezoelectricity, New York: Dover Publications, 1964.
2. D. A. Berlincourt, D. R. Curran and H. Jaffe, “Piezoelectric and piezomagnetic materials
and their function in transducers,” Physical Acoustics, Vol. 1, Part A, ed. by W. P.
Mason, New York: Academic Press, 1964.
3. C. Sherman, J. L. Butler, Transducers and Arrays for Underwater Sound, New York:
Springer, 2007.
4. E. J. Parssinen (verbal communication), The possibility of depoling under pressure
cycling was the reason for choosing the 31 mode over the 33 mode in the first use of PZT
for submarine transducers
5. E. J. Parssinen, S. Baron and J. F. White, Double mass loaded high power piezoelectric
underwater transducer, Patent 4,219,889, August 26, 1980.
6. R. Newnham, L. Bowen, K. Klicker, and L. Cross, “Composite piezoelectric
transducers,” Materials in Engineering, vol. 2, pp. 93-106, 1980.
7. L. J. Bowen, Method for making piezoelectric ceramic/polymer composite transducers,
Patent 5,340,510, August 23, 1984.
8. L. J. Bowen, et al., “Design, fabrication and properties of SonoPanel 1-3 piezocomposite
transducers,” Ferroelectrics, vol. 187, pp. 109-120, 1996.
9. W. A. Smith and B. A. Auld, “Modeling 1-3 composite piezoelectrics: thickness-mode
oscillations,” IEEE Trans. Ultrason. Ferroelectric. Freq. Cont., vol. 38, pp. 40-47, 1991.
10. M. Avellaneda and P. J. Swart, “Calculating the performance of 1-3 piezoelectric
composites for hydrophone applications: An effective medium approach,” J. Acoust. Soc.
Am., vol. 103, pp. 1449-1467, 1998.
11. W. A. Smith, “Modeling 1-3 composite piezoelectrics: Hydrostatic response,” IEEE
Trans. Ultrasoncis. Ferroelec. Freq. Cont., vol. 40, pp. 41-49, 1993.
137
12. G. Hayward, J. Bennett, and R. Hamilton, “A theoretical study on the influence of some
constituent material properties on the behavior of 1-3 connectivity composite
transducers,” J. Acoust. Soc. Am., vol. 98, pp. 2187-2196, 1995.
13. Private communication with Brian Pazol, MSI, Littleton, MA, 01460.
14. R. Newnham, et al., “Connectivity and piezoelectric-pyroelectric composites,” Mat. Res.
Bull., vol. 13, pp. 525-536, 1978.
15. H. P. Savakus, et al., “PZT-epoxy piezoelectric transducers: A simplified fabrication
procedure,” Mat. Res. Bull., vol. 16, pp. 677-680, 1981.
16. L. J. Bowen, and K. W. French, “Fabrication of piezoelectric ceramic/polymer
composites by injection molding,” Proc. 8th IEEE Int. Symp. Appl. Ferroelectrics, vol.
92, pp. 160-163, 1992.
17. K. Lubitz, et al., “New piezoelectric composites for ultrasonic transducers,”
Ferroelectrics, vol. 92, pp. 21-26, 1992.
18. V. F. Janas, and A. Safari, “Overview of fine-scale piezoelectric ceramic/polymer
processing,” J. Am. Ceram. Soc., vol. 95, pp. 2945-2955, 1995.
19. S. Gebhardt, “Herstellung und charakterisierung von feinskaligen 1–3 piezo-kompositen
f¨ur ultraschallwandler,” Bergakademie TU Thesis, Freiberg, 2000.
20. A. Safari, et al., “Development of fine-scale piezoelectric composites for transducers,”
AIChE J., vol. 97, pp. 2849-2856, 1997.
21. N. W. Hagood, and A. A. Bent, “Development of piezoelectric fiber composites for
structural actuation,” Proc. 43th AIAA/ASME, vol. 93, pp. 1717, 1993.
22. W. Glaubitt, et al., “Sol-gel processing of PZT long fibers,” Adv. Sci. Technol., vol. 10,
pp. 47-54, 1995.
23. V. K. Seth, and W. A. Schulze, “Fabrication and characterization of ferroelectric PLZT
7/65/35 ceramic thin films and fibers,” Ferroelectrics, vol. 112, pp. 283-307, 1990.
24. J. M. Boulton, “Sol-gel derived PZT fibers,” Mat. Res. Soc. Symp. Proc., vol. 271, pp.
517-522, 1992.
25. W. Glaubitt, et al., “Formkorper auf der basis von PZT, bleizirkonat-titanat, verfahren
und zwischenprodukt zu deren herstellung,” Patent application DE 4332831 C1, 1994.
26. I. Shimono, et al., “Preparation of Pb(Zr,Ti)O3 fibers by the alginate method,” J. Ceram.
Soc. Jpn. (Int. Ed.), vol. 101, pp. 700-703, 1993.
27. R. Meyer, et al., “Lead zirconate titanate fine fibers derived from alkoxide-based sol-gel
technology,” J. Am. Ceram. Soc., vol. 81, no. 4, pp. 861-868, 1998.
138
28. A. Safari, E. K. Akdogan, Piezoelectric and Acoustics Materials for Transducer
Applications, New York: Springer, 2008.
29. K. A. Klicker, et al., “Composites of PZT and epoxy for hydrostatic transducer
applications,” J. Am. Ceram. Soc., vol. 64, pp. 5-9, 1981.
30. R. B. Cass, “Fabrication of continuous ceramic fiber by the viscous suspension spinning
process,” Am. Ceram. Bull., vol. 70, pp. 424-429, 1991.
31. J. D. French, et al., “Production of continuous piezoelectric ceramic fibers for smart
materials and active control devices,” Proc. SPIE-Int. Soc. Opt. Eng., Vol. 3044, pp. 406-
412, 1997.
32. T. Rodig, et al., “Design and characterization of 1-3 ultrasonic composites using ATILA
and ultrafast laser measurements (20 MHz),” Proc. IEEE Ultrason. Symp., vol. 1, pp.
353-356, 2005.
33. C. S. Smith, “Piezoresistance effect in germanium and silicon,” Physics Review, vol. 94,
pp. 42-49, 1954.
34. Y. Kanda, “Piezoresistance effect of silicon,” Sensors and Actuators A: Physical, vol. 28,
pp. 83-91, 1991.
35. T. Toriyama, and S. Sugiyama, “Analysis of piezoresistance in p-type silicon for
mechanical sensors,” Journal of Microelectromechanical Systems, vol. 11, pp. 598-604,
2002.
36. K. Yamada, et al., “Nonlinearity of the piezoresistance effect of p-type silicon diffused
layers,” IEEE Transactions on Electron Devices, vol. ED-29, pp. 71-77, 1982.
37. O. N. Tufte, and E. L. Stelzer, “Piezoresistive properties of silicon diffused layers,”
Journal of Applied Physics, vol. 34, pp. 313-318, 1963.
38. D. R. Kerr, and A. G. Milnes, “Piezoresistance of diffused layers in cubic
semiconductors,” Journal of Applied Physics, vol. 34, pp. 727-731, 1963.
39. P. F. French, and A. G. R. Evans, “Piezoresistance in polysilicon and its applications to
strain gauges,” Solid-State Electronics, vol. 32, pp. 1-10, 1989.
40. N. Svedin, et al., “A new silicon gas-flow sensor based on lift force,” Journal of
Microelectromechanical Systems, vol. 7, pp. 303-308, 1998.
41. N. Svedin, E. Kalvesten, and G. Stemme, “A new edge-detected lift force flow sensor,”
Journal of Microelectromechanical Systems, vol. 12, pp. 344-354, 2003.
42. M. A. Schmidt, “Wafer-to-wafer bonding for microstructure formation,” IEEE Proc., vol.
86, pp. 1575-1585, 1998.
139
43. Z. Fan, et al., “Design and fabrication of artificial lateral-line flow sensors,” Journal of
Micromechanics and Microengineering, vol. 12, pp. 655-661, 2002.
44. N. Svedin, E. Stemme, and G. Stemme, “A static turbine flow meter with a
micromachined silicon torque sensor,” Journal of Microelectromechanical Systems, vol.
12, pp. 937-946, 2003.
45. H. B. Cheng, J. P. Cheng, Y. J. Zhang, Q. M. Wang, “Large-scale fabrication of ZnO
micro and nano structures by microwave thermal evaporation deposition,” J. Cryst.
Growth, vol. 299, pp. 34-40, 2007.
46. L. Vayssieres, K. Keis, A. Hagfeldt, S. E. Lindquist, “Three-dimensional array of highly
oriented crystalline ZnO microtubes,” Chem. Mater., vol. 13, pp. 4395-4398, 2001.
47. M. Huang, S. Mao, H. Feick, H. Yan, Y. Wu, H. Kind, E. Weber, R. Russo, and P. Yang,
“Room-temperature ultraviolet nanowire nanolasers,” Science, vol. 292, pp. 1897-1899,
2001.
48. Q. Wan, Q. H. Li, Y. J. Chen, T. H. Wang, X. L. He, J. P. Li, and C. L. Lin, “Fabrication
and ethanol sensing characteristics of ZnO nanowire gas sensors,” Appl. Phys. Lett., vol.
84, pp. 3654-3656, 2004.
49. K. Hara, T. Horiguchi, T. Kinoshita, K. Sayama, H. Sugihara, and H. Arakawa, “Highly
efficient photon-to-electron conversion with mercurochrome-sensitized nanoporous oxide
semiconductor solar cells,” Sol. Energy Mater. Sol. Cells., vol. 64, pp. 115-134, 2000.
50. Y. B. Li, Y. Bando, D. Golberg, “ZnO nanoneedles with tip surface perturbations:
Excellent field emitters,” Appl. Phys. Lett., vol. 84, pp. 3603-3605, 2004.
51. C. P. Bowen, R. E. Newnham, and C. A. Randall, “Dielectric properties of
dielectrophoretically assembled particulate-polymer composites,” J. Mater. Res., vol. 13,
pp. 205-210, 1998.
52. P. M. Ajayan, L. S. Schadler, C. Giannaris, A. Rubio, “Single-walled carbon nanotube-
polymer composites: Strength and weakness,” Adv. Mater., vol. 12, pp. 750-753, 2000.
53. Q. M. Zhang, H. Li, M. Poh, H. Xu, Z.-Y. Cheng, F. Xia, C. Huang, “Forward scattering
due to slow-down of the intermediate in the H+HD D+H2 reaction,” Nature, vol. 419,
pp. 281-284, 2002.
54. Z. M. Dang, Y. H. Lin, C. W. Nan, “Novel ferroelectric polymer composites with high
dielectric constants,” Adv. Mater., vol. 15, pp. 1625-1629, 2003.
55. Y. Bai, Z. Y. Cheng, V. Bharti, H. S. Xu, and Q. M. Zhang, “High-dielectric-constant
ceramic-powder polymer composites,” Appl. Phys. Lett., vol. 76, pp. 3804-3806, 2000.
56. C. Huang, Q. M. Zhang, J. Su, “High-dielectric-constant all-polymer percolative
composites,” Appl. Phys. Lett., vol. 82, pp. 3502-3505, 2003.
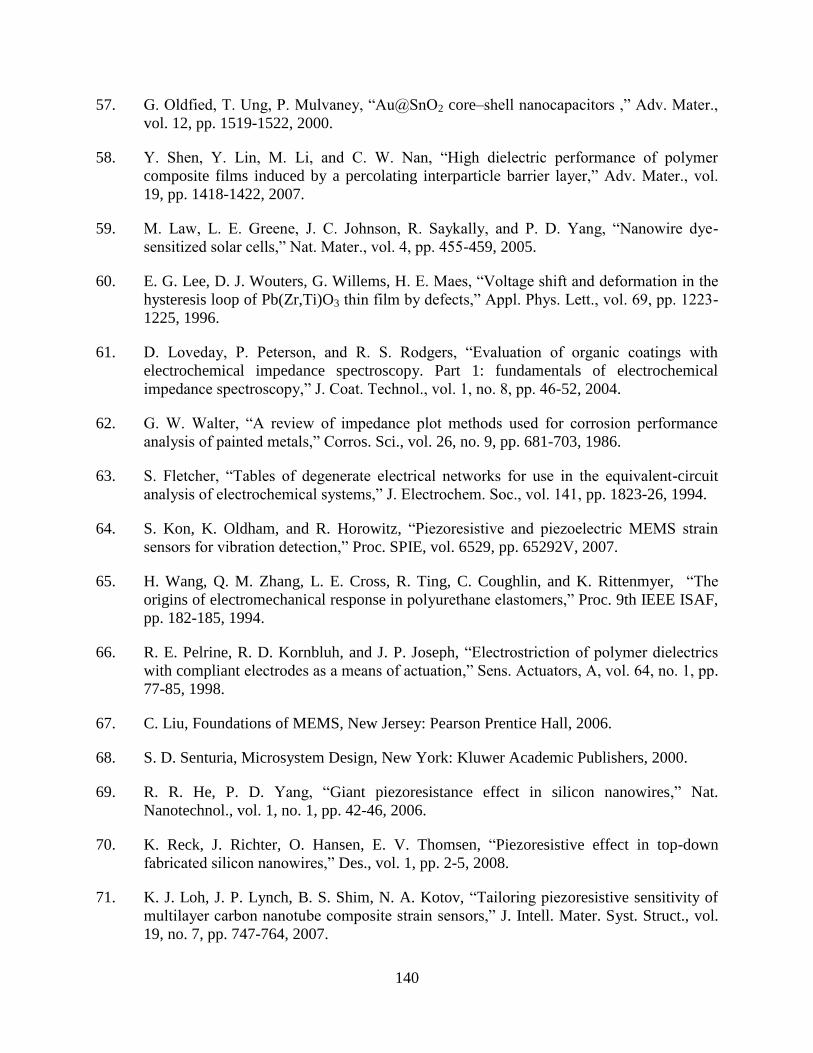
140
57. G. Oldfied, T. Ung, P. Mulvaney, “Au@SnO2 core–shell nanocapacitors ,” Adv. Mater.,
vol. 12, pp. 1519-1522, 2000.
58. Y. Shen, Y. Lin, M. Li, and C. W. Nan, “High dielectric performance of polymer
composite films induced by a percolating interparticle barrier layer,” Adv. Mater., vol.
19, pp. 1418-1422, 2007.
59. M. Law, L. E. Greene, J. C. Johnson, R. Saykally, and P. D. Yang, “Nanowire dye-
sensitized solar cells,” Nat. Mater., vol. 4, pp. 455-459, 2005.
60. E. G. Lee, D. J. Wouters, G. Willems, H. E. Maes, “Voltage shift and deformation in the
hysteresis loop of Pb(Zr,Ti)O3 thin film by defects,” Appl. Phys. Lett., vol. 69, pp. 1223-
1225, 1996.
61. D. Loveday, P. Peterson, and R. S. Rodgers, “Evaluation of organic coatings with
electrochemical impedance spectroscopy. Part 1: fundamentals of electrochemical
impedance spectroscopy,” J. Coat. Technol., vol. 1, no. 8, pp. 46-52, 2004.
62. G. W. Walter, “A review of impedance plot methods used for corrosion performance
analysis of painted metals,” Corros. Sci., vol. 26, no. 9, pp. 681-703, 1986.
63. S. Fletcher, “Tables of degenerate electrical networks for use in the equivalent-circuit
analysis of electrochemical systems,” J. Electrochem. Soc., vol. 141, pp. 1823-26, 1994.
64. S. Kon, K. Oldham, and R. Horowitz, “Piezoresistive and piezoelectric MEMS strain
sensors for vibration detection,” Proc. SPIE, vol. 6529, pp. 65292V, 2007.
65. H. Wang, Q. M. Zhang, L. E. Cross, R. Ting, C. Coughlin, and K. Rittenmyer, “The
origins of electromechanical response in polyurethane elastomers,” Proc. 9th IEEE ISAF,
pp. 182-185, 1994.
66. R. E. Pelrine, R. D. Kornbluh, and J. P. Joseph, “Electrostriction of polymer dielectrics
with compliant electrodes as a means of actuation,” Sens. Actuators, A, vol. 64, no. 1, pp.
77-85, 1998.
67. C. Liu, Foundations of MEMS, New Jersey: Pearson Prentice Hall, 2006.
68. S. D. Senturia, Microsystem Design, New York: Kluwer Academic Publishers, 2000.
69. R. R. He, P. D. Yang, “Giant piezoresistance effect in silicon nanowires,” Nat.
Nanotechnol., vol. 1, no. 1, pp. 42-46, 2006.
70. K. Reck, J. Richter, O. Hansen, E. V. Thomsen, “Piezoresistive effect in top-down
fabricated silicon nanowires,” Des., vol. 1, pp. 2-5, 2008.
71. K. J. Loh, J. P. Lynch, B. S. Shim, N. A. Kotov, “Tailoring piezoresistive sensitivity of
multilayer carbon nanotube composite strain sensors,” J. Intell. Mater. Syst. Struct., vol.
19, no. 7, pp. 747-764, 2007.
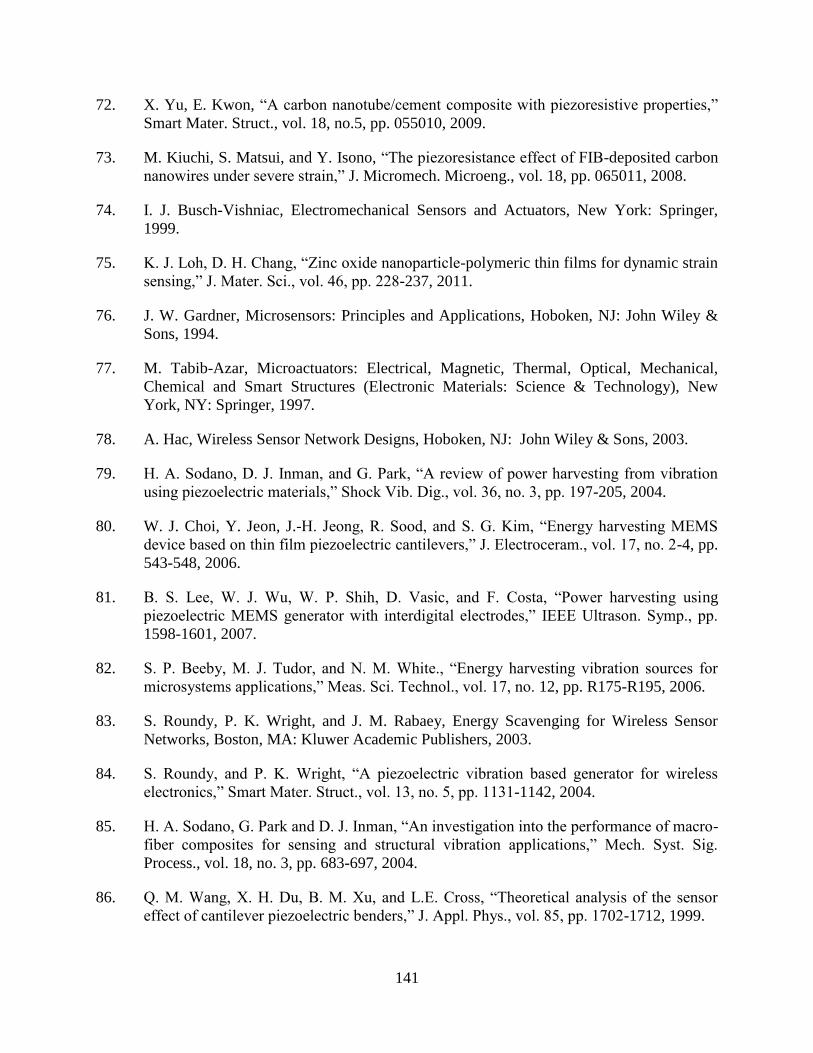
141
72. X. Yu, E. Kwon, “A carbon nanotube/cement composite with piezoresistive properties,”
Smart Mater. Struct., vol. 18, no.5, pp. 055010, 2009.
73. M. Kiuchi, S. Matsui, and Y. Isono, “The piezoresistance effect of FIB-deposited carbon
nanowires under severe strain,” J. Micromech. Microeng., vol. 18, pp. 065011, 2008.
74. I. J. Busch-Vishniac, Electromechanical Sensors and Actuators, New York: Springer,
1999.
75. K. J. Loh, D. H. Chang, “Zinc oxide nanoparticle-polymeric thin films for dynamic strain
sensing,” J. Mater. Sci., vol. 46, pp. 228-237, 2011.
76. J. W. Gardner, Microsensors: Principles and Applications, Hoboken, NJ: John Wiley &
Sons, 1994.
77. M. Tabib-Azar, Microactuators: Electrical, Magnetic, Thermal, Optical, Mechanical,
Chemical and Smart Structures (Electronic Materials: Science & Technology), New
York, NY: Springer, 1997.
78. A. Hac, Wireless Sensor Network Designs, Hoboken, NJ: John Wiley & Sons, 2003.
79. H. A. Sodano, D. J. Inman, and G. Park, “A review of power harvesting from vibration
using piezoelectric materials,” Shock Vib. Dig., vol. 36, no. 3, pp. 197-205, 2004.
80. W. J. Choi, Y. Jeon, J.-H. Jeong, R. Sood, and S. G. Kim, “Energy harvesting MEMS
device based on thin film piezoelectric cantilevers,” J. Electroceram., vol. 17, no. 2-4, pp.
543-548, 2006.
81. B. S. Lee, W. J. Wu, W. P. Shih, D. Vasic, and F. Costa, “Power harvesting using
piezoelectric MEMS generator with interdigital electrodes,” IEEE Ultrason. Symp., pp.
1598-1601, 2007.
82. S. P. Beeby, M. J. Tudor, and N. M. White., “Energy harvesting vibration sources for
microsystems applications,” Meas. Sci. Technol., vol. 17, no. 12, pp. R175-R195, 2006.
83. S. Roundy, P. K. Wright, and J. M. Rabaey, Energy Scavenging for Wireless Sensor
Networks, Boston, MA: Kluwer Academic Publishers, 2003.
84. S. Roundy, and P. K. Wright, “A piezoelectric vibration based generator for wireless
electronics,” Smart Mater. Struct., vol. 13, no. 5, pp. 1131-1142, 2004.
85. H. A. Sodano, G. Park and D. J. Inman, “An investigation into the performance of macro-
fiber composites for sensing and structural vibration applications,” Mech. Syst. Sig.
Process., vol. 18, no. 3, pp. 683-697, 2004.
86. Q. M. Wang, X. H. Du, B. M. Xu, and L.E. Cross, “Theoretical analysis of the sensor
effect of cantilever piezoelectric benders,” J. Appl. Phys., vol. 85, pp. 1702-1712, 1999.
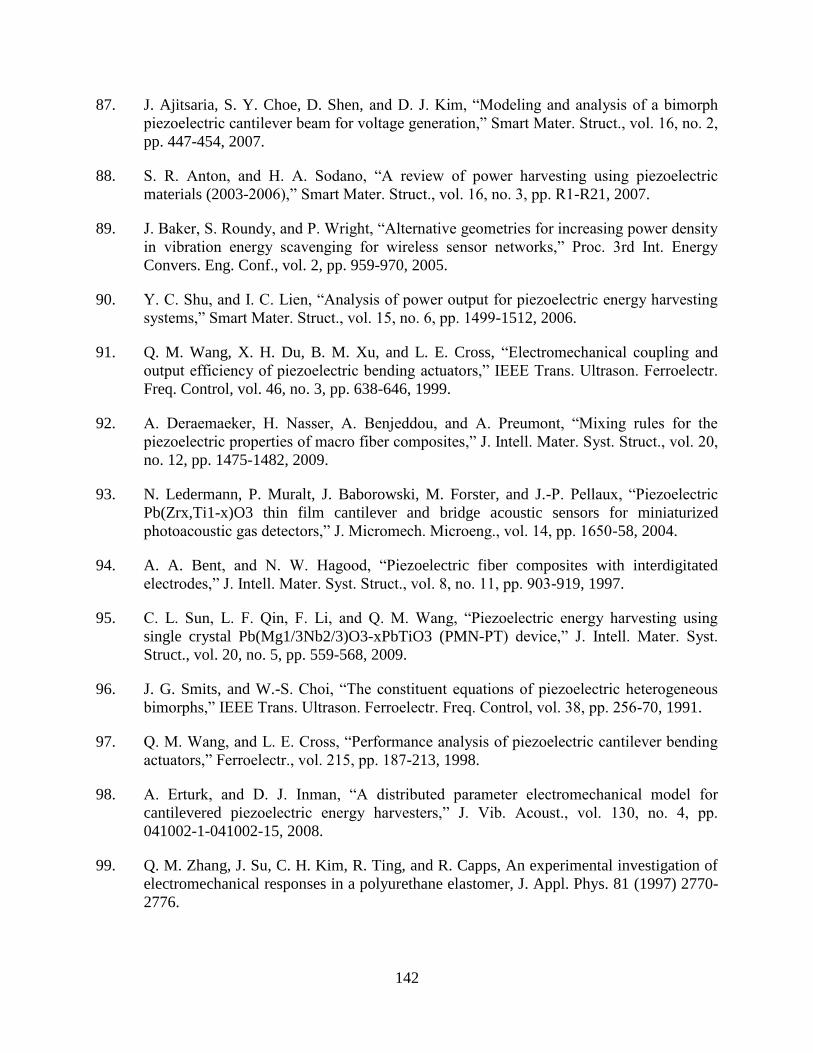
142
87. J. Ajitsaria, S. Y. Choe, D. Shen, and D. J. Kim, “Modeling and analysis of a bimorph
piezoelectric cantilever beam for voltage generation,” Smart Mater. Struct., vol. 16, no. 2,
pp. 447-454, 2007.
88. S. R. Anton, and H. A. Sodano, “A review of power harvesting using piezoelectric
materials (2003-2006),” Smart Mater. Struct., vol. 16, no. 3, pp. R1-R21, 2007.
89. J. Baker, S. Roundy, and P. Wright, “Alternative geometries for increasing power density
in vibration energy scavenging for wireless sensor networks,” Proc. 3rd Int. Energy
Convers. Eng. Conf., vol. 2, pp. 959-970, 2005.
90. Y. C. Shu, and I. C. Lien, “Analysis of power output for piezoelectric energy harvesting
systems,” Smart Mater. Struct., vol. 15, no. 6, pp. 1499-1512, 2006.
91. Q. M. Wang, X. H. Du, B. M. Xu, and L. E. Cross, “Electromechanical coupling and
output efficiency of piezoelectric bending actuators,” IEEE Trans. Ultrason. Ferroelectr.
Freq. Control, vol. 46, no. 3, pp. 638-646, 1999.
92. A. Deraemaeker, H. Nasser, A. Benjeddou, and A. Preumont, “Mixing rules for the
piezoelectric properties of macro fiber composites,” J. Intell. Mater. Syst. Struct., vol. 20,
no. 12, pp. 1475-1482, 2009.
93. N. Ledermann, P. Muralt, J. Baborowski, M. Forster, and J.-P. Pellaux, “Piezoelectric
Pb(Zrx,Ti1-x)O3 thin film cantilever and bridge acoustic sensors for miniaturized
photoacoustic gas detectors,” J. Micromech. Microeng., vol. 14, pp. 1650-58, 2004.
94. A. A. Bent, and N. W. Hagood, “Piezoelectric fiber composites with interdigitated
electrodes,” J. Intell. Mater. Syst. Struct., vol. 8, no. 11, pp. 903-919, 1997.
95. C. L. Sun, L. F. Qin, F. Li, and Q. M. Wang, “Piezoelectric energy harvesting using
single crystal Pb(Mg1/3Nb2/3)O3-xPbTiO3 (PMN-PT) device,” J. Intell. Mater. Syst.
Struct., vol. 20, no. 5, pp. 559-568, 2009.
96. J. G. Smits, and W.-S. Choi, “The constituent equations of piezoelectric heterogeneous
bimorphs,” IEEE Trans. Ultrason. Ferroelectr. Freq. Control, vol. 38, pp. 256-70, 1991.
97. Q. M. Wang, and L. E. Cross, “Performance analysis of piezoelectric cantilever bending
actuators,” Ferroelectr., vol. 215, pp. 187-213, 1998.
98. A. Erturk, and D. J. Inman, “A distributed parameter electromechanical model for
cantilevered piezoelectric energy harvesters,” J. Vib. Acoust., vol. 130, no. 4, pp.
041002-1-041002-15, 2008.
99. Q. M. Zhang, J. Su, C. H. Kim, R. Ting, and R. Capps, An experimental investigation of
electromechanical responses in a polyurethane elastomer, J. Appl. Phys. 81 (1997) 2770-
2776.
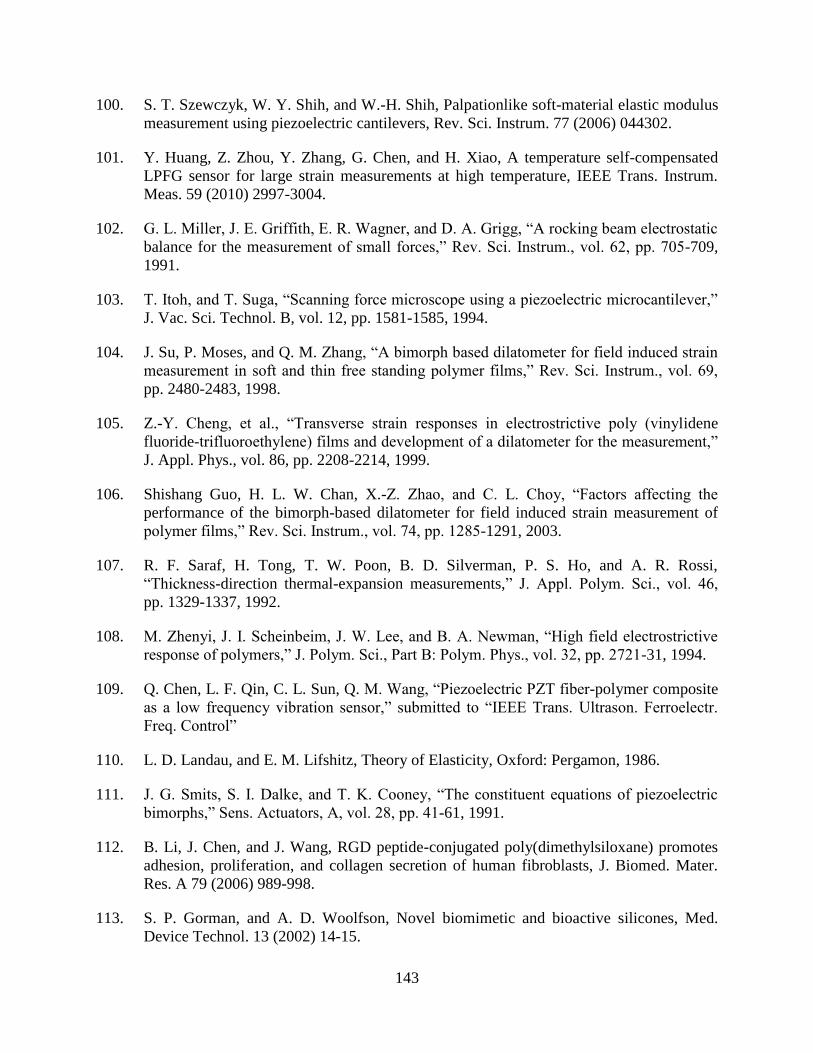
143
100. S. T. Szewczyk, W. Y. Shih, and W.-H. Shih, Palpationlike soft-material elastic modulus
measurement using piezoelectric cantilevers, Rev. Sci. Instrum. 77 (2006) 044302.
101. Y. Huang, Z. Zhou, Y. Zhang, G. Chen, and H. Xiao, A temperature self-compensated
LPFG sensor for large strain measurements at high temperature, IEEE Trans. Instrum.
Meas. 59 (2010) 2997-3004.
102. G. L. Miller, J. E. Griffith, E. R. Wagner, and D. A. Grigg, “A rocking beam electrostatic
balance for the measurement of small forces,” Rev. Sci. Instrum., vol. 62, pp. 705-709,
1991.
103. T. Itoh, and T. Suga, “Scanning force microscope using a piezoelectric microcantilever,”
J. Vac. Sci. Technol. B, vol. 12, pp. 1581-1585, 1994.
104. J. Su, P. Moses, and Q. M. Zhang, “A bimorph based dilatometer for field induced strain
measurement in soft and thin free standing polymer films,” Rev. Sci. Instrum., vol. 69,
pp. 2480-2483, 1998.
105. Z.-Y. Cheng, et al., “Transverse strain responses in electrostrictive poly (vinylidene
fluoride-trifluoroethylene) films and development of a dilatometer for the measurement,”
J. Appl. Phys., vol. 86, pp. 2208-2214, 1999.
106. Shishang Guo, H. L. W. Chan, X.-Z. Zhao, and C. L. Choy, “Factors affecting the
performance of the bimorph-based dilatometer for field induced strain measurement of
polymer films,” Rev. Sci. Instrum., vol. 74, pp. 1285-1291, 2003.
107. R. F. Saraf, H. Tong, T. W. Poon, B. D. Silverman, P. S. Ho, and A. R. Rossi,
“Thickness-direction thermal-expansion measurements,” J. Appl. Polym. Sci., vol. 46,
pp. 1329-1337, 1992.
108. M. Zhenyi, J. I. Scheinbeim, J. W. Lee, and B. A. Newman, “High field electrostrictive
response of polymers,” J. Polym. Sci., Part B: Polym. Phys., vol. 32, pp. 2721-31, 1994.
109. Q. Chen, L. F. Qin, C. L. Sun, Q. M. Wang, “Piezoelectric PZT fiber-polymer composite
as a low frequency vibration sensor,” submitted to “IEEE Trans. Ultrason. Ferroelectr.
Freq. Control”
110. L. D. Landau, and E. M. Lifshitz, Theory of Elasticity, Oxford: Pergamon, 1986.
111. J. G. Smits, S. I. Dalke, and T. K. Cooney, “The constituent equations of piezoelectric
bimorphs,” Sens. Actuators, A, vol. 28, pp. 41-61, 1991.
112. B. Li, J. Chen, and J. Wang, RGD peptide-conjugated poly(dimethylsiloxane) promotes
adhesion, proliferation, and collagen secretion of human fibroblasts, J. Biomed. Mater.
Res. A 79 (2006) 989-998.
113. S. P. Gorman, and A. D. Woolfson, Novel biomimetic and bioactive silicones, Med.
Device Technol. 13 (2002) 14-15.
144
114. K. Z. Gumargalieva, G. E. Zaikov, and Y. V. Moiseev, Quantitative foundations of
polymer biocompatibility and biodestructibility, Int. J. Polym. Mater. 31 (1996) 183-214.
115. Y. Ono, M. Kobayashi, Q. Liu, C.-K. Jen, and A. Blouin, “A piezoelectric membrane
sensor for biomedical monitoring,” Proc. IEEE Ultrason. Symp., pp. 800-803, 2006.
116. P. Corbishley, E. Rodriguez-Villegas, “Breathing detection: towards a miniaturized,
wearable, battery operated, monitoring system,” IEEE Trans. Biomed. Eng., vol. 55, no.
1, pp. 196-204, 2008.
117. http://www.sleepfoundation.org/article/sleep-related-problems/obstructive-sleep-apnea-
and-sleep
118. M. Folke, et al., “Critical review of non-invasive respiratory monitoring in medical care,”
Med. Biol. Eng. Comput., vol. 41, no. 4, pp. 377-383, 2003.
119. G. J. Tortora, and N. P. Anagnostakos, Principles of Anatomy and Physiology, 6th ed.,
New York: Harper-Collins, 1990.
120. L. Sherwood, Fundamentals of Physiology: A Human Perspective, Bolmont: Thomson
Brooks/Cole, 2006.
121. R. Farré, et al., “Noninvasive monitoring of respiratory mechanics during sleep,” Eur.
Respir. J., vol. 24, no. 6, pp. 1052-1060, 2004.
122. N. André, et al., “Miniaturized wireless sensing system for real-time breath activity
recording,” IEEE Sens. J., vol. 10, no. 1, pp. 178-184, 2010.
123. M. D. Epstein, S. A. Chicoine, and R. C. Harumara, “Detection of upper airway
resistance syndrome using a nasal cannula/pressure transducer,” Chest, vol. 117, no. 4,
pp. 1073-1077, 2000.
124. Y. Ono, D. Mohamed, M. Kobayashi, and C.-K. Jen, “Piezoelectric membrane sensor and
technique for breathing monitoring,” Proc. IEEE Ultrason. Symp., pp. 795-798, 2008.
125. R. G. Norman, M. M. Ahmed, J. A. Walsleben, and D. M. Rapoport, “Detection of
respiratory events during NPSG: nasal cannula/pressure sensor versus thermistor,” Sleep,
vol. 20, no. 12, pp. 1175-1184, 1997.
126. K. P. Cohen, et al., “Comparison of impedance and inductance ventilation sensors on
adults during breathing, motion and simulated airway obstruction,” IEEE Trans. Biomed.
Eng., vol. 44, no. 7, pp. 555-566, 1997.
127. L. Tarassenko, L. Mason, N. Townsend, “Multi-sensor fusion for robust computation of
breathing rate,” Electron. Lett., vol. 38, no. 22, pp. 1314-1316, 2002.
128. K. Uchino, Piezoelectric Actuators and Ultrasonic Motors, Boston: Kulwer Academic,
1997.
145
129. M. Akiyama, N. Ueno, K. Nonaka, and H. Tateyama, “Flexible pulse-wave sensors from
oriented aluminum nitride nanocolumns,” Appl. Phys. Lett., vol. 82, pp. 1977-79, 2003.
130. R. Fletcher, et al., “iCalm: wearable sensor and network architecture for wirelessly
communicating and logging autonomic activity,” IEEE Trans. Inf. Technol. Biomed., vol.
14, no. 2, pp. 215-223, 2010.
131. G. Gautschi, Piezoelectric Sensorics: Force, Strain, Pressure, Acceleration and Acoustic
Emission Sensors, Materials and Amplifiers, Berlin: Springer, 2002.
132. A. A. Vives, Piezoelectric Transducers and Applications, Berlin: Springer, 2004.
133. Q. Chen, L.F. Qin, and Q. M. Wang, “Rectangular PZT fiber composite sensor for
breathing monitoring,” submitted to “Sensors and Actuators A: Physical”
134. M. Brissaud, “Theoretical modeling of non-symmetric circular piezoelectric bimorphs,”
J. Micromech. Microeng., vol. 16, no. 5, pp. 875-885, 2006.
135. S. Timoshenko, and S. Woinowsky-Krieger, Theory of Plates and Shells, New York, NY:
McGraw-Hill, 1959.
136. A. Leissa, Vibration of Plates, Acoustical Society of America (Reprint), 1993.
137. W. P. Mason, Electromechanical Transducers and Wave Filters, Princeton, NJ: Van
Nostrand-Reinhold, 1948.
138. D. K. Sinha, “A note on mechanical response in the piezoelectric transducer owing to an
impulsive voltage input,” Proc. Natl. Inst. Sci. India, vol. 31, no. 4, pp. 395-402, 1965.
139. K.Y. Yeh, “Large deflection of a circular plate with a circular hole at the center,” Chin. J.
Phys., vol. 9, no. 2, pp. 110-129, 1953.
140. N. Bu, N. Ueno, and O. Fukuda, “Monitoring of respiration and heartbeat during sleep
using a flexible piezoelectric film sensor and empirical mode decomposition,” Proc. 29th
Annual Inter. Conf. IEEE EMBS, pp. 1362-1366, 2007.
141. F. Kovács, M. Török, and I. Habermajer, “A rule-based phonocardiographic method for
long-term fetal heart rate monitoring,” IEEE Trans. Biomed. Eng., vol. 47, no. 1, pp. 124-
130, 2000.
142. T. Penzel, and R. Conradt, “Computer based sleep recording and analysis,” Sleep Med.
Rev., vol. 4, pp. 131-148, 2000.
143. Y. Nishida, T. Mori, H. Mizoguchi, and T. Sato, “Sleep apnea syndrome diagnosis based
on image processing,” J. Robotics Society of Japan, vol.16, pp. 140-147, 1998.
146
144. H. Aoki, Y. Takemura, K. Mimura, H. Aoki, and M. Nakajima, “A non-contact and non-
restricting respiration monitoring method for a sleeping person with a fiber-grating
optical sensor,” Sleep Biol. Rhythms, vol. 1, pp. 249-250, 2003.
145. T. Watanabe, and K. Watanabe, “Noncontact method for sleep stage estimation,” IEEE
Trans. Biomed. Eng., vol. 51, pp. 1735-1748, 2004.
146. Y-J. Chee, J-M, Han, J-W, Youn, and K-S. Park, “Air mattress sensor system with
balancing tube for unconstrained measurement of respiration and heart beat movements,”
Physiol. Meas., vol. 26, pp. 413-422, 2005.
147. X. Zhu, W. Chen, T. Nemoto, Y. Kanemitsu, K. Kitamura, K. Yamakoshi, “Accurate
determination of respiratory rhythm and pulse rate using an under-pillow sensor based on
wavelet transformation,” Proc. 27th Annual Inter. Conf. IEEE EMBS, pp. 5869-72, 2005.
148. Y. Nishida, T. Hori, “Non-invasive and unrestrained monitoring of human respiratory
system by sensorized environment,” Proc. 1st IEEE Intern. Conf. on Sensors, pp. 62.4(1)-
(6), 2002.
149. F. Wang, M. Tanaka, and S. Chonan, “Development of a PVDF piezopolymer sensor for
unconstrained in-sleep cardiorespiratory monitoring,” J. Intell. Mater. Syst. Struct., vol.
14, pp. 185-190, 2003.
150. F. Kovács, and M. Török, “An instrument using parallel filtering of acoustic signals to
record fetal heart rate,” Biomed. Instrum. Technol., vol. 11, no. 3, pp. 213–219, 1995.
151. H. G. Goovaerts, O. Rompelman, and H. P. van Geijn, “A transducer for detection of
fetal breathing movements,” IEEE Trans. Biomed. Eng., vol. 36, pp. 471–478, 1989.
152. D. G. Talbert, W. L. Davies, F. Johnson, N. Abraham, N. Colley, and D. P. Southall,
“Wide bandwith fetal phonography using a sensor matched to the compliance of the
mother’s abdominal wall,” IEEE Trans. Biomed. Eng., vol. 33, pp. 175–181, 1986.
153. T. D. Rowsell, “PC-based real-time measurement of the beat-to-beat fetal heart rate using
phonocardiography,” Roy. Soc. Medicine Forum on Computers in Medicine, 1990.
154. A. J. Zuckerwar, R. A. Pretlow, J. W. Stoughton, and D. A. Baker, “Development of a
piezopolymer pressure sensor for portable fetal heart rate monitor,” IEEE Trans. Biomed.
Eng., vol. 40, pp. 963–969, 1993.
Recommended