MURDOCH RESEARCH REPOSITORY
This is the author’s final version of the work, as accepted for publication following peer review but without the publisher’s layout or pagination.
The definitive version is available at http://dx.doi.org/10.1016/j.meatsci.2015.08.006
Jose, C.G., Jacob, R.H., Pethick, D.W. and Gardner, G.E. (2016) Short term supplementation rates to optimise vitamin E
concentration for retail colour stability of Australian lamb meat. Meat Science, 111. pp. 101-109.
http://researchrepository.murdoch.edu.au/28389/
Copyright: © 2015 Elsevier Ltd.
�������� ����� ��
Short term supplementation rates to optimise vitamin E concentration forretail colour stability of Australian lamb meat
C.G. Jose, R.H. Jacob, D.W. Pethick, G.E. Gardner
PII: S0309-1740(15)30076-0DOI: doi: 10.1016/j.meatsci.2015.08.006Reference: MESC 6771
To appear in: Meat Science
Received date: 3 November 2014Revised date: 3 August 2015Accepted date: 10 August 2015
Please cite this article as: Jose, C.G., Jacob, R.H., Pethick, D.W. & Gardner, G.E., Shortterm supplementation rates to optimise vitamin E concentration for retail colour stabilityof Australian lamb meat, Meat Science (2015), doi: 10.1016/j.meatsci.2015.08.006
This is a PDF file of an unedited manuscript that has been accepted for publication.As a service to our customers we are providing this early version of the manuscript.The manuscript will undergo copyediting, typesetting, and review of the resulting proofbefore it is published in its final form. Please note that during the production processerrors may be discovered which could affect the content, and all legal disclaimers thatapply to the journal pertain.
ACC
EPTE
D M
ANU
SCR
IPT
ACCEPTED MANUSCRIPT
Short term supplementation rates to optimise vitamin E concentration for retail colour
stability of Australian lamb meat
C.G. Jose12
, R.H. Jacob13
, D.W. Pethick12
and G.E. Gardner12
1 Australian Sheep Industry CRC
2 School of Veterinary and Life Sciences, Murdoch University, Murdoch, Western Australia
6150, Australia 3 Department of Agriculture and Food, South Perth, Western Australia 6151, Australia
Corresponding author: Cameron Jose. E-mail [email protected]
Phone +61 8 9360 6199
Abstract
The relationship between vitamin E supplementation rate and colour stability was
investigated using 70 mixed sex 6-8 month old crossbred lambs. An initial group of 10 were
slaughtered, while the remainder were fed a pellet ration containing either 30, 150, 275 or 400IU
Vitamin E/kg ration or on green pasture for 56 days. After slaughter, carcases were halved; one
side packed fresh (5 days) and the other in CO2 (21 days), both at 2oC. Five muscles were set for
retail display for 96 hours. The oxy/metmyoglobin ratio was measured every 12 hours. Colour
stability increased with increasing muscle vitamin E until an apparent maximum effect for
vitamin E concentration (3.5-4.0mg -tocopherol/kg tissue) was reached beyond which no
further response was evident. This was reached within 3-4 weeks (275IU treatment), and meat
from these lambs should reach 60 hours retail display with a satisfactory surface colour. This
effect was most apparent in aerobic muscle types and meat aged post slaughter.
Keywords: Colour stability; Vitamin E; Alpha tocopherol; supplementation; lamb.
1. Introduction
During retail display the surface of lamb meat will turn from red to brown. Consumers’ choose
to buy meat primarily by visual appearance. A cut with a bright red colour is more likely to be
ACC
EPTE
D M
ANU
SCR
IPT
ACCEPTED MANUSCRIPT
sold than a cut that appears brown, forcing the retail sector to discount meat that fails to sell
quickly, resulting in a substantial economic loss (Williams, Frye, Frigg, Schaefer, Scheller &
Liu, 1992).
The browning of meat is due to the oxidation of the muscle pigment myoglobin, from
red oxymyoglobin to brown metmyoglobin. Colour stability of meat is defined by the rate of this
colour change. The formation of metmyoglobin, can be slowed by the use of antioxidants such as
vitamin E (Faustman, Chan, Schaefer & Havens, 1998; Wulf, Morgan, Sanders, Tatum, Smith &
Williams, 1995). In Western Australia vitamin E deficiency causes nutritional myopathy in
grazing lambs due to a lack of green pasture in the summer season. Coincidentally meat retailers
observe a decline in colour stability of meat during this period (Pearce, Masters, Smith, Jacob &
Pethick, 2005), with meat appearing brown before the retail shelf life bench mark of 48 hours is
reached (a benchmark commonly used in Australian retail).
Vitamin E (-tocopherol) is a lipid soluble antioxidant that protects lipids from peroxidation.
However the causal relationship between lipid peroxidation and formation of metmyoglobin in
meat during retail display has yet to be proven (Faustman et al., 1998). Thus while the
mechanism is not yet proven it is assumed that vitamin E protects myoglobin in meat against
oxidation by inhibition of lipid peroxidation (Faustman, Sun, Mancini & Suman, 2010).
Meat is often aged before sale because of logistical considerations of transport to market or
strategically to enhance tenderness of premium cuts. A common practice by Australian
processors is to age carcasses in CO2 atmospheres, which allows for longer storage of 3-4 weeks.
However, lipid peroxidation during retail display will increases with ageing and thus aging leads
to a decline in the colour stability of meat after the product has been cut for retail display
(Ponnampalam, Norng, Burnett, Dunshea, Jacobs & Hopkins, 2014; Wulf et al., 1995). This is
ACC
EPTE
D M
ANU
SCR
IPT
ACCEPTED MANUSCRIPT
particularly evident in more oxidative muscle types such as the m. gluteus medius (GM)
(O'Keefe & Hood, 1982), where the free-radical load is likely greater. Therefore aged meat from
the more oxidative cuts is likely to have greater potential for a protective effect of vitamin E.
Vitamin E is available to grazing livestock from green pasture, and grain based rations need to be
supplemented with vitamin E to meet nutritional requirements for animal health. The majority of
colour stability studies have been done with cattle, whereby vitamin E supplementation of grain-
based feed lot rations improved the colour stability of beef (Faustman et al., 1998). Similar
studies have shown positive effects in sheep (Guidera, Kerry, Buckley, Lynch & Morrissey,
1997; Turner, McClure, Weiss, Borton & Foster, 2002; Wulf et al., 1995) over the
supplementation range of 300IU to 1000IU of vitamin E/kg of feed, with these effects all similar
in magnitude. Kasapidou, Wood, Richardson, Sinclair, Wilkinson & Enser (2012), found that the
optimum level of vitamin E supplementation for decreasing lipid peroxidation was 250IU/kg.
Alternatively, Turner et al. (2002) found no effect of vitamin E when supplemented at the rate of
15IU/kg. This implies that the rate of vitamin E supplementation must exceed a threshold
concentration to impact on sheep meat colour stability which appears to lie between 15 and
250IU/kg. The authors are not aware of any work testing dose responses within this range in
Australian lambs.
Threshold muscle concentrations of vitamin E have been described as a concentration in
which a maximum response in maintaining colour stability is observed. These levels have been
reported in sheep to be 1.9 (Kasapidou et al., 2012), 2.26 (Álvarez, De la Fuente, Díaz,
Lauzurica, Pérez & Cañeque, 2008) and 5.6mg/kg (Lopez Bote, Daza, Soares & Berges, 2001),
while in beef, muscle vitamin E concentrations of between 3.0 (Faustman, Cassens, Schaefer,
Buege, Williams & Scheller, 1989) and 3.3 mg/kg (Arnold, Arp, Scheller, Williams & Schaefer,
ACC
EPTE
D M
ANU
SCR
IPT
ACCEPTED MANUSCRIPT
1993) have been reported to improve colour stability. More recently, threshold concentrations of
3.45mg/kg (Ponnampalam et al., 2014) and 3.76mg/kg (Hopkins, Lamb, Kerr, van de Ven &
Ponnampalam, 2013) have been reported for Australian sheep, however these studies did not
involve any dietary supplementation and any dietary vitamin E was obtained from grazing green
pastures. Any muscle concentrations beyond these threshold levels were shown to have no added
benefit to the colour stability. Our objective was to confirm the concentration of vitamin E
required in muscle to reach the maximum response in colour stability of lamb meat. Furthermore
to determine the rate and period of time required for supplementation to achieve this level; to
provide a practical solution for colour stability to the Australian prime lamb industry during
periods of grain feeding over summer.
This experiment examined the effect on meat colour stability of the ad lib
supplementation rate of vitamin E in the range of 30-400IU/kg fed to lambs for 8 weeks. Several
hypotheses were tested:
(i) Colour stability will increase with vitamin E dose rate to a maximum response threshold value
obtained in the supplementation range tested.
(ii) The positive effect of vitamin E supplementation on colour stability will be most apparent
when meat is aged and in more oxidative type muscles.
(iii) Lambs from green pasture will have a higher muscle vitamin E concentration compared to
those supplemented with 30IU (minimum nutritional requirement) and thus will have a better
colour stability.
ACC
EPTE
D M
ANU
SCR
IPT
ACCEPTED MANUSCRIPT
2. Methods and materials
2.1. Lambs and dietary treatments
This experiment was performed under the guidelines of animal ethics and all procedures
were given approval via the animal ethics committee at Murdoch University.
70 mixed sex 6-8 month old crossbred lambs with an average live weight of 38.0±0.38 kg
(mean±sem) were used for this experiment. Lambs were sourced in summer from a commercial
farm where they grazed dry pasture supplemented with lupin grain at the rate of 600g/lamb/day,
conditions in which tissue vitamin E levels are rapidly depleted (Fry, Smith, McGrath, Speijers
& Allen, 1993). Initial plasma measurements, confirmed that all animals entering the experiment
were deficient or close to deficient in vitamin E (< 0.5mg/L; (Menzies, Langs, Boermans, Martin
& McNally, 2004)). Lambs were transported to Murdoch University farm, stratified for weight
and a group of the 10 heaviest lambs (mean live weight 38.8 ± 0.47 kg) were sent immediately to
a commercial abattoir for slaughter in order to measure colour stability of meat from non-
supplemented lambs (pre-treatment level) coming straight off the dry pasture. From the
remaining 60 lambs the heaviest 12 were allocated to the pasture group (assuming subsequent
growth rates would be lower) and the remainder randomly allocated to 1 of 4 groups (n=12),
where the animals would be supplemented with either 30, 150, 275 or 400 IU of vitamin E/kg of
pelleted feed. They were drenched with an anthelmintic that contained selenium (Cydectin©
0.5mg/ml sodium selenate; administered at the rate of 1ml/5kg of body weight) and as suggested
by the manufacturer would offer 8 weeks of protection. Groups 1 to 4 were held in pens under
shade and fed a pelleted ration for 56 days whilst pasture group grazed an irrigated pasture
ACC
EPTE
D M
ANU
SCR
IPT
ACCEPTED MANUSCRIPT
(mixed sward of kikuyu (Pennisetum clandestinum)/clover (Trifolium)/ryegrass (Lolium
perenne)) for the same period. The clover contained 97mg/kg of vitamin E and the kikuyu grass
pasture 127 mg/kg on a dry matter basis (as measured by methods described below). No estimate
was made for the ryegrass as this was present in very small amounts. The pelleted feed contained
synthetic -tocopherol acetate (ROVIMIX® E50) at the rate of 30, 150, 275 and 400 IU/kg DM
for groups 1 to 4 accordingly. The pellets consisted of 30% barley, 3.5% oats, 28% lupin grain
and 38.5% hay, with an energy content of 11 MJ/kg ME and 18% crude protein.
Muscle biopsies were performed on all animals upon arrival at Murdoch University, then
every 14 days thereafter (a total of 4 times), to measure muscle vitamin E concentrations in the
m. semimembranosus (SM) and m. semitendinosus (ST). Biopsies were performed by the method
of Gardner, Jacob and Pethick ( 2001). Briefly, the sampling site was located in the groove
between the two muscles, approximately 5 - 10cm distal to the anus. This location allowed clear
access to both muscles through a single incision. Following biopsy, muscle samples were placed
into liquid nitrogen after “blotting” away blood and removal of visible fat. Muscle samples were
stored at -80 °C until assayed. At the time of each biopsy lamb live weights were measured and
venous blood was taken for vitamin E analysis. Blood was taken from the jugular vein using lith-
heperan vacutubes and placed on ice before centrifugation to allow for the sampling of plasma.
After 56 days the animals were transported for 2 hours to the same commercial abattoir
used to slaughter the initial 10 lambs and slaughtered after a 24h lairage period. Liver samples
were collected immediately post slaughter for Vitamin E analysis.
Each carcase was divided longitudinally into halves and 1 entire half was packaged in a
modified atmosphere package containing greater than 99% Carbon Dioxide with a 2:1 gas to
muscle headspace ratio and aged for 21 days. Carbon Dioxide flushing was carried out as per
ACC
EPTE
D M
ANU
SCR
IPT
ACCEPTED MANUSCRIPT
industry standards highlighted by Meat and Livestock Australia. Briefly, carcase sides were
stored in bags that are not permeable to oxygen or other gases. Target oxygen levels inside the
pack were to be less than 0.1% and no greater than 0.15% and thus the bags were flushed and
evacuated three times with CO2 before the bags were finally sealed and stored. This group was
labelled as “Aged”. The other carcase half was packed into a loose and unsealed plastic bag for 5
days before muscles were dissected, and the group was labelled as “Fresh”. Both the “Aged” and
“Fresh” samples were stored together in the same cool room at 2oC for the respective time period
before 5 muscles (m. gluteus medius (GM), m. longissimus lumborum (LL), SM, ST and m.rectus
femoris (RF)) were dissected for sampling. The LL, SM and ST were taken from all carcases,
while the RF and GM were sampled in half the carcases only, due to some carcases not having
RF or GM large enough to provide an appropriate sized steak.
2.2. Retail display and Colour stability measurements
Prior to commencing measurements each muscle was sliced into 2cm thick slices, visible fat
removed, placed on black Styrofoam trays. Samples were allowed to bloom for 30 minutes at
4oC beforebeing over wrapped with chloride cling wrap (Resinite “DHW” Meat AEP, 3µ
thickness, oxygen transmission rate of 2300 – 3000 cc/100 sq in/24hrs) and stored at 4oC in a
display refrigerator fitted with cool white fluorescent lights (OSRAM L36W/20, Germany).
Colour measurements were taken every 12 hours for 96 hours using a Hunter Lab Mini Scan XE
Plus (model No. 45/0-L, Hunter Associates Laboratory Inc., Reston VA, USA, aoerture of 3.18
cm), with the light source set to “D65” and the observer angle set to 10o.
Light reflectance was measured and the oxy/metmyoglobin ratio calculated as the ratio of
light reflectance at 630 and 580 nm. Hunt (1980) noted that very little metmyoglobin was present
ACC
EPTE
D M
ANU
SCR
IPT
ACCEPTED MANUSCRIPT
in meat with an oxy/metmyoglobin ratio above 4, while at a ratio approaching 1, metmyoglobin
was the only remaining form. Thus the perceived surface colour of meat will increase in
brownness as the oxy/metmyoglobin ratio decreases from 4 to 1. At an oxy/metmyoglobin ratio
of 3.5 consumers perceive meat to be brown in colour, influencing purchasing choices
(Morrissey, Jacob & Pluske, 2008). Khliji, van de Ven, Lamb, Lanza & Hopkins (2010) reported
this level to be 3.3, however, the bench mark by Morrissey et al. (2008) was calculated using the
same lab and materials as the current experiment so the value of 3.5 was used as a benchmark for
consumer acceptance of meat colour in this study. Hunter L*a*b* colour scores were also
recorded.
2.3. Assay procedure, Ultimate pH and Driploss
The vitamin E content of muscle, blood, liver and muscle biopsies were measured using
high performance liquid chromatography with fluorescence detection (McMurray &
Blanchflower, 1979). Muscle and feed samples were saponified by the method of Bieri et
al.(1961), before extraction with hexane. Plasma was deprotienized before the assay using
ethanol. The assay was standardized against an -tocopherol standard (0.496g per 50ml; added at
the commencement of assay) and the recovery rates for tissues and feed samples were 94% and
91% respectively.
Drip loss was measured by taking samples of SM, LL and RF. At the beginning of the
retail display period a piece of muscle weighing about 15g (approximately a 3cm cube) was
weighed and recorded and noted as the weight at display time zero. Samples were wrapped in
mesh netting before being hung in a plastic bag at 2oC for 24 hours. These samples were weighed
again after 24h, the weight loss calculated.
ACC
EPTE
D M
ANU
SCR
IPT
ACCEPTED MANUSCRIPT
Ultimate pH (pHu) was measured in each muscle at the time the meat was cut for retail
display, using a TPS WP-80 pH meter (TPS Australia, Qld, Cat no: 121180) equipped with a
glass-tipped Ionode pH electrode (Ionode Pty Ltd, Qld, Cat no: IJ 44) and a temperature probe
(TPS Australia, Cat no: 121249) calibrated at ambient temperature using buffers at pH 4.00 and
6.88.
2.4. Data analysis
The software package SAS® was used for all statistical analyses (SAS Institute, 2001).
Oxy/metmyoglobin ratio data was analysed using a linear mixed effects model using display
time as a covariate, diet, muscle and packaging type as fixed effects, and animal within package
as a random term The initial L* value was analysed in a similar model excluding time as a
covariate. In a separate analysis, the oxy/metmyoglobin ratio at 48 and 60 hours for each
individual sample was predicted for the grain fed animals only by fitting the following
exponential function:
yt = xu + (xi - xu)-xkt
where yt = oxy/metmyoglobin ratio at time t, xu = final oxy/metmyoglobin ratio reached,
xi = starting ratio, xk is a constant and t is time. This function was fitted to the data using a non
linear model in SAS. This enabled the impact of muscle Vitamin E concentration on the
predicted oxy/metmyoglobin ratios at 48 and 60 hours to be tested, and to estimate the threshold
concentration of muscle Vitamin E that yielded the least change in oxy/metmyoglobin ratio
during the display period. Linear mixed effects models were used, with packaging type and
muscle as fixed effects, muscle Vitamin E concentration as a covariate, and animal within
package as the random term.
ACC
EPTE
D M
ANU
SCR
IPT
ACCEPTED MANUSCRIPT
The oxy/metmyoglobin ratio first reading was taken 30 minutes after cutting to allow
bloom time returned consistently lower values than the subsequent readings. This was most
likely due to an interaction between the time allowed for the blooming process to occur and the
commencement of myoglobin oxidation. Therefore the values at time zero were excluded from
all model fitting processes.
All mean data is presented with plus or minus the standard error of the mean (±sem).
3. Results
3.1. Liveweight and growth
Lambs on the pelleted rations consumed about 1.6 kg per head per day. Given that
Vitamin E was supplemented at 30, 150, 275 and 400 IU per kg of this ration this resulted in
total Vitamin E intakes of 48, 240, 440 or 640 IU/lamb/day of-tocopherol acetate for the 4
treatment groups accordingly. No estimate could be made for the green pasture group. Lambs
grew at an average of 1.35±0.143, 1.15±0.143, 1.29±0.149, 0.99±0.143 and 0.39±0.143 kg/week
(±sem) for the 30, 150, 275, 400IU and green pasture diets respectively. Those fed the grain diets
grew faster than the pasture lambs (P<0.05). Mean slaughter weights were 38.8 ± 0.47,
47.63±0.896, 44.83±0.896, 47.27±0.936, 43.69±0.896 and 43.69±0.896 (±sem) for the Pre-
treatment, 30, 150, 275, 400IU and green pasture diets respectively. The 30 and 275IU groups
were the heaviest at slaughter (P<0.05).
ACC
EPTE
D M
ANU
SCR
IPT
ACCEPTED MANUSCRIPT
3.2. Tissue Vitamin E concentration
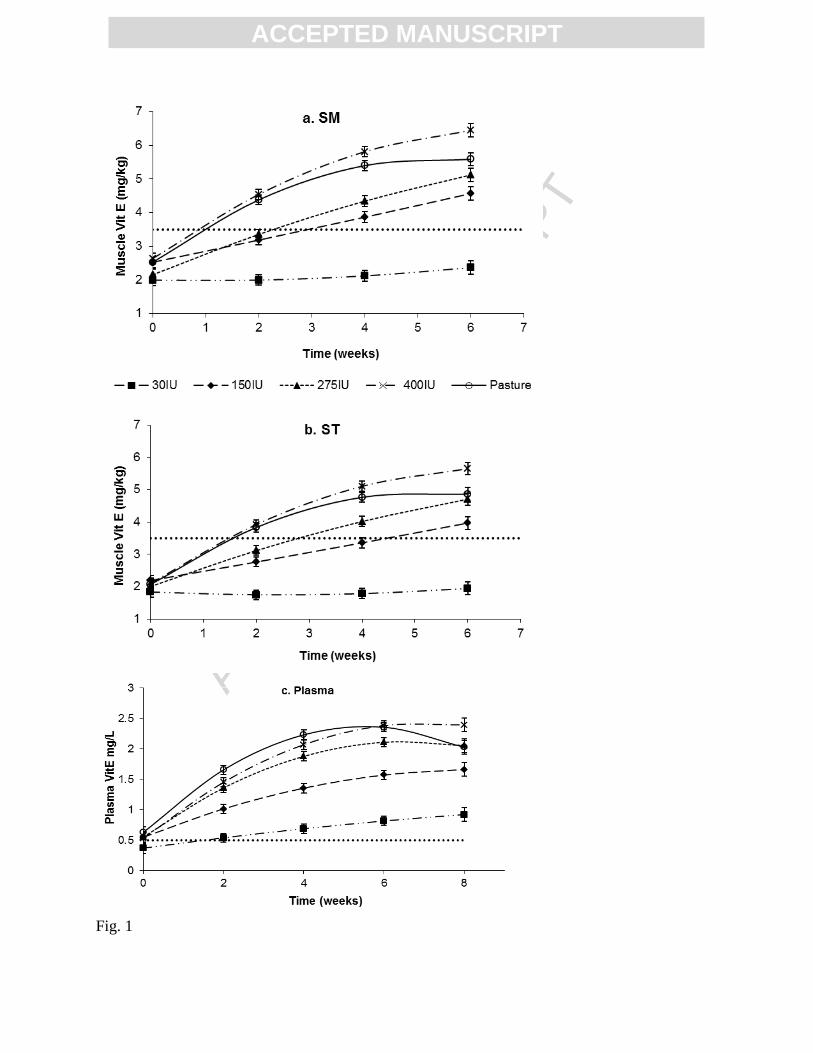
The concentration of vitamin E in both SM (Figure 1a) and ST (Figure 1b) increased with
time during the feeding period (P<0.05) across all treatments groups except the 30IU treatment.
The rate that muscle accumulated vitamin E increased as the level of supplementation increased
(P<0.05). Muscle Vitamin E concentrations in the 400IU group increased nearly 3-fold over 6
weeks compared to only 2 fold for the 150IU group. Until week 4, the muscle vitamin E of the
pasture fed and 400IU group animals increased similarly, after which the concentration for
pasture fed animals seemed to reached a plateau.
Vitamin E concentration changed in plasma in a similar trend to muscle but to a greater
magnitude. In the 400IU group the value at 6 weeks, was as much as 4 fold than the starting
value (Figure 1c). In contrast to muscle, the 30IU group showed some increase (P<0.05)
doubling over the supplementation period (Figure 1c). The levels of vitamin E in the plasma
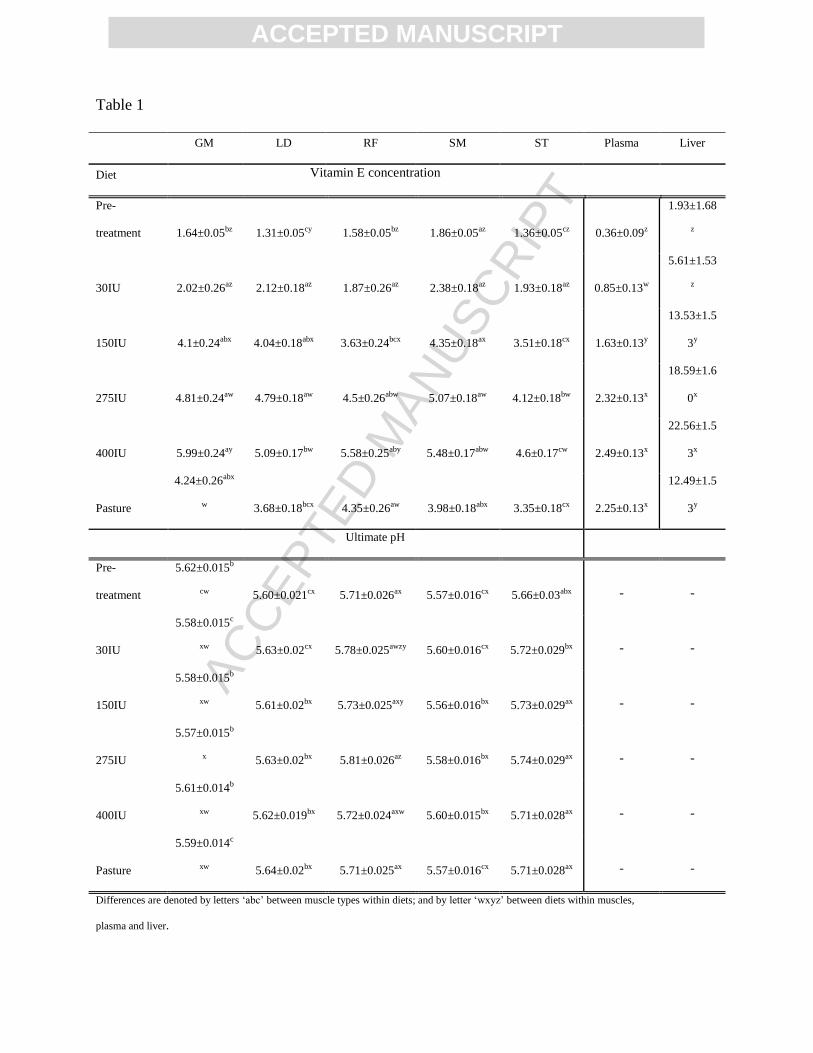
from the Pre-treatment lambs (Table 1) were sufficiently low enough to be at high risk of
developing nutritional myopathy (< 0.5mg/L; (Menzies et al., 2004)) and these lambs can be
regarded as being deficient in vitamin E.
At slaughter, muscle, plasma and liver vitamin E concentration generally increased
according to the supplementation rate of -tocopherol acetate (p<0.05) (Table 1). The exception
being the pre-treatment group, which had the lowest vitamin E concentration in liver and plasma;
but muscle values were no different to the 30IU group in all muscles except the LL (Table1).
Vitamin E concentrations differed between muscles (P<0.05), however this also varied within
diet treatments and no one muscle constantly had the highest vitamin E concentration. However
the ST consistently contained the lowest concentration of vitamin E across all diets (Table 1).
ACC
EPTE
D M
ANU
SCR
IPT
ACCEPTED MANUSCRIPT
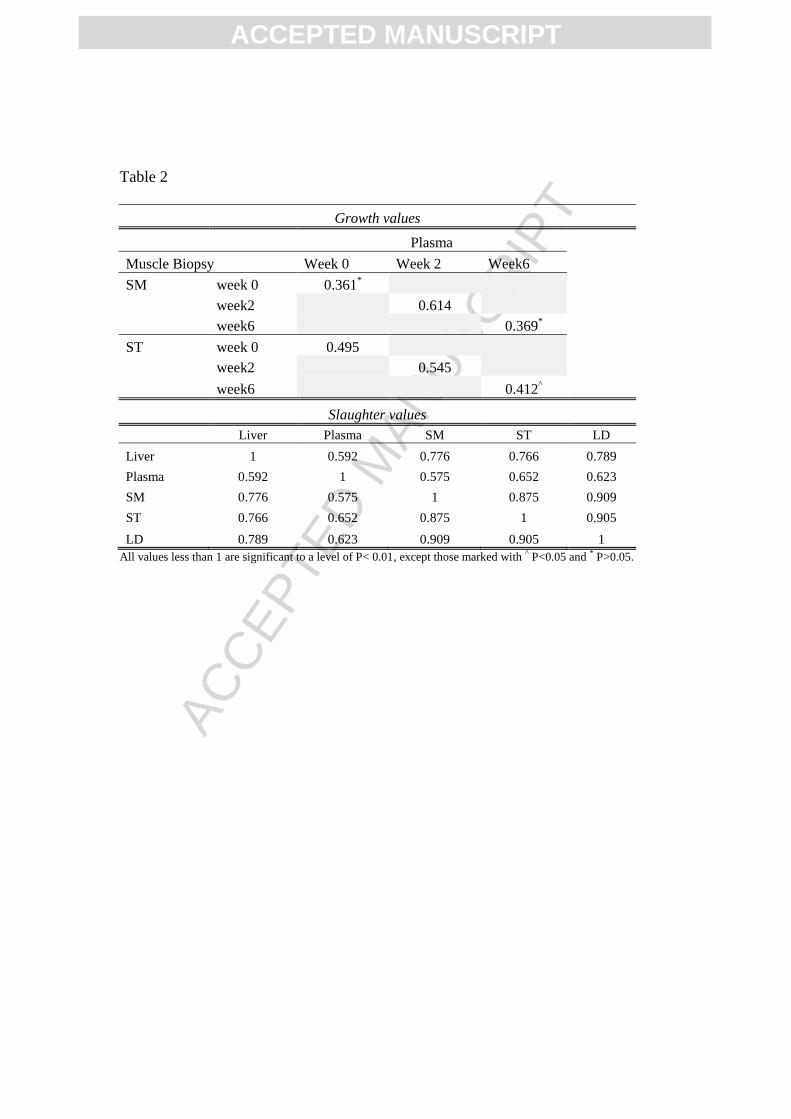
Strong positive correlations existed (P<0.05) between all tissues for vitamin E
concentration at slaughter, although the correlation between plasma and the rest of the tissues
were relatively weaker (Table 2). During the growing period, plasma levels correlated well with
the muscle concentrations (biopsy data) at week 0 and 2 of the feeding period (Table 2).
However, at week 6 the correlation between plasma and muscle concentrations was weaker.
3.3. Colour Stability
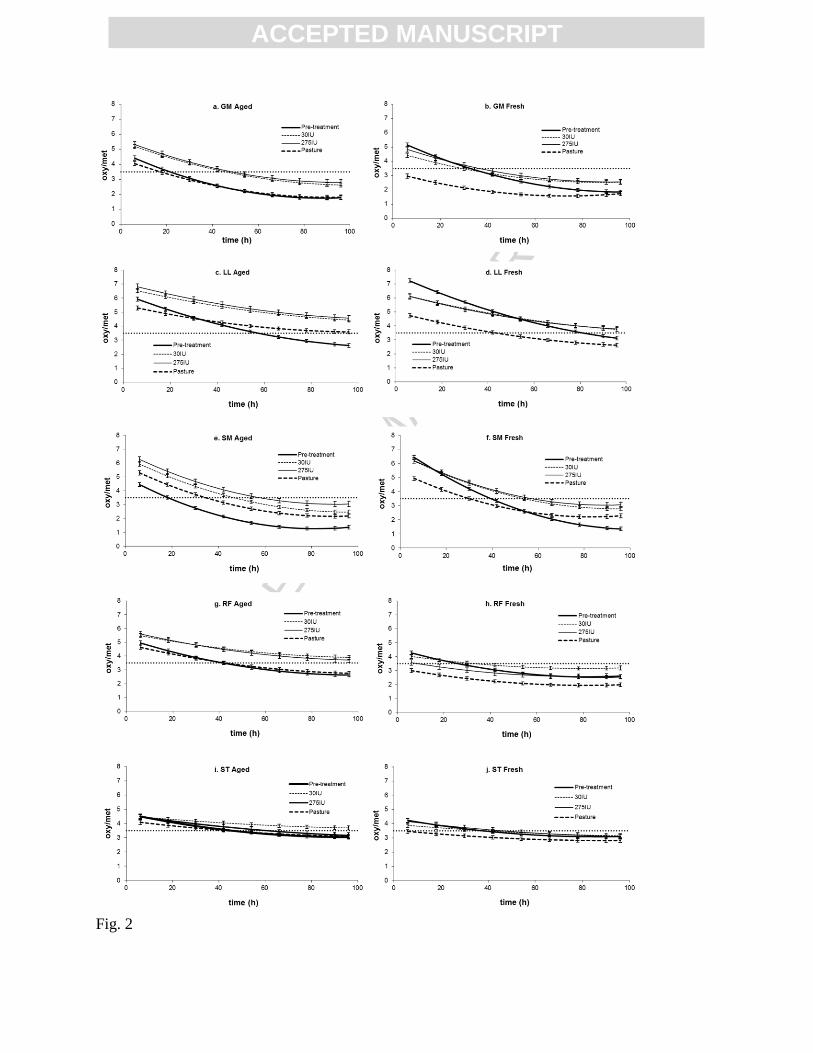
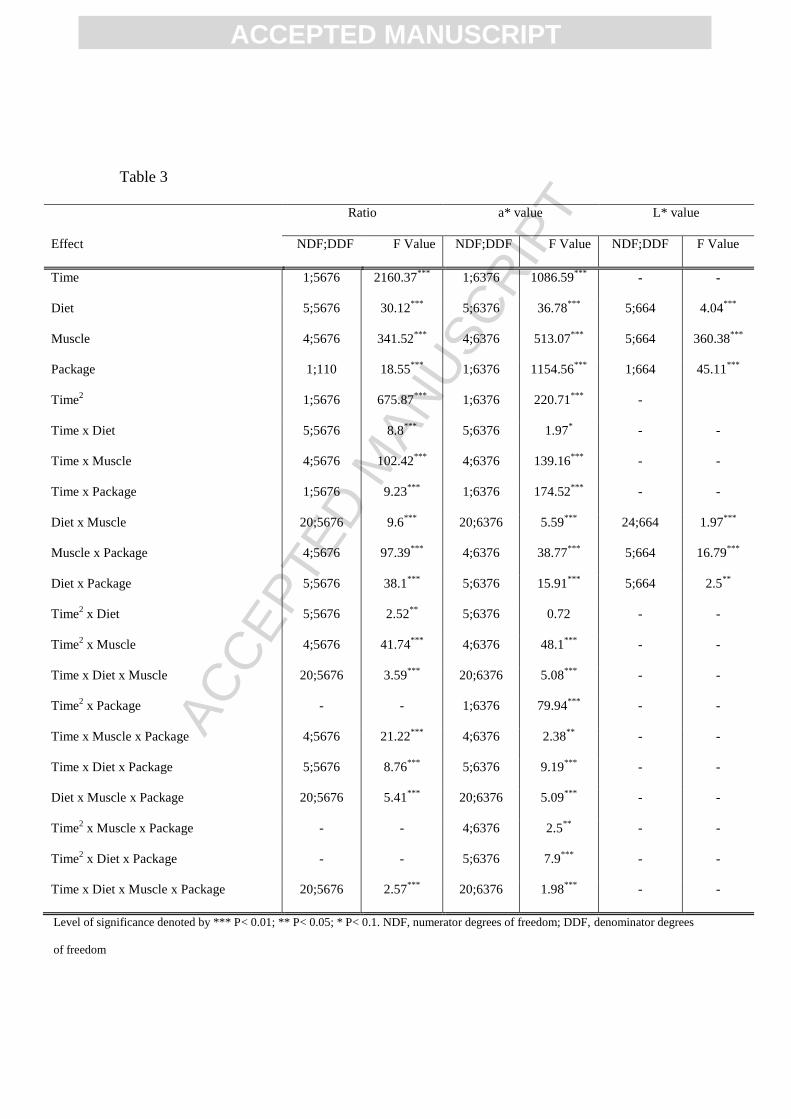
The oxy/metmyoglobin ratio was significantly affected by diet (P<0.01; Table 3). All
animals supplemented with -tocopherol acetate had higher muscle oxy/metmyoglobin ratios
(P<0.05) in the later periods of display when compared to pre-treatment animals (Figure 2). Pre-
treatment animals had relatively poor colour stability, and in some cases (SM Aged; Figure 2e)
cuts from pre-treatment animals reached a ratio of 3.5, 40 hours before cuts from the vitamin E
treated animals. The colour of meat from green pasture animals declined in ratio at a similar rate
to those supplemented with Vitamin E, however due to a lower starting point they reached a ratio
of 3.5 earlier resulting in the shorter shelf life observed (Figure 2). Similar rates were also
observed in the pre-treatment samples but in the aged treatments only, while fresh pre-treatment
samples had a notably more rapid decline in colour (P<0.05).
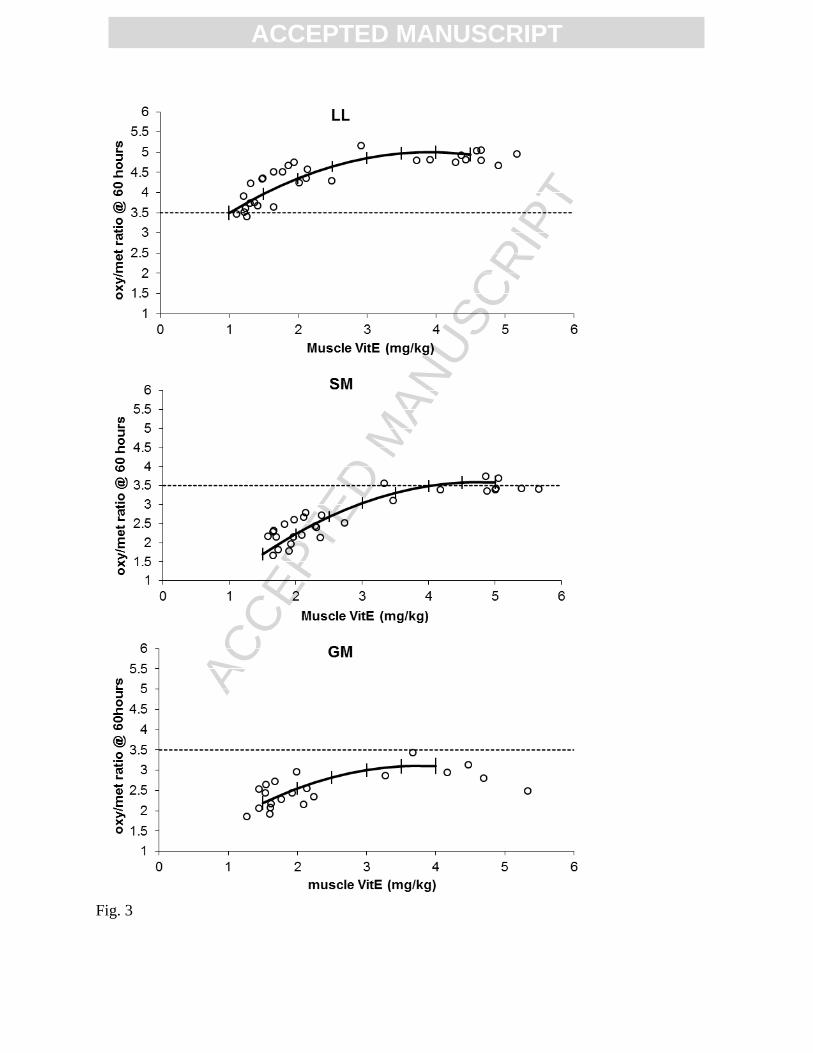
Muscle vitamin E concentration had a positive effect on the oxy/metmyoglobin ratio
however this was only seen in meat packaged/aged in CO2 (Figure 2). Increasing the muscle
vitamin E concentration improved the oxy/metmyoglobin ratio (maintaining an
oxy/metmyoglobin ratio above 3.5 for 60 hours retail display) at all time points and for all
ACC
EPTE
D M
ANU
SCR
IPT
ACCEPTED MANUSCRIPT
muscles except the GM (Figure 3; only LL, SM and GM shown). The GM muscle did not
maintain a ratio of 3.5 at 48 hours for any vitamin E concentration (Figure 3). Furthermore, when
muscle concentrations reached between 3.0 - 3.5mg -tocopherol/kg tissue (4mg/kg in the SM)
no further improvement of colour was observed in any muscle.
When vitamin E levels were deficient (from an animal health perspective), as observed in
the pre-treatment animals, aging resulted in a lower oxy/metmyoglobin ratio over the display
period in the GM, LL and SM muscles (Figure 2), and all muscles reached an oxy/metmyoglobin
ratio of 3.5, 15-20 hours earlier than the fresh product for the pre-treatment group of lambs.
However there was no difference observed in the ST between aging treatments in the pre-
treatment group, and aging extended the shelf life of the RF by approximately 15 hours (Figure
2). Aged cuts supplemented with Vitamin E maintained a higher oxy/metmyoglobin ratio over
the display period when compared to the fresh products of the same dietary treatments (P<0.05;
Table 3), this trend was observed across all muscles except the SM (Figure 2e and f). In the GM
this increase was worth 10 hours retail display, while an estimate in other muscles could not be
made as a ratio of 3.5 was not reached over 96 hours of display.
There was a significant effect of muscle type (P<0.05; Table 3) on the oxy/metmyoglobin
ratio, having a similar trend across all diets. The oxy/metmyoglobin ratio of the SM, LL and GM
declined rapidly (2-3 ratio units) when compared to the RF and ST muscles (1-1.5 ratio units).
Although the ST and RF declined slowly, the initial oxy/metmyoglobin ratio was low and thus
sometimes reached a ratio of 3.5 early in the display period. The LL muscle consistently had the
highest initial oxy/metmyoglobin ratio; this often resulted in LL samples not reaching a ratio of
3.5 over the display period. The effect of vitamin E were most evident in the LL, SM and GM
ACC
EPTE
D M
ANU
SCR
IPT
ACCEPTED MANUSCRIPT
muscles, where pre-treatment samples declined about 1.5 units more over the display period than
the other samples.
Generally freshly cut meat initially resulted in lower L* values (darker) than the aged
product (P<0.05) in all diets except the pre-treatment group (37.39±0.63, 36.96±0.61,
36.61±0.58, 36.44±0.61, 37.66±0.58, 37.35±0.61 compared to the aged values 37.69±0.64,
37.99±0.61, 38.51±0.59, 38.11±0.61, 38.65±0.59, 38.71±0.61 for the 30, 150, 275, 400 IU and
pasture diets respectively). In the LL, SM and GM the aged product became darker while the
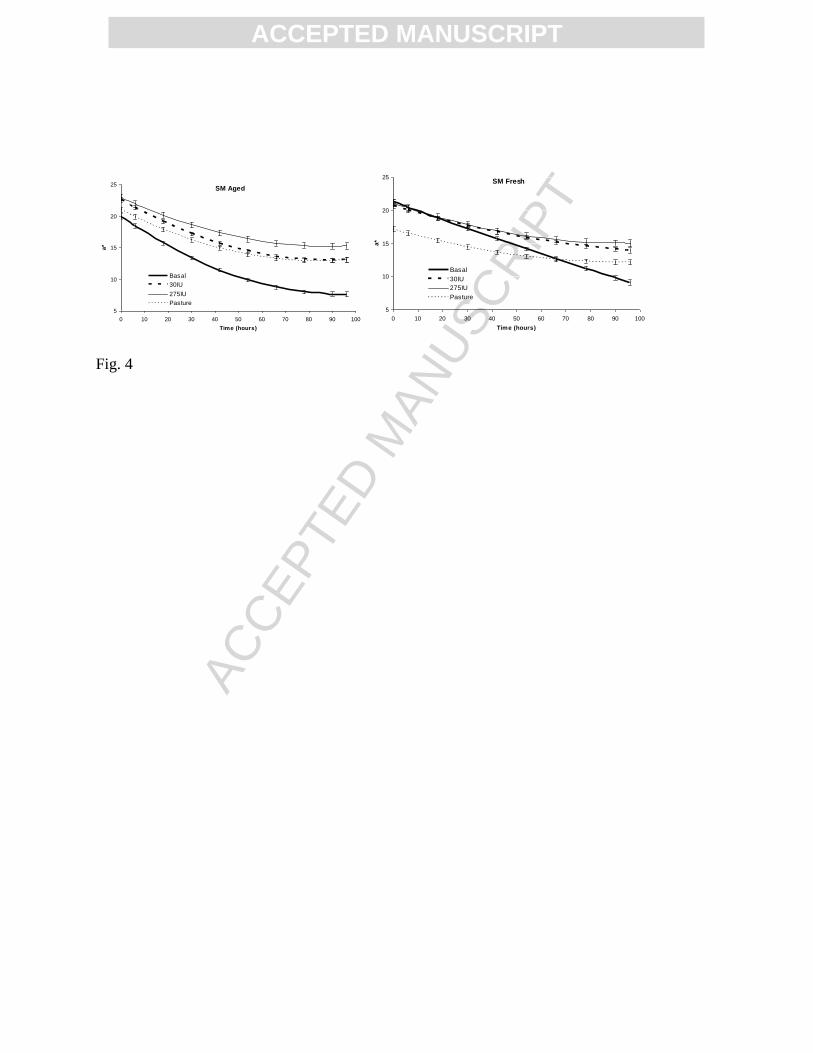
fresh product would become lighter over the display period (P<0.05; data not shown). Pre-
treatment animals showed a more rapid decline in the a* value compared to Vitamin E treated
animals (Figure 4; SM shown only); this effect was amplified when the cuts were aged. Meat
from pasture fed animals had a lower a* value than any other fresh packaged cuts (P<0.05; Table
3). However, aging the product improved the a* value within the pasture animals during early
display hours (P<0.05; Figure 4 SM shown only).
3.4. Ultimate pH and Driploss
Ultimate pH (pHu) was significantly affected by diet and muscle type (P<0.05). Diet only
affected the pHu of the GM and the RF muscles, resulting in a higher pHu in the GM of pre-
treatment animals, while the pre-treatment RF was low when compared to Vitamin E grain fed
animals (Table 1). The ST and the RF had significantly higher pHu when compared to the other
muscles (Table 1).
ACC
EPTE
D M
ANU
SCR
IPT
ACCEPTED MANUSCRIPT
Meat from carcase sides aged in CO2 packs lost half a percentage more moisture over 24
hours (P<0.05; CO2 2.79±0.049; Fresh 2.35±0.071). The RF muscle lost about 0.66 and 0.55 %
less weight over 24 hours than both the LL and SM muscles respectively (P<0.05; RF
2.23±0.081; LL 2.89±0.073; SM 2.78±0.074 ). Meat from carcases fed diets containing Vitamin
E lost at least 1.3 % less moisture than the pre-treatment animals and meat from pasture animals
retained the most weight over 24 hours (P<0.05; Pre-treatment 3.9±0.191; 30IU 2.59±0.095;
150IU 2.49±0.098; 275IU 2.31±0.098; 400IU 2.37±0.093; Pasture 2.16±0.095).
4. Discussion
4.1. Colour Stability
The results supported our hypothesis that a threshold concentration exists for vitamin E in
muscle above which colour stability is not improved any further. This threshold concentration
was 3.5-4.0mg/kg of vitamin E (figure 3), similar to those reported in beef, 3.0-3.3 mg -
tocopherol/kg tissue (Arnold et al., 1993; Faustman et al., 1989), and in the range previously
reported for lamb, 2.26-5.3 -tocopherol/kg tissue (Ponnampalam et al., 2014; Hopkins et al.,
2013; Álvarez et al., 2008; Lopez Bote et al., 2001). By comparison the maximum concentration
expected for muscle is probably 6-10 mg/kg (Wulf et al.1995; Chan, Hakkarainen, Faustman,
Schaefer, Scheller & Liu, 1996) so the threshold level for colour stability occurred at about half
ACC
EPTE
D M
ANU
SCR
IPT
ACCEPTED MANUSCRIPT
the maximum concentration possible. Wulf et al.(1995) reported concentrations of 5.79 mg/kg in
the LL after feeding for 56 days at the rate of 1000IU. Concentrations as high as 10 mg -
tocopherol/kg tissue in beef m. psoas major have been achieved after dietary supplementation
(Chan et al. 1996).
The optimal supplementation level in feed to achieve meat colour stability depends on the
length of the feeding time available to reach the threshold level in muscle. It appears that when
feeding for 8 weeks, about 150IU of vitamin E is required (Table 1). However, a muscle vitamin
E concentration of 3.5-4.0mg/kg can be reached in 1 or 2 weeks when supplementation rates of
400 and 275IU/kg feed are used (figure 1). Supplementing lambs an equivalent of about 440mg
of vitamin E/sheep.day (275IU treatment group) for a period of 3 to 4 weeks will guarantee
muscle vitamin E concentrations of 3.5-4.0mg/kg will be reached. This indicates that with higher
levels of dietary Vitamin E a meat colour stability optimum can be reached over a shorter
duration of supplementation, this being of practical benefit where the labour costs of
supplementary feeding are high.
The greatest effect of increased muscle vitamin E concentrations was observed in the
aged samples and the oxidative type muscles, supporting our second hypothesis. The colour
stabilizing mechanisms of vitamin E seem to have a greater effect under conditions of increased
oxidative stress and have little benefit when oxidation within the cell is at a minimum. The SM
and LL muscles are more oxidative muscle types, thus the effect of vitamin E was more apparent
as shown by a steeper increase in the oxy/metmyoglobin ratio when increasing muscle -
tocopherol concentration. The effect of muscle Vitamin E concentration on the
oxy/metmyoglobin ratio increased between muscles in the same order as expected for myoglobin
ACC
EPTE
D M
ANU
SCR
IPT
ACCEPTED MANUSCRIPT
concentration from low in the ST, to medium in the LL and high in the SM (Gardner, Hopkins,
Greenwood, Cake, Boyce & Pethick, 2007). Muscles can be categorised in to colour stability
ranges by considering how quickly that muscle would reach an unacceptable colour for
consumers (ratio of 3.5)(Morrissey et al., 2008). Using this criterion both the SM and GM were
classed as unstable muscles, the RF and ST muscles were classed intermediate and the LL a
stable muscle (figure 2). However, the categories the muscles are placed in does not necessarily
reflect the effect vitamin E has on the oxidative stability of the respective muscle, as shown in
the LL in which vitamin E has a large effect on the stability, yet it is a very colour stable muscle.
Further investigation is needed to establish a greater understanding of the difference in colour
stabilities between muscles such as the SM and LL. However it must be noted that the location
on the muscle where the sample was taken from may result in different levels of heterogeneous
fibre contents, with greater proportion of “red” fibres differing from greater proportions of
“white” fibres.
As well as muscle type, aging conditions will likely increase the oxidative stress in meat
systems (Wulf et al., 1995). Many researchers have shown that aging of beef causes a faster
deterioration of surface colour once on display (Lanari, Brewer, Yang & Tume, 2002; Liu,
Scheller, Arp, Schaefer & Frigg, 1996; Lynch, Kerry, Buckley, Faustman & Morrissey, 1999).
Additionally, this effect of aging can be slowed by the supplementation of vitamin E (Liu et al.,
1996; Sanders, Morgan, Wulf, Tatum, Williams & Smith, 1997), and as demonstrated in the
current studies the colour stability can be improved in aged samples when threshold levels of
vitamin E have been achieved. Recently Ponnampalam, Butler, Burnett, McDonagh, Jacobs &
Hopkins (2013) found that 4 week aged vacuum packed lamb LL was more colour stable than
ACC
EPTE
D M
ANU
SCR
IPT
ACCEPTED MANUSCRIPT
the unaged/fresh product when muscle vitamin E concentrations were greater than 3.4mg/kg.
Further investigation into different aging periods and vitamin E is required
The relative importance of colour at the commencement of display and the change in the
oxy/metmyoglobin ratio over time during display is an important consideration for describing
colour stability. Pasture fed animals had the same rate of decline (slope) of oxy/metmyoglobin
as the grain fed animals, however the pasture group had a lower initial ratio and therefore were
browner in colour when first cut, thus reaching an unacceptable colour much earlier. This
difference in initial colour, within the same muscle type, is not well understood given that
metmyoglobin formation occurs below the meat surface at the junction of the deoxy and oxy
layers.
Meat from pasture fed lambs was less stable in colour than those fed supplemented grain
diets, even though pasture fed animals had relatively high muscle vitamin E concentrations,
disproving our final hypothesis. This result aligns with work by both Lanari et al. (2002) and
Yang et al. (2002) who found supplemented cattle had a better colour stability than pasture fed
animals. Different muscles may vary in initial colour due to differing pigment concentrations
(myoglobin), associated with variation in fibre type (Gardner et al., 2007). However in this
study, the fibre type of pasture fed lambs is unlikely to have changed significantly compared to
other treatments over such a short feeding period. Additionally the starting a* values, which
correlate with redness and therefore oxymyoglobin (Hunt, 1980), did not differ between diet
groups, further supporting the assertion that myoglobin concentration and fibre type was not the
cause of the lower starting ratio in the pasture fed lambs. Further work is required to elucidate
the mechanism explaining the difference in initial colour of the pasture fed animals.
ACC
EPTE
D M
ANU
SCR
IPT
ACCEPTED MANUSCRIPT
4.2. Meat quality
All supplemented animals had a lower drip loss than that of the pre-treatment animals and
supports previous evidence that Vitamin E lowers drip loss in pork (Monahan et al., 1994).
However, this could also be due to the pre-treatment animals being slightly less mature at the
time of slaughter. Pasture animals had the least drip loss out of all the treatments, possibly due to
a combination of vitamin E and other nutritional factors delivered through green feed, however
no further explanation can be offered and further investigation could be warranted. The RF
muscle retained the highest amount of moisture. This muscle also had a higher ultimate pH
(Table 4) than the other muscles tested, and it has been well established that water holding
capacity is increased with a higher pH (Huff-lonergan & Lonergan, 2005), thus the decreased
drip loss is likely a result of a higher ultimate pH .
5. Conclusions
Retail colour stability of lamb meat can be improved by supplementing grain finished
lambs with sufficient vitamin E. Lamb muscle has a threshold for vitamin E concentration of 3.5-
4.0 mg -tocopherol/kg tissue, above which no added benefit can be expected. This threshold
concentration can be easily reached by supplementing lambs with 275IU -tocopherol
acetate/kg of feed (daily requirement being 440mg-tocopherol acetate/sheep.day) for a period
of 3 to 4 weeks. Because the depletion of vitamin E in the muscle can occur rapidly (Fry et al.,
1993), it is important that the supply of -tocopherol be continual for this period, up until
ACC
EPTE
D M
ANU
SCR
IPT
ACCEPTED MANUSCRIPT
slaughter, for added benefits on colour stability. Meat from lambs supplemented in this way will
reach 60 hours retail display in air without an undesirable level of metmyoglobin accumulating
on the surface of the meat under the display conditions currently tested. Vitamin E can also be
supplied via green pasture although the effect on retail display period may not be as
advantageous.
Acknowledgments
This work was funded by the Australian sheep industry co-operative research centre.
References
Álvarez, I., De la Fuente, J., Díaz, M. T., Lauzurica, S., Pérez, C., & Cañeque, V. (2008).
Estimation of -tocopherol concentration necessary to optimise lamb meat quality
stability during storage in high-oxygen modified atmosphere using broken-line regression
analysis. Animal, 2(09), 1405-1411.
Arnold, R. N., Arp, S. C., Scheller, K. K., Williams, S. N., & Schaefer, D. M. (1993). Tissue
Equilibration and subcellular Distribution of Vitamin E Relative to Myoglobin and Lipid
Oxidation in Displayed Beef. Journal of Animal Science, 71, 105-118.
Bieri, J. G., Pollard, C. J., Prange, I., & Dam, H. (1961). The determination of a-tocopherol in
animal tissue by column chromatography. Acta Chemica Scandinavica, 15783-790.
Bligh, E. G., & Dyer, W. J. (1959). A Rapid Method of Total Lipid Extraction and Purification.
Canadian Journal of Biochemistry and Physiology 37, 911-917.
Chan, W. K. M., Hakkarainen, K., Faustman, C., Schaefer, D. M., Scheller, K. K., & Liu, Q.
(1996). Dietary vitamin E effect on colour stability and sensory assessment of spoilage in
three beef muscles. Meat Science, 42, 387-399.
Faustman, C., Cassens, R. G., Schaefer, D. M., Buege, D. R., Williams, S., & Scheller, K. K.
(1989). Improvement of pigment and lipid stability in holstein steer beef by dietary
supplementation with vitamin E. Journal of Food Science, 54(4), 858-862.
Faustman, C., Chan, W. K. M., Schaefer, D. M., & Havens, A. (1998). Beef Color Update: The
Role for Vitamin E. Journal of Animal Science, 76, 1019-1026.
ACC
EPTE
D M
ANU
SCR
IPT
ACCEPTED MANUSCRIPT
Faustman, C., Sun, Q., Mancini, R., & Suman, S. P. (2010). Myoglobin and lipid oxidation
interactions: Mechanistic bases and control. Meat Science, 86(1), 86-94.
Fry, J. M., Smith, G. M., McGrath, M. C., Speijers, E. J., & Allen, J. G. (1993). Plasma and
tissue concentrations of alpha-tocopherol during vitamin E depletion. British Journal of
Nutrition, 69225-232.
Gardner, G. E., Jacob, R. H., & Pethick, D. W. (2001). The effect of magnesium oxide
supplementation on muscle glycogen metabolism before and after exercise and at
slaughter in sheep. Australian Journal of Agricultural Research, 52723-729.
Gardner, G. E., Hopkins, D. L., Greenwood, P. L., Cake, M. A., Boyce, M. D., & Pethick, D. W.
(2007). Sheep genotype, age and muscle type affect the expression of metabolic enzyme
markers. Australian Journal of Experimental Agriculture, 47, 1180-1189.
Guidera, J., Kerry, J. P., Buckley, D. J., Lynch, P. B., & Morrissey, P. A. (1997). The effect of
dietry vitamin E supplementation on quality of fresh and frozen lamb meat. Meat
Science, 45, 33-43.
Hopkins, D. L., Lamb, T. A., Kerr, M. J., van de Ven, R. J., & Ponnampalam, E. N. (2013).
Examination of the effect of ageing and temperature at rigor on colour stability of lamb
meat. Meat Science, 95(2), 311-316.
Huff-lonergan, E., & Lonergan, S. M. (2005). Mechanisms of water-holding capacity of meat:
the role of postmortem biochemical and structural changes. Meat Science, 71, 194-204.
Hunt, M. C. (1980). Meat Color Measurements. Reciprocal Meat Conference Proceedings, 33
Kasapidou, E., Wood, J. D., Richardson, R. I., Sinclair, L. A., Wilkinson, R. G., & Enser, M.
(2012). Effect of vitamin E supplementation and diet on fatty acid composition and on
meat colour and lipid oxidation of lamb leg steaks displayed in modified atmosphere
packs. Meat Science, 90(4), 908-916.
Khliji, S., van de Ven, R., Lamb, T. A., Lanza, M., & Hopkins, D. L. (2010). Relationship
between consumer ranking of lamb colour and objective measures of colour. Meat
Science, 85(2), 224-229.
Lanari, M. C., Brewer, M. S., Yang, A., & Tume, R. K. (2002). Pasture and grain finishing affect
the colour stability of beef. Journal of Food Science, 67(7), 2467-2473.
Liu, Q., Scheller, K. K., Arp, S. C., Schaefer, D. M., & Frigg, M. (1996). Color coordinates for
assessment of dietary vitamin E effects on beef color stability. Journal of Animal Science,
74(1), 106-116.
Lopez Bote, C. J., Daza, A., Soares, M., & Berges, E. (2001). Dose-response effect of dietry
vitamin E concentration on meat quality characteristics in light-weight lambs. Animal
Science, 73451-457.
Lynch, M. P., Kerry, J. P., Buckley, D. J., Faustman, C., & Morrissey, P. A. (1999). Effect of
dietary vitamin E supplementation on the colour and lipid stability of fresh, frozen and
vacuum-packaged beef. Meat Science, 52(1), 95.
McMurray, C. H., & Blanchflower, W. J. (1979). Application of a high-performance liquid
chromatographic fluorescence method for the rapid determination of -tocopherol in the
plasma of cattle and pigs and its comparison with direct fluorescence and high-
performance liquid chromatography--ultraviolet detection methods. Journal of
Chromatography A, 178(2), 525.
Menzies, P., Langs, L., Boermans, H., Martin, J., & McNally, J. (2004). Myopathy and heptic
lipidosis in weaned lambs due to vitamin E deficiency. Canadian Veterinary Journal, 45,
244-247.
ACC
EPTE
D M
ANU
SCR
IPT
ACCEPTED MANUSCRIPT
Monahan, F. J., Gray, J. I., Asghar, A., Haug, A., Strasburg, G. M., Buckley, D. J., & Morrissey,
P. A. (1994). Influence of diet on lipid oxidation and membrane structure in porcine
muscle microsomes. Journal of Agricultural and Food Chemistry, 42(1), 59-63.
Morrissey, E., Jacob, R. H., & Pluske, J. (2008). Perception of red brown colour by consumers.
In Proceedings International Congress of Meat Science and Technology (Cape Town,
SA.
O'Keefe, M., & Hood, D. E. (1982). Biochemical factors influencing metmyoglobin formation
on beef from muscles of differing colour stability. Meat science, 7, 209-228.
Pearce, K. L., Masters, D. G., Smith, G. M., Jacob, R. H., & Pethick, D. W. (2005). Plasma and
tissue alpha-tocopherol concentrations and meat colour stability in sheep grazing
saltbush(artiplex spp.). Australian Journal of Agricultural Research, 56, 1-10.
Ponnampalam, E., Norng, S., Burnett, V., Dunshea, F., Jacobs, J., & Hopkins, D. (2014). The
Synergism of Biochemical Components Controlling Lipid Oxidation in Lamb Muscle.
Lipids, 49(8), 757-766.
Ponnampalam, E. N., Butler, K. L., Burnett, V. F., McDonagh, M. B., Jacobs, J. L., & Hopkins,
D. L. (2013). Aged Vacuum Packaged Lamb Cuts Are Less Brown than Fresh Muscle
Cuts under Simulated Retail Display. Food and Nutrition Sciences, 4(8A), 147-153.
Sanders, S. K., Morgan, J. B., Wulf, D. M., Tatum, J. D., Williams, S. N., & Smith, G. C. (1997).
Vitamin E supplementation of cattle and shelf-life of beef for the Japanese market.
Journal of Animal Science, 75(10), 2634-2640.
SAS Institute. (2001). Statistical Analysis System (Version 8 ed.). Cary, NC: SAS Institute
Incorporated.
Turner, K. E., McClure, K. E., Weiss, W. P., Borton, R. J., & Foster, J. G. (2002). Alpha-
tocopherol concentrations and case life of lamb muscle as influenced by concentrate or
pasture finishing. Journal of Animal Science, 80, 2513-2521.
Williams, S., Frye, T., Frigg, M., Schaefer, D. M., Scheller, K. K., & Liu, Q. (1992). Vitamin E.
Meat International, 3(2), 853.
Wulf, D. M., Morgan, J. B., Sanders, S. K., Tatum, J. D., Smith, G. C., & Williams, S. (1995).
Effect of dietary supplementation of vitamin E on storage and caselife properties of lamb
retail cuts. Journal of Animal Science, 73, 399-405.
Yang, A., Lanari, M. C., Brewster, M., & Tume, R. K. (2002). Lipid stability and meat colour of
beef from pasture- and grain-fed cattle with or without vitamin E supplement. Meat
Science, 60, 41-50.
ACC
EPTE
D M
ANU
SCR
IPT
ACCEPTED MANUSCRIPT
Figure 1. a) SM, b) ST and c) Plasma Vitamin E concentration (VitE) over the feeding period
for lambs fed different diets as measured by fortnightly biopsy and plasma analysis. The broken
line in a and b represents the “threshold” vitamin E concentration level of 3.5mg/kg, while for c
the line represents a plasma vitamin E concentration level typically used to indicate a risk of
nutritional myopathy. Values are means ± standard error of the mean
Figure 2. The oxy/met ratio of meat from lambs from the pre-treatment group, and lambs fed
pasture, and diets containing 30IU and 275IU of added vitamin E over 96 hours of retail display.
Both aged and fresh m. gluteus medius (GM), m. longissimus lumborum (LL), semimembranosus
(SM), m.rectal femoris (RF) and m. semitendinosus (ST) are presented. The discrimination point
of 3.5 is clearly marked as a horizontal broken line. Values are means ± standard error of the
mean
Figure 3. The effect of muscle vitamin E concentration (VitE) on the Oxy/metmyoglobin ratio at
60 hours in aged m. longissimus lumborum (LL), m. semimembranosus (SM) and m. gluteus
medius (GM). Empty circles present individual data points adjusted by the model. The
discrimination point of 3.5 is marked as a horizontal broken line
Figure 4. a* value of the SM muscle from lambs from the pre-treatment group, and lambs fed
pasture, and diets containing 30IU and 275IU of added vitamin E over 96 hour retail display.
Values are means ± standard error of the mean
ACC
EPTE
D M
ANU
SCR
IPT
ACCEPTED MANUSCRIPT
Fig. 1
ACC
EPTE
D M
ANU
SCR
IPT
ACCEPTED MANUSCRIPT
Fig. 2
ACC
EPTE
D M
ANU
SCR
IPT
ACCEPTED MANUSCRIPT
Fig. 3
ACC
EPTE
D M
ANU
SCR
IPT
ACCEPTED MANUSCRIPT
SM Aged
5
10
15
20
25
0 10 20 30 40 50 60 70 80 90 100
Time (hours)
a*
Basal
30IU
275IU
Pasture
SM Fresh
5
10
15
20
25
0 10 20 30 40 50 60 70 80 90 100
Time (hours)
a*
Basal
30IU
275IU
Pasture
Fig. 4
ACC
EPTE
D M
ANU
SCR
IPT
ACCEPTED MANUSCRIPT
Table 1. Vitamin E concentrations at slaughter, for muscles (mg/kg), liver (mg/kg) and plasma
(µg/ml), and ultimate pH for muscle within lambs maintained on the different dietary treatments.
Values are least square means ± standard error of the mean.
Table 2. Correlations coefficients for vitamin E concentrations between tissue types during the
growing stage for muscle biopsy and plasma concentrations at weeks 0, 2 and 6; and at slaughter
for muscle, plasma and liver concentrations.
Table 3. F values for the statistical model of the oxy/met ratio, a* value and L* value
ACC
EPTE
D M
ANU
SCR
IPT
ACCEPTED MANUSCRIPT
Table 1
GM LD RF SM ST Plasma Liver
Diet Vitamin E concentration
Pre-
treatment 1.64±0.05bz 1.31±0.05cy 1.58±0.05bz 1.86±0.05az 1.36±0.05cz 0.36±0.09z
1.93±1.68
z
30IU 2.02±0.26az 2.12±0.18az 1.87±0.26az 2.38±0.18az 1.93±0.18az 0.85±0.13w
5.61±1.53
z
150IU 4.1±0.24abx 4.04±0.18abx 3.63±0.24bcx 4.35±0.18ax 3.51±0.18cx 1.63±0.13y
13.53±1.5
3y
275IU 4.81±0.24aw 4.79±0.18aw 4.5±0.26abw 5.07±0.18aw 4.12±0.18bw 2.32±0.13x
18.59±1.6
0x
400IU 5.99±0.24ay 5.09±0.17bw 5.58±0.25aby 5.48±0.17abw 4.6±0.17cw 2.49±0.13x
22.56±1.5
3x
Pasture
4.24±0.26abx
w 3.68±0.18bcx 4.35±0.26aw 3.98±0.18abx 3.35±0.18cx 2.25±0.13x
12.49±1.5
3y
Ultimate pH
Pre-
treatment
5.62±0.015b
cw 5.60±0.021cx 5.71±0.026ax 5.57±0.016cx 5.66±0.03abx - -
30IU
5.58±0.015c
xw 5.63±0.02cx 5.78±0.025awzy 5.60±0.016cx 5.72±0.029bx - -
150IU
5.58±0.015b
xw 5.61±0.02bx 5.73±0.025axy 5.56±0.016bx 5.73±0.029ax - -
275IU
5.57±0.015b
x 5.63±0.02bx 5.81±0.026az 5.58±0.016bx 5.74±0.029ax - -
400IU
5.61±0.014b
xw 5.62±0.019bx 5.72±0.024axw 5.60±0.015bx 5.71±0.028ax - -
Pasture
5.59±0.014c
xw 5.64±0.02bx 5.71±0.025ax 5.57±0.016cx 5.71±0.028ax - -
Differences are denoted by letters ‘abc’ between muscle types within diets; and by letter ‘wxyz’ between diets within muscles,
plasma and liver.
ACC
EPTE
D M
ANU
SCR
IPT
ACCEPTED MANUSCRIPT
Table 2
Growth values
Plasma
Muscle Biopsy Week 0 Week 2 Week6
SM week 0 0.361*
week2
0.614
week6
0.369*
ST week 0 0.495
week2
0.545
week6
0.412^
Slaughter values
Liver Plasma SM ST LD
Liver 1 0.592 0.776 0.766 0.789
Plasma 0.592 1 0.575 0.652 0.623
SM 0.776 0.575 1 0.875 0.909
ST 0.766 0.652 0.875 1 0.905
LD 0.789 0.623 0.909 0.905 1
All values less than 1 are significant to a level of P< 0.01, except those marked with ^ P<0.05 and * P>0.05.
ACC
EPTE
D M
ANU
SCR
IPT
ACCEPTED MANUSCRIPT
Table 3
Ratio a* value L* value
Effect NDF;DDF F Value NDF;DDF F Value NDF;DDF F Value
Time 1;5676 2160.37***
1;6376 1086.59***
- -
Diet 5;5676 30.12***
5;6376 36.78***
5;664 4.04***
Muscle 4;5676 341.52***
4;6376 513.07***
5;664 360.38***
Package 1;110 18.55***
1;6376 1154.56***
1;664 45.11***
Time2 1;5676 675.87
*** 1;6376 220.71
*** -
Time x Diet 5;5676 8.8***
5;6376 1.97* - -
Time x Muscle 4;5676 102.42***
4;6376 139.16***
- -
Time x Package 1;5676 9.23***
1;6376 174.52***
- -
Diet x Muscle 20;5676 9.6***
20;6376 5.59***
24;664 1.97***
Muscle x Package 4;5676 97.39***
4;6376 38.77***
5;664 16.79***
Diet x Package 5;5676 38.1***
5;6376 15.91***
5;664 2.5**
Time2 x Diet 5;5676 2.52
** 5;6376 0.72 - -
Time2 x Muscle 4;5676 41.74
*** 4;6376 48.1
*** - -
Time x Diet x Muscle 20;5676 3.59***
20;6376 5.08***
- -
Time2 x Package - - 1;6376 79.94
*** - -
Time x Muscle x Package 4;5676 21.22***
4;6376 2.38**
- -
Time x Diet x Package 5;5676 8.76***
5;6376 9.19***
- -
Diet x Muscle x Package 20;5676 5.41***
20;6376 5.09***
- -
Time2 x Muscle x Package - - 4;6376 2.5
** - -
Time2 x Diet x Package - - 5;6376 7.9
*** - -
Time x Diet x Muscle x Package 20;5676 2.57***
20;6376 1.98***
- -
Level of significance denoted by *** P< 0.01; ** P< 0.05; * P< 0.1. NDF, numerator degrees of freedom; DDF, denominator degrees
of freedom
ACC
EPTE
D M
ANU
SCR
IPT
ACCEPTED MANUSCRIPT
32
Highlights
No 1 Colour stability of lamb meat is improved by nutritional supplementation with vitamin E
No 2 Maximum effect threshold of muscle vitamin E for lamb colour stability was 3.5-4mg/kg
No 3 The threshold level is required to improve the shelf life of lamb meat up to 60 hours
No 4 lamb meat aged for 21 days had improved shelf life when a sufficient muscle vitamin E
concentration was met.
Recommended