Multiphase Flow Physics from Direct
Simulation for Model Development
Shankar Subramaniam
Department of Mechanical Engineering
Iowa State University

Graduate Assistant: Vidyapati
Collaborators: S. Sundaresan and G. Tardos
Funding: DE-FG26-07NT43070 (UCR)
Graduate Assistants: Sudheer Tenneti, M. Mehrabadi
Collaborators: R.O. Fox, S. Sundaresan, and C.M. Hrenya
Funding: DE-FC26-07NT43098 (NETL AR)
Part 1: Gas-phase fluctuations from Direct
Numerical Simulation using PUReIBM
Part 2: New Constitutive Model for Granular
Stress using Discrete Element Simulations

Particles (100 to 500 micron)
can be larger than the
Kolmogorov scale of
turbulence
Large solid particles in a gas:
high Stokes number O(100)
Fixed particle assemblies are
a reasonable approximation
(verified by simulation)
High solid volume fraction:
not dilute
Non-zero mean slip
Regime Characterization
Significantly different from the
well-documented dilute regime
of small “sub-Kolmogorov size”
particles of O(1) Stokes number
in homogeneous, isotropic
turbulence

Flow past fixed particle assemblies
Tenneti, S. Garg, R., Subramaniam, S., “Quantification of gas-phase velocity fluctuations in
statistically homogeneous gas-solid flow using particle-resolved direct numerical simulation”,
(in review)

Steady State TKE
Gas-phase velocity fluctuations show significant increase with
volume fraction: implies transport of RS will be important
Freely evolving suspensions
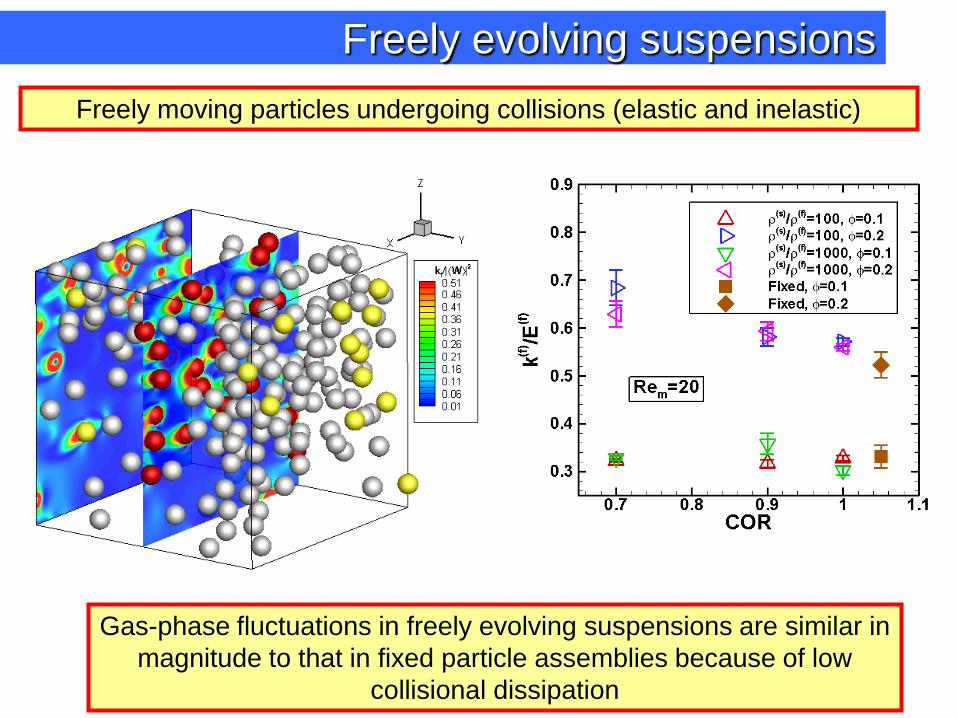
Freely moving particles undergoing collisions (elastic and inelastic)
Gas-phase fluctuations in freely evolving suspensions are similar in
magnitude to that in fixed particle assemblies because of low
collisional dissipation

Anisotropy in gas-phase fluctuations
Decomposing Reynolds
stress into isotropic and
deviatoric part
Velocity fluctuation
components: parallel and
perpendicular to mean flow
Parallel direction Perpendicular plane
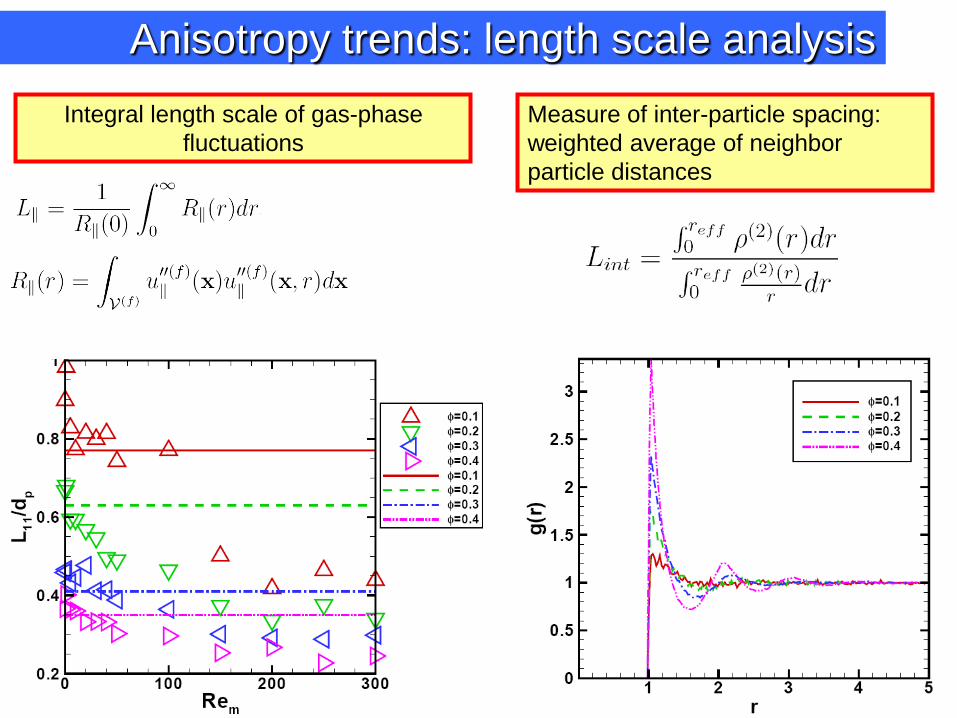
Anisotropy trends: length scale analysis
Integral length scale of gas-phase
fluctuations
Measure of inter-particle spacing:
weighted average of neighbor
particle distances

Multiphase Turbulence Model: Scaling Analysis
Fluid phase TKE equation (homogeneous case)
Interphase TKE
transferDissipation
Scaling of TKE implies a scaling for dissipation: can
verify existing models that use Kolmogorov scaling
Source
Steady state

Multiphase Turbulence Dissipation Models
Kolmogorov
scaling
Taylor
microscale
Dissipation is assumed to take place on a length scale
corresponding to ldiss

Implied Length Scales
Taylor microscale scaling is appropriate for gas-solid
flows with finite sized particles
lT: Taylor microscale
lK: Kolmogorov scale

Summary
1. Presence of finite sized particles with mean slip velocity
generate high level of non-turbulent gas-phase velocity
fluctuations
2. Developed a correlation for kinetic energy for monodisperse
suspensions
3. Strong anisotropy: depends on Re & volume fraction
4. From scaling analysis it is found that Taylor microscale type
scaling for the dissipation of TKE is appropriate for gas-solid
flows with finite sized particles
5. Correlation and the turbulence model extend to bidisperse
suspensions in terms of SMD (not shown)

Graduate Assistant: Vidyapati
Collaborators: S. Sundaresan and G. Tardos
Funding: DE-FG26-07NT43070 (UCR)
Graduate Assistants: Sudheer Tenneti, M. Mehrabadi
Collaborators: R.O. Fox, S. Sundaresan, and C.M. Hrenya
Funding: DE-FC26-07NT43098 (NETL AR)
Part 1: Gas-phase fluctuations from Direct
Numerical Simulation using PUReIBM
Part 2: Constitutive Model for Granular Stress
using Discrete Element Simulations
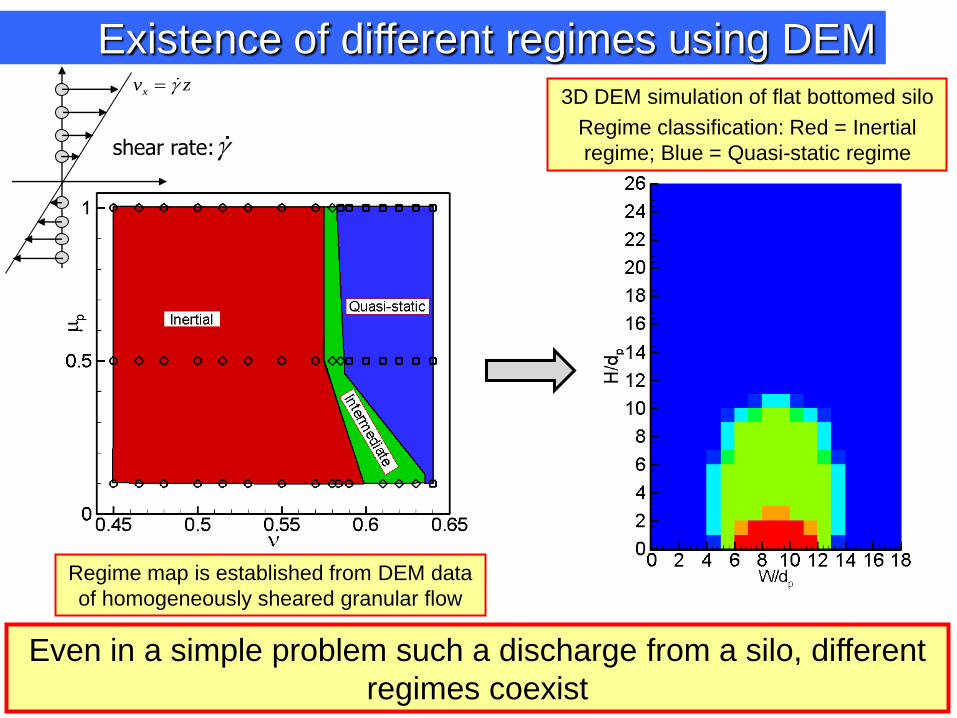
Existence of different regimes using DEM
Even in a simple problem such a discharge from a silo, different
regimes coexist
3D DEM simulation of flat bottomed silo
Regime classification: Red = Inertial
regime; Blue = Quasi-static regime
Regime map is established from DEM data
of homogeneously sheared granular flow
shear rate:
xv z

Challenges for continuum models
Vidyapati and Subramaniam, S.,“Granular flow in Silo discharge: DEM simulations and model assessment”, (in prep)
Error in stress prediction:
Schaeffer model
Spatial extent of different
regimes in a silo
2mod
2
|| ||
|| ||
ij ijel DEM
ij DEM
Error

None of these models captures the correct scaling of shear
stress with shear rate in the intermediate regime
Model assessment in intermediate regime
ROP-KT: ROP model coupled
with kinetic theory of granular
flows (KTGF)
Losert (2000): Model
proposed in Losert et al., PRL,
85(7), 2000
Jop-KT (2006): Isotropic
pressure computed using
kinetic theory
Jop-DEM (2006): Isotropic
pressure specified using data
from DEM simulation
ROP-DEM: ROP model
coupled with DEM for fluidlike
• The different constitutive
models evaluated are,

Granular phase transition: Order Parameter
Different regimes in granular
shear cell (GSC) experiment1
U
UMore fluidlike behavior
Solidlike behavior
More fluidlike behavior
0.60, 0.5p w
Flat frictional wall
DEM Simulations2
1McCarthy et al., Powder Technology, vol. 203, 70-77 (2010)2Vidyapati and Subramaniam, S., “Granular rheology and phase transition: DEM simulations and order-parameter
based constitutive model”, (preprint)
Order Parameter is indeed capable of capturing granular „phase‟ transition from solidlike to fluidlike behavior
OPsZ
Z
Number of solid contacts
Total number of contacts
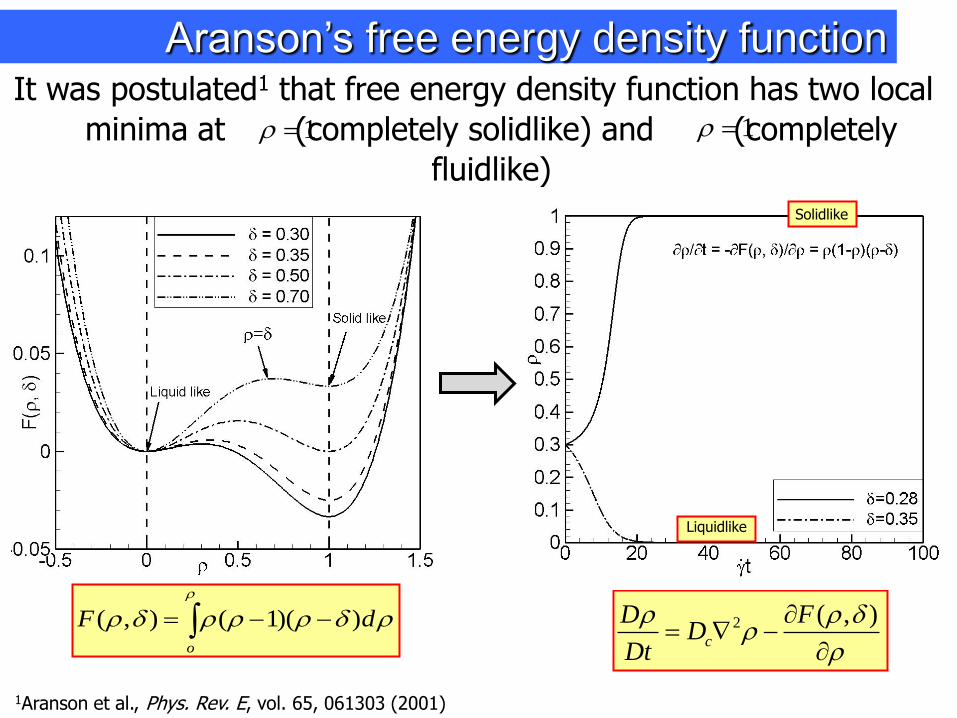
Aranson’s free energy density functionIt was postulated1 that free energy density function has two local
minima at (completely solidlike) and (completely
fluidlike)
1 1
( , ) ( 1)( )o
F d
1Aranson et al., Phys. Rev. E, vol. 65, 061303 (2001)
2 ( , )c
D FD
Dt
SolidlikeSolidlike
Liquidlike
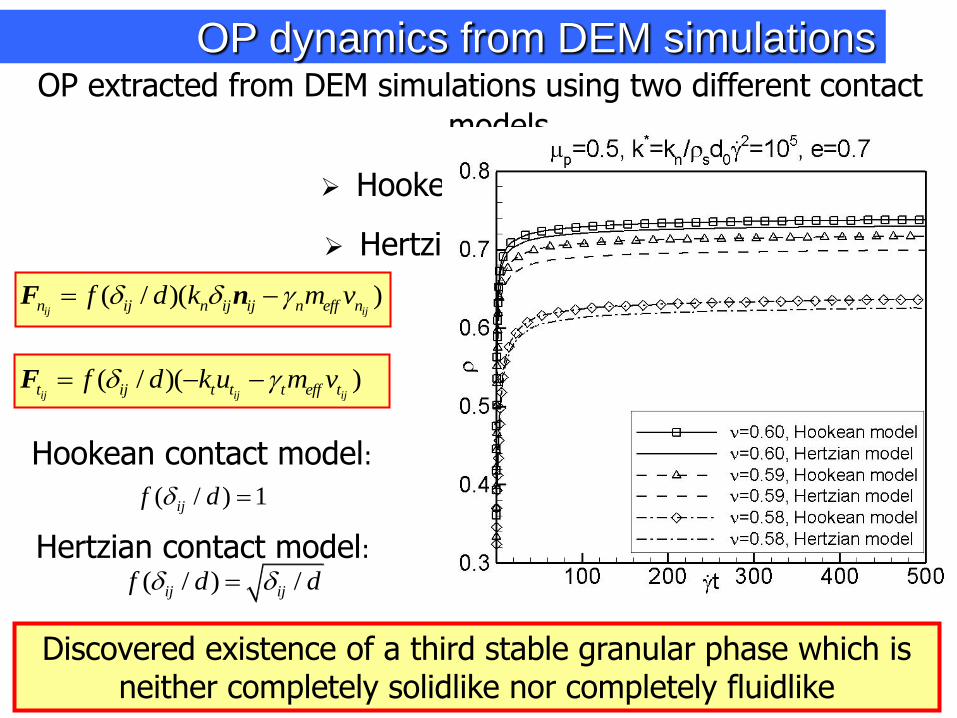
OP dynamics from DEM simulationsOP extracted from DEM simulations using two different contact
models
Hookean contact model
Hertzian contact model
( / )( )ij ijn ij n ij ij n eff nf d k m v F n
( / )( )ij ij ijt ij t t t eff tf d k u m v F
Hookean contact model:
Hertzian contact model:
( / ) 1ijf d
( / ) /ij ijf d d
Discovered existence of a third stable granular phase which is neither completely solidlike nor completely fluidlike

New formulation of free energy density function
* *
3( , ) ( 1)( )( )( )o
F d
third stable phase of granular material 3
0.60
*2 ( , )
c
D FD
Dt

Quantification of third phase
Pair correlation function and internal structure of solidlike
contacts (in Inset) at third stable granular phase
Completely solidlike phase
Completely fluidlike phase
The third stable granular phase is
quantified using structural
quantity such as pair correlation
function

Quantification of third phase
Average coordination number is more sensitive to the phase change as indicated by stable OP values, than the fabric tensor

Stress tensor in granular media
Streaming stress Contact (virial) stress
,
1 1
2
i i i i j i jtot
i i j j i
m v v r fV
DEM reveals that streaming
part of the total stress is
negligible (<3%) in the
intermediate and dense
regimes
Accurate modeling of contact
(virial) stress is critical in the
intermediate regime
streaming stress << contact stress
Developed the Relative
Acceleration model: a
statistical model based on
evolution of the pair-correlation
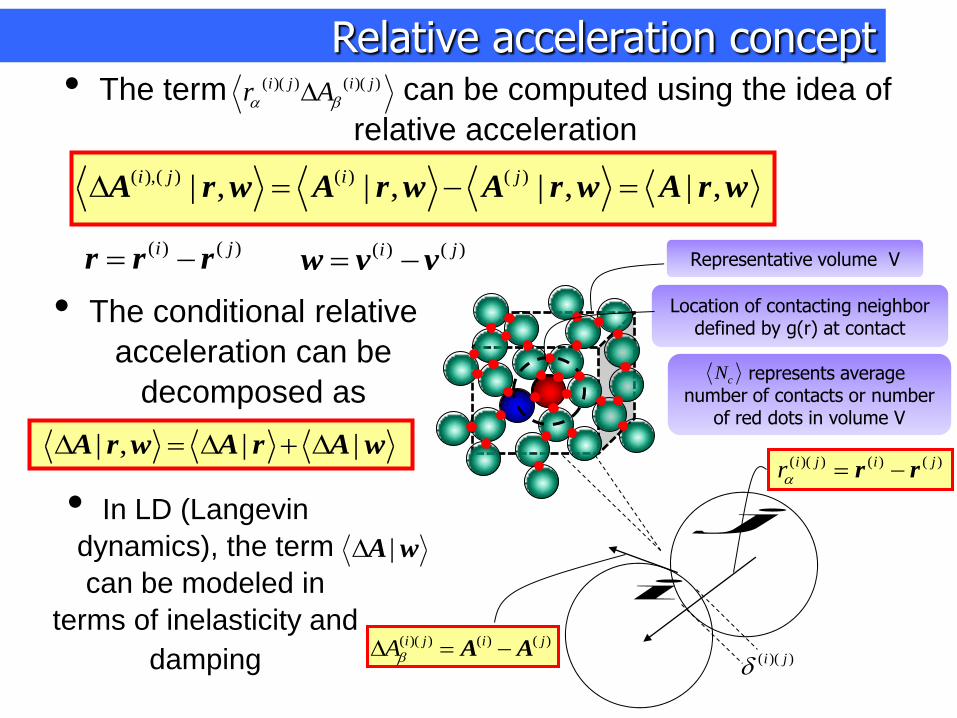
• The term can be computed using the idea of
relative acceleration
Relative acceleration concept( )( ) ( )( )i j i jr A
( ),( ) ( ) ( )| , | , | , | ,i j i j A r w A r w A r w A r w
( ) ( )i j r r r ( ) ( )i j w v v
( )( )i j( )( ) ( ) ( )i j i jA A A
( )( ) ( ) ( )i j i jr r r
Representative volume V
represents average number of contacts or number
of red dots in volume V
i
j
cN
Location of contacting neighbor defined by g(r) at contact
• The conditional relative
acceleration can be
decomposed as
| , | | A r w A r A w
• In LD (Langevin
dynamics), the term
can be modeled in
terms of inelasticity and
damping
|A w

Relative acceleration model
• RA model for normal component of contact stress
0
1
2
cr
i j i j
CN nN N V k R r g dV
r r
for small normal overlaps one can write the contact stress as
( )( )
0
1
2
cr
i j
CN nN N V k R d g dV
r r
Model Inputs:
1. Average coordination number
2. Fabric tensor
3. Pair Correlation (r<rc) or Force PDF

Preliminary model prediction using DEM data
Preliminary results confirm the correct scaling of stress-strain
scaling in intermediate regime
• Model inputs directly taken from data of DEM ( , , , ( ))
i j
CNN R g r
Non dimensional shear rate
Non
dim
en
sio
nal s
tress
Accurate dependencen
Non
dim
en
sio
nal s
tress
Non dimensional shear rate

Conclusion
Particle-resolved Direct Numerical
Simulation for gas-solid flows, and
Discrete Element Simulations for
granular flows, are useful approaches
for understanding multiphase flow
physics and for model development
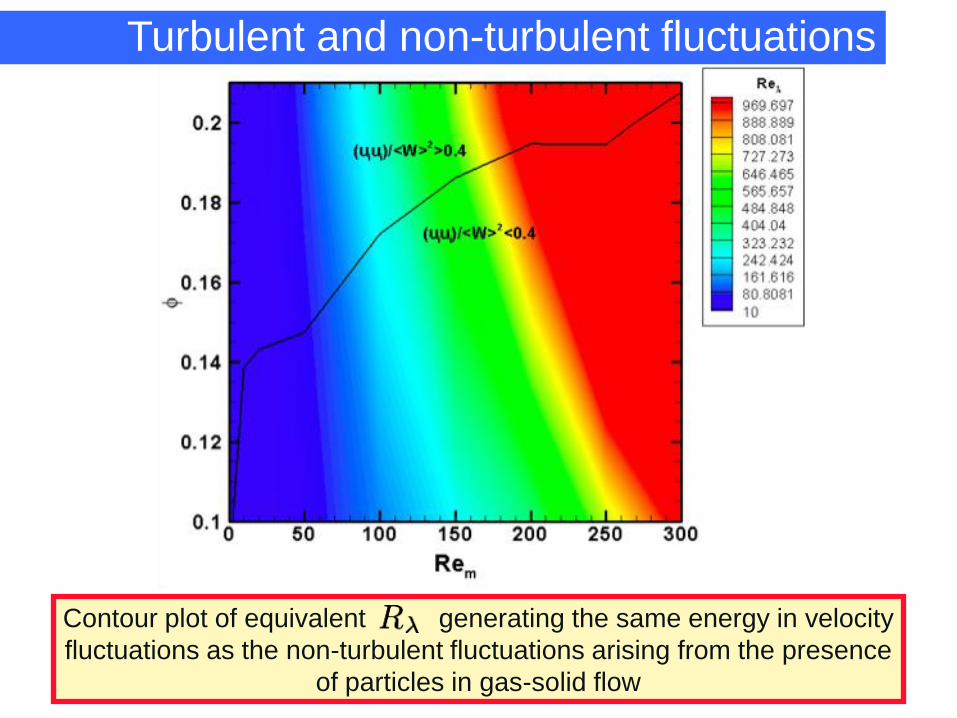
Contour plot of equivalent generating the same energy in velocity
fluctuations as the non-turbulent fluctuations arising from the presence
of particles in gas-solid flow
Turbulent and non-turbulent fluctuations

Convergence of kf at Rem =
20
Squares : Dm = 10
Triangles : Dm = 20
Diamonds : Dm = 30,
Volume fraction: 0.3 Volume fraction: 0.4

Convergence of kf at Rem =
20
Volume fraction: 0.3

Freely evolving suspensions
Freely moving particles with inelastic collisions
Similarity of
k(f) among
fixed and
moving
particles
Small compared to others
Evolution equation the same as fixed beds

Reynolds stress model
Cross correlations are almost zero
Anisotropy is along mean flow direction
The normal correlations in
perpendicular plane are similar
Reynolds stress is axi-symmetric along
the mean flow

Gas-phase Velocity Fluctuations: Bidisperse
Strength of gas-phase velocity fluctuations depend strongly on
only the total solid volume fraction and the Reynolds
number based on Sauter mean diameter
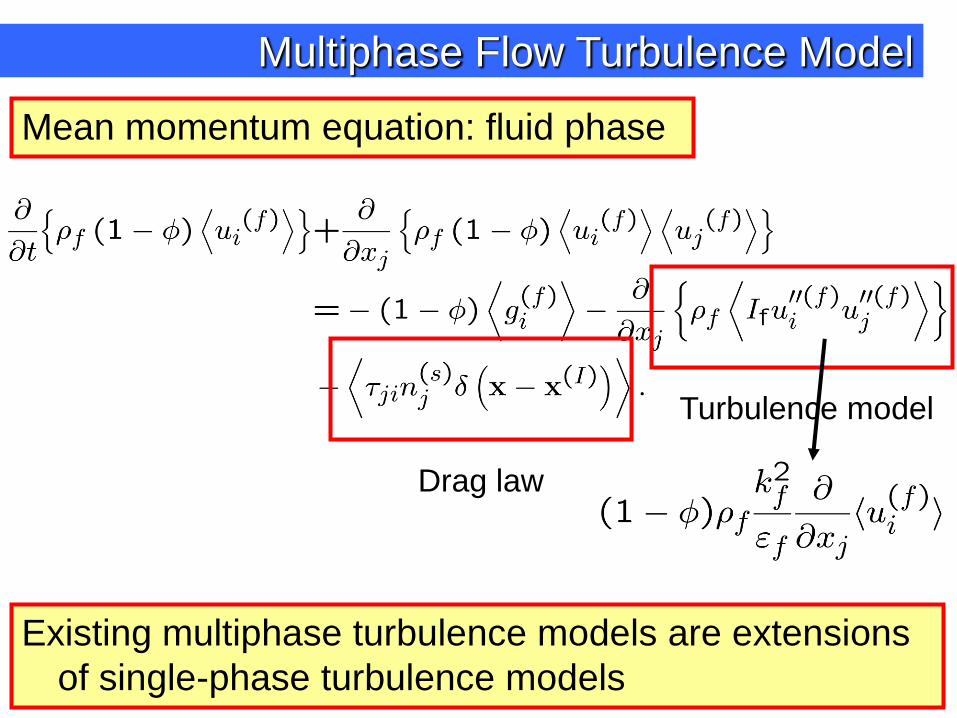
Multiphase Flow Turbulence Model
Mean momentum equation: fluid phase
Drag law
Turbulence model
Existing multiphase turbulence models are extensions
of single-phase turbulence models

Back-Up

Granular phase transition: Order parameter• Characterizes the phase or “state” of the granular material
OP 0 Pure fluid OP 1 Pure solid
1Volfson et al., Phys. Rev. E, vol. 68, 021301 (2003)
• Order parameter is defined by1
OPsZ
Z
Number of solid contacts
Total number of contacts
t t nF F
* 1.1 bct t
eliminates long lasting sliding contacts
excludes short term collisions
Solidlike
contacts1• Solidlike stress
stress from solidlike contacts
• Fluidlike stress stress from fluidlike contacts
+ streaming stress
Total granular stress
Solidlike stress + Fluidlike stress

OP from DEM
* 510k
0.804, b=0.678, A=0.5547, B=6.769, C=0.6847a
A fit for steady values of OP
with solid volume fraction
and friction coefficient is
proposed based on the data
obtained from DEM
simulations
3

*2 ( , )
c
D FD
Dt
* *
3( , ) ( 1)( )( )( )o
F d
0.60 0.62
Assessment of proposed hypothesis
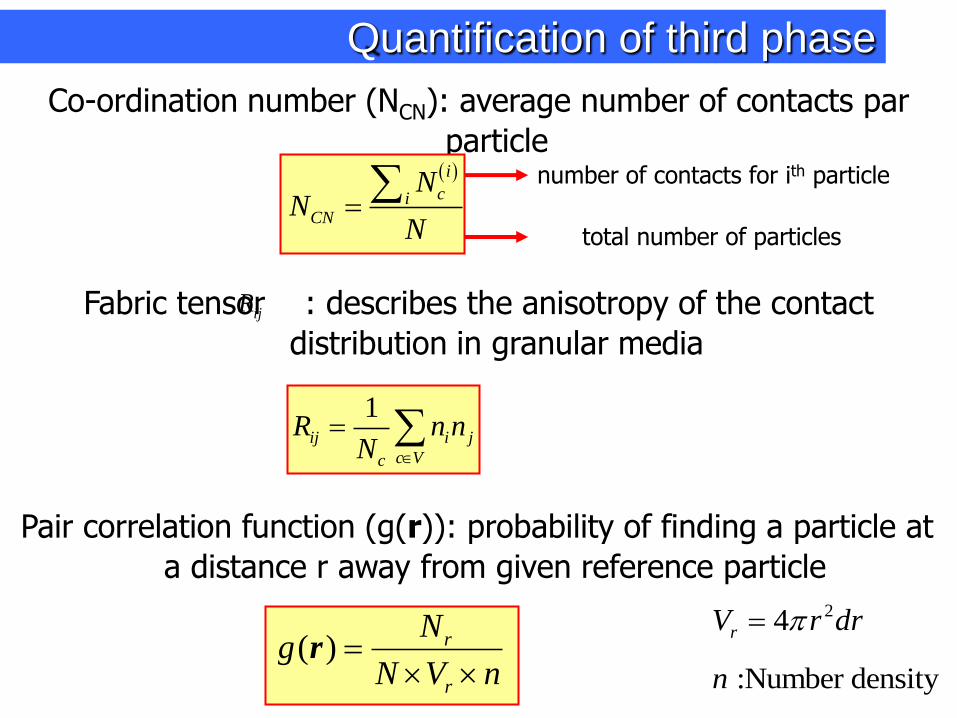
Quantification of third phase
Co-ordination number (NCN): average number of contacts par
particlenumber of contacts for ith particle
total number of particles
ici
CN
NN
N
Fabric tensor : describes the anisotropy of the contact
distribution in granular media ijR
1ij i j
c Vc
R n nN
Pair correlation function (g(r)): probability of finding a particle at
a distance r away from given reference particle
( ) r
r
Ng
N V n
r
24rV r dr
:Number densityn

Regime map
* 3 2 4
0/ 2.5 10n sk k d * 3 2 9
0/ 10n sk k d
Regime classified based on relationship between stress-strain
Inertial regime
2
Intermediate regime
,0 2n n
Quasi-static regime
f
Recommended