
Florida International UniversityFIU Digital Commons
FIU Electronic Theses and Dissertations University Graduate School
3-29-2018
Multimodal Imaging for Enhanced Diagnosis andfor Assessing Progression of Alzheimer’s DiseaseChunfei LiFlorida International University, [email protected]
DOI: 10.25148/etd.FIDC006548Follow this and additional works at: https://digitalcommons.fiu.edu/etd
Part of the Biomedical Commons
This work is brought to you for free and open access by the University Graduate School at FIU Digital Commons. It has been accepted for inclusion inFIU Electronic Theses and Dissertations by an authorized administrator of FIU Digital Commons. For more information, please contact [email protected].
Recommended CitationLi, Chunfei, "Multimodal Imaging for Enhanced Diagnosis and for Assessing Progression of Alzheimer’s Disease" (2018). FIUElectronic Theses and Dissertations. 3703.https://digitalcommons.fiu.edu/etd/3703

FLORIDA INTERNATIONAL UNIVERSITY
Miami, Florida
MULTIMODAL IMAGING FOR ENHANCED DIAGNOSIS AND FOR ASSESSING
PROGRESSION OF ALZHEIMER’S DISEASE
A dissertation submitted in partial fulfillment of
the requirements for the degree of
DOCTOR OF PHILOSOPHY
in
ELECTRICAL ENGINEERING
by
Chunfei Li
2018

ii
To: Dean John L. Volakis choose the name of dean of your college/school College of Engineering and Computing choose the name of your college/school
This dissertation, written by Chunfei Li, and entitled Multimodal Imaging for Enhanced Diagnosis and for Assessing Progression of Alzheimer’s Disease, having been approved in respect to style and intellectual content, is referred to you for judgment.
We have read this dissertation and recommend that it be approved.
_______________________________________ Jean Andrian
_______________________________________
Armando Barreto
_______________________________________ Mercedes Cabrerizo
_______________________________________
Naphtali David Rishe
_______________________________________ Malek Adjouadi, Major Professor
Date of Defense: March 29, 2018
The dissertation of Chunfei Li is approved.
_______________________________________ choose the name of dean of your college/school Dean John L. Volakis
choose the name of your college/school College of Engineering and Computing
_______________________________________ Andrés G. Gil
Vice President for Research and Economic Development and Dean of the University Graduate School
Florida International University, 2018

iii
© Copyright 2018 by Chunfei Li
All rights reserved.

iv
ACKNOWLEDGMENTS
I would like to express my most sincere gratitude to my major advisor, Dr. Malek
Adjouadi for his encouragement, patience and guidance in my research and for his
kindness and consideration throughout the past four years that I have worked with him
with the Center for Advanced Technology and Education-CATE. With his continuous
support and invaluable academic advice, I was able to get over all the difficulties and
finish my PhD studies and realize my goal.
Special thanks go to all the kind persons that helped me throughout the past four years. I
am grateful to Dr. Ranjan Duara from Mount Sinai Medical Center and Dr. David
Loewenstein from the University of Miami for their valuable suggestions in all clinical
and neuropsychological aspects of the Alzheimer’s disease. Many thanks go to my
committee members Dr. Mercedes Cabrerizo, Dr. Armando Barreto, Dr. Jean Andrian,
and Dr. Naphtali David Rishe for their professional support and assistance.
I acknowledge the critical support provided by the National Science Foundation under
grants: CNS-1532061, CNS-1551221, CNS-1642193, CNS-0959985, HRD-0833093, IIP
1338922, and CNS-1429345. The generous support of the Ware Foundation and the FIU
UGS Dissertation Year Fellowship are also appreciated.
I appreciate the support provided by the Florida-based Alzheimer’s Disease Research
Center (ADRC) (1P50AG047266-01A1), R01 AG047649-01A1 (David Loewenstein,
PI), the Florida Department of Health, Ed and Ethel Moore Alzheimer’s Disease
Research Program, and the Wien Center for Alzheimer's Disease & Memory Disorders,
Mount Sinai Medical Center, Miami, FL.

v
ABSTRACT OF THE DISSERTATION
MULTIMODALIMAGING FOR ENHANCED DIAGNOSIS AND FOR ASSESSING
PROGRESSION OF ALZHEIMER’S DISEASE
by
Chunfei Li
Florida International University, 2018
Miami, Florida
Professor Malek Adjouadi, Major Professor
A neuroimaging feature extraction model is designed to extract region-based image
features whose values are predicted by base learners trained on raw neuroimaging
morphological variables. The main objectives are to identify Alzheimer’s disease (AD) in
its earliest manifestations, and be able to predict and gauge progression of the disease
through the stages of mild cognitive impairment (EMCI), late MCI (LMCI) and AD. The
model was evaluated on the ADNI database and showed 75.3% accuracy for the
challenging EMCI diagnosis based on the 10-fold cross validation. Our approach also
performed well for the other binary classifications: EMCI vs. LMCI (72.3%), EMCI vs.
AD (95.0%), LMCI vs. AD (84.3%), CN vs. LMCI (77.5%), and CN vs. AD (96.5%). By
applying the model to the Genome-wide Association Study, along with the sparse Partial
Least Squares regression method, we successfully detected risk genes such as the APOE,
TOMM40, RVRL2 and APOC1 along with the new finding of rs917100.
Moreover, the research aimed to investigate the relationship of different biomarkers;
especially the imaging biomarkers to better understand the precise biologic changes that

vi
characterize Alzheimer’s disease. The unique and independent contribution of APOE4
allele status (E4+\E4-), amyloid (Aβ) load status (Amy+\Amy-) and combined APOE4
and Aβ status on regional cortical thickness (CTh) and cognition were evaluated via a
series of two-way ANCOVAs with post-hoc Tukey HSD tests. Results showed that
decreased CTh is independently associated with Amy+ status in many brain regions, but
with E4+ status in very restricted number of brain regions. Among CN and EMCI
participants, E4+ status is associated with increased CTh, in medial and inferior temporal
regions.
Diverging association patterns of global and regional Aβ load with cortical volume were
found in the entorhinal, temporal pole and parahippocampal regions, which were
positively associated with regional Aβ load, but with a negative correlation for global Aβ
load in MCI stages.
In addition, strong positive correlations were shown between baseline regional CTh and
the difference of CTh in each region between the CN and AD, even after adjusting for the
regional Aβ and APOE genotype (E4+: r = 0.521 and E4-: r = 0.694).

vii
TABLE OF CONTENTS CHAPTER PAGE
INTRODUCTION .............................................................................................................. 1
CHAPTER I
INVESTIGATING THE UTILITY OF FDG-PET AND AV45-PET IN CLASSIFICATION OF ALZHEIMER’S DISEASE AND ITS PRODROMAL STAGES ............................................................................................................................. 7
CHAPTER II
ENHANCED REGION-BASED NEUTOIMAGING FEATURES FOR THE EARLY DETECTION OF ALZHEIMER’S DISEASE ................................................................. 13
CHAPTER III
REGIONAL IMAGE FEATURES MODEL FOR THE GENOME-WIDE ASSOCIATION STUDY OF ALZHEIMER’S DISEASE .............................................. 26
CHAPTER IV THE RELATIONSHIP OF BRAIN AMYLOID LOAD AND APOE STATUS TO REGIONAL CORTICAL THINING AND COGNITION ............................................... 37
CHAPTER V DIVERGING ASSOCIATION PATTERNS OF REGIONAL CORTICAL ATROPHY WITH GLOBAL AND WITH REGIONAL AMYLOID DEPOSITION ........................ 56
CHAPTER VI
PATTERN ANALYSIS OF THE INTERACTION OF REGIONAL AMYLOID, CORTICAL THICKNESS, AND APOE GENOTYPE IN THE PROGRESSION OF ALZHEIMER’S DISEASE .............................................................................................. 81
CHAPTER VII REGIONALSHIP BETWEEN REGIONAL CORTICAL THICKNESS, AMYLOID LOAD AND SELECTIVE VULNERABILITY TO ATROPHY IN ALZHEIMER’S DISEASE .......................................................................................................................... 90

viii
REFERENCES ............................................................................................................... 109
VITA ............................................................................................................................... 125

ix
LIST OF TABLES
TABLE PAGE Table 1. Participant demographic information ................................................................... 8
Table 2. P-values of multiple linear regression models .................................................... 10
Table 3. Accuracy of SVM using 10-fold cross validation (%) ...................................... 11
Table 4. Participants’ demographic information .............................................................. 14
Table 5. Comparison of the classification accuracy (ACC), sensitivity (SEN), and specificity (SPE) (%) values of baseline with proposed feature extraction based model for 6 different pairs of binary classification .................................................... 24
Table 6. Comparison of the classification accuracy (ACC), sensitivity (SEN), and specificity (SPE) values of the proposed model with others for 6 different pairs of binary classification ................................................................................................... 24
Table 7. Participants demographic information for the imaging genetic study ................ 28
Table 8. The 43 Statistical summaries for each region ..................................................... 29
Table 9. Fifteen SNPs Selected by sPLS model ............................................................... 35
Table 10. Participant clinical information ........................................................................ 39
Table 11. Effect of APOE4 status on global amyloid load (SUVR) in different diagnostic groups ....................................................................................................... 41 Table 12. Effect of amyloid status on regional CTh, independent of APOE4 status (left
hemisphere) ................................................................................................................ 43
Table 13. Effect of APOE4 status on regional CTh, independent of Aβ load (left hemisphere) ................................................................................................................ 46
Table 14. Effect of APOE4 status on regional CTh in CN and EMCI, independent of Aβ load ....................................................................................................................... 48
Table 15. Combined effect of APOE4 status and Aβ load status on cognitive scores among CN and EMCI groups ..................................................................................... 49
Table 16. Associations of cortical atrophy and global Aβ load ........................................ 64
Table 17. Associations of cortical atrophy and global Aβ load (corrected p value) ......... 65
Table 18. Associations of cortical atrophy and regional Aβ load ..................................... 67

x
Table 19. Associations of cortical atrophy and global Aβ load (corrected p value) ......... 72
Table 20. Age, gender-matched participants’ demographic information ......................... 91
Table 21. CTh in the CN and AD Groups, % mean differences between CN and AD groups (%CThDiff) and regional Aβ load (rSUVRCN), for E4+ subjects in the left hemisphere ................................................................................................................. 95
Table 22. CTh in the CN and AD Groups, % mean differences between CN and AD groups (%CThDiff) and regional Aβ load (rSUVRCN), for E4- subjects in the left hemisphere ................................................................................................................. 96
Table 23. Associations of rCThCN with %CThDiff before and after separating out the effect of rSUVRCN ...................................................................................................... 98
Table 24. Effects of rCThCN and rSUVRCN on %CThDiff ................................................. 99

xi
LIST OF FIGURES
FIGURE PAGE Fig. 1. The five individual MetaROI used in 18F-FDG. .................................................... 9
Fig. 2. Region-based neuroimang feature extraction model illustration for the left entorhinal ROI in the CN vs. EMCI classification. .................................................... 19
Fig. 3. ROC curves of different imaging biomarkers and the proposed imaging feature of the left entorhinal ROI for the CN vs. EMCI classification. ................................. 23
Fig. 4. The flowchart illustrating the genome-wide association study using proposed ROI-based feature extraction model .......................................................................... 30
Fig. 5. Principal Component Analysis.. ............................................................................ 34
Fig. 6. The accuracy of 50 final SVM(Radial) Models (10-fold cross validation).. ......... 34
Fig. 7. Heat map of the selected 15 SNPs by sPLS using extracted image features as responses. ................................................................................................................... 36
Fig. 8. Differences in mean amyloid load (18F-AV45) SUVR for each diagnostic group between E4- and E4+ participants. ............................................................................. 42
Fig. 9. Barplot of CTh among Amy- and Amy+ participants in 4 diagnostic groups for 12 brain regions. ......................................................................................................... 44
Fig. 10. Barplot of CTh among E4- and E4+ participants in 4 diagnostic groups for 12 brain regions. .............................................................................................................. 47
Fig. 11. Bar graph of scores on following cognitive tests: MMSE, RAVLT (immediate), RAVLT (% forgetting) and ADAS13.. ................................................. 50
Fig. 12. Association patterns of cortical atrophy with global Aβ load (A), and regional Aβ load (B), displayed as heatmap with partial correlation coefficients displayed at p(uncorrected) < 0.05. ............................................................................................ 63
Fig. 13. Linear regression models and performance of volume, regional Aβ load and global Aβ load in right precuneus.. ............................................................................ 69
Fig. 14. Association patterns of cortical atrophy with global amyloid load (A), and regional Aβ load (B), displayed as heatmap with partial correlation coefficients displayed at p(corrected) < 0.05. ................................................................................ 70
Fig. 15. Linear regression models and performance of volume, regional Aβ load and global Aβ load in right parahippocampal ................................................................... 74

xii
Fig. 16. Linear regression models and performance of volume, regional Aβ load and global Aβ load in right entorhinal.. ............................................................................ 75
Fig. 17. Associations between regional and global Aβ load. The fitted curves are from LOESS regression models for all subjects, with smoothing degree equals to 0.4. .... 77
Fig. 18. Complete linkage hierarchical clustering illustration. ......................................... 83
Fig. 19. Heatmap representation of clustering analysis.. .................................................. 86
Fig. 20. Scatterplot, linear regression as well as boxplot of (a) right precentral, (b) left inferior temporal, and (c) right entorhinal. ................................................................. 88
Fig. 21. Plot of rCThCN and %CThDiff with the estimated linear regression model for the E4+ and E4- groups.. ............................................................................................ 97
Fig. 22. Plot of rSUVRCN and %CThDiff with the estimated linear regression model for the E4+ and E4- groups.. .................................................................................... 103
Fig. 23. Plot of rCThCN and %CThDiff with the estimated linear regression model for the global amyloid positive (gSUVR+) and negative (gSUVR-) groups.. ............... 104

1
INTRODUCTION
Alzheimer’s disease is a neurodegenerative disorder characterized by the progressive loss
of neural cells, affecting parts of the brain that control thought, memory, and sometimes
language. In 2011, the National Institute on Aging (NIA) and the Alzheimer’s
Association proposed revised criteria and guidelines for diagnosing Alzheimer’s disease,
and three stages of Alzheimer’s disease were identified: preclinical Alzheimer’s disease,
mild cognitive impairment (MCI) due to Alzheimer’s disease, and dementia due to
Alzheimer’s disease (AD) [1-4]. In the preclinical Alzheimer’s disease stage, individuals
have not yet developed noticeable symptoms such as memory loss, but do have some
noticeable changes in the brain. In the MCI stage, which is subdivided into early MCI
(EMCI) and late MCI (LMCI) by the Alzheimer’s disease Neuroimaging Initiative
(ADNI), people have mild symptoms in thinking abilities but can still perform everyday
tasks. Studies show that about 10–12% of subjects with MCI progress to AD per year [5].
However, MCI does not always lead to dementia. In some individuals, MCI reverts to
normal cognition or remains stable. The AD stage is characterized by quite noticeable
memory, thinking and behavioral symptoms that impair a person’s ability to function in
daily life.
As the population of the United States ages, Alzheimer’s is becoming a more common
cause of death. According to data from the National Center for Health Statistics of the
Centers for Disease Control and Prevention (CDC), between 2000 and 2013, deaths
attributed to Alzheimer’s disease increased 71 percent, while those attributed to other
major causes (breast cancer, prostate cancer, heart disease, stroke, and HIV, etc.) have

2
decreased significantly [6]. In 2013, 84,767 people died from AD, and an estimated
700,000 people in the United States age 65 and older will die with AD based on the
Chicago Health and Aging Project (CHAP) [7]. Due to the aging of the population and
with more people living longer, the number of individuals with Alzheimer’s disease is
projected to double by 2050. Thus, early and reliable detection is believed to be the key
to preventing, slowing and potentially stopping Alzheimer’s disease.
Alzheimer’s disease (AD) is associated with the excessive aggregation of amyloid beta
protein (Aβ) outside neurons and tau protein inside nerve cells. Neuropathological
diagnostic criteria for AD [8] require the deposition of Aβ, which accumulates initially
and most prominently in neocortical regions, such as the precuneus, posterior and anterior
cingulate gyrus, and the orbitofrontal cortex, and tau-associated neurofibrillary tangles [9,
10]. Neurofibrillary tangle pathology in AD, in contrast to Aβ-associated pathology,
follows a stereotypical topographic pattern initially involving the most selectively
vulnerable regions, such as the entorhinal cortex (ERC) and parahippocampal gyrus, and
then progressing to limbic and finally association cortices [11].
According to the amyloid hypothesis [8], deposition of amyloid beta protein (Aβ) in the
neocortex, is the initiating event in the pathophysiology of Alzheimer’s disease (AD) and
occurs 15 to 20 years before the first symptoms of the disease. This leads to downstream
events including neurodegeneration and ultimately cognitive and functional impairment.
Recent neuropathological diagnostic criteria for AD are based upon this hypothesis,
incorporating the Thal phase schema of a stereotypic pattern of Aβ accumulation,

3
anteceding Braak staging of neurofibrillary tangle pathology in the brain, with a
continuous relationship existing between brain Aβ load and neurodegenerative changes
[9].
Another insight into the AD can be gained by exploring its genetic foundation. The
single-nucleotide polymorphism (SNP), which is the most common and stable type of the
DNA sequence variations, has commonly been used to analyze and identify complex
neurological diseases such as AD. So far, the apolipoprotein E (APOE) gene is one of the
prevalent risk factor that has been shown to have a strong connection with AD. More
precisely, among its three variants alleles, APOE e2, APOE e3, and APOE e4 (APOE4),
APOE4 is found to be the one most associated with increased risk for AD [12-17]. Some
other genes such as TOMM40 [18, 19], CLU [20] and PVRL2 [21] are also considered to
be significant risk factors.
There is also considerable evidence that APOE E4 (APOE4) carrier (E4+) status is
associated with greater Aβ load in normal individuals as well as in all stages of AD,
possibly as a result of the effect of APOE4 genotype on impaired clearance of Aβ protein
[22, 23]. Aging and E4+ status are among the most strongly associated factors with
increased risk for AD [22-24]. Recent clinical criteria for the diagnosis of AD dementia
and Prodromal AD (NIA-AA and IWG criteria) rely on combinations of “positive
biomarkers” in the presence of functional and/or cognitive impairment with high,
intermediate or low levels of likelihood [2, 25] based on the presence of Aβ and

4
neurodegenerative biomarkers. The presence of Aβ biomarkers in the absence of
cognitive and functional impairment fulfills criteria for a diagnosis of preclinical AD.
Neuroimaging is an important research platform for understanding the complicated
pathogenesis of Alzheimer’s disease (AD). Deposition of Aβ in vivo is detectable with
positron emission tomography (AV45 PET) scans, using an Aβ binding ligand, or by
measuring Aβ levels in the cerebrospinal fluid (CSF), whereas downstream events such
as neurodegeneration are detectable using volumetric measures of regional atrophy
(especially hippocampal atrophy) and reduced cortical thickness (CTh) on structural
magnetic resonance imaging (MRI) scans, as well as deficits in regional cerebral glucose
metabolism on PET scans (FDG PET). Compared with the MRI, the cost of PET scans is
extremely high; hence not every subject underwent all types of the PET, such as the
AV45 and FDG PET.
In recent years, machine learning and deep learning techniques have been widely
performed in the diagnosis of Alzheimer's Disease (AD), and its prodromal stage, mild
cognitive impairment (MCI), and reached very high diagnostic accuracy. It is believed
that, combinations of different biomarkers could improve the classification performance.
However, this will lead one of the main challenges in the area of imaging-based
diagnosis, which is the extremely high dimensionality of image data (hundreds of
morphological variables or millions of voxels), albeit with a relatively small number of
subjects in AD research (few hundreds). To reduce the feature dimensions, some
researchers proposed features selection pipeline such as pre-selecting brains regions
5
sensitive to AD (e.g. entorhinal cortex, parahippocampal gyrus, and hippocampus), or
ranking features with regrads to their discrimicate significant difference between CN and
AD/MCI [26-31]. Alternatively, others performed feature extraction frameworks to map
the original high dime to the lower new space. Such methods include principle
component analysis (PCA), linear discriminant analysis, and Independent Component
Analysis (ICV) [32-36]. Recently, deep learning techniques are widely used in the AD
classification at the voxel level with the hypothesis that predefined regions could
potentially downgrade the power of the biomarker to detect differences or changes over
time[35, 37-45]. However, only few studies have mentioned the performance on the
diagnosis of EMCI so far [31, 35, 38, 39, 43, 46].
On the other hand, although it is well accepted that Aβ load, APOE4 status and
neurodegeneration are strongly interrelated [47], the presence and strength of the
relationships between these factors and their independent effects on cortical thinning and
cognition are not well understood at different stages of disease. As emerging treatments
are developed, it is increasingly important to understand these independent relationships
prior to developing appropriate disease modifying treatments for AD.
In this dissertation, we aim to early identify Alzheimer’s disease, and predict the
progression in MCI and AD by incorporating imaging and any other biomarkers, results
of cognitive tests and patient’s medical history in the most effective way with the
hypothesis that combinations of different biomarkers could improve the classification
performance. Also, the research aims to investigate the relationship of different

6
biomarkers, especially the imaging biomarkers to better understand the precise biologic
changes that cause Alzheimer’s disease, which helps to developing appropriate disease
modifying treatments for AD.
Specifically, the performance of the AV45 PET and the FDG PET on the diagnosis of the
different stages was first investigated in Chapter 1. And the one with better performance
in the early stage of AD was selected and used in the following studies. In Chapter 2, we
proposed a region-based neuroimaging extraction model to assist the diagnosis of the AD
and its prodromal stage. The proposed feature extraction model was also used in the
Genome-wide Association Study of Alzheimer’s Disease as explained in Chapter 3.
Regarding the relationship of different imaging biomarkers, the association of different
types of imaging biomarkers, APOE4 gene and the cognitive performance were
thoroughly studied Chapter 4; the association patterns of regional cortical atrophy with
global and with regional amyloid deposition in the progression of AD were explored in
Chapter 5 and Chapter 6. Finally, the relationships between the baseline regional cortical
thickness, baseline regional amyloid load and selective vulnerability to atrophy is
examined in Chapter 7.
7
CHAPTER I
INVESTIGATING THE UTILITY OF FDG-PET AND AV45-PET IN
CLASSIFICATION OF ALZHEIMER’S DISEASE AND ITS PRODROMAL
STAGES
1.1. Goal
This study is aimed to explore the independent and interactive effects of the two
commonly used 18F amyloid radiotracers (AV45 and FDG) on discriminating Alzheimer
Disease (AD), early and late mild cognitive impairment (EMCI and LMCI) from
cognitive normal (CN). It’s also aimed to examine the diagnostic power of the two PET
radiotracers based on binary classification and multi-classification methods.
1.2. Materials and Methods
1.2.1. Data
Data used in the preparation of this article were obtained from the ADNI database
(adni.loni.usc.edu). The ADNI was launched in 2003 as a public-private partnership, led
by Principal Investigator Michael W. Weiner, MD. The primary goal of ADNI has been
to test whether serial magnetic resonance imaging (MRI), positron emission tomography
(PET), other biological markers, and clinical and neuropsychological assessment can be
combined to measure the progression of mild cognitive impairment (MCI) and early
Alzheimer’s disease (AD).

8
For this first study, 508 subjects (CN (135), EMCI (208), LMCI (208), or AD (102))
underwent both 18F-AV45 Amyloid PET scan and 18F-FDG PET scan were included in
this study. The Baseline demographic information was shown as shown in Table 1.
Table 1. Participant demographic information
CN EMCI LMCI AD p-valueb
Number of Subjects (n) 135 208 102 63 N/A
Gender (Male/Female) 65/70 112/96 54/48 36/27 0.632
Age (Years) 73.7(6.0)a 70.0(6.9) 71.2(7.8) 75.1(8.0) < 0.0001
Education (Years) 16.4(2.5) 16.0(2.7) 16.5(2.7) 15.9(2.5) 0.291
a Unless otherwise noted, data presented as mean (standard deviation).
b The p values of ANOVA testing between the four groups were shown, and age is found to be a significant factor.
1.2.2. PET Analysis
A detailed description of PET protocols and acquisition procedures can be found in the
following link: http://adni.loni.usc.edu/methods/pet-analysis/pre-processing. Briefly, all
PET images were acquired 30 to 60 minutes post-injection, co-registered, averaged,
reoriented into a standard 160×160×96 voxel image grid, and smoothed to a uniform
isotropic resolution of 8 mm full width of maximum. 18F-FDG: Normalized intensity of
the five pre-defined regions of interest (MetaROIs) – Post Cingulate Gyrus, Left Angular
Gyrus, Right Angular Gyrus, Left Temporal Gyrus and Right Temporal Gyrus - as well
as a composite region made up of all five regions were used as the 6 classification
features. 18F-AV45: Mean standardized uptake value ratios (SUVRs) for four cortical

9
regions (frontal, anterior/posterior cingulate, lateral parietal, and lateral temporal) and
three reference regions (cerebellar grey matter, whole cerebellum, and brainstem/pons)
were used as the additional 7 classification features (Fig. 1).
Fig. 1. The five individual MetaROI used in 18F-FDG.
1.2.3. Investigation of FDG, AV45 and Their Interactive Effect
Two multiple linear regression models – additive and non-additive were performed to
determine the contribution of each radiotracer and identify if there is a significant
interaction between them. The difference of the two models is that the additive model
assumes independence of two biomarkers, while non-additive model considers the
interaction of the two as well. The features used in this step were the average FDG-PET
for 5 MetaROIs and the average AV45 SUVR for the 4 aforementioned ROIs.

10
1.2.4. Classification Experiment
Support vector machine (SVM) classifier with a kernel of Gaussian radial basis function
was applied to FDG and AV45 data separately and combined. The experiment is
designed for both two-classification and multi-classification with 10-fold cross-
validation.
1.3. Results
The results of investigating the interactive effect of the two biomarkers are shown in
Table 2, which shows that in the additive model, both biomarkers are significant.
However, in the non-additive model, FDG, when taken out of the interactive effect with
AV45, is no longer significant. As expected, the interaction of the two biomarkers in the
non-additive model are significant.
Table 2. P-values of multiple linear regression models
PET radiotracers Non- additive model Additive model lm(DX ~ AV45_bl + FDG_bl+ AV45_bl: FDG_bl) lm(DX ~ AV45_bl + FDG_bl)
AV45 < 0.001 < 0.001 FDG 0.105 < 0.001 Interaction < 0.001 N/A
As can be seen from the results given in Table 3, FDG outperforms AV45 in most of the
compared two-classification cases except for CN vs. LMCI and CN vs. EMCI. It may be
deduced that FDG is more capable of capturing patterns of AD, while biomarker AV45
detects patterns of prodromal stage of AD more efficiently. It also shows that combining
both biomarkers doesn’t have a significant increase in accuracy when compared with the

11
results using either of them. In particular, while discriminating AD from CN, FDG
biomarker alone achieved 90.11% accuracy, and this accuracy increased to 92.67% when
using both biomarkers. Multi-classification proved more challenging, and the results
suggest that combining the two biomarkers still achieves a higher performance.
It may be inferred from the results in Tables 2 and 3 that even as FDG displays much
higher discriminative efficiency between AD and CN, however, when taking out the
interaction effect of the two biomarker, FDG may not be able to discriminate EMCI
and/or LMCI from CN anymore, and is somewhat inconsequential in the non-additive
model as shown in Table 2.
Table 3. Accuracy of SVM using 10-fold cross validation (%)
AV45 FDG AV45 and FDG Two-group Classification CN vs. AD 83.59
90.11
92.67
CN vs. LMCI 74.42
71.47
75.44
CN vs. EMCI 65.09
61.17
62.99
EMCI vs. AD 81.16
88.23
87.08
EMCI vs. LMCI 68.06
70.32
70.65
LMCI vs. AD 62.39
73.93
74.45
Multi-group Classification
CN vs. EMCI vs. LMCI vs. AD 45.64
48.06
50.4
1.4. Conclusion
This study, by establishing two multiple linear regression models (additive and non-
additive), confirmed previous findings that the two biomarkers (AV45 and FDG) are
highly correlated with respect to the diagnosis. The results also indicate that AV45

12
outperforms FDG in case of EMCI vs. CN and LMCI vs. CN, while FDG is more
effective than AV45 in separating AD from CN as well as from its prodromal stages -
EMCI and LMCI. When using both the two-group and multi-group classifications,
combining FDG and AV45 slightly improves the classification accuracy.

13
CHAPTER II
ENHANCED REGION-BASED NEUTOIMAGING FEATURES FOR THE
EARLY DETECTION OF ALZHEIMER’S DISEASE
2.1. Goal
In this study, we present a region-based neuroimaging biomarker extraction model based
on shape and functional features from MRI and PET imaging to fuse the information
associated with the disease, i.e. the probability of being EMCI. The extracted biomarkers
along with patients’ demographic information such as age, gender and APOE status are
used as the predictors in the EMCI classification model. The proposed framework was
also evaluated on the other binary classification tasks: CN vs. LMCI, CN vs. AD, EMCI
vs. LMCI, EMCI vs. AD, and LMCI vs. AD.
2.2. Materials and Method
2.2.1. Data
For this second study, 893 subjects who underwent MRI and their first AV45 PET scans
within 6 months and with available APOE gene information were involved in this study.
They were categorized into groups of CN (247), EMCI (295), LMCI (193) and AD (158)
according to ADNI diagnosis criteria, which assessed individual’s Mini-Mental State
Examination (MMSE) score, Clinical Dementia Rating (CDR) score and education
adjusted score on delayed paragraph recall from Wechsler Memory Scale Logical
Memory II. Table 4 provides the demographics of the study subjects.

14
Table 4. Participants’ demographic information
CN EMCI LMCI AD F-valuea P-Value N 247 295 193 158 Female/Male 125/122 131/164 83/110 67/91 3.84 0.280 APOE4 0/1/2 180/61/6 168/109/18 92/75/26 52/74/32 85.2 <0.001 Age (year) 75.3(6.5)b 71.3(7.4) 73.6(8.1) 74.7(7.8) 14.72 <0.001 Education (year) 16.4(2.6) 16(2.7) 16.3(2.7) 15.8(2.7) 2.4 0.067 MMSE 29(1.2) 28.3(1.6) 27.6(1.9) 22.8(2.7) 433.1 <0.001 a F-values are for ANOVA test (continuous attribute: Age, Education, and MMSE) or Chi-square test ( categorical attribute: gender and APOE genotype), significance level is 0.05 by default b Values are represented as mean(standard deviation) for all continuous attributes
2.2.2. Neuroimaging Acquisition
In terms of MRI scans, the MPRAGE files as used in our study had undergone the
following correction steps: (i) Gradwarp: corrected image geometry distortion due to
gradient non-linearity (for MRI obtained by GE and Siemens systems only); (ii) B1
correction: employed the B1 calibration scans to correct the image intensity non-
uniformity (for GE and Siemens systems with receive-only head RF coils only); and (iii)
N3: applied the N3, a histogram peak sharpening algorithm, to 3T MRI (ADNI 1/GO/2)
to reduce intensity non-uniformity due to the wave or the dielectric effect and 1.5T MRI
(ADNI 1) to reduce residual intensity non-uniformity (for Phillips Systems and GE and
Siemens systems). The resulting pre-processed MRIs were labeled with “N3” in ADNI.
Each subject’s first AV45 PET scan was selected along with the structural MRI that was
closest in time to PET acquisition. Details of AV45 PET and MRI imaging acquisition
and pre-processing steps can be found in the aforementioned ADNI website. In brief, the
ADNI had already performed the attenuation correction for all PET scans. And the PET

15
image was then preprocessed following these specific steps: (i) co-registered the
extracted 5 five-minute frames to the first extracted frame from raw PET to lessen the
effects of patient motion; (ii) averaged the co-registered dynamic 6 frames to create a
single 30 min PET image; (iii) reoriented the 30 min PET to a standard 160x160x96
voxel image grid with 1.5 mm cube voxels and normalized the intensity of the PET scan;
and (iv) smoothed the above image with a scanner-specific filter, and obtained our pre-
processed PET scan of a uniform isotropic resolution of 8 mm Full Width at Half
maximum (FWHM), which was identified with “AV45 Coreg, Avg, Std Img and Vox
Siz, Uniform Resolution” in ADNI.
2.2.3. MRI Processing
FreeSurfer pipeline (version 5.3.0) [48] was applied to the MRI scans under
centos4_x86_64 Linux system to produce cortical and subcortical volumetric variables.
The original MRI scan was first mapped to the standard MNI 305 space, yielding the
image referred to as T1.mgz, which was used as the reference image in the following
registration procedure. Based on the T1 image, the corresponding image file termed as
aparc+aseg.mgz provides the FreeSurfer parcellated and segmented cortical and
subcortical regions. CTh, surface area and volume were then calculated as morphological
variables on each of the 34 cortical regions for both hemispheres as well as the volume on
each of the 45 subcortical regions of the whole brain.
Multiple morphological variables were then generated for the labeled regions. Specially,
there are 9 measurements for each cortical regions: surface area, gray matter volume,

16
average thickness, thickness standard deviation, integrated rectified mean curvature,
integrated rectified Gaussian curvature, folding index, intrinsic curvature index, and
white matter volume, and 3 measurements for the subcortical regions: volume, mean
intensity and intensity standard deviation. The estimated total intracranial volume (ICV)
is also provided.
2.2.4. PET processing
In order to quantify the Aβ load from the PET scans, FMRIB Software Library (FSL)
[49] was then used to co-register the PET image to the aforementioned T1 image.
Considering the relatively low resolution of the PET image and to utilize as much
information from PET as possible, the AV45 PET scan, with the skull, were co-registered
linearly (i.e., trilinear interpolation) with 12 degrees of freedom (DOF) onto the T1
image. Such a registration process guaranteed that the AV45 PET image had the same
accurate segmentation and parcellation as in the MRI. Thus, the mean Aβ load of each of
the FreeSurfer defined regions can be calculated, which was used later to calculate the
global Aβ load value.
2.2.5. Global Aβ Load Calculation
The registered AV45 PET with the aparc+aseg image was first inspected to ensure
appropriate calculations of the mean Aβ uptake value (SUV) of all the FreeSurfer-defined
regions (ROIs) as expressed in (2.1).

17
SUVROIk =Vali
i=1
NROIk
∑NROIi
(2.1)
where SUVROIk represents the mean Aβ uptake value of the region ROIk, with NROIk
representing the number of voxels labeled as region ROIk in the aparc+aseg image, and
Vali represents the intensity of voxel i in the PET scan.
The SUV of the whole cerebellum, consisting of 4 subcortical regions (left/right
cerebellum white matter and left/right cerebellum cortex), was then calculated using (2),
accounting for the varying sizes of the subregions. The SUV of the global cortical was
computed in the same way, i.e., volume-weighted mean of all 68 cortical ROIs as
expressed in (2.2).
SUVCB =SUVSR1 ×VSR1 + SUVSR2 ×VSR2 +!+ SUVSRN ×VSRN
VSR1 +VSR2 +!+VSRN (2.2)
where CB represents the combined region of N ROIs (4 and 68 for the cerebellum and
global cortical, respectively, with SUVSRi representing the SUV of ROIi, and VSRi
represents the volume of ROIi.
Finally, each regional, as well as global SUV was normalized by the SUV of the whole
cerebellum to get the regional and global AV45 standardized uptake value ratio (rSUVR
and gSUVR). Such SUVR measure was then used to represent the Aβ load in our
analysis.

18
2.2.6. Feature Extraction Model
To make the extracted image features match the information of the EMCI diagnosis as
much as possible, and to control the number of features at a reasonable level, we
proposed the ROI-based feature extraction model shown in Fig. 2. For each region, one
feature was extracted based on its performance related to the EMCI phenotype, i.e., the
image feature values were predicted by base learners trained on raw neuroimaging
morphological variables and amyloid load.
Specifically, for each ROI, the corresponding image feature was defined as the predictive
probability of being EMCI. The random forest algorithm was considered as the classifier,
i.e. the base learner, using all available morphological variables (9 and 3 for cortical and
subcortical regions, respectively), regional amyloid load (rSUVR) along with the global
information, such as ICV and global amyloid load (gSUVR), as predictors, and the
diagnosis group as output.
Random forest is an ensemble machine learning algorithm for classification and
regression. It is a combination of multiple simple decision trees, and use the mode of the
classes or mean prediction as the output for the classification and regression, respectively
[50].

19
Fig. 2. Region-based neuroimang feature extraction model illustration for left entorhinal ROI in the CN vs. EMCI classification.
2.2.7. Classification Model
The classification model follows the stack ensemble classification model framework.
Here, we used the 10-fold stacking pipeline. Specifically, the 2-level classification
framework consists of the following major steps:
1. Split the training data in 10 sets: train_1, tain_2, …. , and train_10;
2. For each ROI, train the individual base leaner model, i.e. random forest, on
{train_1, taint_2, … train_9}, and create predictions, i.e., the probability of
being EMCI for train_10;
3. Repeat step 2 nine times, i.e., train the same models on {train_1, …, train_i-1,
train_i+1, train_10} and create predictions for train_i, i=2, 3, …10;
4. Rank the ROIs by the accuracy, filter out ones with accuracy less than the 1st
quartile;

20
5. Train the top layer classifier, i.e., SVM (polynomial kernel) model, on the
remaining predictions of the base learner models that has been make on the
training data in step2 and step 3 along with patients’ demographic information;
6. For validation, first train the random forest models on the entire training data per
ROI, and create predictions for the test data;
7. Finally, predict using the SVM (polynomial kernel) with the predictions of the
base learner models that has been make for test data.
To avoid over-fitting of the ensemble model, the out-of-bag predictions for the training
data were used as the predictors in step 5 to train the SVM classifier.
The proposed classification model is evaluated using 10-fold cross-validation.
Specifically, we randomly divided the dataset into 10 parts and repeated the
aforementioned classification framework 10 times. At each time, nine of the 10 subsets
were used as training data in the aforementioned classification framework, while the
remaining one were used as the testing dataset.
Once the predictions of all 10 subset are created, the true positive (TP), true negative
(TN), false positive (FP), false negative (FN) can be counted. In the context of CN vs.
EMCI classification, those terms means the number of subjects correctly diagnosed as
EMCI, the number of subjects correctly diagnosed as CN, the number of CN subjects
misdiagnosed as EMCI, and the number of EMCI subjects who are diagnosed as CN,
respectively. The performance of the proposed classification model are measured by the

21
accuracy (ACC), sensitivity (SEN), and specificity (SPE) which are defined as
(TP+TN)/(TP+TN+FN+FP), TP/(TP+FN), and TN/(FP+TN), respectively. For each
binary classification, the more serious stage are labeled as positive class, for example,
EMCI is the positive class for the CN vs. EMCI classification, while LMCI is the positive
class for the EMCI vs. LMCI classification.
2.3. Results and Discussion
2.3.1. Performance of the proposed and raw imaging features
Fig. 3 illustrates the ROC curves of the regional SUVR normalized by gSUVR, cortical
thickness, regional amyloid load, gray matter volume normalized by ICV, white matter
volume normlalized by ICV, global amyloid load (gSUVR), and the proposed imaging
feature for the left entorhinal. The results show that the proposed imaging feature
outperforms other single imaging biomarkers with the area under the curve (AUC) value
of 73.2, indicating that it dose fuse the complementary information provided by different
types of morphological and functional imaging measurements.
2.3.2. Compare the baseline classification with proposed ensemble classification
model
To validate the proposed feature extraction model, we also run the SVM (Polynomial
kernel) on the original imaging features as the baseline. Features do not show significant
difference between CN and EMCI groups by T test, were filtered out, i.e., only features
with uncorrected p-value less than 0.05 are considered as the predictors in the baseline

22
model. In addition, we tested the independent and combined performance of the MMSE
score by training the classifiers using single MMSE and combination MMSE with other
imaging features, respectively. The accuracy, sensitivity, and specificity of those models
are listed in Table 5. Compared with the baseline model, the proposed method effectively
improved the diagnosis of EMCI from CN (ACC = 72.5% / 69.4 for proposed/baseline),
LMCI (ACC = 72.3% / 71.9%), and AD (ACC = 87.6% / 87.4%). Such patterns were
enhanced when including the MMSE score as additional predictor.
MMSE score is one of the key assess measurements of the diagnosis of AD, patients with
AD normally have MMSE score less than 24, while for the CN subjects, the range is
around 26 to 30. As expected, using MMSE score only, we can diagnosis AD from CN,
EMCI, or LMCI with the accuracy of 96.3%, 90.7%, and 86.8%, respectively. However,
MMSE is insensitive for the early stage of AD, especially for the EMCI stage. The CN
vs. EMCI, CN vs. LMCI, and EMCI vs. LMCI models only have accuracy of 62.5%,
68.6%, and 63.9%, respectively. When combing the MMSE with our proposed features,
the accuracy of CN vs. EMCI and EMCI vs. AD reached 75.3% and 94%, 3% and 6.4%
higher than the models using proposed features only, while accuracy of EMCI vs. LMCI
is decreased to 71.3%.
2.3.3. Comparison with other feature extraction techniques
The obtained results are comparable with or better than previously proposed approaches,
especially for the more challenging classification problems: CN vs. EMCI (72.3% /
75.3% with/without MMSE), EMCI vs. LMCI (72.3% / 71.3%), and LMCI vs. AD

23
(70.7% / 84.3%). For instance, Guerrero et al., Prasad et al., and Tripathi et al. reported
CN vs. EMCI accuracy rates of 65%, 59.2%, and 75.4%, respectively. Prasad et al.,
Shakeri et al., and Tripathi et al. stated EMCI vs. LMCI accuracy values of 63.4%,
63.0%, and 71.0% repectively. Our model also outperforms on the EMCI vs. AD
classification, with the accuary of 87.6% / 94.0%, compared with other models proposed
by Shakeri et al. (81.0%) and Tripathi et al. (86.2%) (Table 6).
Fig. 3. ROC curves of different imaging biomarkers and the proposed imaging feature of the left entorhinal ROI for the CN vs. EMCI classification.

24
Table 5. Comparison of the classification accuracy (ACC), sensitivity (SEN), and specificity (SPE) (%) values of baseline with proposed feature extraction based model for 6 different pairs of binary
classification CN vs. EMCI CN vs. LMCI CN vs. AD ACC SEN SPE ACC SEN SPE ACC SEN SPE baseline 69.4 69.4 69.4 76.6 77.1 76.3 92.6 91.0 93.6 proposed 72.5 73.0 71.9 76.4 79.9 74.6 91.1 88.6 92.7 MMSE 62.5 63.2 61.3 68.6 67.5 69.3 96.3 91.8 99.6 Baseline+MMSE 70.5 70.0 71.2 77.3 77.2 77.3 94.3 95.3 93.8 Propsed+MMSE 75.3 75.2 75.3 77.5 78.3 77.0 96.5 96.2 96.8 EMCI vs. LMCI EMCI vs. AD LMCI vs. AD ACC SEN SPE ACC SEN SPE ACC SEN SPE baseline 71.9 73.0 71.6 87.4 83.9 89.1 74.1 71.3 76.3 proposed 72.3 73.8 71.9 87.6 87.0 87.9 70.7 71.7 70.1 MMSE 63.9 65.5 63.7 90.7 79.3 99.6 85.8 76.7 98.0 Baseline+MMSE 72.7 73.8 72.4 90.7 88.7 91.7 80.6 78.5 82.4 Propsed+MMSE 71.3 71.2 71.3 94.0 92.8 94.7 84.3 84.1 84.5
Table 6. Comparison of the classification accuracy (ACC), sensitivity (SEN), and specificity (SPE) (%) values of the proposed model with others for 6 different pairs of binary classification
CN vs. EMCI CN vs. LMCI CN vs. AD ACC SEN SPE ACC SEN SPE ACC SEN SPE Guerrero et al. (2014) 65 61 69 - - - 86 86 85 Prasad et al. (2014) 59.2 - - 62.8 - - 78.2 - - Shakeri et al. (2016) 56 52 60 59 52 65 84 73 89 Tripathi et al. (2017) 75.4 74.0 76.6 72.6 71.37 74.3 88.7 83.1 91.5 Propsed+MMSE 75.3 75.2 75.3 77.5 78.3 77.0 96.5 96.2 96.8 EMCI vs. LMCI EMCI vs. AD LMCI vs. AD ACC SEN SPE ACC SEN SPE ACC SEN SPE Guerrero et al. (2014) - - - - - - - - - Prasad et al. (2014) 63.4 - - - - - - - - Shakeri et al. (2016) 63 62 66 81 70 82 67 58 73 Tripathi et al. (2017) 71.0 75.6 65.5 86.2 83.2 88.2 76.8 79.8 74.2 Propsed+MMSE 71.3 71.2 71.3 94.0 92.8 94.7 84.3 84.1 84.5
2.4. Conclusion
We have proposed an ensemble framework based on region-based neuroimaging feature
extraction model for the classification of Alzheimer’s Disease. The features were
extracted as the probability of being disease form the base learner trained on all regional
morphological variables provided by FreeSurfer, regional amyloid load, and the global

25
information such as ICV and global amyloid load. Experimental evaluation on the ADNI
dataset demonstrates the effectiveness of our approach especially in classifying CN vs.
EMCI, EMCI vs. LMCI, and EMCI vs. AD, indicating that the proposed features
preserved the sensitivity to change in a single brain region especially at the very early
stage of the disease and might be used as the potential effective imaging biomarker
especially for the EMCI diagnosis and clinical study.

26
CHAPTER III
REGIONAL IMAGE FEATURES MODEL FOR THE GENOME-WIDE
ASSOCIATION STUDY OF ALZHEIMER’S DISEASE
3.1. Goal
Compared to the traditional disease phenotypes (with or without disease), we can obtain
closer association or even better insight by introducing intermediate phenotypes, which
are often continuous values, [51-54]. Recently, brain imaging is commonly considered as
a source of intermediate phenotypes that augment our understanding of the subtle and
complex relationship between genetics and disease phenotypes, which is often termed as
imaging genetics. The imaging genetics takes into consideration the fact that certain
image-based features can serve as promising brain phenotypes for discovering the disease
related genes.
One of the main challenges in the area of imaging genetics is the extremely high
dimensionality of image and genetic data (millions of voxels or SNPs), albeit with a
relatively small number of subjects in AD research (few thousands). To overcome this
challenge, some researchers proposed algorithms that consider only few image features
such as the intensities of selected voxels [55, 56], regional cortical atrophy [18, 57], and
brain activation [58]; or only few SNPs using univariate methods, i.e., performing a
standard statistical test on each pair of a candidate SNP and related imaging features [57-
59]. To control the false positive rate, multiple comparisons adjustment is needed [60].
This may reduce the power of the test and hence overlook the weaker SNPs that jointly

27
create an additive effect. To overcome such shortcomings, multivariate techniques, such
as parse reduced rank regression (sRRR) [56], sparse Partial Least Squares (sPLS) [61]
and Canonical Correlation Analysis (CCA) [62] have been introduced in the more recent
literature. The sPLS performs better compared to others [62]. However, these methods do
not consider the diagnosis information in their model, and thus the detected SNPs may
not be immediately related to AD.
In this study, we propose a regional image feature extraction model for obtaining image
features associated with the disease, and then use sPLS regression model to detect the
SNPs associated with these extracted image features. Thus, instead of modeling a direct
link between genetic variants and disease label, we captured disease information
indirectly.
3.2. Material
3.2.1. Study Participants
For this particular study, given its set objectives, 103 AD patients and 139 normal
controls (CN) form ADNI1 with available whole genome imputed genotypes information
was considered. All individuals underwent a 1.5 Tesla T1-weighted MRI scan with a
cognition assessment at baseline. The demographic characteristics of the participants
were shown in Table 7.

28
Table 7. Participants demographic and clinical information for the imaging genetic study Characteristics CN (139) AD (103) p-valuea Female/Male 62/77 49/54 0.7431 Age 76.2(4.9)b 75.1(7.6) 0.1558 Education 16.2(2.6) 14.8(3.2) 0.0003 MMSE 29.17(1.02) 23.54(1.95) 0.0000 a Significant group differences (T test for continuous and Chi-square test for categorical values, significance level is 0.05 by default) b Values are represented as mean(standard deviation)
3.2.2. Image Processing
Each MRI image was processed sequentially by the FreeSurfer (Version 5.3.0)
(http://freesurfer.net, [63]), Advanced Normalization Tools (ANTs)
(http://picsl.upenn.edu/software/ants/, [64]) and the Mindboggle software
(http://www.mindboggle.info/, [65]). Firstly, the FreeSurfer was used to transform the
original MRI to the standard MNI 305 space, followed by skull-stripping, segmenting,
and delineating cortical and subcortical regions, and to generate thereafter labeled cortical
surfaces, and labeled cortical and neocortical volumes. The ANTs software was then used
to perform the brain volume extraction, segmentation, and registration-based labeling.
Finally, the Mindboggle software package was executed to automatically analyze the
shape of anatomical labels and extract features from outputs of FreeSurfer and ANTs.
Ultimately, 43 measures of each of the 50 neocortical brain regions (ROI) are obtained as
indicated in Table 8. Those 50 ROIs include caudal anterior cingulate, caudal middle
frontal, cuneus, entorhinal, fusiform, inferior parietal, inferior temporal, lateral occipital,
lateral orbitofrontal, lingual, medial orbitofrontal, middle temporal, parahippocampal,

29
paracentral, pars opercularis, pericalcarine, postcentral, precentral, precuneus, superior
frontal, superiorparietal, superior temporal, supramarginal, transverse temporal, and
insula on both left and right hemispheres.
Table 8. The 43 Statistical summaries for each region Measure Type Number of statistical measures Surface Area 1 Thickness 8 - median, MAD, mean, SD, skew, kurtosis, .25a, .75b Travel depth 8 - median, MAD, mean, SD, skew, kurtosis, .25, .75 Geodesic depth 8 - median, MAD, mean, SD, skew, kurtosis, .25, .75 Convexity 8 - median, MAD, mean, SD, skew, kurtosis, .25, .75 Mean curvature 8 - median, MAD, mean, SD, skew, kurtosis, .25, .75 Thickness.thickinthehead 1 Volume 1 a first quartile of the corresponding measure type b third quartile of the corresponding measure type
3.2.3. Genetic Data Processing
The samples were genotyped on the Illumina Human610-Quad BeadChip or the Illumina
HumanOmniExpress BeadChip. Considering the variety of SNP genotyping platforms,
genetic data were imputed to a common reference set. The pre-impute quality control
(QC) threshold and methods applied were as follows: All genome-wide association
studies (GWAS) data are mapped to hg19/b37 positions and flipped to plus strand; the
minor allele frequency (MAF) < 0.05; SNP Call Rate < 0.98; SAMPLE Call Rate < 0.98;
Hardy–Weinberg equilibrium (HWE) < 0.001. Then, QC'd Batch 1 and 2 genotypes were
pre-phased prior to SNP imputation using SHAPEITv2. Furthermore, the SNP imputation
was performed using IMPUTE2. Overall, 12,568,804 SNPs were provided by ADNI.

30
3.3. Method
3.3.1. ROI-based feature extraction
To make the extracted image features match the information of the AD diagnosis as much
as possible, and to control the number of features at a reasonable level, we proposed the
ROI-based feature extraction model shown in Fig. 4. For each region, one feature was
extracted based on its performance related to the AD phenotype, i.e., the image feature
values were predicted by base learners trained on raw neuroimaging morphological
variables (Table 8).
Fig. 4. The flowchart illustrating the genome-wide association study using proposed ROI-based feature extraction model
Specifically, for each ROI, the corresponding image feature was defined as the predictive
probability of being AD. The Support Vector Machine (SVM) with a Radial Kernel
model [66] was considered as the classifier, i.e. the base learner, using all 43

31
measurements as predictors, and the diagnosis group as output. After tuning the
parameters based on the 10-fold cross-validation accuracy performance, we predicted
each subject using the final model, and set the prediction probability of AD as the image
feature of that specific ROI. Overall, 50 image features were extracted and were used as
the brain phenotypes in the following regression model to detect the SNPs of interest.
3.3.2. SNPs Selection
To reduce the dimension of the genetic data, we first eliminated SNPs that do not satisfy
the following QC criteria: MAF≥0.05; an HWE dose not showing significant difference
at level 0.005; and with the SNP call rate ≥0.9. Chi-squared test was then conducted for
each remaining SNP. Only SNPs that show significant difference between CN and AD
group were considered in the following study, i.e. uncorrected p-value < 0.001. After
filtering, 3478 out of the total 12,568,804 SNPs were finally selected. The count of minor
alleles (0, 1, or 2) was used to represent the SNP.
3.3.3. Sparse partial least squares regression
The partial least squares regression (PLS) is based on the latent decomposition and could
handle multicollinearity. It is considered to model the associations between two sets of
variables via a small number of unobserved latent variables (LV), which are linear
combinations of the original variables. Assume there are K hidden components, the PLS
regression model builds successive and orthogonal LV for each set such that at each step
the covariance between the pair of LVs is maximal (3.1).

32
max uk = vk =1cov Xk−1uk,Yk−1vk( ) (3.1)
where k represents the k-th step to get the k-th hidden components. Elements Uk and Vk
define the weight vectors for the linear combinations of the variables of sets Xk−1 and
Yk−1 , respectively. Xk−1 and Yk−1 are the residuals of sets X and Y after their regression on
the k-1 pervious LVs (3.2).
Xk−2 = TPt + Xk−1
Yk−2 = TQt +Yk−1
(3.2)
the T matrix produces the K linear combinations, P and Q are matrices of coefficients,
and Xk−1 and Yk−1 are matrices of residuals. Considering that the LVs of the PLS have
contributions from all the predictors, it is hard to make adequate interpretations in the
presence of a large number of noise variables. Chun and Keles [67] proposed the sparse
partial least squares regression model expressed in (3.3) by imposing additional L1
penalization to (3.1),
min uk =uk = vk =1− cov Xk−1uk,Yk−1vk( )+ λX u 1 + λY v (3.3)
where λX and λY are the L1-penalization parameters for the weight vectors of X and Y,
respectively. In the context of this study, X consists of the 3478 selected SNPs after
filtering, and Y includes the 50 extracted image features. Based on the 10-fold cross-
validated mean-squared prediction error, the optimal model with parameters K = 2 and
λX = λY = 0.9was employed.

33
3.4. Results
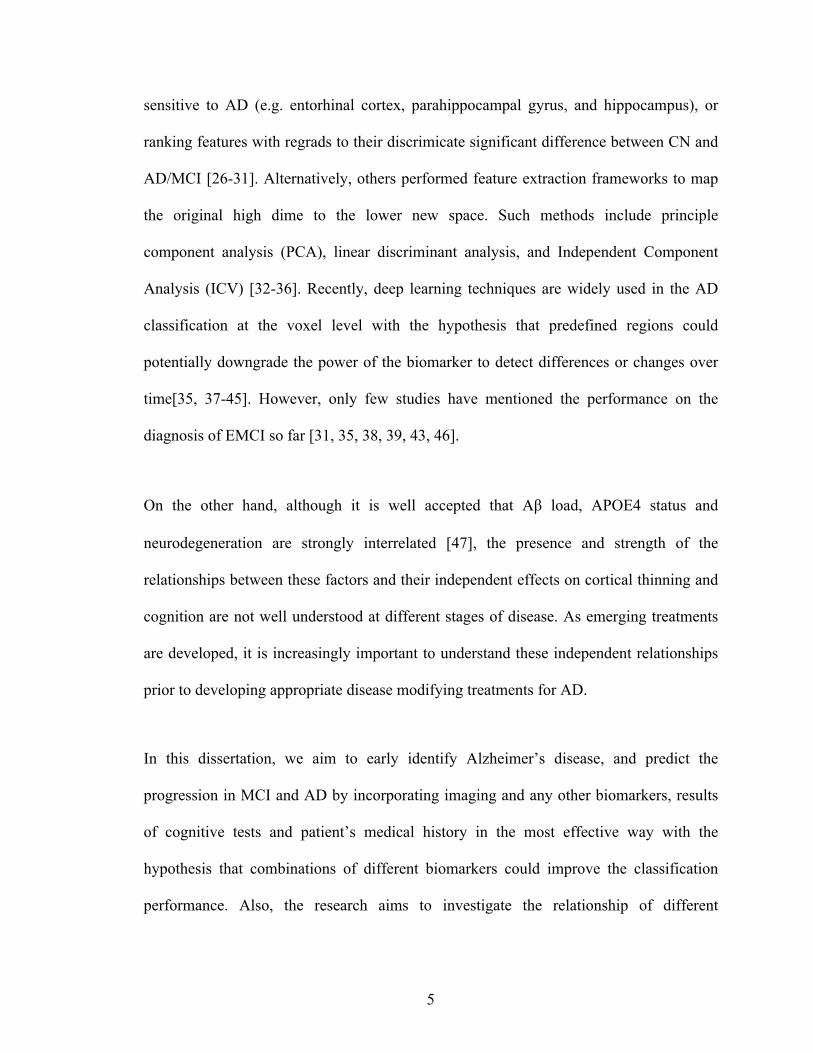
3.4.1. The Feature Extraction Model Evaluation
The principal components analysis (PCA) was performed on the 50 extracted features,
and the first two principal components (PC1 and PC2) separated the CN and AD subjects
clearly, which means that those extracted features do capture the expected disease
information (Fig. 5a). The feature that contributes most to the PC1 is extracted from the
left inferior temporal, and for the PC2, it is from the right precentral. Fig. 5b shows the
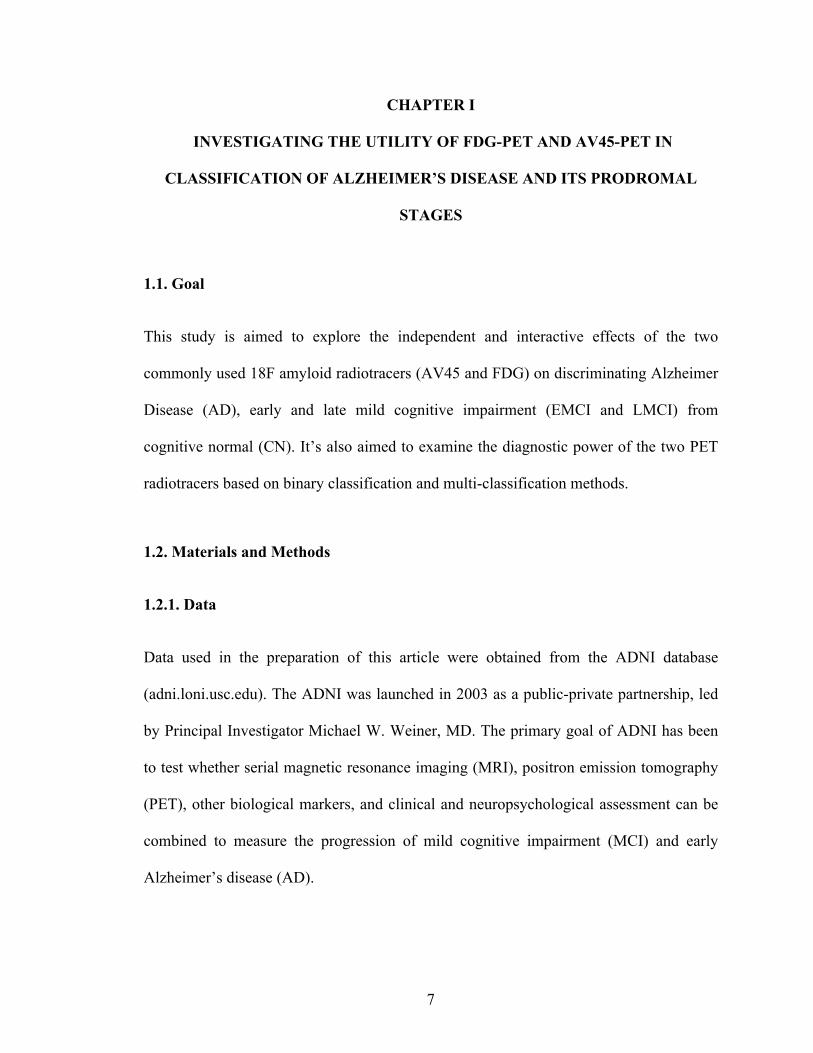
plot of those two features. Fig. 6 shows the accuracy obtained from 50 final SVM
models. The top 5 ROIs entorhinal, fusiform, middle temporal, inferior temporal, and
parahippocampal are all AD vulnerable regions [68], which provides credence to the
method for extracting base learner derived features.
3.4.2. Genetic association results
The sPLS models finally detected 15 significant SNPs (Table 9). 14 SNPs are located on
chromosome 19 and have been reported as correlated with AD [69-71]. Among them,
rs769449 (APOE4), rs429358 (APOE), rs73052335 (APOC1) rs12972970 (PVRL2),
rs6857 (PVRL2), rs2075650 (TOMM40), rs34404554 (TOMM40), rs11556505
(TOMM40) are frequently reported as strongly correlated with AD and all are on
chromosome 19 [18, 19, 21, 55, 72]. The rs917100 located on chromosome 8 was also
detected. The performance of those 15 SNPs in terms of the coefficient estimate of all 50
image-based features was shown in the heatmap given in Fig 7.
34
Fig. 5. Principal Component Analysis. a The PCA map of extracted image features for CN and AD groups. x-axis is the fist principal components (PC1) and y-axis is the second principal components (PC2); b Image features plot. Features extracted from the left inferior temporal and the right precentral contributes most for the PC1 and PC2 respectively.
Fig. 6. The accuracy of 50 final SVM(Radial) Models (10-fold cross validation). One model for each brain region.
Concerning the relationship to ROI-based features, rs12972970 (PVRL2), rs12972156,
rs34342646, rs71352238, rs2075650 (TOMM40), rs34404554 (TOMM40), rs11556505
(TOMM40), and rs142042446 show very similar patterns, those SNPs also contribute
negatively for both the first and second LV in the sPLS regression model (Table 9).
While rs769449 (APOE4), rs429358 (APOE), rs73052335 (APOC1), rs10414043 (APOE

35
(distance=3063), APOC1 (distance=2208)), and rs7256200 (APOE (distance=3285),
APOC1(distance=1986)) have stronger correlation with some AD vulnerable regions,
such as entorhinal, middle temporal and precuneus than the aforementioned SNPs, and
they contribute negatively for the first LV but positively for the second LV. The
rs917100 show similar pattern with APOE and APOC1 genes in the contribution to the
LVs, but has stronger associations with the image features.
Table 9. Fifteen SNPs Selected by sPLS model
SNP Chromosome Position Gene Comp1 Comp2 rs769449 19 45410002 APOE -0.00499 0.00255 rs73052335 19 45420082 APOC1 -0.00495 0.00537 rs10414043 19 45415713 APOE(dist=3063),APOC1(dist=2208) -0.00489 0.00384 rs7256200 19 45415935 APOE(dist=3285),APOC1(dist=1986) -0.00489 0.00384 rs12972156 19 45387459 -0.00481 -0.00286 rs12972970 19 45387596 PVRL2 -0.00481 -0.00286 rs34342646 19 45388130 -0.00481 -0.00286 rs71352238 19 45394336 -0.00481 -0.00286 rs2075650 19 45395619 TOMM40 -0.00481 -0.00286 rs34404554 19 45395909 TOMM40 -0.00481 -0.00286 rs11556505 19 45396144 TOMM40 -0.00481 -0.00286 rs429358 19 45411941 APOE -0.00480 0.00438 rs142042446 19 45386467 -0.00470 -0.00446 rs6857 19 45392254 PVRL2 -0.00468 0.00065 rs917100 8 5591150 -0.00418 0.06374 a The weights for each latent variable in the sPLS model.

36
Fig. 7. Heat map of the selected 15 SNPs by sPLS using extracted image features as responses.
3.5. Conclusion
We proposed and demonstrated an imaging feature extraction model and applied it on the
whole ADNI genetic dataset to identify genetic variants associated with AD. The
associations between imaging and AD were captured using SVM base learner for each
brain region. The AD related genetic variants were then selected via the sPLS regression
model. The proposed model can be widely employed to other GWAS study of
neurological diseases. On the other hand, besides the volume and cortical thickness, the
proposed imaging feature extraction model considers more detailed information of the
brain regions and could be used as additional predictors to enhance the diagnosis model
of AD, and to further explore the performance of brain regions on the progression of AD
as well.
37
CHAPTER IV
THE RELATIONSHIP OF BRAIN AMYLOID LOAD AND APOE STATUS TO
REGIONAL CORTICAL THINING AND COGNITION
4.1. Goal
The relationship between APOE4 positive status (E4+) and higher Aβ load is well
known, as is the relationship of both E4+ status and higher Aβ load to a greater risk for
developing Alzheimer’s disease and a greater degree of neurodegeneration [23, 73-75].
However, the relationship of APOE4 status to neurodegeneration and cognitive decline,
independent of Aβ load, and the relationship of Aβ load to neurodegeneration and
cognitive decline, independent of APOE4 status, are not known and to our knowledge
have not been studied thus far.
In the present study, we examined both the combined and independent associations
between global Aβ load, APOE4 status and regional coritcal thickness (CTh) among four
different diagnostic groups in the ADNI sample, including cognitively normal (CN),
early mild cognitive impairment (EMCI), late mild cognitive impairment (LMCI) or AD
dementia participants. A unique aspect of this investigation was to determine the
independent and combined effects of APOE4 status and Aβ load on regional CTh and
cognition among individuals presenting with minimal (EMCI) or no overt memory
impairment (CN).

38
4.2. Materials and Methods
4.2.1. Data
Data used in the preparation of this article were obtained from the ADNI database
(adni.loni.usc.edu). Evaluations included: (1) Medical and neurological evaluation and
routine labs; (2) Clinical Dementia Rating (CDR) scale, which was used as the index of
functional ability [76]; (3) neuropsychological assessment, including the ADAS Cog 13
(ADAS13) and Mini-Mental State Exam (MMSE) subtests, used as the global index of
cognitive ability [77], and the Rey Auditory Verbal Learning Test (RAVLT) and subtests,
used as the index of memory performance [78]; (4) volumetric MRI; and (5) 18F-AV45
amyloid PET scans. The time gap between MRI and PET scans was less than 3 months.
A blood sample for assessment of APOE genotype was also obtained.
Baseline demographic, clinical and APOE data were compared for 906 subjects,
diagnosed as CN (251), EMCI (297), LMCI (196), or AD (162), as shown in Table 10.
Subjects with one or more APOE4 alleles, i.e. APOE4 carriers, were classified as E4+,
while those with no APOE4 alleles, i.e. APOE4 non-carrier, were classified as E4-.
4.2.2. Image Processing
Image processing pipeline is same as descripted in Chapter II. In this study, regional CTh
in AD signature regions, previously identified by several groups [79, 80] was evaluated.
These include the entorhinal cortex (ERC), parahippocampal gyrus (PHG), inferior
temporal gyrus (ITG), temporal pole (TP), medial orbital frontal gyrus, superior temporal

39
gyrus, rostral middle frontal gyrus, inferior parietal lobule (including angular gyrus),
superior parietal lobule, supramarginal gyrus, precuneus, posterior cingulate gyrus and
the mean CTh based on the aforementioned regions.
In terms of AV45 PET, only global amyloid load was considered. A widely used
threshold value of 1.10 is used here to delineate Aβ positive (Amy+, SUVR > 1.10) and
Aβ negative (Amy-, SUVR <= 1.10) status [81, 82].
Table 10. Participant clinical information
CN (n = 251)
EMCI (n = 297)
LMCI (n = 196)
AD (n = 162) F value
Female/Male 128/123 132/165 85/111 68/94 4.36b E4-/E4+ 184/67 169/128 92/104 54/108 70.32***c Age 75.5(6.5)a 71.5(7.4) 73.8(8.1) 74.9(7.8) 14.85*** EDUCATION 16.4(2.6) 16.0(2.7) 16.3(2.7) 15.8(2.7) 2.71*
Type of Cognitive Test CDRSB 0.05(0.2) 1.31(0.78) 1.76(1.06) 4.84(2.07) 633.12*** ADAS13 9.09(4.54) 12.72(5.51) 17.9(7.5) 31.55(8.81) 434.53*** MMSE 29.04(1.23) 28.32(1.57) 27.61(1.85) 22.77(2.71) 448.73*** RAVLT_immediate 45.35(10.58) 39.47(10.8) 33.21(10.82) 22.31(7.03) 183.76*** RAVLT_learning 5.74(2.44) 5.29(2.45) 3.92(2.58) 1.91(1.77) 102.04*** RAVLT_% forgetting 36.22(27.79) 46.98(29.72) 67.37(31.34) 90.1(19.91) 142.34*** a Values are represented as mean(sd), except gender and APOE gene status, which are frequencies instead b Significant group differences test (ANOVA for continuous and Chi-square test for categorical values, significance level is 0.05 by default) c p<.1; *p<.05; **p< .01; ***p< .001
4.2.3. Statistical Methods
The statistical analysis was performed using R software (R 3.3.0) [83] and the default
significant level was determined as 0.05. To examine the independent effect of Aβ load
on regional CTh, by controlling for the effects of APOE4 status, two-way analysis of

40
covariance (ANCOVA), i.e., 4 (diagnosis: CN, EMCI, LMCI, AD) by 2 (Aβ load status:
Amy+, Amy-) ANCOVA, was conducted per region, with APOE4 status (E4+, E4-)
entered as an categorical covariates.
Similarly, to investigate the individual effects of APOE4 status after controlling for
global Aβ load, a series of 4 (diagnosis: CN, EMCI, LMCI, AD) by 2 (APOE4 status:
E4+, E4-) ANCOVAs were conducted, with global Aβ load (SUVR) as an interval level
covariate. As a complementary analysis, to assess the earliest individual effects of
APOE4 status, a series of 2 (diagnosis: CN, EMCI) by 2 (APOE4 status: E4+, E4-)
ANCOVAs were performed among 548 individuals diagnosed as CN or EMCI.
To examine the earliest combined effects of both APOE4 status and Aβ load status on
regional CTh and on several cognitive variables (MMSE, RAVLT sub scores, and
ADAS13 score), we focused on above-mentioned CN and EMCI participants (n = 548),
and divided them into four groups: E4-/Amy- (n = 241), E4-/Amy+ (n = 112), E4+/Amy-
(n = 73), and E4+/Amy+ (n = 122). A series of one-way ANCOVAs were conducted,
using age as a covariate, and with CTh or cognitive scores as the dependent variables.
Multiple comparison correction was performed in all aforementioned ANCOVA analyses
to control the false discovery rate (FDR). Statistically significant results (FDR-adjusted p
value < 0.05) were further examined using post hoc Tukey HSD test.
41
4.3. Results
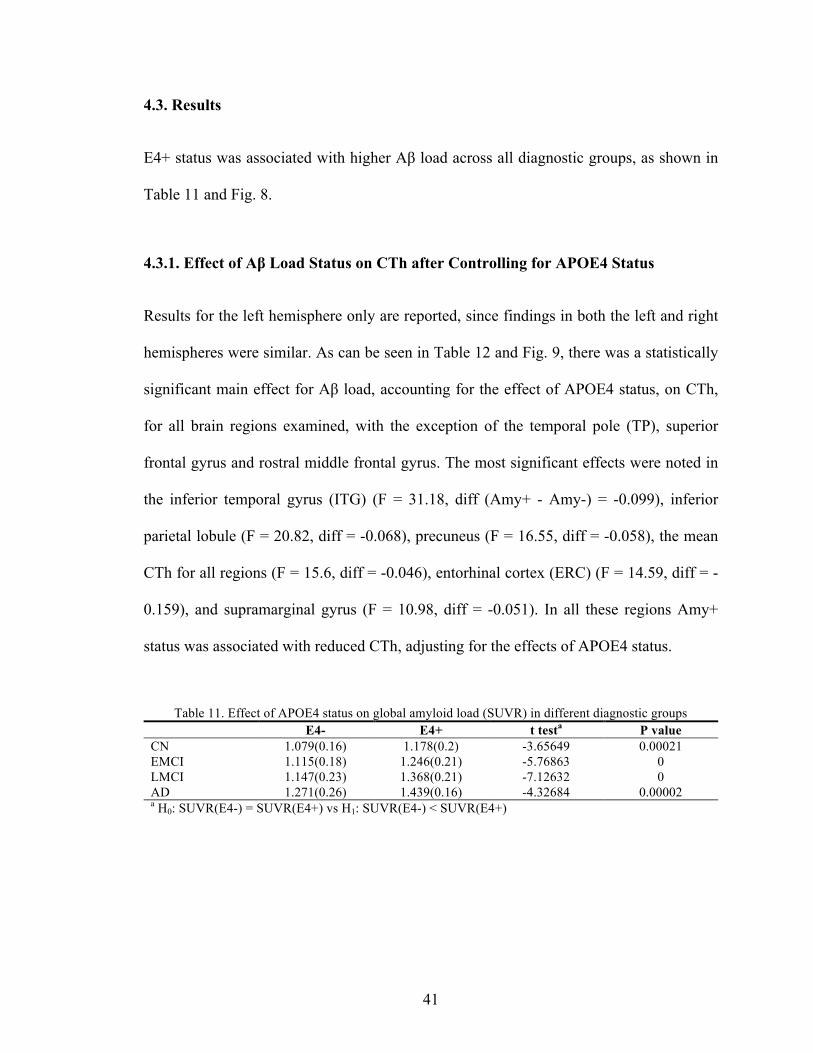
E4+ status was associated with higher Aβ load across all diagnostic groups, as shown in
Table 11 and Fig. 8.
4.3.1. Effect of Aβ Load Status on CTh after Controlling for APOE4 Status
Results for the left hemisphere only are reported, since findings in both the left and right
hemispheres were similar. As can be seen in Table 12 and Fig. 9, there was a statistically
significant main effect for Aβ load, accounting for the effect of APOE4 status, on CTh,
for all brain regions examined, with the exception of the temporal pole (TP), superior
frontal gyrus and rostral middle frontal gyrus. The most significant effects were noted in
the inferior temporal gyrus (ITG) (F = 31.18, diff (Amy+ - Amy-) = -0.099), inferior
parietal lobule (F = 20.82, diff = -0.068), precuneus (F = 16.55, diff = -0.058), the mean
CTh for all regions (F = 15.6, diff = -0.046), entorhinal cortex (ERC) (F = 14.59, diff = -
0.159), and supramarginal gyrus (F = 10.98, diff = -0.051). In all these regions Amy+
status was associated with reduced CTh, adjusting for the effects of APOE4 status.
Table 11. Effect of APOE4 status on global amyloid load (SUVR) in different diagnostic groups E4- E4+ t testa P value
CN 1.079(0.16) 1.178(0.2) -3.65649 0.00021 EMCI 1.115(0.18) 1.246(0.21) -5.76863 0 LMCI 1.147(0.23) 1.368(0.21) -7.12632 0 AD 1.271(0.26) 1.439(0.16) -4.32684 0.00002 a H0: SUVR(E4-) = SUVR(E4+) vs H1: SUVR(E4-) < SUVR(E4+)

42
Fig. 8. Differences in mean amyloid load (18F-AV45) SUVR for each diagnostic group between E4- and E4+ participants. The error bar on the barplot represents the standard error value.
Table 12 also shows a strong main effect for diagnosis. Using post hoc tests (Tukey
HSD), it was found that CTh was reduced among AD participants compared to the three
other diagnostic groups, and also among LMCI participants, as compared to EMCI and
CN participants. This pattern appeared to hold for every brain region included in these
analyses, with the exception of the superior parietal lobule, where EMCI participants had
greater CTh than the other diagnostic groups, which did not statistically differ from each
other. With rare exceptions, CTh was equivalent between CN and EMCI participants. In
the supramarginal gyrus and precuneus, CTh was greater in EMCI than in CN
participants. Statistically significant interaction terms (diagnosis with Aβ load status)
were observed for the ITG and inferior parietal lobule, in which Amy+ status was
associated with reduced CTh only in the LMCI and the AD stages.

43
Table 12. Effect of amyloid status on regional CTh, independent of APOE4 status (left hemisphere) CN
Amy- 165 Amy+ 86
EMCI Amy- 149 Amy+ 148
LMCI Amy- 66
Amy+ 130
AD Amy- 19
Amy+ 143
Fa Amyloid
Fa Diagnosis
post_hoc Tukey
(Diagnosis)
Fa Diagnosis
by Amyloid
Age 74.51(6.8)b 76.75(5.7)
69.19(7.4) 73.46(6.8)
73.68(9.4) 73.61(7.3)
77.49(8.2) 74.38(7.7) 10.64**c 15.79*** EMCI <
All 4.78**
Entorhinal 3.34(0.38) 3.27(0.37)
3.32(0.46) 3.26(0.43)
3.17(0.52) 2.96(0.52)
2.77(0.74) 2.58(0.49) 14.59*** 42.18***
AD < All; LMCI <
EMCI, CN 1.56
Parahippocampal 2.67(0.34)
2.58(0.41) 2.66(0.36) 2.67(0.31)
2.52(0.39) 2.5(0.4)
2.44(0.39) 2.31(0.35) 6.74** 15.6***
AD < EMCI, CN
LMCI < EMCI, CN
1.23
Inferior temporal 2.66(0.16)
2.61(0.16) 2.66(0.18) 2.61(0.19)
2.61(0.18) 2.57(0.23)
2.57(0.26) 2.39(0.24) 31.18*** 13.86***
AD < All; LMCI <
EMCI, CN 3.13*
Temporal pole 3.56(0.33)
3.53(0.36) 3.48(0.37) 3.5(0.34)
3.5(0.35) 3.35(0.45)
3.08(0.63) 3.11(0.51) 2.46 23.19***
AD < All; LMCI <
CN 1.99
Medial orbitofront
al
2.28(0.15) 2.27(0.18)
2.27(0.14) 2.23(0.16)
2.23(0.17) 2.22(0.17)
2.25(0.2) 2.19(0.16) 8.14** 4.57**
AD < CN; LMCI <
CN 1.3
Superior frontal 2.48(0.17)
2.46(0.17) 2.52(0.15) 2.49(0.15)
2.45(0.17) 2.42(0.16)
2.37(0.17) 2.36(0.18) 3.79. 15.17***
AD < All; LMCI < EMCI
0.14
Rostral Middle Frontal
2.15(0.14) 2.15(0.15)
2.18(0.13) 2.15(0.12)
2.14(0.14) 2.11(0.13)
2.09(0.16) 2.07(0.15) 1.87 8.2***
AD < EMCI, CN
LMCI < EMCI
0.64
Superior Parietal
1.96(0.17) 1.96(0.17)
2.01(0.14) 2.01(0.14)
1.97(0.16) 1.94(0.16)
1.95(0.12) 1.86(0.18) 6.08* 10.02*** EMCI >
All 1.69
Inferior Parietal 2.19(0.16)
2.18(0.17) 2.23(0.14) 2.21(0.15)
2.2(0.14) 2.13(0.16)
2.18(0.18) 2.02(0.2) 20.82*** 10.67***
AD < All; LMCI < EMCI
4.78**
Supramarginal 2.31(0.18)
2.31(0.18) 2.37(0.15) 2.34(0.16)
2.3(0.17) 2.26(0.17)
2.26(0.19) 2.16(0.18) 10.98*** 16.51***
AD < All; EMCI >
LMCI, CN 1.71
Precuneus 2.14(0.17) 2.12(0.17)
2.19(0.14) 2.15(0.15)
2.14(0.16) 2.1(0.15)
2.11(0.14) 1.99(0.18) 16.55*** 10.33***
AD < All; EMCI >
LMCI, CN 1.92
Posterior Cingulate
2.38(0.18) 2.4(0.18)
2.41(0.17) 2.39(0.17)
2.4(0.17) 2.37(0.17)
2.39(0.22) 2.31(0.18) 4.25* 1.7 1.66
Mean
CTh_left
2.30(0.13) 2.29(0.14)
2.33(0.11) 2.31(0.12)
2.28(0.13) 2.24(0.13)
2.23(0.15) 2.15(0.14) 15.6*** 20.62***
AD < All; LMCI <
EMCI, CN 1.54
a F value is adjusted for APOE4 Status (4 X 2 ANCOVA test) b Values are represented as mean(SD), upper is for Amy- group and lower is for Amy+ group c p<.1; *p<.05; **p< .01; ***p< .001

44
Fig. 9. Barplot of CTh among Amy- and Amy+ participants in 4 diagnostic groups for 12 brain regions.
4.3.2. Effect of APOE4 Status on CTh after Controlling for Aβ Load
From Table 13, it can be seen that the diagnostic group effect was similar to the pattern
observed in Table 11, i.e., AD patients had less CTh than the other study groups and that
LMCI participants had less CTh than EMCI and CN participants, while CTh was
equivalent between CN and EMCI participants. An inspection of the regional CTh by
APOE4 status in Fig. 10 shows that for most brain regions analyzed, CTh among CN and
EMCI participants is numerically greater among those who are E4+ than E4-. However,
the reverse is generally true among LMCI and particularly AD participants, for whom

45
CTh is generally lower among E4+ than E4- participants. After adjusting for global Aβ
load (SUVR), there was a main effect for APOE4 status only in the ITG (diff(E4+ - E4-)
= 0.048mm, F = 9.99, p = 0.0016) and medial orbitofrontal gyrus (diff = 0.027mm, F =
4.83, p = 0.028), in which it can be observed that CTh was overall greater among E4+
than among E4- participants (Fig. 10). Furthermore, the interaction term in Table 13
shows significant difference only in the ERC, where the CTh is greater only among CN
and EMCI participants who are E4+ as compared to those who are E4-, whereas among
LMCI and AD participants, CTh is greater among E4- as compared to E4+ participants
(Fig. 10).
More importantly, when CN and EMCI subjects were analyzed independently (Table 14),
E4+ status (controlling for Aβ load) was associated with increased CTh in the ERC (diff
= 0.123mm, F = 9.68, p = 0.002), PHG (diff = 0.082mm, F = 6.02, p = 0.014), ITG (diff
= 0.059mm, F = 12.56, p = 0.0004), and TP (diff = 0.091mm, F = 7.47, p = 0.006).

46
Table 13. Effect of APOE4 status on regional CTh, independent of Aβ load (left hemisphere) CN
E4- 184 E4+ 67
EMCI E4- 169 E4+ 128
LMCI E4- 92
E4+ 104
AD E4- 54
E4+ 108
Fa APOE4 Status
Fa Diagnosis
post_hoc_Tukey (Diagnosis)
Fa Diagnosi
s by APOE4
Age 75.77(6.3)b 73.93(7.0)
72.07(7.3) 70.33(7.5)
74.96(8.6) 72.46(7.4)
76.43(8.6) 73.90(7.3) 29.12*** 12.89*** EMCI < All 0.44
Entorhinal 3.30(0.38) 3.35(0.37)
3.22(0.46) 3.37(0.41)
3.11(0.54) 2.96(0.51)
2.69(0.60) 2.55(0.48) 0.02 68.18***
AD < All; LMCI < EMCI,
CN 4.84**
Parahippocampal
2.62(0.38) 2.68(0.34)
2.64(0.32) 2.70(0.34)
2.50(0.39) 2.52(0.39)
2.37(0.38) 2.31(0.34) 1.71 25.56***
AD < All; LMCI < EMCI,
CN 1.08
Inferior temporal
2.63(0.15) 2.68(0.17)
2.62(0.19) 2.65(0.19)
2.57(0.21) 2.59(0.22)
2.42(0.27) 2.41(0.24) 9.99** 32.41*** AD < All;
LMCI < CN 0.5
Temporal pole
3.53(0.35) 3.60(0.32)
3.45(0.37) 3.53(0.34)
3.42(0.40) 3.38(0.44)
3.11(0.53) 3.10(0.52) 1.55 32.87*** AD < All;
LMCI < CN 1.1
Medial orbitofrontal
2.27(0.15) 2.28(0.18)
2.25(0.15) 2.25(0.15)
2.22(0.16) 2.22(0.18)
2.17(0.18) 2.21(0.15) 4.83* 4.78** AD < EMCI,
CN 0.53
Superior frontal
2.46(0.18) 2.50(0.16)
2.51(0.14) 2.50(0.16)
2.44(0.17) 2.42(0.16)
2.33(0.15) 2.37(0.19) 2.01 22.2*** AD < All;
LMCI < EMCI 1.49
Rostral Middle Frontal
2.14(0.15) 2.15(0.14)
2.18(0.12) 2.15(0.13)
2.13(0.14) 2.11(0.12)
2.05(0.16) 2.08(0.15) 0 14.73*** AD < All;
LMCI < EMCI 1.8
Superior Parietal
1.95(0.16) 2.00(0.17)
2.02(0.14) 2.00(0.14)
1.96(0.16) 1.94(0.16)
1.88(0.18) 1.87(0.18) 0.57 18.66*** AD < All;
LMCI < EMCI 1.7
Inferior Parietal
2.18(0.16) 2.21(0.18)
2.22(0.15) 2.22(0.15)
2.18(0.16) 2.13(0.15)
2.06(0.20) 2.03(0.21) 0.1 25.75*** AD < All;
LMCI < EMCI 2.11.
Supramarginal
2.30(0.18) 2.34(0.17)
2.35(0.15) 2.36(0.16)
2.29(0.17) 2.26(0.17)
2.17(0.19) 2.17(0.18) 2.08 30.71*** AD < All;
LMCI < EMCI 0.99
Precuneus 2.12(0.16) 2.16(0.17)
2.17(0.14) 2.16(0.15)
2.12(0.16) 2.10(0.16)
2.03(0.17) 2.00(0.18) 0.36 22.49*** AD < All;
LMCI < EMCI 1.39
Posterior Cingulate
2.37(0.18) 2.42(0.18)
2.41(0.17) 2.38(0.17)
2.38(0.16) 2.38(0.18)
2.33(0.20) 2.31(0.18) 0.16 5.47*** AD < All 2.03
MeanCTh_left
2.29(0.14) 2.32(0.13)
2.32(0.11) 2.32(0.12)
2.27(0.14) 2.25(0.13)
2.16(0.15) 2.16(0.14) 2.31 38.84***
AD < All; LMCI < EMCI,
CN 1.25
a F value is adjusted for global Aβ load (4 X 2 ANCOVA test) b Values are represented as mean(SD), upper is for E4- group and lower is for E4+ group c p<.1; *p<.05; **p< .01; ***p< .001
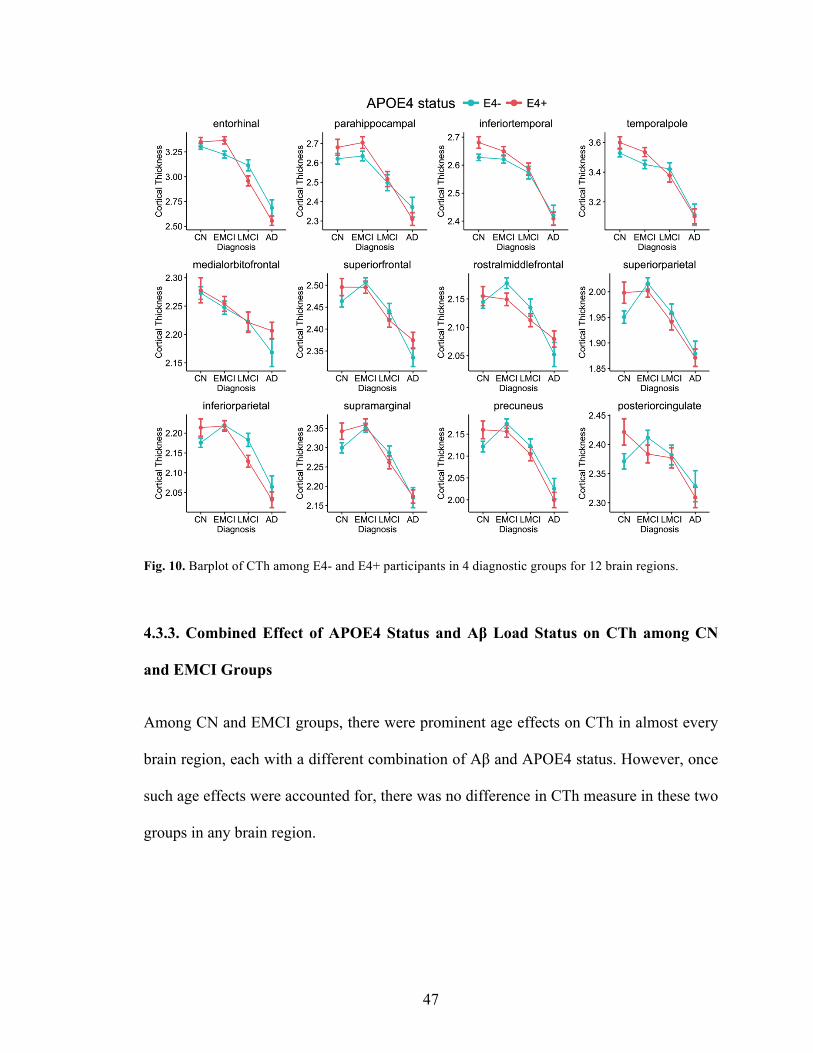
47
Fig. 10. Barplot of CTh among E4- and E4+ participants in 4 diagnostic groups for 12 brain regions.
4.3.3. Combined Effect of APOE4 Status and Aβ Load Status on CTh among CN
and EMCI Groups
Among CN and EMCI groups, there were prominent age effects on CTh in almost every
brain region, each with a different combination of Aβ and APOE4 status. However, once
such age effects were accounted for, there was no difference in CTh measure in these two
groups in any brain region.

48
Table 14. Effect of APOE4 status on regional CTh in CN and EMCI, independent of Aβ load (left hemisphere)
CN E4- 184 E4+ 67
EMCI E4- 169 E4+ 128
Fa APOE4 Status
Fa Diagnosis
Fa Diagnosis by
APOE4
Entorhinal 3.30(0.38) b 3.35(0.37)
3.22(0.46) 3.37(0.41) 9.68**c 0.26 1.92
Parahippocampal 2.62(0.38) 2.68(0.34)
2.64(0.32) 2.70(0.34) 6.02* 0.71 0.06
Inferior temporal 2.63(0.15) 2.68(0.17)
2.62(0.19) 2.65(0.19) 12.56*** 0.45 0.37
Temporal pole 3.53(0.35) 3.60(0.32)
3.45(0.37) 3.53(0.34) 7.47** 3.88* 0.06
Medial orbitofrontal 2.27(0.15) 2.28(0.18)
2.25(0.15) 2.25(0.15) 1.71 1.72 0.04
Superior frontal 2.46(0.18) 2.50(0.16)
2.51(0.14) 2.5(0.16) 1.21 2.56 1.93
Rostral Middle Frontal 2.14(0.15) 2.15(0.14)
2.18(0.12) 2.15(0.13) 0.45 1.23 2.46
Superior Parietal 1.95(0.16) 2.00(0.17)
2.02(0.14) 2.00(0.14) 1.68 6.29* 4.65*
Inferior Parietal 2.18(0.16) 2.21(0.18)
2.22(0.15) 2.22(0.15) 2.7 3.56. 1.81
Supramarginal 2.30(0.18) 2.34(0.17)
2.35(0.15) 2.36(0.16) 3.81. 5.71* 1.17
Precuneus 2.12(0.16) 2.16(0.17)
2.17(0.14) 2.16(0.15) 1.6 3.89* 3.58.
Posterior Cingulate 2.37(0.18) 2.42(0.18)
2.41(0.17) 2.38(0.17) 0.56 0.02 5.87*
Mean CTh_left
2.29(0.14) 2.32(0.13)
2.32(0.11) 2.32(0.12) 3.55. 2.52 2.72.
a F value is adjusted for global Aβ load (2 X 2 ANCOVA test) b Values are represented as mean(SD), upper is for E4- group and lower is for E4+ group c p<.1; *p<.05; **p< .01; ***p< .001
4.3.4. Combined Effect of APOE4 Status and Aβ Load Status on Cognitive
Variables among CN and EMCI Groups
From Table 15 and Fig. 11, it can be seen that after accounting for age, there was a
significant effect on all assessed cognitive scores: (a) the E4+/Amy+ group showed more
impairment than the E4-/Amy- group on the MMSE score (p <0.001); (b) the E4+/Amy+

49
group was more impaired than the E4-/Amy- (p <0.001), as well as the E4-/Amy+ groups
(p = 0.005) on the RAVLT (immediate) memory test; (c) the E4+/Amy+ group was more
impaired that the E4-/Amy- group on the RAVLT percent forgetting (p = 0.018); and (d)
the E4+/Amy+ group had more impaired ADAS13 scores as compared to all other
combinations of E4+/- and Amy +/- (all p < 0.001).
Table 15. Combined effect of APOE4 status and Aβ load status on cognitive scores among CN and EMCI groups
E4-Amy- (241)
E4-Amy+ (112)
E4+Amy- (73)
E4+Amy+ (122)
F_age F_E4Amya
MMSE 28.93(1.35)b 28.54(1.39) 28.73(1.28) 28.16(1.73) 8.48**c 7.86*** E4+Amy+ < E4-Amy-d
RAVLT immediate
44.00(10.98) 41.61(11.2) 43.73(10.8) 38.13(10.3) 36.85*** 8.23*** E4+Amy+ < E4- Amy-; E4+Amy+ < E4- Amy+
RAVLT Percent forgettinge
38.79(29.8) 43.67(28.5) 39.8(26.94) 48.37(29.74) 8.5** 2.86* E4+Amy+ > E4- Amy-
ADAS13e 10.00(4.82) 11.45(5.61) 9.70(5.17) 13.58(5.56) 21.9*** 13.51*** E4+Amy+ > All
a F value is adjusted for age (One-way ANCOVA test) b Values are represented as mean(SD) c p<.1; *p<.05; **p< .01; ***p< .001 d Post Hoc Tukey results with significant difference e Higher scores indicate worse performance

50
Fig. 11. Bar graph of scores on following cognitive tests: MMSE, RAVLT (immediate), RAVLT (% forgetting) and ADAS13. Individual bars represent the following groups of participants: E4-/Amy-; E4+/Amy-; E4-/Amy+ and E4+/Amy+. The colored asterisk (*p<.05; **p< .01; ***p< .001) on the E4-/Amy- indicates a significant difference in score from the score for the corresponding color bar, i.e., E4+/Amy+ group, same as E4-/Amy+ bars in RAVLT (immediate) and ADAS13, as well as E4+/Amy- in ADAS13. There was no significant difference among E4-/Amy-, E4+/Amy-, E4-/Amy+ group.

51
4.4. Discussion
This study represents a first attempt to disentangle the complex inter-relationships
between Aβ load, APOE4 genotype, regional CTh and cognition among well-defined
diagnostic groups in ADNI. Previous studies have shown that: (1) higher global Aβ load
and E4+ status are associated with a greater risk of progression from CN to MCI, and
MCI to AD [84, 85]; (2) higher Aβ load is associated with reduced CTh, but with subtle
impairment of cognition in the CN and MCI stage [15, 86-94]; (3) E4+ status is
associated with an earlier age of onset of Aβ positivity and of AD, greater Aβ levels in
the brain, reduced hippocampal volumes and CTh in limbic and neocortical regions, and
subtle cognitive deficits in CN individuals [23, 24, 57, 95-103]; (4) further, irrespective
of APOE4 status, reduced hippocampal volumes and CTh in various brain regions,
especially those regions characterized as AD signature regions, are associated with
impaired memory and general cognition, as well as a greater risk for progression from
CN to MCI and MCI to AD [104]. However, there is currently no consensus regarding
the extent to which Aβ load status and APOE4 status, independently and in combination,
are associated with neurodegenerative changes in AD prone regions and with cognitive
impairment.
It is important to note that both trophic and toxic effects of Aβ peptide are known and
they may not necessarily be mutually exclusive. The toxic effects may be mediated by
different mechanisms, such as oxidative stress, inflammation, mitochondrial diffusion,
alterations in membrane permeability, synaptic dysfunction, and excitotoxicity through
its interaction with neurotransmitter receptors. These effects contribute significantly to

52
the neuronal damage seen in AD, which may be associated with Aβ itself, including high
concentrations in fibrillar or aggregated states, interaction with free metals, interactions
with previously injured or aged brain tissue and with decreased antioxidative mechanisms
[105-108].
We devised our analytic strategy to investigate, among 906 participants in the ADNI-
1/ADNI-Go and ADNI-2 cohorts, the unique and independent contributions of those
elements, which are considered as upstream factors (i.e., Aβ load status and APOE4
status), on downstream factors (regional CTh and cognitive measures tapping memory
and general cognition). We also investigated the individual and additive effects of E4+
and Amy+ status on CTh and cognitive performance, in the earliest stages of
neurodegeneration, using different combinations of APOE4 status and Aβ load status
(E4-/Amy-, E4+/Amy-, E4-/Amy+ and E4+/Amy+) among CN and EMCI participants.
Our results confirmed previous reports showing that E4+ status is associated with
increased Aβ load among all stages of AD (Table 11). Amy+ status, among all
participants, was found to be associated with reduced CTh in many AD vulnerable
regions, independent of the effects of E4+ status (Table 12) [89, 90, 109, 110], but E4+
status was associated with reduced CTh in restricted brain regions, and only among
LMCI and AD participants (Table 13). Unexpectedly, E4+ status was associated with
increased CTh in some of the most vulnerable brain regions to AD pathology (i.e., the
ERC, PHG and ITG) in the preclinical and very early stages of AD (i.e., among CN and
EMCI participants) (Table 14).

53
Even though we found there was no observed cortical thinning in association with Amy+
status, and there was cortical thickening in association with E4+ status, among CN and
EMCI participants, there was impairment on all cognitive tests among these participants,
in association with either Amy+ and E4+ status, independently and to the greatest extent
with combined Amy+ and E4+ status (Table 15). Global cognitive scores (ADAS13),
among CN and EMCI participants, were significantly impaired among E4+/Amy+ groups
as compared to all other groups, including those who were E4+/Amy-, suggesting that the
presence of Amy+ status is independently associated with greater impairment of global
cognitive scores. Further, memory impairment, on the RAVLT immediate test, was
greater among those who were E4-/Amy+, as compared to those who were E4+/Amy+,
suggesting that the presence of E4+ status is independently associated with greater
immediate memory impairment. These results demonstrate that in the earliest stages of
AD, in the absence of cortical thinning, there is impairment in cognitive performance
attributable to combined E4+ and Amy+ status, as well as independently to E4+ status
and to Amy+ status. Given that there is a known relationship between CTh and cognitive
scores [104, 111, 112], the finding among CN and EMCI participants, who are E4+, of an
association with increased CTh in the most vulnerable regions to AD pathology, suggests
that the mechanism underlying neurodegeneration associated with E4+ status is distinct
from that of Amy+ status.
Biological processes, such as metabolic activation, increased blood flow and
inflammation [113, 114], may result in increased volume of the cortical ribbon in brain
regions, in which the neurodegenerative process begins, with subsequent cortical thinning

54
as neurodegeneration becomes more advanced [115-117]. It is apparent that APOE4 is a
contributing factor to neurodegeneration, and is strongly linked to AD pathology, alone
and particularly in combination with the Aβ peptide. APOE4 may increase Aβ deposition
in plaques and impair its clearance, and also may act independently through pathways
that may not involve Aβ [118]. The pathophysiological effects of APOE4 may be
mediated at a molecular level in the process of redistribution of lipids in normal lipid
homeostasis, repairing injured neurons, maintaining synapto-dendritic connections, and
scavenging toxins. These pathophysiological effects result in adverse outcomes in various
neurological conditions and in “normal” aging. E4+ status is associated with adverse
outcomes, acceleration of progression, worsening overall prognosis in response to head
injury, oxidative stress, ischemia, and inflammation, as well as lowering of the age of
onset of neurodegenerative disease [115].
A weakness of this study is that it is cross-sectional and so any inferences about
progression from the CN to AD stage must be considered tentative. A major strength of
the current investigation is that it utilizes a well-characterized ADNI cohort, including
large numbers of subjects who are cognitively normal or in the earliest stages of disease,
to power the analyses. These large numbers of subjects that are available in the ADNI
cohort provide the statistical power required to tease apart independent effects of
upstream biological processes, such as Aβ load and APOE4 status as they relate to
downstream effects on CTh and cognition. Future analyses should attempt to confirm
these findings using longitudinal analyses of the data, and to further evaluate the effects
of regional, rather than global deposition of Aβ, on CTh and cognition.

55
In conclusion, our findings suggest that both Aβ load and APOE4 status are highly
associated with progressive neurodegeneration, as measured by cortical thinning,
especially in the LMCI and AD stages, and especially in brain regions which are
vulnerable to AD pathology. Even though there is no significant cortical thinning noted in
CN and EMCI stages, associated with E4+ or Amy+ status, there is measurable cognitive
impairment present. The association of E4+ status with cortical thickening, rather than
thinning, suggests the possibility of a very different pathophysiological role for E4+ from
that of Aβ deposition in the progression of AD.

56
CHAPTER V
DIVERGING ASSOCIATION PATTERNS OF REGIONAL CORTICAL
ATROPHY WITH GLOBAL AND WITH REGIONAL AMYLOID DEPOSITION
5.1. Goal
Previous studies that have examined the effects among Aβ deposition and gray matter
atrophy were either based on the mean global neocortical Aβ ratio or on the voxel-to-
voxel level [119-127]. The mean global neocortical Aβ ratio method classified
individuals into Aβ normal level (Aβ negative) and Aβ abnormal level (Aβ positive), and
compared the regional brain atrophy of those two groups within or across different
disease stages. Nevertheless, this global way might overlook the direct assessment of
brain amyloidosis and neurofibrillary pathology in specific regions. Although the voxel-
based approach is simple and a direct way to assess the relationship of the brain atrophy
and Aβ load in each voxel, regional information is often ignored in many studies.
In the present investigation, we aimed to assess and compare the association patterns of
regional and global Aβ load with brain atrophy in AD-vulnerable and AD-unrelated
regions, across difference stages of the disease (CN, EMCI, LMCI and AD), considering
the mediated performance of APOE4. We further explored the relationship of global Aβ
load and regional Aβ deposition in regions that showed different association patterns.
Specifically, we tested the following hypotheses: (i) the association patterns with brain
atrophy is more robust for regional Aβ load than for global Aβ load; (ii) the relationship

57
between Aβ load and brain atrophy is region-specific and disease-stage-specific; and (iii)
regional Aβ accumulation is not always linearly related to the global Aβ load.
5.2. Materials and Methods
5.2.1. Study Participants
Data and image processing method used in the preparation of this article is same as in the
chapter II.
5.2.2. Regions of Interest
In this study, we tested 12 relatively vulnerable AD-related neurodegeneration regions in
both hemispheres: entorhinal, temporal pole, parahippocampal, fusiform, inferior
temporal, precuneus, posterior cingulate, isthmus cingulate, inferior parietal,
supramarginal, rostral middle frontal, and insula. For contrasting purposes, we also
considered 4 relatively resistant regions: precentral, postcentral, pericalcarine, and
cuneus.
5.2.3. Statistical analysis
To compare subjects’ characteristics among the diagnostic stages: CN, EMCI, LMCI and
AD, we performed analysis of variance (ANOVA) test on age, year of education, MMSE
score, and CDRSB score, as well as the Chi-square test on gender and APOE4 gene.
58
Considering the mediated performance of APOE4 on the aggregated forms of Aβ [24]
and on the cortical atrophy [128], we performed Pearson partial correlation (PPC) method
to assess the relationship between regional/global Aβ load and regional cortical atrophy
within each diagnostic group, controlling for the number of APOE4 alleles, age, and the
total intracranial volume (ICV). Multiple-comparison corrections were then considered
by controlling false discovery rate (FDR) per diagnostic group. As a secondary analysis,
we used ANOVA method to examine whether the regional/global Aβ load or the regional
volume was different across the spectrum of disease. Following a statistically significant
F-test, the post hoc Tukey HSD procedure was then employed for subgroup comparisons.
To investigate whether the relationship between regional and global Aβ accumulation is
linear or assumed a more non-linear function, we introduced the LOESS regression
model to fit the curve of the Aβ load in a specific region and in the whole cortical among
all participants. In this study, the quadratic model and the smooth parameter were
considered.
All statistical analyses were performed using R software (R 3.3.0), a well known software
environment for statistical computing and graphics [83]. The default significant level
was determined as 0.05.

59
5.2.3.1. Pearson Partial Correlation (PPC)
Pearson Partial Correlation is a measure of the linear relationship between two
continuous variables controlling for the effect of on ore more other variables. The partial
correlation coefficient represents the strength and direction of such relation.
Take the right precuneus cortical region in EMCI group for example. Let xi, yi, zi1, zi
2, zi3 ,
be the volume, the SUVR of such region, the number of APOE4 alleles, age and the ICV
of patient i, (i = 1, 2, 3, ... , 296), respectively. First of all, the linear regression model for
x or y and three covariance z1, z2, z3 is built (5.1), from which the fitted values xi and yi ,
as well as the residuals !xi , !yi are calculated.
x =α + β1z
1 + β2z2 + β3z
3
y =ω + γ 1z1 + γ 2z
2 + γ 3z3
(5.1)
The PPC between x and y controlling for z1, z2, and z3 (rxy|z) is the Pearson correlation
(5.2) between the residuals of the x and y after regression on z1, z2, z3.
rxy|z =!xi − µ !x( ) !yi − µ !y( )
i=1
296
∑
!xi − µ !x( )2i=1
296
∑ !yi − µ !y( )2i=1
296
∑ (5.2)
where, µ !x =1296
!xii=1
296
∑ and similarly to µ !y .

60
5.2.3.2 Locally Weighted Scatterplot Smoothing (LOESS) Regression
The LOESS is the local polynomial regression and nonparametric method. It fits simple
polynomial models to localized subsets of the data point by point. The number of points
considered in each subset is defined by the smoothing parameter α , i.e., the proportion
of data that is considered to be neighboring that point. Suppose the data size is n, at each
point, at say x , the polynomial Y = Xβ is fitted using weighted lease squares (5.3), i.e.,
giving more weight to points near x , and less weight to points far away.
β = XTWX( )−1 XTWY
(5.3)
where, tricubic weighting (5.5) is used.
W =
w1 0 0 00 w2 0 00 0 ! 00 0 0 wk
⎡
⎣
⎢⎢⎢⎢⎢
⎤
⎦
⎥⎥⎥⎥⎥
(5.4)
wi = 1−xi − x
2
j=1
k
Max xj − x2
⎡
⎣
⎢⎢⎢⎢
⎤
⎦
⎥⎥⎥⎥
3⎡
⎣
⎢⎢⎢⎢
⎤
⎦
⎥⎥⎥⎥
3
(5.5)
where k = nα .
The LOESS Curve is then created based on regression function values that have been
computed for each of the n points. In short, the LOESS combines n linear least square
regression models in a k-nearest-neighbor-based-meta mode.

61
5.3. Results
As indicated in Table 4 in Chapter II, significant demographic differences was found only
for age. The presence of APOE4 was expectedly highest in AD patients, and
intermediated in EMCI and LMCI groups. What follows are the main findings of this
study detailed in three sections which express (1) the associations of cortical atrophy with
global Aβ load, (2) the associations of cortical atrophy with regional Aβ load, and (3) the
relationship between regional and global Aβ load.
5.3.1. Associations of cortical atrophy with global Aβ load
As expected, in AD-vulnerable regions, there was considerable negative correlation
between the whole brain Aβ load and the cortical volume, i.e., higher Aβ deposition is
associated with greater cortical atrophy, which was detected in AD and its prodromal
stages of EMCI and LMCI, whereas no significant relationship was found in the CN
stage (Figure 12A and Table 16). Specifically, inferior parietal (p = 0.004), isthmus
cingulate (p = 0.021) in the left hemisphere and supramarginal (p = 0.008),
parahippocampal (p = 0.025), isthmus cingulate (p = 0.025), insula (0.026), precuneus
(0.035) in right hemisphere started to show minor but statistically significant negative
patterns in the EMCI stage, with partial correlation coefficients r in range -0.123 to -0.17.
The inferior parietal (left: p = 0.038, right: p = 0.009), precuneus (left: p = 0.028, right: p
= 0.010), fusiform (left: p = 0.033, right: p = 0.003), and insula (left: p = 0.019, right: p =
0.020) persisted with or were even strengthened in the LMCI stage.

62
In addition, similar patterns extended to the following regions in LMCI stage: entorhinal
(left: p = 0.024, right: p = 0.019), inferior temporal and posterior cingulate (significant in
left: p = 0.001 and 0.002, mild in right: p = 0.099 and 0.0504, respectively), left
supramarginal (p = 0.003) and left temporal pole (p = 0.044). The range of the partial
correlation coefficient in the LMCI stage was from -0.146 to -0.24. In AD stage, such
pattern remained in bilateral inferior temporal (left: p= 0.037, right: p = 0.01), inferior
parietal (left: p <0.001, right: p = 0.003), right isthmus cingulate (p = 0.022), and left
precuneus (0.042), extending to rostral middle frontal (left: p = 0.01, right: p = 0.012).
No significant pattern was discovered in any AD-resistant regions except for left cuneus,
in which negative relationship was shown in AD stage (p = 0.031). All associations
were mild and generally not significant after correction for multiple comparisons
(corrected for PPC 32 tests), and the associations that remained significant was in left
inferior temporal, left posterior cingulate, left supramarginal and right fusiform in LMCI
stage and in bilateral inferior parietal cortex in AD stage (Table 17).

63
Fig. 12. Association patterns of cortical atrophy with global Aβ load (A), and regional Aβ load (B), displayed as heatmap with partial correlation coefficients displayed at p(uncorrected) < 0.05.

64
Table 16. Associations of cortical atrophy and global Aβ load
Region CN EMCI LMCI AD lh_entorhinala -0.073(0.251)b -0.057(0.329) -0.164(0.024) 0.071(0.38) lh_temporalpole -0.035(0.588) 0.015(0.802) -0.146(0.044) 0.087(0.28) lh_parahippocampal -0.081(0.205) -0.105(0.073) -0.087(0.232) -0.141(0.08) lh_fusiform 0.004(0.945) -0.056(0.339) -0.155(0.033) -0.155(0.053) lh_inferiortemporal -0.109(0.088) -0.075(0.201) -0.24(0.001) -0.167(0.037) lh_precuneus 0.038(0.554) -0.092(0.114) -0.16(0.028) -0.163(0.042) lh_posteriorcingulate -0.031(0.626) -0.083(0.156) -0.229(0.002) -0.113(0.16) lh_isthmuscingulate 0.028(0.659) -0.135(0.02) -0.064(0.381) -0.102(0.205) lh_inferiorparietal 0.054(0.401) -0.17(0.004) -0.151(0.038) -0.319(0) lh_supramarginal 0.106(0.096) -0.065(0.27) -0.211(0.003) -0.028(0.727) lh_rostralmiddlefrontal -0.005(0.94) -0.086(0.142) -0.043(0.557) -0.205(0.01) lh_insula 0.013(0.835) -0.072(0.218) -0.17(0.019) -0.035(0.662) lh_cuneus 0.077(0.23) 0.052(0.372) 0.049(0.5) -0.173(0.03) lh_pericalcarine 0.033(0.603) 0.08(0.172) 0.03(0.678) -0.129(0.108) lh_postcentral 0.03(0.636) 0.021(0.716) -0.043(0.553) -0.114(0.158) lh_precentral 0.074(0.249) 0.063(0.284) 0.017(0.815) -0.009(0.915) rh_entorhinal -0.091(0.156) -0.085(0.146) -0.171(0.019) 0.047(0.563) rh_temporalpole 0.005(0.94) -0.083(0.156) -0.108(0.138) 0.135(0.092) rh_parahippocampal 0.105(0.101) -0.131(0.025) -0.132(0.069) -0.126(0.118) rh_fusiform -0.008(0.902) -0.102(0.082) -0.212(0.003) -0.103(0.202) rh_inferiortemporal -0.069(0.278) -0.08(0.17) -0.12(0.099) -0.206(0.01) rh_precuneus -0.037(0.565) -0.123(0.035) -0.188(0.01) -0.127(0.113) rh_posteriorcingulate 0.011(0.859) 0.012(0.835) -0.142(0.05) 0.071(0.376) rh_isthmuscingulate 0.023(0.719) -0.13(0.026) 0.01(0.892) -0.184(0.022) rh_inferiorparietal -0.017(0.787) -0.098(0.092) -0.19(0.009) -0.237(0.003) rh_supramarginal 0.112(0.079) -0.154(0.008) -0.06(0.414) -0.023(0.78) rh_rostralmiddlefrontal -0.057(0.369) -0.067(0.254) 0.036(0.62) -0.201(0.012) rh_insula 0.036(0.572) -0.13(0.026) -0.168(0.02) 0.061(0.453) rh_cuneus 0.108(0.089) -0.03(0.607) 0.065(0.371) -0.077(0.34) rh_pericalcarine 0.113(0.077) 0.065(0.266) -0.064(0.38) -0.136(0.09) rh_postcentral 0.096(0.133) -0.001(0.985) -0.005(0.948) -0.048(0.551) rh_precentral 0.091(0.154) 0.032(0.59) 0(0.996) 0.062(0.444) a lh=left hemisphere; rh = right hemisphere b Values are represented as Pearson Partial Correlation coefficient (uncorrected p value), with age, number of APOE4 and ICV as covariance. Tests significant at p<0.05 are printed in bold.

65
Table 17. Associations of cortical atrophy and global Aβ load (corrected p value)
Region CN EMCI LMCI AD lh_entorhinala -0.073(0.617)b -0.057(0.434) -0.164(0.077) 0.071(0.506) lh_temporalpole -0.035(0.878) 0.015(0.855) -0.146(0.1) 0.087(0.426) lh_parahippocampal -0.081(0.617) -0.105(0.291) -0.087(0.392) -0.141(0.227) lh_fusiform 0.004(0.945) -0.056(0.434) -0.155(0.088) -0.155(0.171) lh_inferiortemporal -0.109(0.537) -0.075(0.357) -0.24(0.024) -0.167(0.148) lh_precuneus 0.038(0.878) -0.092(0.324) -0.16(0.081) -0.163(0.148) lh_posteriorcingulate -0.031(0.878) -0.083(0.324) -0.229(0.024) -0.113(0.284) lh_isthmuscingulate 0.028(0.878) -0.135(0.14) -0.064(0.554) -0.102(0.328) lh_inferiorparietal 0.054(0.802) -0.17(0.112) -0.151(0.094) -0.319(0) lh_supramarginal 0.106(0.537) -0.065(0.393) -0.211(0.027) -0.028(0.775) lh_rostralmiddlefrontal -0.005(0.945) -0.086(0.324) -0.043(0.686) -0.205(0.077) lh_insula 0.013(0.945) -0.072(0.367) -0.17(0.072) -0.035(0.73) lh_cuneus 0.077(0.617) 0.052(0.458) 0.049(0.667) -0.173(0.139) lh_pericalcarine 0.033(0.878) 0.08(0.324) 0.03(0.775) -0.129(0.236) lh_postcentral 0.03(0.878) 0.021(0.79) -0.043(0.686) -0.114(0.284) lh_precentral 0.074(0.617) 0.063(0.396) 0.017(0.899) -0.009(0.915) rh_entorhinal -0.091(0.554) -0.085(0.324) -0.171(0.072) 0.047(0.643) rh_temporalpole 0.005(0.945) -0.083(0.324) -0.108(0.244) 0.135(0.227) rh_parahippocampal 0.105(0.537) -0.131(0.14) -0.132(0.138) -0.126(0.236) rh_fusiform -0.008(0.945) -0.102(0.292) -0.212(0.027) -0.103(0.328) rh_inferiortemporal -0.069(0.636) -0.08(0.324) -0.12(0.186) -0.206(0.077) rh_precuneus -0.037(0.878) -0.123(0.161) -0.188(0.051) -0.127(0.236) rh_posteriorcingulate 0.011(0.945) 0.012(0.862) -0.142(0.108) 0.071(0.506) rh_isthmuscingulate 0.023(0.921) -0.13(0.14) 0.01(0.952) -0.184(0.116) rh_inferiorparietal -0.017(0.945) -0.098(0.296) -0.19(0.051) -0.237(0.046) rh_supramarginal 0.112(0.537) -0.154(0.131) -0.06(0.576) -0.023(0.805) rh_rostralmiddlefrontal -0.057(0.788) -0.067(0.393) 0.036(0.735) -0.201(0.077) rh_insula 0.036(0.878) -0.13(0.14) -0.168(0.072) 0.061(0.557) rh_cuneus 0.108(0.537) -0.03(0.693) 0.065(0.554) -0.077(0.495) rh_pericalcarine 0.113(0.537) 0.065(0.393) -0.064(0.554) -0.136(0.227) rh_postcentral 0.096(0.554) -0.001(0.985) -0.005(0.979) -0.048(0.643) rh_precentral 0.091(0.554) 0.032(0.693) 0(0.996) 0.062(0.557) a lh=left hemisphere; rh = right hemisphere b Values are represented as Pearson Partial Correlation coefficient (corrected p value per diagnostic group using FDR), with age, number of APOE4 and ICV as covariance. Tests significant at p<0.05 are printed in bold.
5.3.2. Associations of cortical atrophy with regional Aβ load
In general, compared with the global Aβ, 17 out of 32 regions of interest (ROI) showed
exactly the same patterns in the regional Aβ level (4.3.2.1); 6 out of 32 ROIs showed
similar patterns as in global Aβ, while extended to other diagnostic stages (4.3.2.2); 4 of

66
the 32 ROIs did not show the significant negative associations either in the regional level
or in global level (4.3.2.3); and 5 ROIs showed unexpectedly reversed patterns, which
was generally negative in global level, but positive in regional level (4.3.2.4).
5.3.2.1. Regions showing same patterns with global Aβ
Compared with the global Aβ, 17 out of 32 regions of interest (ROI) showed exactly the
same but generally stronger patterns in the regional Aβ level. Among these 17 ROIs,
negative correlation was detected in 9 ROIs: bilateral fusiform (left: p = 0.021, right: p <
0.001 in LMCI), left inferior parietal (p = 0.002, 0.015, <0.001 in EMCI, LMCI and AD
respectively), right precuneus (p = 0.023 and 0.004 in EMCI and LMCI, respectively),
bilateral rostral middle frontal (left: p <0.001, right: p = 0.002 in AD) and right insula (p
= 0.013, 0.016 in EMCI and LMCI, respectively), bilateral supramarginal (left: p = 0.005
in LMCI, right: p = 0.028 in EMCI). On the other hand, there was no significant
relationship detected in any of the prodromal stages in the following 8 ROIs: left
parahippocampal, bilateral precentral, bilateral postcentral, bilateral pericalcarine, as well
as right cuneus (Fig. 12B and Table 18).
Taking insight into the right precuneus ROI, for example, similar association patterns can
also be found from the linear regression models of volume and regional (Fig. 13A), as
well as global (Fig. 13B), Aβ load. Both regional and global Aβ deposition showed
significant negative associations with volume in EMCI (p = 0.012 and 0.007,
respectively) and LMCI stages (p = 0.033 and 0.048, respectively), and also in AD stage
for global Aβ load (p = 0.027).

67
Table 18. Associations of cortical atrophy and regional Aβ load
Region CN EMCI LMCI AD lh_entorhinala 0.078(0.22)b 0.087(0.138) 0.033(0.651) 0.247(0.002) lh_temporalpole 0.092(0.152) 0.132(0.024) 0.01(0.894) 0.293(0) lh_parahippocampal -0.004(0.954) -0.093(0.113) -0.027(0.71) -0.136(0.091) lh_fusiform -0.01(0.874) -0.102(0.081) -0.167(0.021) -0.136(0.089) lh_inferiortemporal -0.128(0.044) -0.187(0.001) -0.235(0.001) -0.203(0.011) lh_precuneus 0.03(0.639) -0.117(0.046) -0.17(0.019) -0.143(0.076) lh_posteriorcingulate -0.092(0.148) -0.151(0.01) -0.301(0) -0.163(0.042) lh_isthmuscingulate -0.006(0.931) -0.111(0.057) -0.102(0.163) 0.013(0.872) lh_inferiorparietal 0.04(0.526) -0.185(0.002) -0.176(0.015) -0.318(0) lh_supramarginal 0.068(0.284) -0.062(0.292) -0.204(0.005) 0.02(0.808) lh_rostralmiddlefrontal -0.032(0.62) -0.1(0.087) -0.07(0.336) -0.292(0) lh_insula 0.02(0.761) -0.121(0.038) -0.182(0.012) -0.032(0.696) lh_cuneus -0.006(0.929) 0.012(0.845) 0.018(0.804) -0.106(0.189) lh_pericalcarine 0.001(0.99) 0.024(0.687) -0.056(0.442) -0.116(0.148) lh_postcentral 0.01(0.869) 0.072(0.219) -0.045(0.534) -0.116(0.148) lh_precentral 0.084(0.187) 0.043(0.461) 0.027(0.71) -0.032(0.692) rh_entorhinal -0.102(0.111) 0.117(0.045) 0.056(0.442) 0.24(0.003) rh_temporalpole 0.036(0.572) 0.144(0.013) 0.11(0.13) 0.272(0.001) rh_parahippocampal 0.152(0.017) -0.043(0.462) -0.105(0.15) 0.044(0.589) rh_fusiform -0.06(0.347) -0.108(0.064) -0.265(0) -0.127(0.114) rh_inferiortemporal -0.132(0.039) -0.09(0.124) -0.129(0.076) -0.302(0) rh_precuneus -0.06(0.351) -0.132(0.023) -0.208(0.004) -0.118(0.143) rh_posteriorcingulate -0.062(0.333) -0.065(0.264) -0.232(0.001) 0.035(0.668) rh_isthmuscingulate -0.038(0.554) -0.219(0) -0.024(0.745) -0.063(0.435) rh_inferiorparietal -0.045(0.479) -0.122(0.037) -0.202(0.005) -0.224(0.005) rh_supramarginal 0.092(0.148) -0.128(0.028) -0.069(0.344) -0.026(0.747) rh_rostralmiddlefrontal -0.083(0.195) -0.08(0.17) -0.005(0.942) -0.25(0.002) rh_insula 0.017(0.785) -0.145(0.013) -0.174(0.016) 0.063(0.436) rh_cuneus 0.054(0.396) -0.024(0.68) 0.02(0.788) -0.011(0.889) rh_pericalcarine 0.06(0.35) 0.062(0.293) -0.114(0.117) -0.055(0.492) rh_postcentral 0.057(0.373) -0.007(0.9) 0.003(0.965) -0.026(0.745) rh_precentral 0.112(0.079) 0.001(0.992) -0.006(0.937) 0.063(0.434) a lh=left hemisphere; rh = right hemisphere b Values are represented as Pearson Partial Correlation coefficient (uncorrected p value), with age, number of APOE4 and ICV as covariance. Tests significant at p<0.05 are printed in bold. Tests significant at p < 0.05 and with positive partial correlation coefficient are printed in bold and italic.
The performance of the Aβ load in right precuneus (Fig. 13D) was consistent with that of
the global Aβ burden (Fig. 13E): significant increased Aβ accumulation compared with
previous diagnostic stages, i.e. EMCI vs. CN, LMCI vs. CN and EMCI, as well as AD vs.
CN, EMCI and LMCI, which further confirmed the aforementioned same association

68
patterns. In terms of the cortical atrophy (Fig. 13C), LMCI and AD patients showed
significant decreased cortical volume compared to EMCI and to CN, EMCI and LMCI,
respectively (all p < 0.001). Such cortical thinning was not detected when comparing
EMCI to CN. However, EMCI patients showed larger cortical volume (p < 0.001), which
was still significant after correcting for age (p = 0.004).
5.3.2.2 Regions with stronger relations
Six out of 32 ROIs showed similar patterns as in global Aβ, which extended to other
diagnostic stages. Compared with the global Aβ (r = -0.24, -0.167 in LMCI and AD,
respectively), left inferior temporal showed similar negative patterns in LMCI (r = -
0.239, p = 0.001) and stronger in AD (r = -0.203, p = 0.011), and extended such trend to
CN (p = 0.045) and EMCI (p = 0.001) as well. Similar to left posterior cingulate (stronger
pattern in LMCI (r = -0.301 vs. -0.229 in global), extended to EMCI and AD with p
<0.001, =0.010, 0.042 in LMCI, EMCI and AD, respectively), left insular (mild stronger
pattern in LMCI (r = -0.182 vs. -0.17), and extended to EMCI with p = 0.012 and 0.028,
respectively), left precuneus (similar pattern in LMCI, mild trend in AD, and extended to
EMCI with p = 0.019, 0.076, 0.046, respectively), right inferior temporal (stronger
pattern in AD (r = -0.302 vs. -0.206), mild trend in LMCI, and extended to CN with p
<0.001, = 0.076, 0.039, respectively), and right inferior parietal (similar patterns in LMCI
and AD, extended to EMCI with p = 0.005, 0.005, 0.037, respectively).

69
Fig. 13. Linear regression models and performance of volume, regional Aβ load and global Aβ load in right precuneus. (A) Scatterplot of the regional Aβ load and volume. The fitted lines are from linear regression models for each diagnosis stage, with formulas listed at the right bottom as well as the p values for regional Aβ standardized uptake value ratio (SUVR) in the linear regression models. (B) Scatterplot and the linear regression models of global Aβ load and regional volume. (C) Boxplot of volumes across all diagnostic stages: CN, EMCI, LMCI and AD. C, E, and L above the boxes represented a significant difference in the volume from CN, EMCI, LMCI group, respectively along with the significant level: *p < .05; **p< .01; ***p < .001. Values in the box indicated the mean volume change rate from the previous stage (5.19% in the EMCI box denotes that on average, the volume in the EMCI group is 5.19% larger than that in CN group.) (D) Boxplot of regional Aβ load across 4 diagnostic stages, represented by the regional Aβ SUVR. (E) Boxplot of global Aβ load across 4 diagnostic stages, represented by the whole cortical Aβ SUVR.

70
5.3.2.3. Regions with weaker relationships
Three of the 32 ROIs did not show the significant negative associations as detected in
global level: left isthmus cingulate in EMCI (p = 0.057), left cuneus in AD (p = 0.189),
and right isthmus cingulate in AD (p = 0.435). On the other hand, in right posterior
cingulate ROI, the negative relationship reached significant level in LMCI (p = 0.001)
compared to the mild trend in global level (p = 0.0504).
Fig. 14. Association patterns of cortical atrophy with global amyloid load (A), and regional Aβ load (B), displayed as heatmap with partial correlation coefficients displayed at p(corrected) < 0.05.

71
5.3.2.4. Regions with reversed patterns
There were 5 specific ROIs showing unexpectedly reversed patterns, which was generally
negative in global level, but positive in regional level. Specifically, right
parahippocampal showed positive correlation in CN group (p = 0.017), i.e., greater Aβ
load was related to larger cortical volume; bilateral temporal pole (left: p = 0.024,
<0.001, right: p = 0.013, 0.001) and right entorhinal (p = 0.045, 0.003) in EMCI and AD
stages, and left entorhinal in AD (p = 0.002). Half of the significant associations
remained significant after multiple-comparison correction (corrected for 32 PPC tests;
Fig. 14B).
For right parahippocampal ROI, similar positive correlation in CN group between volume
and regional Aβ deposition was found through the linear regression model (Fig. 15A),
along with the negative relationships in EMCI and LMCI stages between volume and
global Aβ load (Fig. 15B). The performance of the volume was similar to the right
precuneus ROI: LMCI and AD patients showed significant decreased cortical volume
compared to EMCI and to CN, EMCI and LMCI, respectively (p< 0.001 for all), while
EMCI patients had larger cortical volume than CN (p = 0.03) instead of cortical thinning
(Fig. 15C), but such pattern was not significant anymore when adjusting for age (p =
0.68). On the other hand, although the regional Aβ was significantly accumulated in AD
stage compared with the other 3 stages, the LMC only showed significant higher Aβ load
than CN, while no significant difference was found between CN and EMCI (Fig. 15D).

72
Table 19. Associations of cortical atrophy and global Aβ load (corrected p value)
Region CN EMCI LMCI AD lh_entorhinala 0.078(0.641)b 0.087(0.22) 0.033(0.905) 0.247(0.009) lh_temporalpole 0.092(0.607) 0.132(0.097) 0.01(0.965) 0.293(0.002) lh_parahippocampal -0.004(0.985) -0.093(0.201) -0.027(0.909) -0.136(0.208) lh_fusiform -0.01(0.985) -0.102(0.162) -0.167(0.056) -0.136(0.208) lh_inferiortemporal -0.128(0.475) -0.187(0.016) -0.235(0.01) -0.203(0.035) lh_precuneus 0.03(0.852) -0.117(0.113) -0.17(0.056) -0.143(0.201) lh_posteriorcingulate -0.092(0.607) -0.151(0.071) -0.301(0) -0.163(0.122) lh_isthmuscingulate -0.006(0.985) -0.111(0.131) -0.102(0.307) 0.013(0.889) lh_inferiorparietal 0.04(0.832) -0.185(0.016) -0.176(0.052) -0.318(0.002) lh_supramarginal 0.068(0.702) -0.062(0.375) -0.204(0.024) 0.02(0.862) lh_rostralmiddlefrontal -0.032(0.852) -0.1(0.164) -0.07(0.579) -0.292(0.002) lh_insula 0.02(0.966) -0.121(0.112) -0.182(0.047) -0.032(0.824) lh_cuneus -0.006(0.985) 0.012(0.901) 0.018(0.918) -0.106(0.319) lh_pericalcarine 0.001(0.99) 0.024(0.758) -0.056(0.674) -0.116(0.263) lh_postcentral 0.01(0.985) 0.072(0.319) -0.045(0.776) -0.116(0.263) lh_precentral 0.084(0.624) 0.043(0.548) 0.027(0.909) -0.032(0.824) rh_entorhinal -0.102(0.607) 0.117(0.113) 0.056(0.674) 0.24(0.01) rh_temporalpole 0.036(0.832) 0.144(0.071) 0.11(0.277) 0.272(0.004) rh_parahippocampal 0.152(0.475) -0.043(0.548) -0.105(0.3) 0.044(0.785) rh_fusiform -0.06(0.702) -0.108(0.137) -0.265(0.003) -0.127(0.243) rh_inferiortemporal -0.132(0.475) -0.09(0.209) -0.129(0.188) -0.302(0.002) rh_precuneus -0.06(0.702) -0.132(0.097) -0.208(0.024) -0.118(0.263) rh_posteriorcingulate -0.062(0.702) -0.065(0.368) -0.232(0.01) 0.035(0.824) rh_isthmuscingulate -0.038(0.832) -0.219(0.006) -0.024(0.916) -0.063(0.635) rh_inferiorparietal -0.045(0.806) -0.122(0.112) -0.202(0.024) -0.224(0.018) rh_supramarginal 0.092(0.607) -0.128(0.1) -0.069(0.579) -0.026(0.824) rh_rostralmiddlefrontal -0.083(0.624) -0.08(0.26) -0.005(0.965) -0.25(0.009) rh_insula 0.017(0.966) -0.145(0.071) -0.174(0.052) 0.063(0.635) rh_cuneus 0.054(0.705) -0.024(0.758) 0.02(0.918) -0.011(0.889) rh_pericalcarine 0.06(0.702) 0.062(0.375) -0.114(0.268) -0.055(0.685) rh_postcentral 0.057(0.702) -0.007(0.929) 0.003(0.965) -0.026(0.824) rh_precentral 0.112(0.607) 0.001(0.992) -0.006(0.965) 0.063(0.635) a lh=left hemisphere; rh = right hemisphere b Values are represented as Pearson Partial Correlation coefficient (uncorrected p value), with age, number of APOE4 and ICV as covariance. Tests significant at p<0.05 are printed in bold. Tests significant at p < 0.05 and with positive partial correlation coefficient are printed in bold and italic.
As for the right entorhinal ROI, according to the linear regression model without
adjusting for age, APOE4 and ICV, significant negative association between regional Aβ
load and volume was detected in CN group (p = 0.006), while positive association was
found in AD group (p = 0.012). Unlike the PPC test, the positive correlation in EMCI
group was mild but not significant (p = 0.196) (Fig. 16A). In terms of the global Aβ load,

73
significant negative association was found in CN, EMCI and LMCI stages (p = 0.026,
0.044, 0.041, respectively) (Fig. 16B). In addition, the LMCI and AD showed
dynamically smaller volume than the previous stages (CN, EMCI for LMCI; CN, EMCI,
LMCI for AD, respectively, all p < 0.001), however, such atrophy trend was very slight
and not significant in EMCI compared with CN (Fig. 16C). Moreover, only AD group
showed significant higher Aβ deposition than its previous stages: CN, EMCI, and LMCI
(p = 0.002, 0.024, 0.049, respectively).
5.3.3. Relationship between regional and global Aβ load
Based on aforementioned different association patterns between the regional and global
Aβ level, we further investigated the LOESS curve of right entorhinal, right temporal
pole, right parahippocampal ROIs, which showed opposite patterns. We also evaluated
the fitted LOESS curve of left inferior temporal, right precuneus and left inferior parietal
ROIs that presented consistent or even more robust negative patterns. The regional Aβ
load in all the three ROIs with reverse patterns showed non-linearly interaction with
global Aβ retention: the regional Aβ SUVR of right entorhinal experienced an increase
when the global Aβ SUVR was less than 1.12, while such increasing rate was slowed
down after the global Aβ SUVR reached 1.12. A similar but mild pattern was found in
the left temporal pole and right parahippocampal. For those ROIs with consistent
association patterns, the regional Aβ SUVR seemed linearly related to the global Aβ
SUVR, since the LOESS curve was almost straight (Fig. 17).

74
Fig. 15. Linear regression models and performance of volume, regional Aβ load and global Aβ load in right parahippocampal. (A) Scatterplot of the regional Aβ load and volume. The fitted lines are from linear regression models for each diagnosis stage, with formulas listed at the right bottom as well as the p values for regional Aβ standardized uptake value ration (SUVR) in the linear regression models. (B) Scatterplot and the linear regression models of global Aβ load and regional volume. (C) Boxplot of volumes across all diagnostic stages: CN, EMCI, LMCI and AD. C, E, and L above the boxes represented a significant difference in the volume from CN, EMCI, LMCI group, respectively along with the significant level: *p < .05; **p< .01; ***p < .001. Values in the box indicated the mean volume change rate from the previous stage. (D) Boxplot of regional Aβ load across 4 diagnostic stages, represented by the regional Aβ SUVR. (E) Boxplot of global Aβ load across 4 diagnostic stages, represented by the whole cortical Aβ SUVR.

75
Fig. 16. Linear regression models and performance of volume, regional Aβ load and global Aβ load in right entorhinal. (A) Scatterplot of the regional Aβ load and volume. The fitted lines are from linear regression models for each diagnosis stage, with formulas listed at the right bottom as well as the p values for regional Aβ standardized uptake value ration (SUVR) in the linear regression models. (B) Scatterplot and the linear regression models of global Aβ load and regional volume. (C) Boxplot of volumes across all diagnostic stages: CN, EMCI, LMCI and AD. C, E, and L above the boxes represented a significant difference in the volume from CN, EMCI, LMCI group, respectively along with the significant level: *p < .05; **p< .01; ***p < .001. Values in the box indicated the mean volume change rate from the previous stage. (D) Boxplot of regional Aβ load across 4 diagnostic stages, represented by the regional Aβ SUVR. (E) Boxplot of global Aβ load across 4 diagnostic stages, represented by the whole cortical Aβ SUVR.

76
In addition, the Aβ SUVR in right entorhinal (0.876 0.11, mean SD), left temporal pole
(0.957 0.16) and in right parahippocampal (0.990 0.12) was lower than that of the global
(1.189 0.21), as well as the left inferior temporal (1.144 0.22), right precuneus (1.283
0.27) and left inferior parietal (1.255 0.26) ROIs.
5.4. Discussion
There are two major findings in this study: (i) the association patterns of regional Aβ load
were generally consistent with and even more robust than the global Aβ load for almost
all cortical regions, except for entorhinal, temporal pole and parahippocampal, the three
most AD-vulnerable regions [129-132]. (ii) Aβ accumulation in those three high AD-
vulnerable regions showed sharp growth prior to the global Aβ load reaching an
abnormal level, but the speed slowed down after that. On the other hand, in other brain
areas, the regional Aβ load showed consistent increasing rate regardless of the global Aβ
burden.
The observed negative associations of cortical atrophy and global Aβ load are consistent
with previous findings [121, 127, 133, 134]. The Aβ-related cortical atrophy was first
detected in the EMCI stage in the following regions: parahippocampal [134], inferior
parietal, precuneus, isthmus cingulate, supramarginal and insula, followed by entorhinal,
temporal pole, fusiform, inferior temporal, posterior cingulate in the LMCI stage [127,
134], and significantly presented in rostral middle frontal in the AD stage ultimately. The
regional-specific association across diagnosis stages and the enhanced correlation of Aβ
load with cortical atrophy in LMCI and AD stages agreed with the spatial topography of

77
neurodegenerative change [79] and were also in line with the view that different brain
areas can be at different atrophy levels regarding reactivity to Aβ burden [10]. In
addition, only right parahippocampal showed Aβ-load-related atrophy in EMCI stage.
Also, precuneus presented such correlation firstly in right hemisphere in EMCI stage and
extended to left hemisphere later in the LMCI stage. Such different patterns of left and
right hemisphere supported the view of laterality in alterations [135].
Fig. 17. Associations between regional and global Aβ load. The fitted curves are from LOESS regression models for all subjects, with smoothing degree equals to 0.4.
The inconsistent positive correlation of cortical atrophy with regional Aβ burden in right
parahippocampal in CN stage had been reported in a previous study [136] that informed
larger hippocampal and parahippocampal volume in CN participants with high Aβ load

78
measured by PIB PET. Such hippocampal hypertrophy in the brains of normal elderly
with Aβ plaques compared to those without Aβ plaques had been evidenced at some
autopsy studies and were explained as the early response to the toxic effects of Aβ
peptide [137, 138]. Besides, the larger cortical volume in EMCI stage followed by
cortical atrophy in LMCI and AD stages in parahippocampal (Fig. 15C) and in precuneus
(Fig. 16C) ROIs was also agreed with the view of biphasic trajectory of brain structure
changes as reported in [139, 140], and may also be interpreted as neuronal hypertrophy
and/or inflammatory response to the toxic effect of Aβ peptide.
On the other hand, the negative correlation between regional/global Aβ burden and
regional volume in CN stage was found only in right entorhinal ROI from the linear
regression model (Fig. 16A), which was consistent with other studies [80, 88, 129, 130,
141] and supported the view that Aβ deposition is associated with a pattern of cortical
atrophy prior to the development of cognitive impairment, i.e., cognitive reserve [80].
This finding also confirmed that the entorhinal is one of the earliest brain regions
revealing degeneration [142]. However, when accounting for the effects of age, APOE4
and ICV, such regional Aβ-induced cortical atrophy in right entorhinal in CN stage was
not detectable, instead, positive association was shown in EMCI stage and later in AD
stage. A few previous studies had also reported increased metabolic activity, which is
another way to express neurodegeneration, in the brain measured by FDG PET in MCI
[143, 144] and increased cerebral blood flow in AD [134] in relation to the increased Aβ
load. Such positive association may either reflect early response to the Aβ toxic effect, or
imply that Aβ accumulation itself results from the increased neural activity [134, 143,

79
145]. In fact, we can see from Fig. 16 that both volume and Aβ burden underwent
significant change in AD, 13.37% atrophy compared with LMCI and 3.45% Aβ
accumulation. Furthermore, the relatively unchanged Aβ load from CN to LMCI stage
(1.16% form CN to EMCI and 0% form EMCI to LMCI, Fig. 4D) and the mild but not
significant decreased volume size from CN to EMCI (-0.59%) followed by the
dynamically volume shrinking from EMCI to LMCI (-11.42%) (Fig. 16C) inferred the
postponed effect of Aβ load on neurodegeneration [10].
The LOESS regression analyses of regional Aβ load and global Aβ accumulation also
elicited the inconsistent patterns of these 3 AD prone ROIs: entorhinal, temporal pole and
parahippocampal. Unlike other brain areas where regional Aβ accumulation was
consistent with that in the whole cortical, Aβ in these 3 ROIs underwent dynamically
accumulate among patients identified as Aβ negative (AM-), considering the common
cutoff value range of 1.10 to 1.12 [81, 82, 146, 147], and relatively slower increase for
Aβ positive (AM+) patients. In fact, these 3 ROIs are known to be selectively vulnerable
to pathology and undergo neurodegeneration before all other brain regions when exposed
to toxins, including Aβ. Once neurodegeneration begins in the entorhinal and the
parahippocampal (Fig. 16C & Fig. 16C), it seems to spread, like an infection, in a
stereotyped fashion along certain pathways leading to neurodegeneration in the
hippocampus, and then onto the posterior cingulate/precuneus (Fig. 15C) regions and
later to the rest of the temporal, parietal and frontal neocortex. This finding suggests that
Aβ load in the entorhinal, temporal pole and parahippocampal is possibly the most
important biomarkers to early detection of the disease. Also, biologically important cut

80
off for AM+ vs. AM- should not only be the global cortical Aβ SUVR, which most
researchers are using, but entorhinal, temporal pole and parahippocampal SUVR should
also be taken into consideration, even though their Aβ levels happen to be much lower
than the neocortical Aβ level.
To conclude, the present study provided strong evidence for the effect of Aβ load in
entorhinal, temporal pole and parahippocampal on brain atrophy prior to other brain
regions and to the global Aβ load, suggesting the use of Aβ load in these regions to assist
early detection of AD, and to determine the Aβ positivity rather than the global Aβ load.
Further longitudinal analysis is needed to better understand the predictive value of Aβ
load within those AD prone regions.

81
CHAPTER VI
PATTERN ANALYSIS OF THE INTERACTION OF REGIONAL AMYLOID,
CORTICAL THICKNESS, AND APOE GENOTYPE IN THE PROGRESSION OF
ALZHEIMER’S DISEASE
6.1. Goal
Deposition of beta amyloid protein (Aβ) is known to be an early event that is closely
associated with the pathogenesis of Alzheimer's disease (AD), along with related
downstream events such as neuronal loss, neurofibrillary tangles, cortical thinning and
cognitive deficits. APOE e4 allele (E4) is also known to be associated with increased risk
for AD.
The goal of this study is to examine the association of Aβ deposition to cortical thickness
(CTh), in healthy control (CN), early MCI (EMCI), late MCI (LMCI) and AD stages by
controlling for E4 load, both in regional and hemispheric levels, and to interpret patterns
of different brain regions based on their correlation performance among the four groups.
6.2. Materials and Methods
6.2.1. Study Participants
Data and image processing method used in the preparation of this study is the same as in
the chapter II.

82
6.2.2. Statistical analysis
To compare the subject’s characteristics among the diagnostic groups (CN, EMCI, LMCI
and AD), analysis of variance (ANOVA) was implemented for age as well as for year of
education, while Chi-square test was used for gender and E4 allele. Since only the
significant difference of age was investigated, analysis of covariance (ANCOVA)
adjusted for age was then introduced to compare the cognitive tests (MMSE and
RAVLT) among groups.
Considering the mediated performance of E4 on the aggregated forms of Aβ [148], we
used Pearson partial correlation (PPC) controlling for the number of APOE e4 alleles to
assess the relationship between regional as well as hemispheric CTh and SUVR, which
was then used as the performance measure of such region in the specific groups (CN,
EMCI, LMCI or AD) later. Multiple-comparison correction was then considered across
all PPC analyses by controlling false discovery rate (FDR). The statistical analysis was
performed using R software (R 3.3.0) using the default significant level (p value) of 0.05.
6.2.3. Clustering Analysis
To interpret patterns of ROIs based on their correlation performance, the complete
linkage hierarchical clustering analysis (CL_HCA) was applied. The CL_HCA is carried
out through a series of successive mergers. As is shown in Fig. 18, initially, there are as
many clusters as objects, i.e. 5 in this case. The most similar objects are first merged as a

83
group, i.e. G1 with objects a and b, and such groups are then merged according to their
similarities. All subgroups are fused into a single cluster eventually.
In terms of how the complete linkage clustering proceeds, the similarity between clusters
is determined by the distance (similarity) between the two elements, one from each
cluster, that are most distant. The complete linkage function, i.e. distance D(U,V)
between clusters U and V, is described in (6.1).
D U,V( ) =maxu∈U,v∈V d u,v( ) (6.1)
where d(u,v) is the distance between u and v , which are the objects in cluster U and
cluster V, respectively.
Fig. 18. Complete linkage hierarchical clustering illustration: (a) similarity. The distance of new cluster G1 and G2 is defined as d (a,c) which is the maximum distance among (a,c), (a,e), (b,c) and (b,e); (b) dendrogram. Object a and b are fist merged as new cluster G1, followed by object c and e (G2), then object d and cluster G1 were merged as new cluster, and finally merged with G2 into a single cluster.

84
In the context of this study, the u and v represent the specific ROIs in each cluster, and
the region-to-region distance d(u,v) is as defined in (6.2).
d u,v( ) = ruCN − rv
CN( )2 + ruEMCI − rv
EMCI( )2 + ruLMCI − rv
LMCI( )2 + ruAD − rv
AD( )2 (6.2)
where, ruCN represents the PPC coefficient (5.2) of region u in group CN. For those not
showing significant correlation, the PC coefficient r is set to 0.
Both the correlation results and clustering analysis are represented using heatmaps to
facilitate both visualization and interpretation of the results provided in the next section.
6.3. Results
At the regional level, 25 out of 68 ROIs presented significant correlations of SUVR and
CTh at least in one of the four diagnostic groups (CN, EMCI, LMCI, and AD), among
which, 9 in bilateral hemispheres (bi_), 3 in left hemisphere (lh_), and 4 in right
hemisphere (rh_), respectively. While at the hemispheric level, both mean hemisphere
cortical thickness showed significant negative associations to the corresponding mean Aβ
deposition of left hemisphere but only in the EMCI stage (Fig. 19).
In the pattern of such relationship performance among the 4 groups, 6 main clusters of
those 25 ROIs were identified:
• C1(negative CN+EMCI):
o rh_inferior_temporal
• C2 (negative EMCI):

85
o bi_fusiform, bi_precuneus, bi_superior_temporal, bi_lateral_occipital
o lh_medialorbitofrontal, lh_isthmuscingulate
o rh_superamarginal, rh_middle_temporal
• C3 (negative EMCI+LMCI):
o lh_inferior_temporal, lh_middle_temporal,
lh_banks_of_the_Superior_semporal_sulcus (lh_bankssts)
o rh_inferior_parietal
• C4 (negative LMCI):
o lh_inferior_parietal
• C5 (positive CN):
o rh_postcentral, rh_transversetemporal, rh_precentral
• C6 (positive AD):
o bi_entorhinal, bi_temporal_pole
Specifically, ROIs in C1 exhibited steady negative significant correlation trends among
CN and EMCI groups; C2 showed reversed correlation in EMCI stage; C3 showed such
reversed relationship also in EMCI stage, which were maintained in the LMCI stage; C4
showed negative correlation only in the LMCI stage. On the other hand, ROIs in C5
presented positive significant correlation in CN stage; C6 showed such correlation in the
AD stage. Similar associations were found even when using Pearson correlation (Fig. 20).
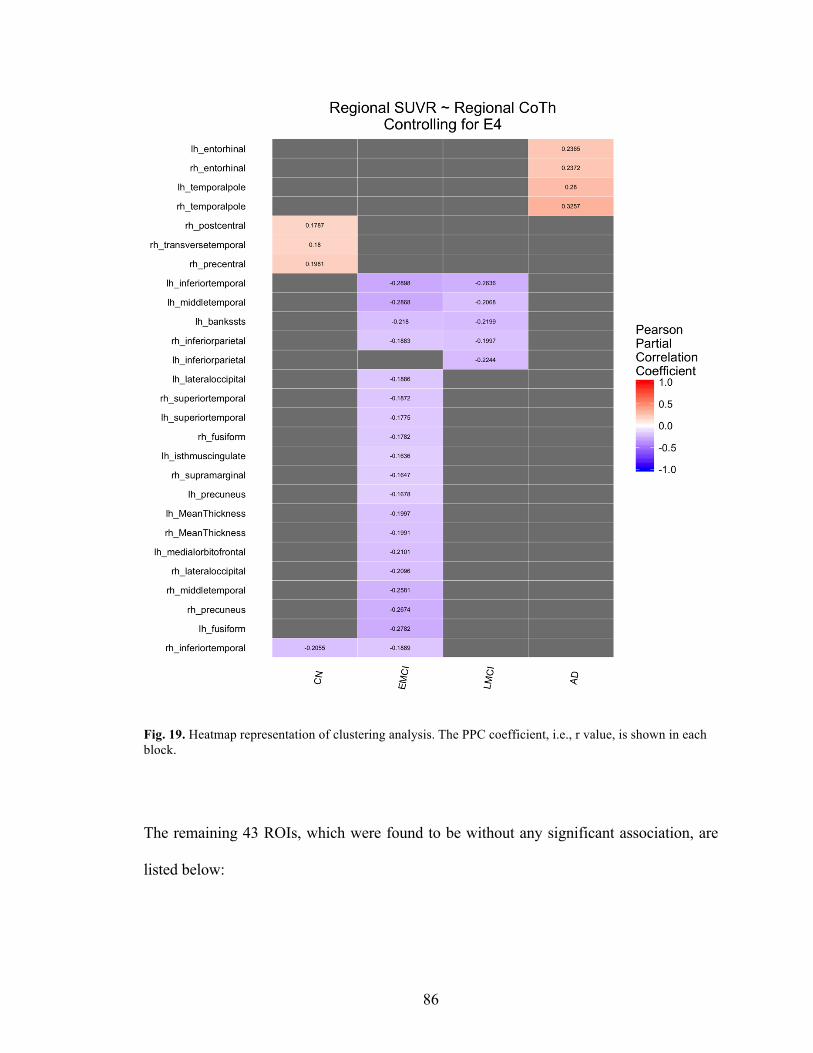
86
Fig. 19. Heatmap representation of clustering analysis. The PPC coefficient, i.e., r value, is shown in each block.
The remaining 43 ROIs, which were found to be without any significant association, are
listed below:

87
• Bilateral: bi_frontal_pole, bi_superior_frontal, bi_rostral_middle_frontal,
bi_pars_triangularis, bi_pars_orbitalis, bi_paracentral, bi_lingual,
bi_lateral_orbitofrontal, bi_insula bi_cadual_middle_frontal, bi_cuneus
bi_caudal_anterior_cingulate, bi_rostral_anterior_cingulate,
bi_posterior_cingulate, bi_superior_parietal, bi_parahippocampal,
bi_pericalarine,
• Left: lh_precentral, lh_postcentral, lh_superamarginal, lh_transverse_temporal
• Right: rh_medial_orbitofrontal, rh_bankssts, rh_isthmus_cingulate
6.4. Discussion and Conclusion
The main findings of this study suggest that there are cortical areas that have significant
association with Aβ deposition, while other regions seem to be relatively independent
from Aβ burden. Also, patterns of those regions showing significant association are in
general distinctive with regards to the different stages of the disease, with some showing
relative similarities. Briefly, negative associations, i.e. higher Aβ deposition is associated
with reduced cortical thickness, were detected mainly among EMCI with some lingering
into LMCI stage; whereas positive correlations, i.e. higher Aβ deposition is related to
higher cortical thickness were shown at the CN and AD stages.
Three ROIs in right hemisphere showed positive correlation in CN stage, however, such
correlation did not exist later for the EMCI and subsequent stages, which could indicate
that the amyloid deposition in those regions increased significantly in the EMCI stage
(Fig. 20a).

88
Fig. 20. Scatterplot, linear regression as well as boxplot of (a) right precentral, (b) left inferior temporal, and (c) right entorhinal.

89
Almost all ROIs showing negative association appeared in the EMCI stage, except for the
left inferior parietal. Four of them persisted with such trend towards the LMCI stage,
implying that both Aβ load and cortical thinning are active in MCI regions, i.e., more Aβ
load exists in direct association with more brain atrophy [119-126](Fig. 20b). Bilateral
entorhinal and temporal pole, which are well-known vulnerable ROIs, showed positive
correlation in the AD stage, whereas no correlation was found in other stages, which may
be due to greater regional atrophy and relatively stable amyloid depositions in such
regions, i.e., the increasing rate of Aβ deposition is low compared with the greater regional
atrophy (Fig. 20c). Also, from Fig. 20, we can see that the mean CTh of EMCI patients is
thicker than that of CN, same as SUVR, which may also be the reason of no significant
negative correlation being detected in such vulnerable regions as the entorhinal and
temporal pole.
In retrospect, the cortical regions can be clustered into 2 general groups, positive
correlation in CN or AD, and negative correlation in EMCI and/or LMCI, and 6 more
specific groups were then recognized, suggesting the merits of analyzing the regional
interplay that exists between Aβ deposition with cortical thickness at the different stages
of Alzheimer’s disease.

90
CHAPTER VII
REGIONALSHIP BETWEEN REGIONAL CORTICAL THICKNESS, AMYLOID
LOAD AND SELECTIVE VULNERABILITY TO ATROPHY IN ALZHEIMER’S
DISEASE
7.1. Goal
CTh is known to vary greatly across different brain regions, with primary motor and
sensory cortices being thinner than association cortices, although the effect of normal
aging and disease may alter this relationship [149]. Thinning of the cortex between young
and middle-aged adults was found to be greatest in heteromodal association cortex and
regions of high postnatal surface area [150]. Some studies have shown that temporal and
occipital regions have less cortical thinning than parietal and frontal cortices, and there
may even be age-related thickening of the ERC among older cognitively normal
individuals [149].
In this study, we examined relationships between baseline regional CTh (rCThCN),
baseline regional Aβ load (rSUVRCN) and the severity of change in CTh between CN
subjects and AD patients (%CThDiff), with consideration of the effect of APOE4 carrier
status and global Aβ load.
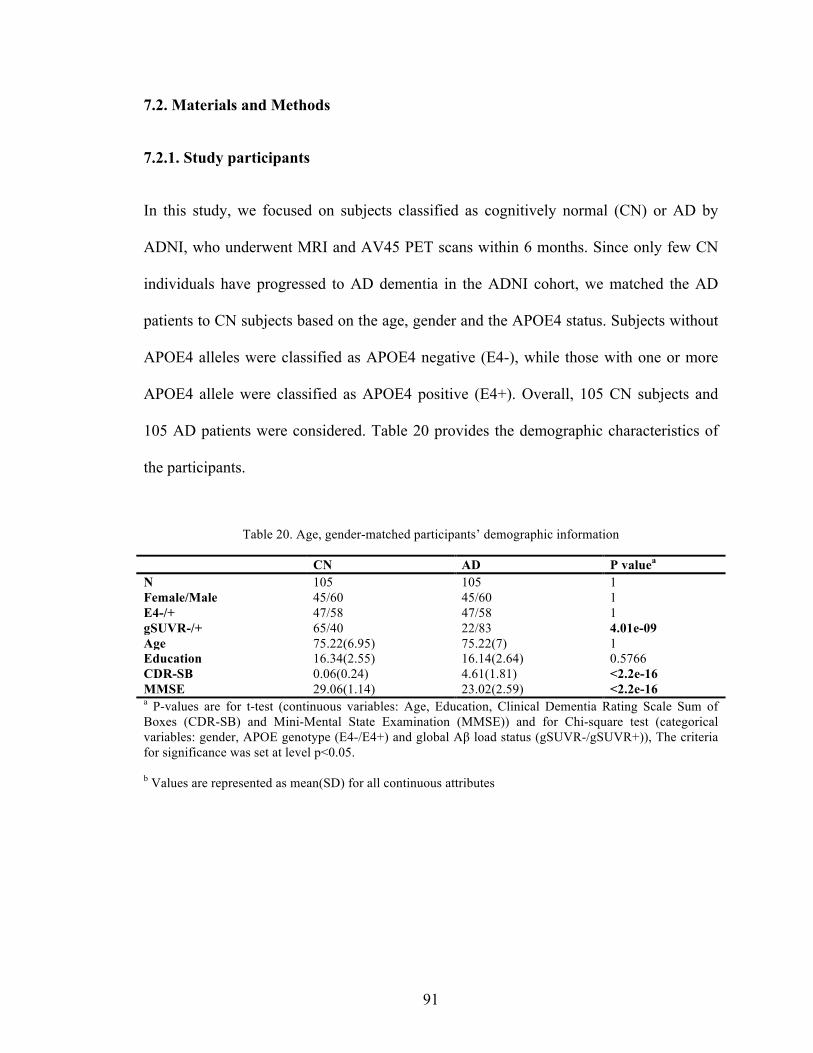
91
7.2. Materials and Methods
7.2.1. Study participants
In this study, we focused on subjects classified as cognitively normal (CN) or AD by
ADNI, who underwent MRI and AV45 PET scans within 6 months. Since only few CN
individuals have progressed to AD dementia in the ADNI cohort, we matched the AD
patients to CN subjects based on the age, gender and the APOE4 status. Subjects without
APOE4 alleles were classified as APOE4 negative (E4-), while those with one or more
APOE4 allele were classified as APOE4 positive (E4+). Overall, 105 CN subjects and
105 AD patients were considered. Table 20 provides the demographic characteristics of
the participants.
Table 20. Age, gender-matched participants’ demographic information
CN AD P valuea N 105 105 1 Female/Male 45/60 45/60 1 E4-/+ 47/58 47/58 1 gSUVR-/+ 65/40 22/83 4.01e-09 Age 75.22(6.95) 75.22(7) 1 Education 16.34(2.55) 16.14(2.64) 0.5766 CDR-SB 0.06(0.24) 4.61(1.81) <2.2e-16 MMSE 29.06(1.14) 23.02(2.59) <2.2e-16 a P-values are for t-test (continuous variables: Age, Education, Clinical Dementia Rating Scale Sum of Boxes (CDR-SB) and Mini-Mental State Examination (MMSE)) and for Chi-square test (categorical variables: gender, APOE genotype (E4-/E4+) and global Aβ load status (gSUVR-/gSUVR+)), The criteria for significance was set at level p<0.05. b Values are represented as mean(SD) for all continuous attributes
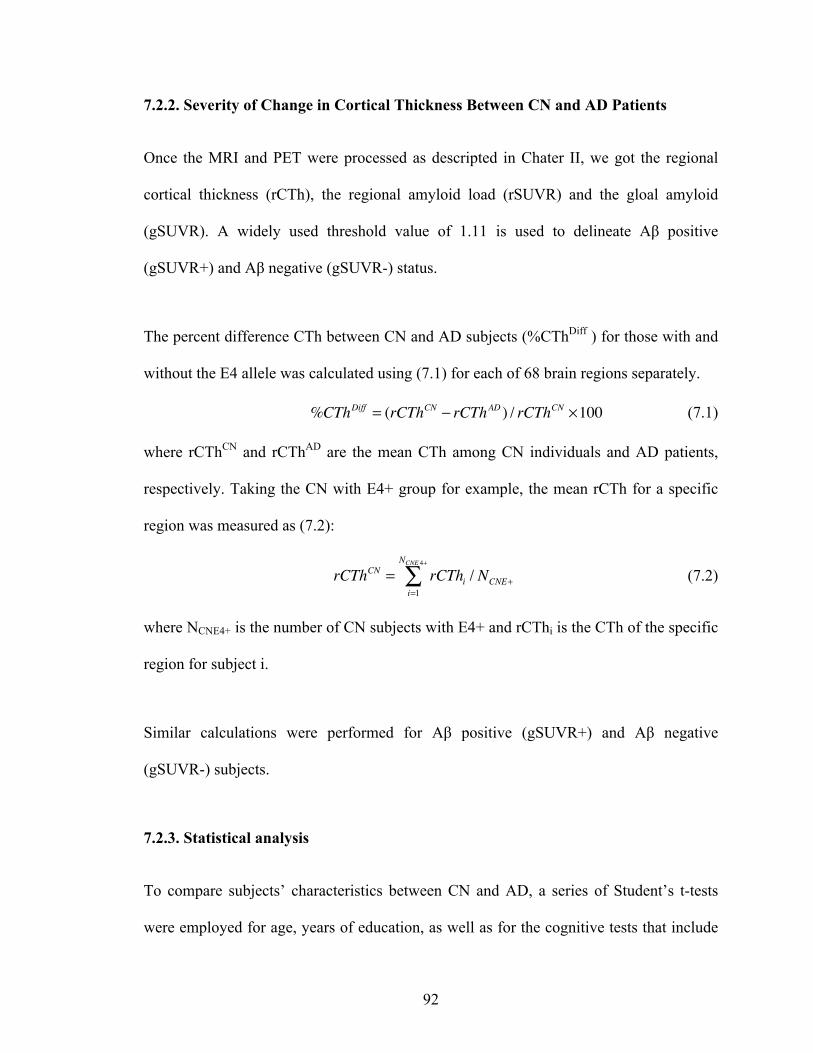
92
7.2.2. Severity of Change in Cortical Thickness Between CN and AD Patients
Once the MRI and PET were processed as descripted in Chater II, we got the regional
cortical thickness (rCTh), the regional amyloid load (rSUVR) and the gloal amyloid
(gSUVR). A widely used threshold value of 1.11 is used to delineate Aβ positive
(gSUVR+) and Aβ negative (gSUVR-) status.
The percent difference CTh between CN and AD subjects (%CThDiff ) for those with and
without the E4 allele was calculated using (7.1) for each of 68 brain regions separately.
%CThDiff = (rCThCN − rCThAD ) / rCThCN ×100 (7.1)
where rCThCN and rCThAD are the mean CTh among CN individuals and AD patients,
respectively. Taking the CN with E4+ group for example, the mean rCTh for a specific
region was measured as (7.2):
rCThCN = rCThii=1
NCNE 4+
∑ / NCNE+ (7.2)
where NCNE4+ is the number of CN subjects with E4+ and rCThi is the CTh of the specific
region for subject i.
Similar calculations were performed for Aβ positive (gSUVR+) and Aβ negative
(gSUVR-) subjects.
7.2.3. Statistical analysis
To compare subjects’ characteristics between CN and AD, a series of Student’s t-tests
were employed for age, years of education, as well as for the cognitive tests that include

93
Mini-Mental State Examination (MMSE) and Clinical Dementia Rating-Sum of Boxes
(CDR-SB); while the Chi-square test was used to account for gender, APOE4 status and
global amyloid load status.
The association between %CThDiff and rCThCN across 68 cortical regions was
examined using the linear regression, as well as Pearson correlation, separately for E4+
and E4- participants. The comparative strength of the magnitude between these
correlations was examined using the two-tailed Fisher’s z transformation.
A similar set of procedures was applied to examine the magnitude of correlations
between gSUVR+ and gSUVR-.
The potential effect of rSUVRCN on the relationship between rCThCN and %CThDiff
was evaluated by employing the Pearson Partial Correlation and multiple linear
regression models with simultaneous adjustment of predictors, i.e. rCThCN and
rSUVRCN.
All statistical analyses were performed using R software (R 3.3.3) [83] and the statistical
significance level was set at 0.05.
7.3. Results
As shown in Table 20, there was no significant difference between CN and AD subjects,
with regards to age, gender, the frequency of E4+ or years of education. However, the

94
frequency of gSUVR+ was higher among AD than CN subjects. Table 21 and Table 22
provide the mean regional CThs for the CN and AD groups, %CThDiff and the
rSUVRCN in the left hemisphere for E4+ and E4- subjects, respectively.
7.3.1. Associations between rCThCN and Regional %CThDiff for E4+ and E4-
Subjects
As can be observed from Table 23 and Fig. 21, results indicate that greater rCThCN is
associated with greater %CThDiff, both before (r = 0.639, p-value < 0.001 for E4+; r =
0.768, p < 0.001 for E4-) and after (r = 0.521, p < 0.001 for E4+; r = 0.694, p < 0.001 for
E4-) adjusting for the effect of rSUVRCN.
We compared the magnitude of the Pearson correlation coefficients for E4+ versus E4-
groups using Fisher’s z-transformation. Results showed no difference in the magnitude of
the correlation coefficient between the E4+ and E4- groups (z = -1.469; p = 0.142).

95
Table 21. CTh in the CN and AD Groups, % mean differences between CN and AD groups (%CThDiff) and regional Aβ load (rSUVRCN), for E4+ subjects in the left hemisphere
ROI E4+ rCThCN rCThAD %CThDiff rSUVRCN
entorhinal 3.38(.35)a 2.60(.47) 23.08% 0.89(.08) parahippocampal 2.69(.35) 2.31(.37) 14.13% 0.96(.11) temporalpole 3.58(.31) 3.11(.48) 13.13% 0.94(.14) middletemporal 2.71(.17) 2.44(.23) 9.96% 1.14(.21) superiortemporal 2.59(.19) 2.35(.19) 9.27% 1.11(.19) fusiform 2.62(.17) 2.38(.19) 9.16% 1.11(.15) inferiortemporal 2.67(.16) 2.44(.26) 8.61% 1.13(.20) isthmuscingulate 2.36(.22) 2.16(.20) 8.47% 1.24(.19) inferiorparietal 2.21(.18) 2.05(.19) 7.24% 1.23(.25) bankssts 2.32(.17) 2.16(.20) 6.90% 1.4(.24) precuneus 2.15(.17) 2.01(.15) 6.51% 1.25(.25) lateraloccipital 2.02(.17) 1.91(.19) 5.45% 1.17(.18) supramarginal 2.34(.17) 2.22(.15) 5.13% 1.19(.21) superiorparietal 1.99(.17) 1.89(.15) 5.03% 1.17(.21) insula 2.93(.17) 2.83(.18) 3.41% 1.15(.17) superiorfrontal 2.49(.16) 2.41(.17) 3.21% 1.15(.21) transversetemporal 2.19(.28) 2.12(.21) 3.20% 1.18(.20) caudalmiddlefrontal 2.34(.18) 2.28(.17) 2.56% 1.24(.20) posteriorcingulate 2.40(.19) 2.34(.17) 2.50% 1.30(.23) parsorbitalis 2.54(.23) 2.48(.25) 2.36% 1.09(.20) cuneus 1.72(.14) 1.68(.14) 2.33% 1.14(.14) rostralmiddlefrontal 2.15(.15) 2.1(.15) 2.33% 1.23(.25) medialorbitofrontal 2.28(.17) 2.23(.14) 2.19% 1.11(.22) lingual 1.83(.14) 1.79(.14) 2.19% 1.06(.11) postcentral 1.87(.17) 1.83(.14) 2.14% 1.09(.15) parsopercularis 2.39(.14) 2.34(.15) 2.09% 1.2(.20) lateralorbitofrontal 2.48(.16) 2.43(.19) 2.02% 1.19(.19) parstriangularis 2.23(.18) 2.19(.15) 1.79% 1.21(.22) precentral 2.33(.22) 2.29(.17) 1.72% 1.16(.13) caudalanteriorcingulate 2.74(.33) 2.71(.39) 1.09% 1.30(.21) rostralanteriorcingulate 2.79(.31) 2.76(.29) 1.08% 1.26(.24) frontalpole 2.55(.27) 2.56(.29) -0.39% 1.01(.24) pericalcarine 1.48(.14) 1.49(.13) -0.68% 1.27(.18) paracentral 2.17(.17) 2.19(.17) -0.92% 1.19(.18) a Values are represented as mean(sd). CTh unit: millimeter (mm).

96
Table 22. CTh in the CN and AD Groups, % mean differences between CN and AD groups (%CThDiff) and regional Aβ load (rSUVRCN), for E4- subjects in the left hemisphere
ROI E4- rCThCN rCThCN rCThCN rCThCN
entorhinal 3.30(.33)a 3.30(.33) 3.30(.33) 3.30(.33) parahippocampal 2.62(.38) 2.62(.38) 2.62(.38) 2.62(.38) temporalpole 3.52(.39) 3.52(.39) 3.52(.39) 3.52(.39) middletemporal 2.65(.21) 2.65(.21) 2.65(.21) 2.65(.21) superiortemporal 2.54(.23) 2.54(.23) 2.54(.23) 2.54(.23) fusiform 2.55(.18) 2.55(.18) 2.55(.18) 2.55(.18) inferiortemporal 2.63(.16) 2.63(.16) 2.63(.16) 2.63(.16) isthmuscingulate 2.27(.22) 2.27(.22) 2.27(.22) 2.27(.22) inferiorparietal 2.18(.18) 2.18(.18) 2.18(.18) 2.18(.18) bankssts 2.27(.20) 2.27(.20) 2.27(.20) 2.27(.20) precuneus 2.12(.19) 2.12(.19) 2.12(.19) 2.12(.19) lateraloccipital 1.95(.15) 1.95(.15) 1.95(.15) 1.95(.15) supramarginal 2.27(.19) 2.27(.19) 2.27(.19) 2.27(.19) superiorparietal 1.96(.20) 1.96(.20) 1.96(.20) 1.96(.20) insula 2.93(.19) 2.93(.19) 2.93(.19) 2.93(.19) superiorfrontal 2.46(.20) 2.46(.20) 2.46(.20) 2.46(.20) transversetemporal 2.13(.26) 2.13(.26) 2.13(.26) 2.13(.26) caudalmiddlefrontal 2.33(.20) 2.33(.20) 2.33(.20) 2.33(.20) posteriorcingulate 2.40(.18) 2.40(.18) 2.40(.18) 2.40(.18) parsorbitalis 2.52(.23) 2.52(.23) 2.52(.23) 2.52(.23) cuneus 1.68(.15) 1.68(.15) 1.68(.15) 1.68(.15) rostralmiddlefrontal 2.16(.16) 2.16(.16) 2.16(.16) 2.16(.16) medialorbitofrontal 2.29(.15) 2.29(.15) 2.29(.15) 2.29(.15) lingual 1.82(.13) 1.82(.13) 1.82(.13) 1.82(.13) postcentral 1.84(.17) 1.84(.17) 1.84(.17) 1.84(.17) parsopercularis 2.36(.19) 2.36(.19) 2.36(.19) 2.36(.19) lateralorbitofrontal 2.46(.15) 2.46(.15) 2.46(.15) 2.46(.15) parstriangularis 2.23(.18) 2.23(.18) 2.23(.18) 2.23(.18) precentral 2.3(.26) 2.3(.26) 2.3(.26) 2.3(.26) caudalanteriorcingulate 2.63(.33) 2.63(.33) 2.63(.33) 2.63(.33) rostralanteriorcingulate 2.81(.28) 2.81(.28) 2.81(.28) 2.81(.28) frontalpole 2.6(.29) 2.6(.29) 2.6(.29) 2.6(.29) pericalcarine 1.47(.14) 1.47(.14) 1.47(.14) 1.47(.14) paracentral 2.16(.23) 2.16(.23) 2.16(.23) 2.16(.23) a Values are represented as mean(sd). CTh unit: millimeter (mm).

97
Fig. 21. Plot of rCThCN and %CThDiff with the estimated linear regression model for the E4+ and E4- groups. R is the correlation coefficient for the Pearson correlation; R_PPC is the correlation coefficient for the Pearson Partial Correlation, adjusting for rSUVRCN. Abbreviations: bankssts, banks of the superior temporal sulcus; CAC, caudal anterior cingulate; CMF, caudal middle frontal; ERC, entorhinal cortex; IP, inferior parietal; IT, inferior temporal; IC, isthmus cingulate; LO, lateral occipital; LOF, lateral orbitofrontal; MOF, medial orbitofrontal; MT, middle temporal; PHG, parahippocampal; POP, pars opercularis; POB, pars orbitalis; PTG, pars triangularis; PC, posterior cingulate; RAC, rostral anterior cingulate; RMF, rostral middle frontal; SF, superior frontal; SP, superior parietal; ST, superior temporal; SM, supramarginal; FP, frontal pole; TP, temporal pole; TT, transverse temporal. Except for the ERC, only ROIs in the left hemisphere were labeled since the similar patterns are observed in the right hemisphere.
98
Table 23. Associations of rCThCN with %CThDiff before and after separating out the effect of rSUVRCN
Linear Regression Modela Pearson Correlation
PPCb Intercept rCThCN
E4+ Coefficient -12.931 7.228 0.639 0.521 Pvaluec 5.10e-06 *** 4.49e-09 *** 4.487e-09*** 6.245e-06*** E4- Coefficient -13.803 7.779 0.768 0.694 Pvalue 7.49e-10 *** 2.25e-14 *** 2.255e-14*** 7.748e-11*** a Linear regression model: %CThDiff =α + βrCThrCTh
CN b PPC, Pearson Partial Correlation of rCThCN and regional %CThDiff, correcting for rSUVRCN
c p-value: *p<.05; **p< .01; ***p< .001
7.3.2. Effects of rCThCN and rSUVRCN on %CThDiff
When including the interaction term rCThCN × rSUVRCN in the multiple linear regression
model %CThDiff =α + βrCThrCTh
CN + βrSUVRrSUVRCN + βCTh⋅SUVRrCTh
CN × rSUVRCN, all variance
inflation factors (VIFs) were larger than 10 (85.8/101.8, 30.4/30.2, and 69.0/81.2 for
rCThCN, rSUVRCN, and rCThCN × rSUVRCN, and for E4+/E4-, respectively), indicating a
very high level of multicollinearity. Thus, we excluded the interaction term in the linear
regression study.
As depicted in Table 24, both rCThCN and rSUVRCN were independent significant
predictors of %CThDiff in both E4+ and E4- subjects. Specifically, standardized beta
coefficients showed greater explanatory power for rCThCN than rSUVRCN in both E4+
(βrCTh=2.357, βrSUVR=-1.563) and E4- (βrCTh=2.594, βrSUVR=-1.399) groups.

99
The results shown in Fig. 22 and Table 24 reveal a negative relationship between the
rSUVRCN and the %CThDiff, which was opposite to the rCThCN. Specifically, regions with
the greatest %CThDiff were aggregated in regions such as ERC (23.08%/18.79%, for
E4+/E4- group), parahippocampal gyrus (14.13%/9.92%), and temporal pole
(13.13%/12.50%), which also had the greatest rCThCN (3.38mm/3.30mm,
2.69mm/2.62mm, 3.58mm/3.52mm, for ERC, parahippocampal gyrus and temporal pole,
respectively). However, these regions tended to have the lowest rSUVRCN (0.89/0.87,
0.96/0.92, 0.94/0.88). In contrast, rCThCN was lowest in the pericalcarine, cuneus,
postcentral, precuneus, and superior parietal regions, which also had the least %CThDiff
but the highest rSUVRCN (Table 21 and Table 22).
Table 24. Effects of rCThCN and rSUVRCN on %CThDiff a
Intercept rCThCN rSUVRCN adjust R2 E4+ Coefficients 5.71 2.14b -1.53 0.458 p-valuec < 2e-16 *** 1.36e-05 *** 0.00133 ** 8.28e-10*** E4- Coefficients 4.66 2.27 -1.35 0.598 p-value < 2e-16 *** 4.08e-08 *** 0.000445 *** 5.01e-14*** a Multiple regression model: %CThDiff =α + βrCThrCTh
CN + βrSUVRrSUVRCN
b Using normalized values of rCThCN and rSUVRCN (mean = 0 and SD = 1) in the model, thus, the coefficient is the adjusted beta weight. c p-value: *p<.05; **p< .01; ***p< .001

100
7.3.3 Associations between rCThCN and Regional %CThDiff for gSUVR+ and
gSUVR- Subjects
The obtained correlation coefficients were 0.613 for the gSUVR+ group and 0.831 for the
gSUVR- group, which showed significant difference using the Fisher’s z-test (z = -
2.724; p =0.0065) (Fig. 23).
7.4. Discussion
The regional CTh has been found to vary considerably across regions in human and
primate brains, with primary sensory cortices being thinner than motor regions, which in
turn are thinner than association cortices [151]. Normal aging is accompanied by global
as well as regional structural changes. Both CTh and volumetric measures have
demonstrated that the prefrontal cortex and to a lesser extent the parietal cortex, are
sensitive to age-related decline [149, 152, 153]. In the current study, the age-related
change in brain atrophy was accounted for using the age-equivalent CN and the AD
group from the ADNI sample to examine those factors that pertained to selective
vulnerability for neurodegeneration associated with Alzheimer’s disease.
Our main findings are that: (1) regions with the greatest CTh at the CN stage are
aggregated in regions which have been found to be most vulnerable to neurodegeneration
in AD, namely regions in the medial temporal lobe, including the temporal pole, ERC,
parahippocampal gyrus, fusiform and the middle and inferior temporal gyrus; (2) regions
with the lowest CTh in the CN stage were aggregated in regions which tend to be least

101
vulnerable to neurodegeneration, namely the pericalcarine region, cuneus and the
postcentral gyrus; (3) %CThDiff was positively correlated to rCThCN, even after adjusting
for the effect of rSUVRCN; (4) rCThCN showed greater explanatory power for %CThDiff
than rSUVRCN; (5) there were no overall effect of the APOE4 genotype on the
association between the rCThCN and %CThDiff; (6) the global Aβ load negative patients
showed stronger effect on the association between the rCThCN and %CThDiff than the
amyloid positive subjects.
Regions such as the ERC and the temporal pole had CTh which were between 3.3 and
4mm in the CN stage and this CTh was reduced by 12% to 24% in the AD stage; whereas
regions such as the pericalcarine region and the postcentral gyrus had CTh which were
between 1.5 to 2 mm in the CN stage and were reduced by 0 to 5% in the AD stage
(Table 21, Table 22, and Fig 21). These findings suggest that greater CTh in the CN stage
may be a potential marker of greater vulnerability to the subsequent neurodegeneration
due to AD.
These findings initially appear divergent with a study by Sabuncu et al. on the ADNI
population, which examined the association of a polygenic risk score to CTh in CN
subjects and showed that a higher polygenic risk score was associated with decreased
CTh among seven AD vulnerable regions [154]. However, a further examination of the
associations between the polygenic risk score and CTh in individual studied regions,
showed that among these seven regions, the region which is most vulnerable to
neurodegeneration (23.78% thinning from CN to AD for E4+ in our sample) (Table 21),

102
namely the ERC, which has the greatest CTh among the seven region, showed no
association to the polygenic risk score. In contrast, the posterior cingulate region, which
was the only individual region showing a significant association between CTh and the
polygenic risk score, was the least vulnerable of the seven regions to neurodegeneration
(%CThDiff = 2.5% for E4+) and had the least CTh (Table 21). As such, the results of the
study by Sabuncu et al are not inconsistent with the notion that greater CTh in the CN
stage is associated with greater vulnerability to neurodegeneration.
The medial temporal lobe regions, including the ERC and parahippocampal gyrus receive
highly processed input from every sensory modality, as well as input relating to ongoing
cognitive processes. This information remains at least partially segregated among the
different sensory visual, auditory olfactory, gustatory and tactile information from the
neocortex and distribute it in a coded fashion to the hippocampus. The superficial layers
of the ERC project to the dentate gyrus and hippocampus, with Layer II projecting
primarily to the dentate gyrus and hippocampal region CA3, and layer III projecting
primarily to hippocampal region CA1 and the subiculum. Spatially sensitive cells in layer
II of the ERC have a crucial role in many spatially complex operations, including
navigation and judging speed and accuracy of movements [155-159].

103
Fig. 22. Plot of rSUVRCN and %CThDiff with the estimated linear regression model for the E4+ and E4- groups. R is the correlation coefficient for the Pearson correlation, R_PPC is the correlation coefficient for the Pearson Partial Correlation, correcting for the rCThCN. Only ROIs in the left hemisphere were labeled, since results were similar for the left and the right hemisphere. Abbreviations: bankssts, banks of the superior temporal sulcus; CAC, caudal anterior cingulate; CMF, caudal middle frontal; ERC, entorhinal cortex; IP, inferior parietal; IT, inferior temporal; IC, isthmus cingulate; LO, lateral occipital; LOF, lateral orbitofrontal; MOF, medial orbitofrontal; MT, middle temporal; PHG, parahippocampal; POP, pars opercularis; POB, pars orbitalis; PTG, pars triangularis; PC, posterior cingulate; RAC, rostral anterior cingulate; RMF, rostral middle frontal; SF, superior frontal; SP, superior parietal; ST, superior temporal; SM, supramarginal; FP, frontal pole; TP, temporal pole; TT, transverse temporal.

104
Fig. 23. Plot of rCThCN and %CThDiff with the estimated linear regression model for the global amyloid positive (gSUVR+) and negative (gSUVR-) groups. R is the correlation coefficient for the Pearson correlation; R_PPC is the correlation coefficient for the Pearson Partial Correlation, adjusting for rSUVRCN. Only ROIs in the left hemisphere were labeled. Abbreviations: bankssts, banks of the superior temporal sulcus; CAC, caudal anterior cingulate; CMF, caudal middle frontal; ERC, entorhinal cortex; IP, inferior parietal; IT, inferior temporal; IC, isthmus cingulate; LO, lateral occipital; LOF, lateral orbitofrontal; MOF, medial orbitofrontal; MT, middle temporal; PHG, parahippocampal; POP, pars opercularis; POB, pars orbitalis; PTG, pars triangularis; PC, posterior cingulate; RAC, rostral anterior cingulate; RMF, rostral middle frontal; SF, superior frontal; SP, superior parietal; ST, superior temporal; SM, supramarginal; FP, frontal pole; TP, temporal pole; TT, transverse temporal.

105
Greater CTh in the ERC and perirhinal cortex most likely represents the greater number
of neurons, synapses and complexity of operations which are routinely performed by
these brain regions [160]. Dickerson et al. showed that greater CTh in medial temporal
regions was associated with better performance on verbal memory tasks and greater
activation in these regions on functional MRI scans, in elderly CN subjects [161].
Progression of neurodegenerative pathology appears to occur preferentially in brain
regions with the greatest connectivity and trafficking. For example, Seeley et al. have
shown a direct link between intrinsic connectivity and gray matter structure across
healthy individuals and have described nodes within each functional network which
“exhibited tightly correlated gray matter volumes”. They concluded that their findings
suggest that “human neural networks can be defined by synchronous baseline activity,
and selective vulnerability to neurodegenerative illness” [162]. The aggregation of
misfolded disease proteins arises inside small, selectively vulnerable neuron populations
in certain brain regions [163-165] and, as evidenced in human spongiform
encephalopathies, conformational changes in misfolded prion protein results in disease
propagation along the most active transsynaptic connections [166]. Neuropathological
[11], neuroimaging [167, 168], and transgenic animal models [169], all suggest that
neurodegeneration may relate to neural network dysfunction [168, 170], and selective
vulnerability of specific brain regions may represent their status as hubs in very active
networks.
In this study we have also shown that regions, such as the ERC, which show the greatest
propensity for neurodegeneration has the lowest regional Aβ load, whereas many regions
106
with relatively high Aβ deposition, show the lowest propensity for atrophy. Although
using multiple regression analyses, Aβ burden was found to have a significant effect on
neurodegeneration [80], this effect was much smaller in comparison to the association of
CTh in the CN stage with neurodegeneration. Specifically, the most AD prone regions,
such as ERC, parahippocampal, and temporal pole [129-132], had the greatest atrophy
and the greatest baseline CTh, but the least Aβ load. Conversely, other AD vulnerable
regions, such as posterior cingulate, precuneus, inferior parietal, and isthmus cingulate,
experienced lower atrophy but the Aβ burden in these regions was higher. This
discrepancy between regional Aβ deposition and regional reduction of CTh in patients
with AD has been described previously [171]. These findings are consistent with the
prevailing view that Aβ deposition initiates or acts as a catalyst for the neurodegenerative
process but that the correlation of such process with tau-protein deposition and tau
associated neurofibrillary tangles concentration is much stronger than that with Aβ
deposition [172].
In addition, the significant association of larger rCThCN and greater atrophy after ruling
out the effect of regional Aβ burden agrees with the findings in a previous study [136],
which may add credence to the belief that Aβ does not play a leading role in brain
atrophy [172]. Instead, tau pathology, inflammation, or disturbance in axonal transport
processes may contribute to the ongoing neurodegeneration. However, the impact of
APOE4 carrier status on neurodegeneration was not significant in comparison to the risk
associated with regional CTh. Both the E4+ and E4- subjects showed a strong association
between CTh in the CN stage and the propensity for neurodegeneration (Fig 21).

107
The main weakness of this study is that it is a cross-sectional analysis. Unfortunately, in
the ADNI cohort it is unlikely that a sufficient number of CN individuals will progress to
AD dementia to actually relate original cortical thickness to rate of neurodegenerative
regions in AD-related areas longitudinally, especially when accounting for the APOE4
carrier status and the availability of AV45 PET scans corresponding to the original MRI.
Longitudinal studies conducted on clinically normal individuals who have progressed to
AD or were Aβ positive at baseline, have shown that mean CTh of AD vulnerable regions
at baseline are thinner in comparison to the same regions among individuals who did not
progress to AD, or were Aβ negative at baseline. However, unlike the current
investigation, these studies do not directly address the important question of whether CTh
among individual regions is related to vulnerability to neurodegeneration [79, 173]. The
main strength of this cross-sectional study is the availability of Aβ biomarkers and APOE
genotypes in this ADNI cohort, which allow various factors to be assessed in this analysis
of selective vulnerability. Besides, considering that aging and AD might have
overlapping effects on the atrophy in specific cortical regions [174, 175], the study based
on the age equivalent CN and AD groups superimposed the AD-specific changes to the
age related progressive atrophy.
7.5. Conclusion
In retrospect, in the present study, there is evidence for a strong positive association
between rCThCN and the severity of neurodegeneration (%CThDiff) in all brain regions.
While we do not have an explanation for the most selective vulnerability for

108
neurodegeneration of brain regions having the greatest CTh in the CN stage, we propose
that, among other factors, greater CTh is associated with higher synaptic density, greater
connectivity and complexity of function, which are factors that have been associated with
a greater propensity to neurodegeneration. Other factors, such as disturbance in axonal
transport, or inflammatory processes, in the presence of plaques and neurofibrillary
tangles may also play a role in mediating the interaction between greater CTh, greater
connectivity and complexity of function and propensity for neurodegeneration. Our
finding also show that regional Aβ load has a comparatively small but significant impact,
but that APOE4 genotype and global Aβ load had no significant impact on the propensity
for neurodegeneration.

109
REFERENCES
[1] R. A. Sperling, P. S. Aisen, L. A. Beckett, D. A. Bennett, S. Craft, A. M. Fagan, et al., "Toward defining the preclinical stages of Alzheimer's disease: recommendations from the National Institute on Aging-Alzheimer's Association workgroups on diagnostic guidelines for Alzheimer's disease," Alzheimers Dement, vol. 7, pp. 280-92, May 2011.
[2] M. S. Albert, S. T. DeKosky, D. Dickson, B. Dubois, H. H. Feldman, N. C. Fox, et al., "The diagnosis of mild cognitive impairment due to Alzheimer's disease: Recommendations from the National Institute on Aging-Alzheimer's Association workgroups on diagnostic guidelines for Alzheimer's disease," Alzheimers & Dementia, vol. 7, pp. 270-279, May 2011.
[3] G. M. McKhann, D. S. Knopman, H. Chertkow, B. T. Hyman, C. R. Jack, C. H. Kawas, et al., "The diagnosis of dementia due to Alzheimer's disease: Recommendations from the National Institute on Aging-Alzheimer's Association workgroups on diagnostic guidelines for Alzheimer's disease," Alzheimers & Dementia, vol. 7, pp. 263-269, May 2011.
[4] C. R. Jack, M. S. Albert, D. S. Knopman, G. M. McKhann, R. A. Sperling, M. C. Carrillo, et al., "Introduction to the recommendations from the National Institute on Aging-Alzheimer's Association workgroups on diagnostic guidelines for Alzheimer's disease," Alzheimers & Dementia, vol. 7, pp. 257-262, May 2011.
[5] A. Alzheimer's, "2012 Alzheimer's disease facts and figures," Alzheimers Dement, vol. 8, pp. 131-68, 2012.
[6] A. Assoc, "Alzheimer's Association Report 2015 Alzheimer's disease facts and figures," Alzheimers & Dementia, vol. 11, pp. 332-384, Mar 2015.
[7] L. E. H. Jennifer Weuve, Paul A. Scherr, Denis A. Evans, "Deaths in the United States among persons with Alzheimer's disease (2010-2050)," Alzheimers Dement, vol. 10, p. 7, March 2014.
[8] D. J. Selkoe, "The molecular pathology of Alzheimer's disease," Neuron, vol. 6, pp. 487-98, Apr 1991.
[9] B. T. Hyman, C. H. Phelps, T. G. Beach, E. H. Bigio, N. J. Cairns, M. C. Carrillo, et al., "National Institute on Aging-Alzheimer's Association guidelines for the neuropathologic assessment of Alzheimer's disease," Alzheimers Dement, vol. 8, pp. 1-13, Jan 2012.
[10] C. R. Jack, Jr., D. S. Knopman, W. J. Jagust, R. C. Petersen, M. W. Weiner, P. S. Aisen, et al., "Tracking pathophysiological processes in Alzheimer's disease: an updated hypothetical model of dynamic biomarkers," Lancet Neurol, vol. 12, pp. 207-16, Feb 2013.

110
[11] H. Braak and E. Braak, "Neuropathological Staging of Alzheimer-Related Changes," Acta Neuropathologica, vol. 82, pp. 239-259, 1991.
[12] T. GomezIsla, H. L. West, G. W. Rebeck, S. D. Harr, J. H. Growdon, J. J. Locascio, et al., "Clinical and pathological correlates of apolipoprotein E epsilon 4 in Alzheimer's disease," Annals of Neurology, vol. 39, pp. 62-70, Jan 1996.
[13] A. Drzezga, T. Grimmer, G. Henriksen, M. Muehlau, R. Perneczky, I. Miederer, et al., "Effect of APOE genotype on amyloid plaque load and gray matter volume in Alzheimer disease," Neurology, vol. 72, pp. 1487-1494, Apr 28 2009.
[14] A. M. Cataldo, C. M. Peterhoff, J. C. Troncosco, T. Gomez-Isla, B. T. Hyman, and R. A. Nixon, "Endocytic pathway abnormalities precede amyloid beta deposition in sporadic Alzheimer's disease and Down syndrome - Differential effects of APOE genotype and presenilin mutations," American Journal of Pathology, vol. 157, pp. 277-286, Jul 2000.
[15] M. M. Mielke, M. M. Machulda, C. E. Hagen, T. J. Christianson, R. O. Roberts, D. S. Knopman, et al., "Influence of amyloid and APOE on cognitive performance in a late middle-aged cohort," Alzheimers & Dementia, vol. 12, pp. 281-291, Mar 2016.
[16] J. Kim, J. M. Basak, and D. M. Holtzman, "The Role of Apolipoprotein E in Alzheimer's Disease," Neuron, vol. 63, pp. 287-303, Aug 13 2009.
[17] K. Horsburgh, M. O. McCarron, F. White, and J. A. R. Nicoll, "The role of apolipoprotein E in Alzheimer's disease, acute brain injury and cerebrovascular disease: evidence of common mechanisms and utility of animal models," Neurobiology of Aging, vol. 21, pp. 245-255, Mar-Apr 2000.
[18] S. G. Potkin, G. Guffanti, A. Lakatos, J. A. Turner, F. Kruggel, J. H. Fallon, et al., "Hippocampal Atrophy as a Quantitative Trait in a Genome-Wide Association Study Identifying Novel Susceptibility Genes for Alzheimer's Disease," Plos One, vol. 4, Aug 7 2009.
[19] Y. He, C. Li, Y. Yang, Y. Z. Li, Y. Wang, H. Yang, et al., "Meta-analysis of the rs2075650 polymorphism and risk of Alzheimer disease," Aging Clinical and Experimental Research, vol. 28, pp. 805-811, Oct 2016.
[20] D. Harold, R. Abraham, P. Hollingworth, R. Sims, A. Gerrish, M. L. Hamshere, et al., "Genome-wide association study identifies variants at CLU and PICALM associated with Alzheimer's disease (vol 41, pg 1088, 2009)," Nature Genetics, vol. 41, pp. 1156-1156, Oct 2009.
[21] M. W. Logue, M. Schu, B. N. Vardarajan, J. Buros, R. C. Green, R. C. P. Go, et al., "A Comprehensive Genetic Association Study of Alzheimer Disease in African Americans," Archives of Neurology, vol. 68, pp. 1569-1579, Dec 2011.

111
[22] K. R. Murphy, S. M. Landau, K. R. Choudhury, C. A. Hostage, K. S. Shpanskaya, H. I. Sair, et al., "Mapping the effects of ApoE4, age and cognitive status on 18F-florbetapir PET measured regional cortical patterns of beta-amyloid density and growth," Neuroimage, vol. 78, pp. 474-80, Sep 2013.
[23] A. Drzezga, T. Grimmer, G. Henriksen, M. Muhlau, R. Perneczky, I. Miederer, et al., "Effect of APOE genotype on amyloid plaque load and gray matter volume in Alzheimer disease," Neurology, vol. 72, pp. 1487-94, Apr 28 2009.
[24] A. S. Fleisher, K. Chen, X. Liu, N. Ayutyanont, A. Roontiva, P. Thiyyagura, et al., "Apolipoprotein E epsilon4 and age effects on florbetapir positron emission tomography in healthy aging and Alzheimer disease," Neurobiol Aging, vol. 34, pp. 1-12, Jan 2013.
[25] R. A. Sperling, P. S. Aisen, L. A. Beckett, D. A. Bennett, S. Craft, A. M. Fagan, et al., "Toward defining the preclinical stages of Alzheimer's disease: Recommendations from the National Institute on Aging-Alzheimer's Association workgroups on diagnostic guidelines for Alzheimer's disease," Alzheimers & Dementia, vol. 7, pp. 280-292, May 2011.
[26] C. Li, D. A. Loewenstein, R. Duara, M. Cabrerizo, W. Barker, M. Adjouadi, et al., "The Relationship of Brain Amyloid Load and APOE Status to Regional Cortical Thinning and Cognition in the ADNI Cohort," J Alzheimers Dis, vol. 59, pp. 1269-1282, 2017.
[27] C. Fang, C. Li, M. Cabrerizo, A. Barreto, J. Andrian, D. A. Loewenstein, et al., "A Novel Gaussian Discriminant Analysis-based Computer Aided Diagnosis System for Screening Different Stages of Alzheimer's Disease," presented at the IEEE 17th International Conference on Bioinformatics and Bioengineering, Washington D.C, 2017.
[28] C. Fang, C. Li, M. Cabrerizo, A. Barreto, J. Andrian, D. A. Loewenstein, et al., "A Gaussian Discriminant Analysis-based Generative Learning Algorithm for the Early Diagnosis of Mild Cognitive Impairment in Alzheimer's Disease," in 2017 IEEE International Conference on Bioinformatics and Biomedicine, Kansas City, MO, 2017.
[29] H. I. Suk, S. W. Lee, D. G. Shen, and A. s. D. Neuroimaging, "Deep sparse multi-task learning for feature selection in Alzheimer's disease diagnosis," Brain Structure & Function, vol. 221, pp. 2569-2587, Jun 2016.
[30] B. Jie, D. Q. Zhang, B. Cheng, D. G. Shen, and A. s. D. Neuroimaging, "Manifold Regularized Multitask Feature Learning for Multimodality Disease Classification," Human Brain Mapping, vol. 36, pp. 489-507, Feb 2015.
[31] H. Guo, F. Zhang, J. J. Chen, Y. Xu, and J. Xiang, "Machine Learning Classification Combining Multiple Features of A Hyper-Network of fMRI Data in Alzheimer's Disease," Frontiers in Neuroscience, vol. 11, Nov 21 2017.

112
[32] C. Davatzikos, Y. Fan, X. Wu, D. Shen, and S. M. Resnick, "Detection of prodromal Alzheimer's disease via pattern classification of magnetic resonance imaging," Neurobiology of Aging, vol. 29, pp. 514-523, Apr 2008.
[33] S. Alam, G. R. Kwon, J. I. Kim, and C. S. Park, "Twin SVM-Based Classification of Alzheimer's Disease Using Complex Dual-Tree Wavelet Principal Coefficients and LDA," Journal of Healthcare Engineering, 2017.
[34] M. Lopez, J. Ramirez, J. M. Gorriz, D. Salas-Gonzalez, I. Alvarez, F. Segovia, et al., "Automatic tool for Alzheimer's disease diagnosis using PCA and Bayesian classification rules," Electronics Letters, vol. 45, pp. 389-390, Apr 9 2009.
[35] S. Tripathi, S. H. Nozadi, M. Shakeri, and S. Kadoury, "Sub-Cortical Shape Morphology and Voxel-Based Features for Alzheimer's Disease Classification," 2017 Ieee 14th International Symposium on Biomedical Imaging (Isbi 2017), pp. 991-994, 2017.
[36] L. Khedher, I. A. Illan, J. M. Gorriz, J. Ramirez, A. Brahim, and A. Meyer-Baese, "Independent Component Analysis-Support Vector Machine-Based Computer-Aided Diagnosis System for Alzheimer's with Visual Support," Int J Neural Syst, vol. 27, p. 1650050, May 2017.
[37] M. Shakeri, H. Lombaert, and S. Kadoury, "Classification of Alzheimer's Disease Using Discriminant Manifolds of Hippocampus Shapes," Machine Learning Meets Medical Imaging, vol. 9487, pp. 65-73, 2015.
[38] S. Singh, A. Srivastava, L. Mi, R. J. Caselli, K. Chen, D. Goradia, et al., "Deep Learning based Classification of FDG-PET Data for Alzheimers Disease Categories," Proc SPIE Int Soc Opt Eng, vol. 10572, Oct 2017.
[39] R. Guerrero, R. Wolz, A. W. Rao, D. Rueckert, and Adni, "Manifold population modeling as a neuro-imaging biomarker: Application to ADNI and ADNI-GO," Neuroimage, vol. 94, pp. 275-286, Jul 1 2014.
[40] F. Li, L. Tran, K. H. Thung, S. Ji, D. Shen, and J. Li, "A Robust Deep Model for Improved Classification of AD/MCI Patients," IEEE J Biomed Health Inform, vol. 19, pp. 1610-6, Sep 2015.
[41] R. Li, W. Zhang, H. I. Suk, L. Wang, J. Li, D. Shen, et al., "Deep learning based imaging data completion for improved brain disease diagnosis," Med Image Comput Comput Assist Interv, vol. 17, pp. 305-12, 2014.
[42] H. I. Suk, S. W. Lee, D. Shen, and I. Alzheimer's Disease Neuroimaging, "Deep sparse multi-task learning for feature selection in Alzheimer's disease diagnosis," Brain Struct Funct, vol. 221, pp. 2569-87, Jun 2016.

113
[43] M. Shakeri, H. Lombaert, S. Tripathi, and S. Kadoury, "Deep Spectral-Based Shape Features for Alzheimer’s Disease Classification," Cham, 2016, pp. 15-24.
[44] A. Ortiz, J. Munilla, J. M. Gorriz, and J. Ramirez, "Ensembles of Deep Learning Architectures for the Early Diagnosis of the Alzheimer's Disease," Int J Neural Syst, vol. 26, p. 1650025, Nov 2016.
[45] F. C. Morabito, M. Campolo, N. Mammone, M. Versaci, S. Franceschetti, F. Tagliavini, et al., "Deep Learning Representation from Electroencephalography of Early-Stage Creutzfeldt-Jakob Disease and Features for Differentiation from Rapidly Progressive Dementia," International Journal of Neural Systems, vol. 27, Mar 2017.
[46] G. Prasad, S. H. Joshi, T. M. Nir, A. W. Toga, P. M. Thompson, and Adni, "Brain connectivity and novel network measures for Alzheimer's disease classification," Neurobiology of Aging, vol. 36, pp. S121-S131, Jan 2015.
[47] A. Soldan, C. Pettigrew, Y. Lu, M. C. Wang, O. Selnes, M. Albert, et al., "Relationship of medial temporal lobe atrophy, APOE genotype, and cognitive reserve in preclinical Alzheimer's disease," Human Brain Mapping, vol. 36, pp. 2826-2841, Jul 2015.
[48] R. S. Desikan, F. Segonne, B. Fischl, B. T. Quinn, B. C. Dickerson, D. Blacker, et al., "An automated labeling system for subdividing the human cerebral cortex on MRI scans into gyral based regions of interest," Neuroimage, vol. 31, pp. 968-980, Jul 1 2006.
[49] M. Jenkinson, C. F. Beckmann, T. E. Behrens, M. W. Woolrich, and S. M. Smith, "Fsl," Neuroimage, vol. 62, pp. 782-790, Aug 15 2012.
[50] L. Breiman, "Random forests," Machine Learning, vol. 45, pp. 5-32, Oct 2001.
[51] A. Meyer-Lindenberg and D. R. Weinberger, "Intermediate phenotypes and genetic mechanisms of psychiatric disorders," Nature Reviews Neuroscience, vol. 7, pp. 818-827, Oct 2006.
[52] R. Rasetti and D. R. Weinberger, "Intermediate phenotypes in psychiatric disorders," Current Opinion in Genetics & Development, vol. 21, pp. 340-348, Jun 2011.
[53] Gottesman, II and T. D. Gould, "The endophenotype concept in psychiatry: etymology and strategic intentions," Am J Psychiatry, vol. 160, pp. 636-45, Apr 2003.
[54] E. J. Rose and G. Donohoe, "Brain vs Behavior: An Effect Size Comparison of Neuroimaging and Cognitive Studies of Genetic Risk for Schizophrenia," Schizophrenia Bulletin, vol. 39, pp. 518-526, May 2013.
[55] N. K. Batmanghelich, A. V. Dalca, M. R. Sabuncu, G. Polina, and Adni, "Joint modeling of imaging and genetics," Inf Process Med Imaging, vol. 23, pp. 766-77, 2013.
114
[56] M. Vounou, E. Janousova, R. Wolz, J. L. Stein, P. M. Thompson, D. Rueckert, et al., "Sparse reduced-rank regression detects genetic associations with voxel-wise longitudinal phenotypes in Alzheimer's disease," Neuroimage, vol. 60, pp. 700-716, Mar 2012.
[57] N. Filippini, A. Rao, S. Wetten, R. A. Gibson, M. Borrie, D. Guzman, et al., "Anatomically-distinct genetic associations of APOE epsilon4 allele load with regional cortical atrophy in Alzheimer's disease," Neuroimage, vol. 44, pp. 724-8, Feb 01 2009.
[58] S. G. Potkin, J. A. Turner, G. Guffanti, A. Lakatos, J. H. Fallon, D. D. Nguyen, et al., "A Genome-Wide Association Study of Schizophrenia Using Brain Activation as a Quantitative Phenotype," Schizophrenia Bulletin, vol. 35, pp. 96-108, Jan 2009.
[59] J. H. Lee, R. Cheng, N. Graff-Radford, T. Foroud, R. Mayeux, and G. National Institute on Aging Late-Onset Alzheimer's Disease Family Study, "Analyses of the National Institute on Aging Late-Onset Alzheimer's Disease Family Study: implication of additional loci," Arch Neurol, vol. 65, pp. 1518-26, Nov 2008.
[60] Y. Benjamini and Y. Hochberg, "Controlling the False Discovery Rate - a Practical and Powerful Approach to Multiple Testing," Journal of the Royal Statistical Society Series B-Methodological, vol. 57, pp. 289-300, 1995.
[61] K. A. Le Cao, D. Rossouw, C. Robert-Granie, and P. Besse, "A sparse PLS for variable selection when integrating omics data," Stat Appl Genet Mol Biol, vol. 7, p. Article 35, 2008.
[62] E. Le Floch, V. Guillemot, V. Frouin, P. Pinel, C. Lalanne, L. Trinchera, et al., "Significant correlation between a set of genetic polymorphisms and a functional brain network revealed by feature selection and sparse Partial Least Squares," Neuroimage, vol. 63, pp. 11-24, Oct 15 2012.
[63] B. Fischl and A. M. Dale, "Measuring the thickness of the human cerebral cortex from magnetic resonance images," Proc Natl Acad Sci U S A, vol. 97, pp. 11050-5, Sep 26 2000.
[64] B. B. Avants, N. J. Tustison, G. Song, P. A. Cook, A. Klein, and J. C. Gee, "A reproducible evaluation of ANTs similarity metric performance in brain image registration," Neuroimage, vol. 54, pp. 2033-44, Feb 1 2011.
[65] A. Klein and J. Tourville, "101 labeled brain images and a consistent human cortical labeling protocol," Front Neurosci, vol. 6, p. 171, 2012.
[66] J. A. K. Suykens and J. Vandewalle, "Least squares support vector machine classifiers," Neural Processing Letters, vol. 9, pp. 293-300, Jun 1999.

115
[67] H. Chun and S. Keles, "Sparse partial least squares regression for simultaneous dimension reduction and variable selection," J R Stat Soc Series B Stat Methodol, vol. 72, pp. 3-25, Jan 2010.
[68] A. Bakkour, J. C. Morris, and B. C. Dickerson, "The cortical signature of prodromal AD: regional thinning predicts mild AD dementia," Neurology, vol. 72, pp. 1048-55, Mar 24 2009.
[69] Q. Zhou, F. Zhao, Z. P. Lv, C. G. Zheng, W. D. Zheng, L. Sun, et al., "Association between APOC1 Polymorphism and Alzheimer's Disease: A Case-Control Study and Meta-Analysis," Plos One, vol. 9, Jan 31 2014.
[70] R. Ferrari, Y. Wang, J. Vandrovcova, S. Guelfi, A. Witeolar, C. M. Karch, et al., "Genetic architecture of sporadic frontotemporal dementia and overlap with Alzheimer's and Parkinson's diseases," J Neurol Neurosurg Psychiatry, vol. 88, pp. 152-164, Feb 2017.
[71] Q. S. Li, A. R. Parrado, M. N. Samtani, V. A. Narayan, and I. Alzheimer's Disease Neuroimaging, "Variations in the FRA10AC1 Fragile Site and 15q21 Are Associated with Cerebrospinal Fluid Abeta1-42 Level," PLoS One, vol. 10, p. e0134000, 2015.
[72] C. Li, C. Fang, M. Cabrerizo, A. Barreto, J. Andrian, R. Duara, et al., "A Neuroimaging Feature Extraction Model for Imaging Genetics with Application to Alzheimer’s Disease," in IEEE International Conference on Bio-Informatics and Bio-Engineering, Washington D.C, 2017.
[73] C. R. Jack, Jr., H. J. Wiste, S. D. Weigand, D. S. Knopman, P. Vemuri, M. M. Mielke, et al., "Age, Sex, and APOE epsilon4 Effects on Memory, Brain Structure, and beta-Amyloid Across the Adult Life Span," JAMA Neurol, vol. 72, pp. 511-9, May 2015.
[74] P. Vemuri, H. J. Wiste, S. D. Weigand, D. S. Knopman, L. M. Shaw, J. Q. Trojanowski, et al., "Effect of apolipoprotein E on biomarkers of amyloid load and neuronal pathology in Alzheimer disease," Ann Neurol, vol. 67, pp. 308-16, Mar 2010.
[75] R. J. Caselli, A. C. Dueck, D. Osborne, M. N. Sabbagh, D. J. Connor, G. L. Ahern, et al., "Longitudinal modeling of age-related memory decline and the APOE epsilon4 effect," N Engl J Med, vol. 361, pp. 255-63, Jul 16 2009.
[76] J. C. Morris, "The Clinical Dementia Rating (Cdr) - Current Version and Scoring Rules," Neurology, vol. 43, pp. 2412-2414, Nov 1993.
[77] M. F. Folstein, S. E. Folstein, and P. R. McHugh, ""Mini-mental state". A practical method for grading the cognitive state of patients for the clinician," J Psychiatr Res, vol. 12, pp. 189-98, Nov 1975.
116
[78] A. Rey, L' examen clinique en psychologie. Paris: Presses universitaires de France, 1964.
[79] B. C. Dickerson, A. Bakkour, D. H. Salat, E. Feczko, J. Pacheco, D. N. Greve, et al., "The cortical signature of Alzheimer's disease: regionally specific cortical thinning relates to symptom severity in very mild to mild AD dementia and is detectable in asymptomatic amyloid-positive individuals," Cereb Cortex, vol. 19, pp. 497-510, Mar 2009.
[80] J. A. Becker, T. Hedden, J. Carmasin, J. Maye, D. M. Rentz, D. Putcha, et al., "Amyloid-beta associated cortical thinning in clinically normal elderly," Ann Neurol, vol. 69, pp. 1032-42, Jun 2011.
[81] A. D. Joshi, M. J. Pontecorvo, C. M. Clark, A. P. Carpenter, D. L. Jennings, C. H. Sadowsky, et al., "Performance Characteristics of Amyloid PET with Florbetapir F 18 in Patients with Alzheimer's Disease and Cognitively Normal Subjects," Journal of Nuclear Medicine, vol. 53, pp. 378-384, Mar 1 2012.
[82] D. A. Loewenstein, R. E. Curiel, M. T. Greig, R. M. Bauer, M. Rosado, D. Bowers, et al., "A Novel Cognitive Stress Test for the Detection of Preclinical Alzheimer Disease: Discriminative Properties and Relation to Amyloid Load," American Journal of Geriatric Psychiatry, vol. 24, pp. 804-813, Oct 2016.
[83] R Core Team, "R: A language and environment for statistical computing," ed. Vienna, Austria: R Foundation for Statistical Computing, 2017.
[84] J. Q. Trojanowski, H. Vandeerstichele, M. Korecka, C. M. Clark, P. S. Aisen, R. C. Petersen, et al., "Update on the biomarker core of the Alzheimer's Disease Neuroimaging Initiative subjects," Alzheimers & Dementia, vol. 6, pp. 230-238, May 2010.
[85] A. S. Fleisher, K. Chen, X. Liu, A. Roontiva, P. Thiyyagura, N. Ayutyanont, et al., "Using positron emission tomography and florbetapir F18 to image cortical amyloid in patients with mild cognitive impairment or dementia due to Alzheimer disease," Arch Neurol, vol. 68, pp. 1404-11, Nov 2011.
[86] K. A. Ellis, Y. Y. Lim, K. Harrington, D. Ames, A. I. Bush, D. Darby, et al., "Decline in Cognitive Function over 18 Months in Healthy Older Adults with High Amyloid-beta," Journal of Alzheimers Disease, vol. 34, pp. 861-871, 2013.
[87] Y. Y. Lim, K. A. Ellis, D. Ames, D. Darby, K. Harrington, R. N. Martins, et al., "Abeta amyloid, cognition, and APOE genotype in healthy older adults," Alzheimers Dement, vol. 9, pp. 538-45, Sep 2013.
[88] J. L. Whitwell, N. Tosakulwong, S. D. Weigand, M. L. Senjem, V. J. Lowe, J. L. Gunter, et al., "Does amyloid deposition produce a specific atrophic signature in cognitively normal subjects?," Neuroimage-Clinical, vol. 2, pp. 249-257, 2013.

117
[89] M. J. Grothe, M. Ewers, B. Krause, H. Heinsen, S. J. Teipel, and I. Alzheimer's Disease Neuroimaging, "Basal forebrain atrophy and cortical amyloid deposition in nondemented elderly subjects," Alzheimers Dement, vol. 10, pp. S344-53, Oct 2014.
[90] X. Da, J. B. Toledo, J. Zee, D. A. Wolk, S. X. Xie, Y. Ou, et al., "Integration and relative value of biomarkers for prediction of MCI to AD progression: spatial patterns of brain atrophy, cognitive scores, APOE genotype and CSF biomarkers," Neuroimage Clin, vol. 4, pp. 164-73, 2014.
[91] G. Chetelat, R. La Joie, N. Villain, A. Perrotin, V. de La Sayette, F. Eustache, et al., "Amyloid imaging in cognitively normal individuals, at-risk populations and preclinical Alzheimer's disease," Neuroimage-Clinical, vol. 2, pp. 356-365, 2013.
[92] S. Lista, F. G. Garaci, M. Ewers, S. Teipel, H. Zetterberg, K. Blennow, et al., "CSF Abeta1-42 combined with neuroimaging biomarkers in the early detection, diagnosis and prediction of Alzheimer's disease," Alzheimers Dement, vol. 10, pp. 381-92, May 2014.
[93] R. Duara, D. A. Loewenstein, Q. Shen, W. Barker, E. Potter, D. Varon, et al., "Amyloid positron emission tomography with (18)F-flutemetamol and structural magnetic resonance imaging in the classification of mild cognitive impairment and Alzheimer's disease," Alzheimers Dement, vol. 9, pp. 295-301, May 2013.
[94] M. J. Grothe, S. J. Teipel, and A. D. N. Initia, "Spatial Patterns of Atrophy, Hypometabolism, and Amyloid Deposition in Alzheimer's Disease Correspond to Dissociable Functional Brain Networks," Human Brain Mapping, vol. 37, pp. 35-53, Jan 2016.
[95] L. G. Apostolova, K. S. Hwang, O. Kohannim, D. Avila, D. Elashoff, C. R. Jack, et al., "ApoE4 effects on automated diagnostic classifiers for mild cognitive impairment and Alzheimer's disease," Neuroimage-Clinical, vol. 4, pp. 461-472, 2014.
[96] Y. Liu, T. Paajanen, E. Westman, L. O. Wahlund, A. Simmons, C. Tunnard, et al., "Effect of APOE epsilon4 allele on cortical thicknesses and volumes: the AddNeuroMed study," J Alzheimers Dis, vol. 21, pp. 947-66, 2010.
[97] H. Lemaitre, F. Crivello, C. Dufouil, B. Grassiot, C. Tzourio, A. Alperovitch, et al., "No epsilon(4) gene dose effect on hippocampal atrophy in a large MRI database of healthy elderly subjects," Neuroimage, vol. 24, pp. 1205-1213, Feb 15 2005.
[98] S. Matura, D. Prvulovic, A. Jurcoane, D. Hartmann, J. Miller, M. Scheibe, et al., "Differential effects of the ApoE4 genotype on brain structure and function," Neuroimage, vol. 89, pp. 81-91, Apr 1 2014.
[99] M. Pievani, S. Galluzzi, P. M. Thompson, P. E. Rasser, M. Bonetti, and G. B. Frisoni, "APOE4 is associated with greater atrophy of the hippocampal formation in Alzheimer's disease," Neuroimage, vol. 55, pp. 909-919, Apr 1 2011.

118
[100] M. Fouquet, F. L. Besson, J. Gonneaud, R. La Joie, and G. Chetelat, "Imaging Brain Effects of APOE4 in Cognitively Normal Individuals Across the Lifespan," Neuropsychology Review, vol. 24, pp. 290-299, Sep 2014.
[101] G. Chetelat and M. Fouquet, "Neuroimaging biomarkers for Alzheimer's disease in asymptomatic APOE4 carriers," Rev Neurol (Paris), vol. 169, pp. 729-36, Oct 2013.
[102] V. Heise, N. Filippini, A. J. Trachtenberg, S. Suri, K. P. Ebmeier, and C. E. Mackay, "Apolipoprotein E genotype, gender and age modulate connectivity of the hippocampus in healthy adults," Neuroimage, vol. 98, pp. 23-30, Sep 2014.
[103] L. Chang, M. Andres, J. Sadino, C. S. Jiang, H. Nakama, E. Miller, et al., "Impact of apolipoprotein E epsilon4 and HIV on cognition and brain atrophy: antagonistic pleiotropy and premature brain aging," Neuroimage, vol. 58, pp. 1017-27, Oct 15 2011.
[104] C. Pettigrew, A. Soldan, Y. Zhu, M. C. Wang, A. Moghekar, T. Brown, et al., "Cortical thickness in relation to clinical symptom onset in preclinical AD," Neuroimage Clin, vol. 12, pp. 116-22, 2016.
[105] H. Lin, R. Bhatia, and R. Lal, "Amyloid beta protein forms ion channels: implications for Alzheimer's disease pathophysiology," Faseb Journal, vol. 15, pp. 2433-2444, Nov 2001.
[106] S. Rosales-Corral, D. X. Tan, R. J. Reiter, M. Valdivia-Velazquez, J. P. Acosta-Martinez, and G. G. Ortiz, "Kinetics of the neuroinflammation-oxidative stress correlation in rat brain following the injection of fibrillar amyloid-beta onto the hippocampus in vivo," J Neuroimmunol, vol. 150, pp. 20-8, May 2004.
[107] D. A. Butterfield, T. Reed, S. F. Newman, and R. Sultana, "Roles of amyloid beta-peptide-associated oxidative stress and brain protein modifications in the pathogenesis of Alzheimer's disease and mild cognitive impairment," Free Radic Biol Med, vol. 43, pp. 658-77, Sep 01 2007.
[108] K. Parameshwaran, M. Dhanasekaran, and V. Suppiramaniam, "Amyloid beta peptides and glutamatergic synaptic dysregulation," Exp Neurol, vol. 210, pp. 7-13, Mar 2008.
[109] S. L. Risacher, S. Kim, K. Nho, T. Foroud, L. Shen, R. C. Petersen, et al., "APOE effect on Alzheimer's disease biomarkers in older adults with significant memory concern," Alzheimers Dement, vol. 11, pp. 1417-29, Dec 2015.
[110] C. Li, D. A. Loewenstein, R. Duara, M. Cabrerizo, W. Barker, and M. Adjouadi, "Associations between regional amyloid load, cortical thickness, APOE genotype and cognition in ADNIGO/ADNI2 participants," presented at the Human Amyloid Imaging, Miami, FL, 2017.

119
[111] K. Nho, S. L. Risacher, P. K. Crane, C. DeCarli, M. M. Glymour, C. Habeck, et al., "Voxel and surface-based topography of memory and executive deficits in mild cognitive impairment and Alzheimer's disease," Brain Imaging and Behavior, vol. 6, pp. 551-567, Dec 2012.
[112] K. W. Chen, J. B. S. Langbaum, A. S. Fleisher, N. Ayutyanont, C. Reschke, W. Lee, et al., "Twelve-month metabolic declines in probable Alzheimer's disease and amnestic mild cognitive impairment assessed using an empirically pre-defined statistical region-of-interest: Findings from the Alzheimer's Disease Neuroimaging Initiative," Neuroimage, vol. 51, pp. 654-664, Jun 2010.
[113] A. B. Wolf, J. Valla, G. Bu, J. Kim, M. J. LaDu, E. M. Reiman, et al., "Apolipoprotein E as a beta-amyloid-independent factor in Alzheimer's disease," Alzheimers Res Ther, vol. 5, p. 38, 2013.
[114] B. C. Dickerson, D. H. Salat, D. N. Greve, E. F. Chua, E. Rand-Giovannetti, D. M. Rentz, et al., "Increased hippocampal activation in mild cognitive impairment compared to normal aging and AD," Neurology, vol. 65, pp. 404-11, Aug 09 2005.
[115] R. W. Mahley, K. H. Weisgraber, and Y. Huang, "Apolipoprotein E4: a causative factor and therapeutic target in neuropathology, including Alzheimer's disease," Proc Natl Acad Sci U S A, vol. 103, pp. 5644-51, Apr 11 2006.
[116] S. L. Risacher, S. Kim, L. Shen, K. Nho, T. Foroud, R. C. Green, et al., "The role of apolipoprotein E (APOE) genotype in early mild cognitive impairment (E-MCI)," Frontiers in Aging Neuroscience, vol. 5, Apr 1 2013.
[117] T. Espeseth, L. T. Westlye, K. B. Walhovd, A. M. Fjell, T. Endestad, H. Rootwelt, et al., "Apolipoprotein E epsilon 4-related thickening of the cerebral cortex modulates selective attention," Neurobiology of Aging, vol. 33, pp. 304-U621, Feb 2012.
[118] G. Torres, P. McCall, C. Liu, M. Cabrerizo, and M. Adjouadi, "EEG processing: a many-core approach utilising the Intel single-chip cloud computer platform," International Journal of Embedded Systems, vol. 9, pp. 464-474, 2017.
[119] G. Chetelat, V. L. Villemagne, P. Bourgeat, K. E. Pike, G. Jones, D. Ames, et al., "Relationship between atrophy and beta-amyloid deposition in Alzheimer disease," Ann Neurol, vol. 67, pp. 317-24, Mar 2010.
[120] G. Chetelat, V. L. Villemagne, K. E. Pike, K. A. Ellis, D. Ames, C. L. Masters, et al., "Relationship between Memory Performance and beta-Amyloid Deposition at Different Stages of Alzheimer's Disease," Neurodegenerative Diseases, vol. 10, pp. 141-144, 2012 2012.
[121] D. Tosun, N. Schuff, C. A. Mathis, W. Jagust, M. W. Weiner, and I. Alzheimer's Disease NeuroImaging, "Spatial patterns of brain amyloid-beta burden and atrophy rate associations in mild cognitive impairment," Brain, vol. 134, pp. 1077-88, Apr 2011.

120
[122] P. T. Trzepacz, H. Hochstetler, P. Yu, P. Castelluccio, M. M. Witte, G. Dell'Agnello, et al., "Relationship of Hippocampal Volume to Amyloid Burden across Diagnostic Stages of Alzheimer's Disease," Dementia and Geriatric Cognitive Disorders, vol. 41, pp. 68-79, 2016 2016.
[123] V. Dore, V. L. Villemagne, P. Bourgeat, J. Fripp, O. Acosta, G. Chetelat, et al., "Cross-sectional and Longitudinal Analysis of the Relationship Between A beta Deposition, Cortical Thickness, and Memory in Cognitively Unimpaired Individuals and in Alzheimer Disease," Jama Neurology, vol. 70, pp. 903-911, Jul 2013.
[124] P. S. Insel, N. Mattsson, M. C. Donohue, R. S. Mackin, P. S. Aisen, C. R. Jack, Jr., et al., "The transitional association between beta-amyloid pathology and regional brain atrophy," Alzheimers & Dementia, vol. 11, pp. 1171-1179, Oct 2015.
[125] J. L. Whitwell, N. Tosakulwong, S. D. Weigand, M. L. Senjem, V. J. Lowe, J. L. Gunter, et al., "Does amyloid deposition produce a specific atrophic signature in cognitively normal subjects?," Neuroimage Clin, vol. 2, pp. 249-57, 2013.
[126] Z. Qi, M. Goryawala, M. Cabrerizo, W. Barker, D. Loewenstein, R. Duara, et al., "Multivariate Analysis of structural MRI and PET (FDG and 18F-AV-45) for Alzheimer's disease and its prodromal stages," Conference proceedings : ... Annual International Conference of the IEEE Engineering in Medicine and Biology Society. IEEE Engineering in Medicine and Biology Society. Annual Conference, vol. 2014, pp. 1051-4, 2014-Aug 2014.
[127] G. Chetelat, V. L. Villemagne, P. Bourgeat, K. E. Pike, G. Jones, D. Ames, et al., "Relationship between Atrophy and beta-Amyloid Deposition in Alzheimer Disease," Annals of Neurology, vol. 67, pp. 317-324, Mar 2010.
[128] N. Filippini, A. Rao, S. Wetten, R. A. Gibson, M. Borrie, D. Guzman, et al., "Anatomically-distinct genetic associations of APOE epsilon 4 allele load with regional cortical atrophy in Alzheimer's disease," Neuroimage, vol. 44, pp. 724-728, Feb 1 2009.
[129] B. C. Dickerson, I. Goncharova, M. P. Sullivan, C. Forchetti, R. S. Wilson, D. A. Bennett, et al., "MRI-derived entorhinal and hippocampal atrophy in incipient and very mild Alzheimer's disease," Neurobiol Aging, vol. 22, pp. 747-54, Sep-Oct 2001.
[130] C. R. Jack, Jr., R. C. Petersen, Y. C. Xu, S. C. Waring, P. C. O'Brien, E. G. Tangalos, et al., "Medial temporal atrophy on MRI in normal aging and very mild Alzheimer's disease," Neurology, vol. 49, pp. 786-94, Sep 1997.
[131] R. J. Killiany, M. B. Moss, M. S. Albert, T. Sandor, J. Tieman, and F. Jolesz, "Temporal lobe regions on magnetic resonance imaging identify patients with early Alzheimer's disease," Arch Neurol, vol. 50, pp. 949-54, Sep 1993.
[132] H. Braak and E. Braak, "Neuropathological stageing of Alzheimer-related changes," Acta Neuropathol, vol. 82, pp. 239-59, 1991.

121
[133] O. Hansson, H. Zetterberg, P. Buchhave, E. Londos, K. Blennow, and L. Minthon, "Association between CSF biomarkers and incipient Alzheimer's disease in patients with mild cognitive impairment: a follow-up study," Lancet Neurol, vol. 5, pp. 228-34, Mar 2006.
[134] N. Mattsson, D. Tosun, P. S. Insel, A. Simonson, C. R. Jack, L. A. Beckett, et al., "Association of brain amyloid-beta with cerebral perfusion and structure in Alzheimer's disease and mild cognitive impairment," Brain, vol. 137, pp. 1550-1561, May 2014.
[135] X. Long, L. Zhang, W. Liao, C. Jiang, B. Qiu, and I. Alzheimer's Disease Neuroimaging, "Distinct laterality alterations distinguish mild cognitive impairment and Alzheimer's disease from healthy aging: statistical parametric mapping with high resolution MRI," Hum Brain Mapp, vol. 34, pp. 3400-10, Dec 2013.
[136] G. Chetelat, V. L. Villemagne, K. E. Pike, J. C. Baron, P. Bourgeat, G. Jones, et al., "Larger temporal volume in elderly with high versus low beta-amyloid deposition," Brain, vol. 133, pp. 3349-58, Nov 2010.
[137] D. Iacono, W. R. Markesbery, M. Gross, O. Pletnikova, G. Rudow, P. Zandi, et al., "The Nun study: clinically silent AD, neuronal hypertrophy, and linguistic skills in early life," Neurology, vol. 73, pp. 665-73, Sep 01 2009.
[138] M. A. Riudavets, D. Iacono, S. M. Resnick, R. O'Brien, A. B. Zonderman, L. J. Martin, et al., "Resistance to Alzheimer's pathology is associated with nuclear hypertrophy in neurons," Neurobiology of Aging, vol. 28, pp. 1484-1492, Oct 2007.
[139] J. Pegueroles, E. Vilaplana, V. Montal, F. Sampedro, D. Alcolea, M. Carmona-Iragui, et al., "Longitudinal brain structural changes in preclinical Alzheimer's disease," Alzheimers Dement, Sep 28 2016.
[140] J. Fortea, R. Sala-Llonch, D. Bartres-Faz, A. Llado, C. Sole-Padulles, B. Bosch, et al., "Cognitively preserved subjects with transitional cerebrospinal fluid ss-amyloid 1-42 values have thicker cortex in Alzheimer's disease vulnerable areas," Biol Psychiatry, vol. 70, pp. 183-90, Jul 15 2011.
[141] B. M. Doherty, S. A. Schultz, J. M. Oh, R. L. Koscik, N. M. Dowling, T. E. Barnhart, et al., "Amyloid burden, cortical thickness, and cognitive function in the Wisconsin Registry for Alzheimer's Prevention," Alzheimers Dement (Amst), vol. 1, pp. 160-169, Jun 01 2015.
[142] A. Grothey, M. Shah, T. Yoshino, E. Van Cutsem, J. Taieb, R. Xu, et al., "Clinicopathological factors influence diagnostic accuracy of clinical N staging for early gastric cancer," Annals of Oncology, vol. 28, Jun 2017.

122
[143] A. D. Cohen, J. C. Price, L. A. Weissfeld, J. James, B. L. Rosario, W. Bi, et al., "Basal cerebral metabolism may modulate the cognitive effects of Abeta in mild cognitive impairment: an example of brain reserve," J Neurosci, vol. 29, pp. 14770-8, Nov 25 2009.
[144] R. Ossenkoppele, C. Madison, H. Oh, M. Wirth, B. N. M. van Berckel, and W. J. Jagust, "Is Verbal Episodic Memory in Elderly with Amyloid Deposits Preserved Through Altered Neuronal Function?," Cerebral Cortex, vol. 24, pp. 2210-2218, Aug 2014.
[145] W. J. Jagust and E. C. Mormino, "Lifespan brain activity, beta-amyloid, and Alzheimer's disease," Trends in Cognitive Sciences, vol. 15, pp. 520-526, Nov 2011.
[146] S. Schreiber, S. M. Landau, A. Fero, F. Schreiber, W. J. Jagust, and A. s. D. N. Initi, "Comparison of Visual and Quantitative Florbetapir F 18 Positron Emission Tomography Analysis in Predicting Mild Cognitive Impairment Outcomes," Jama Neurology, vol. 72, pp. 1183-1190, Oct 2015.
[147] V. Camus, P. Payoux, L. Barre, B. Desgranges, T. Voisin, C. Tauber, et al., "Using PET with F-18-AV-45 (florbetapir) to quantify brain amyloid load in a clinical environment," European Journal of Nuclear Medicine and Molecular Imaging, vol. 39, pp. 621-631, Apr 2012.
[148] Z. S. Ji, R. D. Miranda, Y. M. Newhouse, K. H. Weisgraber, Y. D. Huang, and R. W. Mahley, "Apolipoprotein E4 potentiates amyloid beta peptide-induced lysosomal leakage and apoptosis in neuronal cells," Journal of Biological Chemistry, vol. 277, pp. 21821-21828, Jun 2002.
[149] H. Lemaitre, A. L. Goldman, F. Sambataro, B. A. Verchinski, A. Meyer-Lindenberg, D. R. Weinberger, et al., "Normal age-related brain morphometric changes: nonuniformity across cortical thickness, surface area and gray matter volume?," Neurobiol Aging, vol. 33, pp. 617 e1-9, Mar 2012.
[150] S. M. McGinnis, M. Brickhouse, B. Pascual, and B. C. Dickerson, "Age-Related Changes in the Thickness of Cortical Zones in Humans," Brain Topography, vol. 24, pp. 279-291, Oct 2011.
[151] F. Kruggel, M. K. Bruckner, T. Arendt, C. J. Wiggins, and D. Y. von Cramon, "Analyzing the neocortical fine-structure," Med Image Anal, vol. 7, pp. 251-64, Sep 2003.
[152] K. Juottonen, M. P. Laakso, R. Insausti, M. Lehtovirta, A. Pitkanen, K. Partanen, et al., "Volumes of the entorhinal and perirhinal cortices in Alzheimer's disease," Neurobiol Aging, vol. 19, pp. 15-22, Jan-Feb 1998.

123
[153] A. M. Fjell, L. McEvoy, D. Holland, A. M. Dale, K. B. Walhovd, and A. s. D. N. Initi, "What is normal in normal aging? Effects of aging, amyloid and Alzheimer's disease on the cerebral cortex and the hippocampus," Progress in Neurobiology, vol. 117, pp. 20-40, Jun 2014.
[154] M. R. Sabuncu, R. L. Buckner, J. W. Smoller, P. H. Lee, B. Fischl, R. A. Sperling, et al., "The Association between a Polygenic Alzheimer Score and Cortical Thickness in Clinically Normal Subjects," Cerebral Cortex, vol. 22, pp. 2653-2661, Nov 2012.
[155] T. Hafting, M. Fyhn, S. Molden, M. B. Moser, and E. I. Moser, "Microstructure of a spatial map in the entorhinal cortex," Nature, vol. 436, pp. 801-806, Aug 11 2005.
[156] E. L. Hargreaves, G. Rao, I. Lee, and J. J. Knierim, "Major dissociation between medial and lateral entorhinal input to dorsal hippocampus," Science, vol. 308, pp. 1792-1794, Jun 17 2005.
[157] M. Fyhn, S. Molden, M. P. Witter, E. I. Moser, and M. B. Moser, "Spatial representation in the entorhinal cortex," Science, vol. 305, pp. 1258-64, Aug 27 2004.
[158] E. Kropff, J. E. Carmichael, M. B. Moser, and E. I. Moser, "Speed cells in the medial entorhinal cortex," Nature, vol. 523, pp. 419-24, Jul 23 2015.
[159] J. Jacobs, M. J. Kahana, A. D. Ekstrom, M. V. Mollison, and I. Fried, "A sense of direction in human entorhinal cortex," Proc Natl Acad Sci U S A, vol. 107, pp. 6487-92, Apr 06 2010.
[160] D. H. Geschwind and P. Rakic, "Cortical evolution: judge the brain by its cover," Neuron, vol. 80, pp. 633-47, Oct 30 2013.
[161] B. C. Dickerson, E. Fenstermacher, D. H. Salat, D. A. Wolk, R. P. Maguire, R. Desikan, et al., "Detection of cortical thickness correlates of cognitive performance: Reliability across MRI scan sessions, scanners, and field strengths," Neuroimage, vol. 39, pp. 10-8, Jan 01 2008.
[162] W. W. Seeley, R. K. Crawford, J. Zhou, B. L. Miller, and M. D. Greicius, "Neurodegenerative diseases target large-scale human brain networks," Neuron, vol. 62, pp. 42-52, Apr 16 2009.
[163] G. A. Graveland, R. S. Williams, and M. DiFiglia, "Evidence for degenerative and regenerative changes in neostriatal spiny neurons in Huntington's disease," Science, vol. 227, pp. 770-3, Feb 15 1985.
[164] B. T. Hyman, G. W. Van Hoesen, A. R. Damasio, and C. L. Barnes, "Alzheimer's disease: cell-specific pathology isolates the hippocampal formation," Science, vol. 225, pp. 1168-70, Sep 14 1984.

124
[165] W. W. Seeley, D. A. Carlin, J. M. Allman, M. N. Macedo, C. Bush, B. L. Miller, et al., "Early frontotemporal dementia targets neurons unique to apes and humans," Ann Neurol, vol. 60, pp. 660-7, Dec 2006.
[166] J. R. Scott, D. Davies, and H. Fraser, "Scrapie in the central nervous system: neuroanatomical spread of infection and Sinc control of pathogenesis," J Gen Virol, vol. 73 ( Pt 7), pp. 1637-44, Jul 1992.
[167] M. D. Greicius, G. Srivastava, A. L. Reiss, and V. Menon, "Default-mode network activity distinguishes Alzheimer's disease from healthy aging: Evidence from functional MRI," Proceedings of the National Academy of Sciences of the United States of America, vol. 101, pp. 4637-4642, Mar 30 2004.
[168] R. L. Buckner, A. Z. Snyder, B. J. Shannon, G. LaRossa, R. Sachs, A. F. Fotenos, et al., "Molecular, structural, and functional characterization of Alzheimer's disease: Evidence for a relationship between default activity, amyloid, and memory," Journal of Neuroscience, vol. 25, pp. 7709-7717, Aug 24 2005.
[169] J. J. Palop, J. Chin, E. D. Roberson, J. Wang, M. T. Thwin, N. Bien-Ly, et al., "Aberrant excitatory neuronal activity and compensatory remodeling of inhibitory hippocampal circuits in mouse models of Alzheimer's disease," Neuron, vol. 55, pp. 697-711, Sep 6 2007.
[170] J. J. Palop, J. Chin, and L. Mucke, "A network dysfunction perspective on neurodegenerative diseases," Nature, vol. 443, pp. 768-773, Oct 19 2006.
[171] R. La Joie, A. Perrotin, L. Barre, C. Hommet, F. Mezenge, M. Ibazizene, et al., "Region-Specific Hierarchy between Atrophy, Hypometabolism, and beta-Amyloid (A beta) Load in Alzheimer's Disease Dementia," Journal of Neuroscience, vol. 32, pp. 16265-16273, Nov 14 2012.
[172] B. T. Hyman, "Amyloid-Dependent and Amyloid-Independent Stages of Alzheimer Disease," Archives of Neurology, vol. 68, pp. 1062-1064, Aug 2011.
[173] C. Pettigrew, A. Soldan, Y. Zhu, M. C. Wang, A. Moghekar, T. Brown, et al., "Cortical thickness in relation to clinical symptom onset in preclinical AD," Neuroimage-Clinical, vol. 12, pp. 116-122, 2016.
[174] A. M. Fjell, L. McEvoy, D. Holland, A. M. Dale, K. B. Walhovd, and I. Alzheimer's Disease Neuroimaging, "Brain changes in older adults at very low risk for Alzheimer's disease," J Neurosci, vol. 33, pp. 8237-42, May 08 2013.
[175] A. Bakkour, J. C. Morris, D. A. Wolk, and B. C. Dickerson, "The effects of aging and Alzheimer's disease on cerebral cortical anatomy: specificity and differential relationships with cognition," Neuroimage, vol. 76, pp. 332-44, Aug 01 2013.

125
VITA
CHUNFEI LI Sep 2005 – Jun 2009 B.S., Mathematics and Applied Mathematics, Shijiazhuang Railway Institute Sep 2011 – Mar 2017 M.S., Computer Software Engineering, Beihang University
Feb 2012 – Aug 2012 IOS Developer, Huangfeng Corporation, Beijing, China Aug 2012 – Dec 2013 M.S., Computer Engineering, Florida International University
Jan 2014 – Apr 2018 Ph.D., Electrical Engineering, Florida International University May 2016 – Aug 2016 Data Science Intern, Rokk3r Labs, Miami, Florida
Sep 2017 – Nov 2017 Software Engineer Intern, Facebook, New York, NY PUBLICATIONS AND PRESENTATIONS
C. Li, D.A. Loewenstein, R. Duara, M. Cabrerizo, W. Barker, M. Adjouadi, “The Relationship of Brain Amyloid Load and APOE Status to Regional Cortical Thinning and Cognition in the ADNI Cohort”, Journal of Alzheimer's Disease. 2017; Vol. 59(4), pp. 1269-1282, DOI: 10.3233/JAD-170286, PMID: 28731444.
C. Li, C. Fang, M. Cabrerizo, A. Barreto, J. Andrian, R. Duara, D.A. Loewenstein, M. Adjouadi, “Regional Image Features Model for the Genome-wide Association Study of Alzheimer’s Disease”, IEEE Journal of Biomedical Health Informatics (accepted) C. Li, C. Fang, M. Cabrerizo, A. Barreto, J. Andrian, D.A. Loewenstein, R. Duara, M. Adjouadi, “Diverging association patterns of the regional amyloid load, cortical thickness and APOE genotype in the progression of Alzheimer’s disease”, International Journal of Computational Biology and Drug Design (IJCBDD) (accepted with revision) C. Li, Duara R, Loewenstein DA, Cabrerizo M, Barker W, Adjouadi M, “Greater Regional Cortical Thickness is Associated With Selective Vulnerability to Atrophy in Alzheimer’s Disease, Independent of Amyloid Load and APOE Genotypet”, Journal of Alzheimer's Disease (under review) C. Li, C. Fang, M. Cabrerizo, A. Barreto, J. Andrian, N. Rishe, D. Loewenstein, R. Duara, M. Adjouadi, “Enhanced Region-based Neuroimaging Features for the Early Detection of Alzheimer's Disease”, International Journal of Neural Systems (under review) C. Li, C. Fang, M. Cabrerizo, A. Barreto, J. Andrian, N. Rishe, D. Loewenstein, R. Duara, M. Adjouadi, “Diverging association patterns of regional cortical atrophy with global and with regional amyloid deposition” Human Brain Mapping (under review)
C. Li, C. Fang, M. Adjouadi, M. Cabrerizo, A. Barreto, J. Andrian, R. Duara, D. Loewenstein. “A Neuroimaging Feature Extraction Model for Imaging Genetics with

126
Application to Alzheimer’s Disease”. 2017 IEEE 17th International Conference on Bioinformatics and Bioengineering (BIBE), pp. 15-20, DOI: 10.1109/BIBE.2017.00010, Washington DC, October 23-25, 2017. C. Li, C. Fang, M. Cabrerizo, A. Barreto, J. Andrian, D. Loewenstein, R. Duara, M. Adjouad. ”Pattern analysis of the interaction of regional amyloid load, cortical thickness and APOE genotype in the progression of Alzheimer’s disease”. IEEE International Conference on Bioinformatics and Biomedicine (BIBM), pp. 2171-2176, 2017, DOI: 10.1109/BIBM.2017.8217994
C. Li, Q. Zhou, M. Goryawala, D.A. Loewenstein, W. Barker, R. Duara, M. Adjouadi. “Investigating the Utility of FDG and AV45 PET in both Two-classification and Multi-classification of Alzheimer’s Disease and Its Prodromal Stages”, The 9th Human Amyloid Imaging. pp. 117, 2015.
C. Li, Q. Zhou, M. Adjouadi. “Correlation Regional Amyloid Load and Cortical Thickness in Alzheimer’s Disease”. GWAS 2016, Florida International University, Miami, FL, Mar 28-29, 2016 C. Li, R. Duara, D.A. Loewenstein, M. Cabrerizo, W. Barker, M. Adjouadi. “Interaction of regional amyloid load, cortical thickness and APOE genotype in Alzheimer’s disease”. BIOT Symposium, Provo, Utah, Dec 8-9, 2016
C. Li, R. Duara, D.A. Loewenstein, M. Cabrerizo, W. Barker, A. Barreto, M. Adjouadi. “Genome-wide association study of Alzheimer’s disease using supervised neuroimaging features as intermediate phenotypes”. BIOT Symposium, Provo, Utah, Dec 8-9, 2016 C. Li, R. Duara, D.A. Loewenstein, M. Cabrerizo, W. Barker, M. Adjouadi. “Greater Regional Cortical Thickness is Associated With Selective Vulnerability to Atrophy in Alzheimer’s Disease, Independent of Regional Amyloid Load”. Human Amyloid Imaging, pp. 141-143, Jan 14, 2017. C. Li, D.A. Loewenstein, R. Duara, M. Cabrerizo, W. Barker, M. Adjouadi. "Associations between regional amyloid load, cortical thickness, APOE genotype and cognition in ADNIGO/ADNI2 participants" Human Amyloid Imaging, pp. 221-224, 2017. C. Li, R. Duara, D.A. Loewenstein, M. Cabrerizo, W. Barker, M. Adjouadi. “Optimal Neuroimaging Measures for Tracking Alzheimer’s Disease Progression”. Alzheimer's and Dementia 13(7): P438-P440, DOI10.1016/j.jalz.2017.06.437
C. Fang, C. Li, M. Cabrerizo, A. Barreto, J. Andrian, N. Rishe, D.A. Loewenstein, R. Duara, M. Adjouadi. "A Gaussian Discriminant Analysis-based Machine Learning Algorithm for the Classification of Mild Cognitive Impairment in Alzheimer's disease". BIOT Symposium conference, Provo, Utah, Dec 8-9, 2016
C. Fang, C. Li, M. Cabrerizo, A. Barreto, J. Andrian, N. Rishe, D.A. Loewenstein, R. Duara, M. Adjouadi, “Gaussian Discriminant Analysis-Based Dual High-Dimensional Decision Spaces for the Diagnosis of Mild Cognitive Impairment in Alzheimer’s Disease”, International Journal of Neural Systems. (accepted)

127
C. Fang, C. Li, M. Cabrerizo, A. Barreto, J. Andrian, D. Loewenstein, R. Duara, and M. Adjouadi “A Novel Gaussian Discriminant Analysis-based Computer Aided Diagnosis System for Screening Different Stages of Alzheimer's Disease”, IEEE 17th International Conference on Bioinformatics and Bioengineering (BIBE), pp. 279-282, Washington DC, October 23-25, 2017. C. Fang, C. Li, M. Cabrerizo, A. Barreto, J. Andrian, D. Loewenstein, R. Duara, M. Adjouadi, “A Gaussian discriminant analysis-based generative learning algorithm for the early diagnosis of mild cognitive impairment in Alzheimer's disease”, IEEE International Conference on Bioinformatics and Biomedicine (BIBM), pp. 538 – 542, 2017. C. Fang, P. Janwattanapong, C. Li, M. Adjouadi, “A Global Feature Extraction Model for the Effective Computer Aided Diagnosis of Mild Cognitive Impairment Using Structural MRI Images”, NIPS 2017 Machine Learning for Health Workshop (ML4H)
G. Lizarraga, C. Li, M. Cabrerizo, W. Barker, D.A. Loewenstein, R. Duara, M. Adjouadi, “A Neuroimaging Web Services Interface Design as a Cyber Physical System for Medical Imaging and Data Management in Brain Research”, JMIR Medical Informatics. (accepted)
D. A. Loewenstein, R. E. Curiel, S. DeKosky, M. Rosselli, R. Bauer, M. Grieg-Custo, A. Penate, C. Li, G. Lizaragga, T. Golde, M. Adjouadi, R. Duara, “Recovery from Proactive Semantic Interference and MRI Volume: A Replication and Extension Study”, Journal of Alzheimer's Disease. 2017; 59(1):131-139. DOI: 10.3233/JAD-170276, PMID: 28598850. X. Wang, C. Li, M. Goryawala, M. Cabrerizo, M. Adjouadi, “Integrated Multimodal Registration Technique for Medical Imaging”, Medical Image Analysis (under review)
Recommended


![Monitoria multimodal cerebral multimodal monitoring[2]](https://img.pdfslide.us/doc/110x75/552957004a79599a158b46fd/monitoria-multimodal-cerebral-multimodal-monitoring2.jpg)
