Multidimensional high-performance liquid
chromatography–gas chromatography (HPLC-GC)
hyphenation techniques for food analysis
in routine environments
Dissertation
zur Erlangung des akademischen Grades eines
Doktors der Naturwissenschaften
– Dr. rer. nat. –
vorgelegt von
Marco Nestola
geboren in Essen
Institut für Instrumentelle Analytische Chemie
der
Universität Duisburg-Essen
2016

Die vorliegende Arbeit wurde im Zeitraum von März 2012 bis März 2016 im
Arbeitskreis von Prof. Dr. Torsten C. Schmidt am Institut für Instrumentelle
Analytische Chemie der Universität Duisburg-Essen durchgeführt.
Tag der Disputation: 1.9.2016
Gutachter: Prof. Dr. Torsten C. Schmidt
Prof. Dr. Oliver J. Schmitz
Vorsitzender: Prof. Dr. Mathias Ulbricht


Summary iii
Summary
Routine monitoring of foodstuffs is an important instrument for consumer protection.
Understandably, fast and robust analysis methods are necessary to cope with the modern
nutritional habits of the fast-growing population. In contrast, the chemical complexity and
variety of foodstuffs are challenges complicating the development of such analytical methods.
Nevertheless, routine laboratories faced with thousands of samples per year need to be able to
identify harmful substances and quality mismatches in a short time span.
Chromatographic methods are omnipresent in the field of food science. They are used
throughout the whole analytical process either for sample preparation or for analyte separation.
However, online hyphenation of sample preparation with the separation and detection processes
is so far rarely observed in routine environments.
Hyphenation of liquid and gas chromatographic techniques (LC-GC), for example, provides an
efficient and fast sample preparation online coupled to the chromatographic separation and
detection method. Although this technique is known for almost thirty years, it is hardly used in
routine laboratories. This might be related to technical difficulties in the past affecting
robustness.
Therefore, aim of this work was the development of selected analytical methods by means of
LC-GC hyphenation with robust hardware solutions. Each development included a validation
process enlightening the suitability of the analytical method in the scope of accuracy,
robustness, and sample throughput for routine environments. The selected applications involve
the analysis of unwanted contaminations in food (polycyclic aromatic hydrocarbons, mineral
oil contaminations), the quality assurance of edible oils and fats, as well as the determination
of the vitamin D content in certain foodstuffs for nutrition analysis.
LC-GC hyphenation allowed direct injection of samples for applications typically involving
time-consuming column chromatography cleanups. Methods requiring preceding sample
preparation, such as saponification, derivatization, or liquid-liquid extraction, were successfully
realized by coupling autosampler-based sample handling with subsequent robust LC-GC
hyphenation. The determination of the sterol distribution and content in edible oils and fats was
chosen as an example.
The traditional method involves a multistage sample preparation, which requires tremendous
amounts of manual and error-prone work. Collaborative trials regularly show insufficient

iv Summary
precision among the participating laboratories. On the contrary, total automation of the sample
preparation with subsequent LC-GC analysis offered a substantial increase of precision,
robustness, and sample throughput. The here developed method allowed an average sample
throughput of one sample per hour. The only manual step left was to weigh the sample into an
autosampler vial, making this method amenable to the requirements of contract laboratories.
Additionally, the identity of a previously unreported sterol specifically present in sunflower oils
was enlightened by the advantages of the analytical HPLC cleanup and extension of the method
with mass spectrometric (MS) detection for structure elucidation.
The determination of the vitamin D content in multiple foodstuffs is another example for a
successful implementation of an LC-GC method. While vitamin D is typically detected by
liquid chromatographic methods, the use of online LC-GC-MS allowed the quantitation of
vitamin D also in complex foodstuffs, such as cholesterol-lowering margarines, known to be
challenging for established analysis methods.
In the further course of this work, deficiencies of LC-GC hyphenation for the determination of
aromatic hydrocarbons in a broad range of foodstuffs were examined. A single HPLC cleanup
proved to be insufficient for a robust determination of the selected analytes, showing that LC-
GC hyphenation has its limits as any other analytical tool. Increasing the dimensionality of the
sample cleanup was necessary to overcome these deficiencies.
The determination of polycyclic aromatic hydrocarbons (PAHs) became feasible by the
development of an easy and quick generic sample preparation protocol and employment of a
second HPLC cleanup stage. This two-dimensional heart-cut LC-GC-MS method offered high
sample cleanup for complex foodstuffs such as edible oils/fats, teas, coffees, or chicken eggs.
Additionally, comprehensive validation of the method was performed for extra virgin olive oils
proving its precision, robustness, and trueness.
Selective derivatization of interfering food matrix compounds was used for the determination
of mineral oil aromatic hydrocarbons (MOAH) in edible oils and fats. While HPLC cleanup
was insufficient, alteration of the food matrix polarity in conjunction with LC-GC hyphenation
provided an appropriate sample cleanup. Automation and optimization of the reaction
conditions, however, was essential for a robust method.
In a nutshell, this thesis shows that LC-GC hyphenation is comprehensively suited for the use
in routine environments with a growing portfolio of applications. Extension of common LC-
GC hyphenation with automated sample preparation techniques opened new possibilities for

Summary v
challenging applications as could be shown for the determination of sterols. Besides analytical
suitability, however, standardization work by national authorities or responsible working
groups is needed for a widespread distribution of LC-GC methods in routine laboratories.
vi Zusammenfassung
Zusammenfassung
Die Lebensmittelüberwachung ist ein wichtiges Instrument des Verbraucherschutzes. Die
modernen Ernährungsgewohnheiten der stetig wachsenden Bevölkerung machen die
Verwendung effizienter, schneller und robuster Analysemethoden notwendig. Im Gegensatz
dazu stehen jedoch die Vielfalt und Komplexität vieler Lebensmittel, die eine schnelle Analytik
oft erschweren. Gängige Analysetechniken umfassen neben dem eigentlichen Analyseprozess
komplizierte und teils zeitaufwendige Probenvorbereitungen. Entsprechend optimierte
Techniken sind daher notwendig, um diesen Anforderungen gerecht zu werden. Andernfalls
wäre es für Auftragslabore, die mit mehreren Tausend Proben im Jahr konfrontiert sind, nicht
möglich, gesundheitsschädliche Inhaltsstoffe oder Qualitätsdefizite eines Lebensmittels zeitnah
aufzudecken.
Chromatographische Trenntechniken finden zumeist Anwendung im gesamten
Probenhandling, sei es bei der Probenvorbereitung oder im eigentlichen Trennprozess. Die
Onlinekopplung beider Schritte ist jedoch bisher selten für Routineumgebungen beschrieben
worden. Die Kopplung flüssigkeits- und gaschromatographischer Techniken (LC-GC)
ermöglicht es beispielsweise, komplexe Analysemethoden effizient und robust zu
automatisieren. Dabei wird die Probenvorbereitung online direkt an den anschließenden
chromatographischen Trenn- und Detektionsprozess gekoppelt. Die HPLC übernimmt hier die
Aufgabe einer analytischen Probenvorbereitung, während die GC als robuste
Quantifizierungstechnik verwendet wird. Obwohl die Kopplungstechnik als solche bereits seit
über 30 Jahren bekannt ist, wurde sie dennoch nie in großem Maßstab in Routineumgebungen
eingeführt. Ein Grund dafür mag in den technischen Anforderungen und den daraus
resultierenden Stabilitätsproblemen liegen.
Aus diesen Gründen lag der Fokus bei der Erstellung dieser Arbeit auf der Entwicklung und
Validierung ausgewählter Analysemethoden basierend auf einer modernen und robusten LC-
GC-Kopplung. Hauptaugenmerk war dabei stets die Eignung der entwickelten Methoden in
Routineumgebungen. Hoher Probendurchsatz war genauso wichtig wie eine robuste, präzise
und richtige Analytik. Die ausgewählten Applikationen umfassen Beispiele aus dem Bereich
der Kontaminantenanalytik, der Qualitätskontrolle von Speiseölen und -fetten sowie der
Bestimmung des Vitamin D-Gehaltes ausgewählter Lebensmittel.
Die LC-GC-Kopplung erlaubt in vielen Fällen die Direktinjektion von Proben, für welche im
Normalfall zeitaufwendige Säulenchromatographien notwendig sind. Methoden, die

Zusammenfassung vii
üblicherweise vorhergehende Probenvorbereitungsschritte, wie Verseifungen,
Derivatisierungen oder Flüssig-flüssig-Extraktionen, benötigen, können erfolgreich durch die
Einbindung von Probenrobotern (Autosamplern) automatisiert werden. Die Bestimmung der
Sterinverteilung und des Gesamtgehaltes in Speiseölen und -fetten wurde im Rahmen dieser
Dissertation als Beispiel gewählt und beschrieben.
Die manuelle Standardmethode beinhaltet eine mehrstufige, zeit- und arbeitsaufwendige
Probenvorbereitung. Ringversuche belegen regelmäßig, dass die erzielte Vergleichspräzision
oft ungenügend ist. Im Gegensatz dazu konnte durch eine LC-GC-Methode mit vorgeschalteter
automatisierter Probenvorbereitung eine erhebliche Steigerung der Präzision, Richtigkeit und
des Probendurchsatzes erzielt werden. Der durchschnittliche Probendurchsatz lag bei einer
Probe pro Stunde, wobei der einzige manuelle Schritt nur noch aus der Probeneinwaage
bestand. Dies stellt einen signifikanten Vorteil zur Standardmethode dar, sodass die hier
vorgestellte Applikation für Auftragslabore prädestiniert erscheint. Abschließend konnte durch
die analytischen Vorteile einer LC-GC-MS-Methode die Identität eines vorher unbekannten
Sterins aus Sonnenblumenöl näher beschrieben werden.
Die Bestimmung des Vitamin D-Gehaltes aus ausgewählten Lebensmitteln stellt ein weiteres
Beispiel einer erfolgreichen LC-GC-Kopplung dar. Während sich für diese Analytik in der
Vergangenheit ausschließlich HPLC-Methoden durchgesetzt haben, die für komplexe
Lebensmittel, wie cholesterinsenkende Margarinen, teilweise ungeeignet sind, konnte mit einer
LC-GC-MS-Methode der Vitamin D-Gehalt jener Lebensmittel effizient bestimmt werden.
Im weiteren Verlauf dieser Arbeit wurden Lösungsstrategien zur Behebung LC-GC-
spezifischer Unzulänglichkeiten erarbeitet. Bei der Bestimmung aromatischer
Kohlenwasserstoffe in einer Vielzahl von Lebensmitteln stellte sich eine Probenaufreinigung
mittels einfacher HPLC als nicht zielführend heraus. Dies ermahnte, dass eine LC-GC-
Kopplung wie jedes andere analytische Werkzeug stets an die analytische Fragestellung
adaptiert werden muss. Die Verbesserung der Aufreinigungsqualität war daher eine zwingende
Notwendigkeit.
Die Bestimmung polyzyklischer aromatischer Kohlenwasserstoffe (PAK) konnte effizient
erfolgen, indem eine einfache und generische Probenvorbereitung mit einer zwei-
dimensionalen heart-cut HPLC-Aufreinigung gekoppelt wurde. Die Aufreinigungsqualität für
komplexe Lebensmittel, wie Speiseöle, Kaffees, Tees oder Hühnereier, konnte hierdurch
signifikant gesteigert werden. Eine umfassende Methodenvalidierung auf der Matrix
„Olivenöl“ belegte die Präzision, Richtigkeit und Robustheit dieses Ansatzes.

viii Zusammenfassung
Selektive Derivatisierungsreaktionen störender Matrixbestandteile wurden zur Bestimmung
aromatischer Kohlenwasserstoffe aus Mineralölen (MOAH) für die Probenmatrix „Speiseöle
und -fette“ untersucht, weil sich ein HPLC-Aufreinigungsansatz als ungenügend erwies. Im
Verlauf der Arbeiten stellte sich heraus, dass eine robuste Analytik nur durch eine präzise
Reaktionsführung möglich war. Diese konnte durch die etablierte Autosamplerbasis mit
anschließender LC-GC-Kopplung sichergestellt werden.
Abschließend zusammengefasst, wird in dieser Arbeit gezeigt, dass eine moderne LC-GC-
Kopplung für den Einsatz in Routineumgebungen vom analytischen Standpunkt umfassend
geeignet erscheint. Die Erweiterung dieser Technik um bekannte und bewährte
Probenvorbereitungsschritte eröffnet überdies neue Möglichkeiten, wie am Beispiel der
Sterinbestimmung gezeigt werden kann. Für einen flächendeckenden Einsatz der LC-GC-
Technik in Routineumgebungen sind jedoch neben der analytischen Eignung ausführliche
Normierungsarbeiten nationaler Behörden bzw. der verantwortlichen Arbeitsgruppen
notwendig.

Table Of Contents ix
Table of Contents
Summary ............................................................................................................................. iii
Zusammenfassung .............................................................................................................. vi
1. Introduction.................................................................................................................. 13
1.1 Chromatographic food analysis ................................................................................ 14
1.2 Hyphenation of multiple chromatographic dimensions ............................................. 15
1.3 HPLC-GC hyphenation............................................................................................ 15 1.3.1 Historical system overview................................................................................ 16 1.3.2 Recent hardware developments ......................................................................... 18
1.4 LC-GC or LCxGC – Heart-cut vs. Comprehensive .................................................. 20
1.5 HPLC as cleanup for GC ......................................................................................... 21
1.6 LC-GC Transfer and real-time solvent evaporation .................................................. 23
1.7 PTV Solvent split .................................................................................................... 23 1.7.1 Speed-controlled large volume injection ............................................................ 24 1.7.2 At-Once/Rapid large volume injection............................................................... 26
1.8 On-column techniques ............................................................................................. 27 1.8.1 Alternative on-column techniques ..................................................................... 30 1.8.2 Solvent trapping and band broadening ............................................................... 30
1.9 The early solvent vapor exit (SVE) .......................................................................... 33 1.9.1 Fully concurrent solvent evaporation (FCSE) .................................................... 34 1.9.2 Partially concurrent solvent evaporation (PCSE) ............................................... 36
1.10 References ............................................................................................................... 37
2. Scope of this thesis ........................................................................................................ 39
3. Evaluation of stigmasta-3,5-diene as indicator for adulteration in extra virgin olive oil by online liquid chromatography–gas chromatography–flame ionization (LC-GC-FID) ..................................................................................................................................... 41
3.1 Introduction ............................................................................................................. 41 3.1.1 Analytics ........................................................................................................... 44
3.2 Experimental ........................................................................................................... 45 3.2.1 Samples ............................................................................................................. 45 3.2.2 Chemicals and solutions .................................................................................... 45 3.2.3 Sample preparation ............................................................................................ 45 3.2.4 LC-GC-FID method .......................................................................................... 45
3.3 Results and Discussion ............................................................................................ 47 3.3.1 Precision and trueness ....................................................................................... 48 3.3.2 Sensitivity ......................................................................................................... 50
3.4 Conclusion .............................................................................................................. 51
3.5 References ............................................................................................................... 52
x Table Of Contents
4. Determination of the total sterol content in edible oils and fats by online liquid chromatography–gas chromatography–flame ionization detection (LC-GC-FID) with fully automated sample preparation .................................................................................. 53
4.1 Introduction ............................................................................................................. 54 4.1.1 Phytosterols as quality markers for edible oils and fats ...................................... 56 4.1.2 Analytics of phytosterols in edible oils and fats ................................................. 57
4.2 Experimental ........................................................................................................... 58 4.2.1 Samples ............................................................................................................. 58 4.2.2 Chemicals and solutions .................................................................................... 59 4.2.3 Sample preparation ............................................................................................ 59 4.2.4 LC-GC-FID method .......................................................................................... 60
4.3 Results and Discussion ............................................................................................ 62 4.3.1 Sample preparation ............................................................................................ 62 4.3.2 Influence of silylation on GC separation ............................................................ 63 4.3.3 Structure elucidation of the unknown compound in sunflower oil ...................... 65 4.3.4 Validation of the LC-GC-FID method ............................................................... 67
4.4 Conclusions ............................................................................................................. 69
4.5 References ............................................................................................................... 70
4.6 Supporting Information ............................................................................................ 72
5. Determination of vitamins D2 and D3 in selected food matrices by online high-performance liquid chromatography–gas chromatography–mass spectrometry (HPLC-GC-MS) ............................................................................................................................... 75
5.1 Introduction ............................................................................................................. 76 5.1.1 Analytics of vitamin D in foodstuff ................................................................... 77
5.2 Experimental ........................................................................................................... 80 5.2.1 Samples ............................................................................................................. 80 5.2.2 Chemicals and solutions .................................................................................... 80 5.2.3 Sample preparation ............................................................................................ 80 5.2.4 HPLC-UV Analysis........................................................................................... 81 5.2.5 HPLC-MS/MS Analysis .................................................................................... 82 5.2.6 HPLC-GC-MS Analysis .................................................................................... 82
5.3 Results and Discussion ............................................................................................ 84 5.3.1 Optimization of HPLC conditions ..................................................................... 84 5.3.2 Coupling of HPLC-GC to MS ........................................................................... 86 5.3.3 Calibration curves, LOD, and LOQ ................................................................... 88 5.3.4 Repeatability ..................................................................................................... 90 5.3.5 Comparison to classical method ........................................................................ 90 5.3.6 Comparison of HPLC-GC-MS with HPLC-MS/MS .......................................... 94 5.3.7 HPLC-GC-MS suitability for detection of vitamin D metabolites ...................... 96
5.4 Conclusion .............................................................................................................. 96
5.5 References ............................................................................................................... 97

Table Of Contents xi
6. Universal route to polycyclic aromatic hydrocarbon analysis in foodstuff: Two-dimensional heart-cut liquid chromatography–gas chromatography–mass spectrometry (LC-LC-GC-MS) ................................................................................................................ 99
6.1 Introduction ........................................................................................................... 100 6.1.1 Analytics of PAHs in foodstuff........................................................................ 101 6.1.2 Extraction of PAHs from foodstuff .................................................................. 102 6.1.3 LC-GC hyphenation ........................................................................................ 103 6.1.4 Detection of PAHs by LC-GC-MS .................................................................. 104
6.2 Experimental Section ............................................................................................. 105 6.2.1 Samples ........................................................................................................... 105 6.2.2 Chemicals and solutions .................................................................................. 105 6.2.3 Sample preparation .......................................................................................... 105 6.2.4 Generic protocol .............................................................................................. 106 6.2.5 Edible oils and fats .......................................................................................... 107 6.2.6 LC-LC-GC-MS method................................................................................... 107
6.3 Results and Discussion .......................................................................................... 109 6.3.1 Necessity for a two-dimensional HPLC cleanup .............................................. 109 6.3.2 Screening of HPLC phase materials for the second dimension ......................... 110 6.3.3 Two-dimensional heart-cut HPLC method....................................................... 112 6.3.4 Polyunsaturates removal capacity .................................................................... 114 6.3.5 Generic cleanup capability for multiple food matrices ..................................... 115 6.3.6 Validation of the LC-LC-GC-MS method........................................................ 116 6.3.7 Recovery ......................................................................................................... 118 6.3.8 Precision and trueness ..................................................................................... 118 6.3.9 Quantitation of PAHs in extra virgin olive oil .................................................. 119 6.3.10 Sample throughput considerations ................................................................... 120
6.4 Conclusion ............................................................................................................ 120
6.5 References ............................................................................................................. 121
6.6 Supporting Information .......................................................................................... 123 6.6.1 Interaction of naphthalene and squalene with various stationary phases ........... 128 6.6.2 Elution behavior of PAHs and polyunsaturates on silica gel ............................ 128 6.6.3 References....................................................................................................... 132
7. Determination of mineral oil aromatic hydrocarbons (MOAH) in edible oils and fats by online liquid chromatography–gas chromatography–flame ionization detection (LC-GC-FID) – Evaluation of automated removal strategies for biogenic olefins ................ 133
7.1 Introduction ........................................................................................................... 133 7.1.1 Analytics of MOSH and MOAH ..................................................................... 135
7.2 Experimental ......................................................................................................... 137 7.2.1 Samples ........................................................................................................... 137 7.2.2 Chemicals and solutions .................................................................................. 137 7.2.3 Sample preparation .......................................................................................... 138 7.2.4 LC-GC-FID method ........................................................................................ 139
7.3 Results and Discussion .......................................................................................... 140 7.3.1 Bromohydrin reaction...................................................................................... 140 7.3.2 Hydroboration ................................................................................................. 142 7.3.3 Optimization and automation of epoxidation ................................................... 143

xii Table Of Contents
7.3.4 Validation of the automated epoxidation approach .......................................... 145
7.4 Conclusion ............................................................................................................ 146
7.5 Acknowledgements ............................................................................................... 147
7.6 References ............................................................................................................. 147
7.7 Supporting Information .......................................................................................... 149
8. General Conclusions and Outlook ............................................................................. 151
8.1 References ............................................................................................................. 155
9. Appendix .................................................................................................................... 157
9.1 List of Abbreviations ............................................................................................. 157
9.2 List of Figures ....................................................................................................... 159
9.3 List of Tables ......................................................................................................... 162
9.4 List of Publications ................................................................................................ 163
9.5 Curriculum Vitae ................................................................................................... 165
9.6 Erklärung ............................................................................................................... 167
9.7 Acknowledgements ............................................................................................... 168
1. Introduction 13
1. Introduction
Conservation of human health and life by appropriate nutrition is a problem as old as humanity
itself. Consequently, assurance of food safety was always of great importance since it is directly
related to human health. Economic progress, however, made it necessary to analyze foodstuffs
also for other reasons. For example, adulteration of foodstuffs is of big commercial interest.
Therefore, also quality of food has to be ensured and monitored.
While organoleptic probing of foodstuffs was always a valuable tool for safety assurance,
scientific progress allowed to investigate foodstuff compositions more comprehensively.
Unwanted contaminations or allergens are only two classes of constituents that have to be
identified and declared nowadays. Reaching these goals in a world, in which billions of people
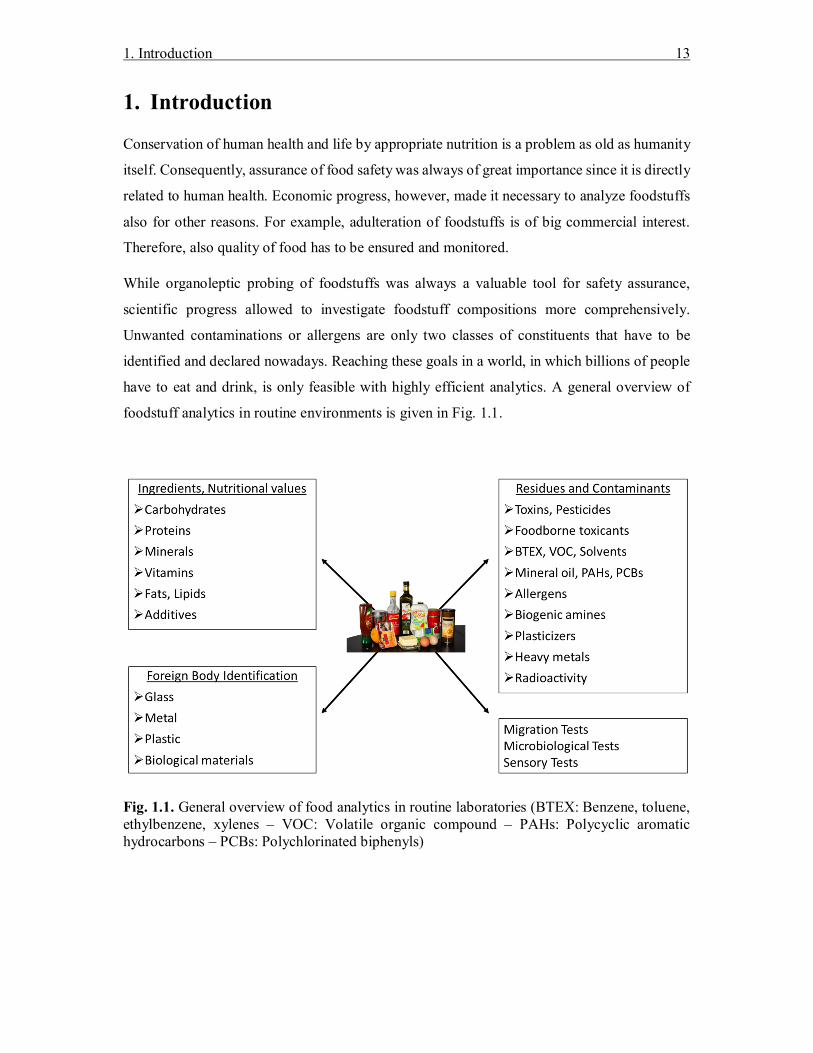
have to eat and drink, is only feasible with highly efficient analytics. A general overview of
foodstuff analytics in routine environments is given in Fig. 1.1.
Fig. 1.1. General overview of food analytics in routine laboratories (BTEX: Benzene, toluene, ethylbenzene, xylenes – VOC: Volatile organic compound – PAHs: Polycyclic aromatic hydrocarbons – PCBs: Polychlorinated biphenyls)

14 1. Introduction
Because of the complex nature of food, adaptable analytical techniques are necessary to answer
emerging questions. Reliable detection of ppb-amounts (parts per billion) of an analyte in the
presence of a complex food matrix is a highly demanding problem that cannot be solved in a
unique way.
1.1 Chromatographic food analysis
Chromatographic methods, such as gas chromatography (GC) or high-performance liquid
chromatography (HPLC), coupled to various detection systems, e.g., flame ionization detectors
(FID), UV detectors, or mass spectrometric (MS) detectors, are omnipresent in food analytics.
Although these techniques offer a high degree of certainty combined with high sensitivity for
the detection of individual analytes, the direct injection of foodstuffs is generally not possible.
Sample preparation is needed to remove the bulk of matrix beforehand. For this purpose,
additional chromatographic cleanup during sample preparation is usually employed. Otherwise,
rapid contamination of the analysis system and the impossibility of analyte identification would
be the consequences.
Advantages in instrument designs offer steadily increasing sensitivity paired with reduction of
analyses time. Sample preparation, however, is often still complicated, work-intense and error-
prone, and limits overall sample throughput and precision.
Solid-phase extraction (SPE) and thin-layer or column chromatography are important tools in
sample preparation protocols. Silica gel or polymeric-based materials are used for the
separation of the analytes of interest from the interfering matrix. Automation of these
techniques is most of the times problematic. Comparable materials are also found as stationary
phases in HPLC columns. Because of highly sophisticated manufacturing processes and smaller
particle sizes, HPLC columns exhibit much higher separation efficiencies than the other
techniques. Additionally, automation is easily achieved.
For this reason, the use of HPLC techniques for sample preparations is desirable. While few
selected analysis methods already make use of HPLC, it is still only a minor percentage in the
daily routine [1]. One possible explanation could be the problematic coupling of the sample
preparation to the analysis system and its rugged operation.
1. Introduction 15
1.2 Hyphenation of multiple chromatographic dimensions
Coupling of an automated HPLC-based sample preparation and the subsequent analysis step
can be accomplished in two different ways: Offline and online.
In offline methods the cleaned-up HPLC fractions are collected before they are used for
subsequent analysis steps. Fraction collection is performed either manually or automatically.
For instance, fraction collection after gel permeation chromatography (GPC) in the field of
pesticide residue analysis is commonly automated [2]. One big disadvantage of this technique
is the sample dilution which has to be compensated somehow afterward. Hence, time-
consuming evaporation of the fraction solvent is necessary and can be the source for additional
contamination. Even then, only a small fraction is injected either into HPLC- or GC-based
systems.
Online methods, however, try to solve these disadvantages with additional instrumental effort.
The complete analyte fraction obtained after the sample preparation is transferred directly into
the analysis system. Thus, less sample is needed in the first place, higher sensitivity is observed,
and less contamination is generally feasible. Furthermore, less manual work is needed, which
is an important factor in routine laboratories.
1.3 HPLC-GC hyphenation
In this context, the coupling of HPLC and GC is noteworthy. The idea is not new: First
publications can be found already in 1980 [3]. The link of both techniques is highly efficient.
The advantages are obvious:
- High sample capacity of HPLC needed for sample preparation
- High separation efficiency/peak capacity of capillary GC
- Fast GC analysis cycles
- Orthogonal separation modes of HPLC and GC
- Automated sample preparation
- Minimized analyte loss
- Minimized memory and carryover effects
- Sensitivity increase by transfer of whole HPLC fractions
- No evaporation or solvent exchange necessary (less sample degradation and
contamination)

16 1. Introduction
- Recovery rates are generally higher
- Higher sample throughput
HPLC generally exhibits higher sample capacity in comparison to GC. Furthermore, HPLC
allows highly efficient sample cleanups. HPLC is readily compatible with high molecular
weight sample matrix while GC is struggling with the low or nonexistent volatility.
Achieving separation orthogonality by the numerous HPLC operation modes (normal phase,
reversed phase, size exclusion, etc.) is more efficiently possible in comparison to simple GC-
based methods. On the contrary, capillary GC exhibits significantly higher peak capacities than
conventional HPLC. Furthermore, GC offers a wide range of detection systems normally not
amenable to HPLC, e.g., FID or electron impact mass spectrometry (EI-MS).
In HPLC-GC coupled systems the lossless fraction transfer from HPLC to GC is one key point.
The volumes often exceed 100 µL and can range up to several milliliters. In classical GC
applications normally 1 µL is injected. Hence, large volume transfer techniques must be
thoroughly understood and precisely controlled.
A very prominent example from the last decades is the determination of mineral oil
contaminations in food and paperboard [4]. HPLC-GC hyphenation tries to solve this analytical
task very efficiently. Normal-phase HPLC on silica gel sorbents is used for the extraction and
purification of mineral oil contaminants from accompanying matrix, e.g., triglycerides, fatty
acids, etc. [6]. Even further, mineral oil contaminations are separated into aliphatic and aromatic
compounds. Quantitation is accomplished by GC-FID. A FID offers significant advantages over
most other detectors. It exhibits a quasi-unity response for all compounds with similar
structures. Therefore, no expensive or nonexistent quantitation standards have to be used.
1.3.1 Historical system overview
As mentioned before, the hyphenation of HPLC and GC was reported already in the 1980es.
Especially Konrad Grob and his team from the Official Food Control Authority of the Canton
Zürich (Switzerland) pushed the limits of this technology. Numerous international peer-
reviewed publications can be found [5–7]. In 1989, the company Carlo Erba (later known as
Thermo Fisher Scientific) commercialized the HPLC-GC technique under the brand Dualchrom
3000. It was the first complete solution consisting of both, hard- and software. It was the
instrumental base for various peer-reviewed articles from several research groups all over
Europe [8–10].

1. Introduction 17
In general, the Dualchrom system consisted of an HPLC syringe pump equipped with several
rotary HPLC valves, a conventional GC-system with on-column injector, as well as selectable
analog GC detectors. Even today, almost 20 years later, this system is still available with only
slight modifications from Brechbühler AG (Schlieren, Switzerland). Its current setup is shown
in Fig. 1.2.
Fig. 1.2. General system overview of an LC-GC system (LC-GC 9000 from Brechbühler AG) consisting of an HPLC syringe pump, GC-FID, CTC Analytics HTC-xt PAL autosampler, and Valco HPLC valves.
After sample extraction, an aliquot is injected by an autosampler into a common HPLC valve
equipped with a sample loop. First chromatographic separation takes place on a conventional
HPLC column. The fraction containing the analytes of interest is guided by a transfer valve
online directly into the GC. For this purpose, an appropriate liquid transfer interface able to
remove the HPLC solvent without discrimination of the analytes has to be selected.
HPLC
GC
Autosampler
Valve unit
18 1. Introduction
Solvent evaporation is generally realized either by large-volume on-column or PTV-based
techniques (programmable temperature vaporization). However, the former one was reported
more frequently in literature in the past. After removal of the majority of solvent, which will be
explained in detail in subchapter 1.8, a common GC separation process including detection is
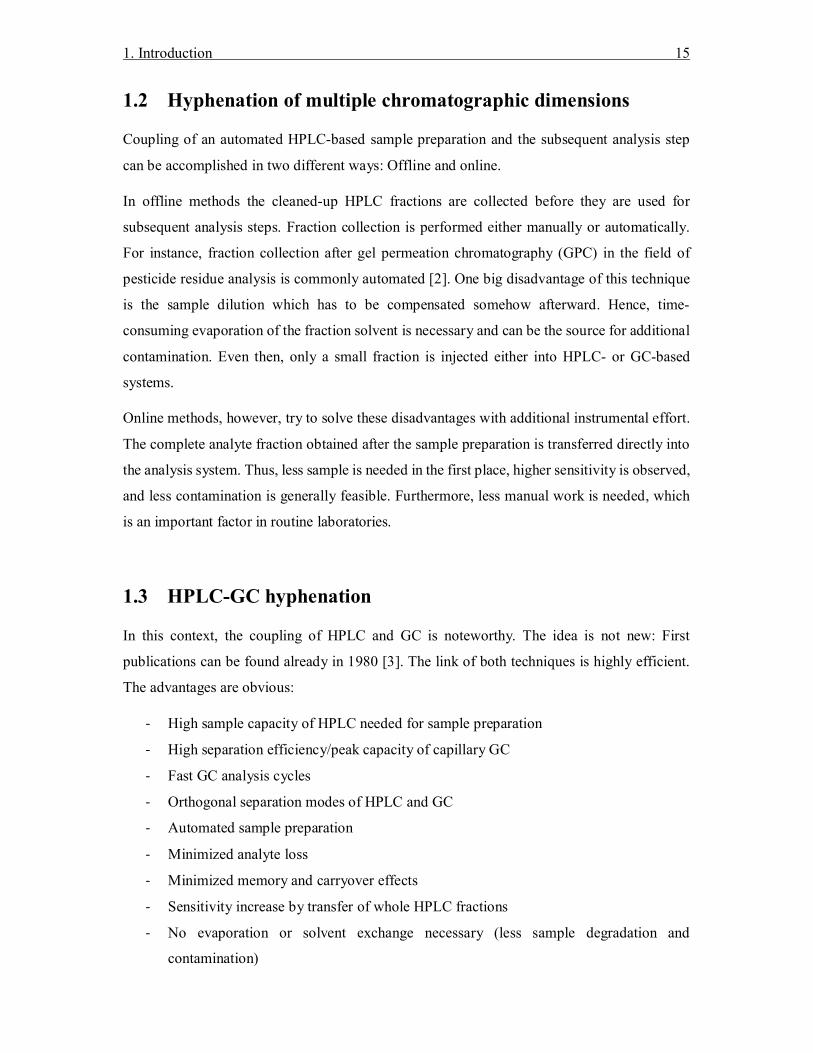
performed. In Fig. 1.3, an example for an LC-GC separation is given. A small fraction is ideally
obtained by HPLC, which is further separated and detected by GC-FID. During GC separation,
residual matrix compounds stuck on the HPLC column are usually removed simultaneously by
backflushing. After equilibration of the column, the system is ready for subsequent runs.
Fig. 1.3. Transfer of a fixed fraction window from HPLC to GC (Upper trace: LC-UV chromatogram, lower trace: GC-FID chromatogram of the transferred fraction [2])
1.3.2 Recent hardware developments
In routine environments, simplification of sample preparation is appreciated. High sample
numbers and short analysis cycle times make the use of highly automated systems inevitable.
LC-GC can comply with these requirements. However, one prerequisite had to be met before
starting the work on this thesis.
Up till now the LC-GC hyphenation technique was thought to be complicated and error-prone.
It is undoubted that the coupling of two powerful chromatographic techniques is challenging.
Consequently, the deficiencies of existing and published LC-GC hardware solutions had to be
analyzed and tried to be fixed. As mentioned, the origin of most LC-GC solutions dates back

1. Introduction 19
to one common source. By improving the stability and robustness of most system parts, i.e.,
HPLC, GC, and software, a new LC-GC hardware approach could be designed.
Result of this work, which started in 2010, was the CHRONECT LC-GC interface available
since 2014 (Axel Semrau GmbH & Co. KG, Sprockhövel, Germany). As can be seen in Fig.
1.4, the system is based on routine hardware parts already available in many routine
environments. This decision was vital to consolidate the acceptance of such systems in routine
laboratories.
Fig. 1.4. LC-GC system designed and used for application development in the scope of this thesis (Axel Semrau GmbH & Co. KG, Sprockhövel, Germany). The instrument is based on a conventional Agilent 1260 HPLC, Agilent 7890B GC-FID, and CTC Analytics PAL autosampler. The CHRONECT LC-GC interface module is the connecting element.
Hard- and software developments were out of the scope of this thesis focused on method
developments, however, it is noteworthy that this thesis would not have been possible without
them. Throughout all chapters of this work the described platform was used as a starting point.

20 1. Introduction
1.4 LC-GC or LCxGC – Heart-cut vs. Comprehensive
Hyphenation of HPLC and GC is mainly performed to remove matrix interference from the
analytes of interest. In simple cases, an LC fraction of several hundred microliters of volume is
obtained that is directed online into the GC, in which evaporation of the solvent takes place.
Large volume injection techniques are used to selectively remove the solvent. This kind of
coupling is known as LC-GC or heart-cut mode.
Opposed to this, the transfer of “all” LC fractions with subsequent GC separation and detection
is called comprehensive LCxGC. In this mode of operation, every bit of the LC eluate is guided
into the GC. The modulation ratio, i.e., the sampling rate of each first-dimension (1D) peak to
the second dimension, should be at least 1.5 for major and 3 for trace compounds [11]. Reasons
for this are twofold: firstly, the 1D-separation should be conserved during 2D-separation and,
secondly, the influence of unintentional time variations (phase shifting etc.) on quantitative
results should be minimized.
Consequently, a volume of approximately one third of each expected LC peak has to be
continuously transferred into the GC without losing the subsequent LC eluate. Realization of
such experiments is more demanding compared to LC-GC setups.
To prevent loss of LC eluate, it has to be either collected somewhere or the HPLC has to be
used in the “stopped-flow” mode. This mode halts the HPLC flow during GC separation.
Transfer of “all” LC fractions becomes feasible hereby.
Nevertheless, with conventional GC separation techniques LCxGC experiments require a huge
amount of time. For instance, thirty 1 min LC fractions with corresponding GC runtimes of 30
min would require a total runtime of 15 h. However, ultrafast-GC separations with total
runtimes below 1 min were reported recently and would drastically increase sample throughput
[12]. Besides this, processing and evaluation of the obtained data is not possible by standard
tools.
Brinkman et al. analyzed the FAME distribution (fatty acid methyl esters) of butter with an
LCxGC approach [13]. First separation of the sample was realized by a silver coated silica gel
HPLC column. Further separation and detection was performed by GC-TOF-MS. An example
for an obtained chromatogram is shown in Fig. 1.5.

1. Introduction 21
Fig. 1.5. Two-dimensional Ag-LCxGC-TOF-MS chromatogram of FAMEs found in butter [13]
1.5 HPLC as cleanup for GC
Choice of a suitable HPLC separation mode is crucial for a successful LC-GC hyphenation.
The following questions arise:
- Selectivity
o How can the analytes be separated from the sample matrix?
- Solvent compatibility
o Is the chosen mobile phase suitable for real-time evaporation and compatible
with the GC separation column and detection system?
- Sensitivity vs. capacity
o Which HPLC column dimension is needed for the aspired detection limits?
While in classical HPLC mainly reversed-phase separation modes are used, hyphenation to GC
most often is performed with normal-phase chromatography. One apparent reason for this

22 1. Introduction
choice is the possibility to use non-aqueous solvents. Introduction of aqueous HPLC mobile
phases into the GC is quite demanding. Liquid water attacks conventional fused silica surfaces,
from which GC columns are made, thus rendering these surfaces more active. Additionally,
water does not wet uncoated GC precolumns very well. Combined with the need of high
evaporation temperatures, good recovery of volatile analytes becomes a challenge.
The choice of the right LC column diameter is another important aspect. While 4.6 mm allow
injection of high sample amounts, the high flow rates of approximately 1 mL/min are not well
suited for online evaporation ahead of a GC separation. On the other extreme, LC capillary
columns (75 – 500 µm i.d.) can be run with extremely low flow rates but do not allow injection
of sufficient sample material. Therefore, the use of 2.1 mm columns was established. This
dimension combines sufficiently high sample amounts with appropriate LC flow rates (0.2 –
0.5 mL/min) which can be guided online into a GC without flooding the whole instrument.
Besides the solvent advantage in normal-phase chromatography, increasing retention
depending on analyte polarity opposed to non-polarity as on conventional C18-material, offers
a well-suited cleanup prior to GC separation. If reversed-phase separation is needed, non-
aqueous mobile phases should be checked. This mode of operation is known as NARP
chromatography (non-aqueous reversed-phase) [14]. GPC is a third separation mode which is
suited for GC hyphenation. Size exclusion is achieved in total organic solvents which can be
introduced into the GC. A few successful approaches can be found in literature, e.g., removal
of triglycerides for pesticide analysis [15].
Nevertheless, bare silica phases are the most popular HPLC phases used for LC-GC. Grob et
al. showed that bare silica can hold high amounts of triglycerides without notable column
overload [16]. This effect is the key for the solution of a lot of separation problems in fatty
foodstuffs. Separation of nonpolar compounds is easily achieved and was reported, e.g.,
hydrocarbons or long-chain fatty acid esters [17, 18]. Additionally, bare silica phases provide
a high pressure and solvent stability allowing regular backflushing of the column with various
solvents for matrix removal without deterioration of the stationary phase.
Interestingly, bare silica is known to be a tricky phase. Uncontrolled adsorption of matrix
compounds and unreproducible retention times were reported in the past [19]. Reason for this
behavior are the active sites on the stationary phase surface. These are formed mainly by free
silanol groups providing retention for increasingly polar molecules. Previous generations of
bare silica HPLC columns contained rather high amounts of free metal ions which in turn were
the source for uncontrolled retention and bad column-to-column reproducibility [20].

1. Introduction 23
Another problem is that even slightly polar mobile phases are hardly removed from the column
surface and elongate equilibration times [21]. The analytes of interest compete with the polar
solvent molecules for the active adsorption sites.
The use of gradient separation is restricted to few suitable solvent combinations. Because
chromatography on bare silica is mainly based on adsorption, an effect called “solvent
demixing” is coming into account having a significant influence on gradient formation [22].
Adsorption of the solvent changes the composition of the mobile phase, influencing the
separation.
Nevertheless, the use of bare silica HPLC phases in gradient elution is successfully applied in
specific applications, e.g., the separation of aliphatic and aromatic hydrocarbons [4].
1.6 LC-GC Transfer and real-time solvent evaporation
The cleaned-up LC fraction has to be minimized in volume to become compatible with GC.
Therefore, real-time evaporation of the solvent is necessary. In the last decades several attempts
were reported in literature [23]. Generally speaking, the transfer of large-volume LC fractions
into the GC is comparable with GC-injection of large sample volumes with a syringe. This field
of research, large volume injections (LVI), was explored thoroughly by several research groups.
1.7 PTV Solvent split
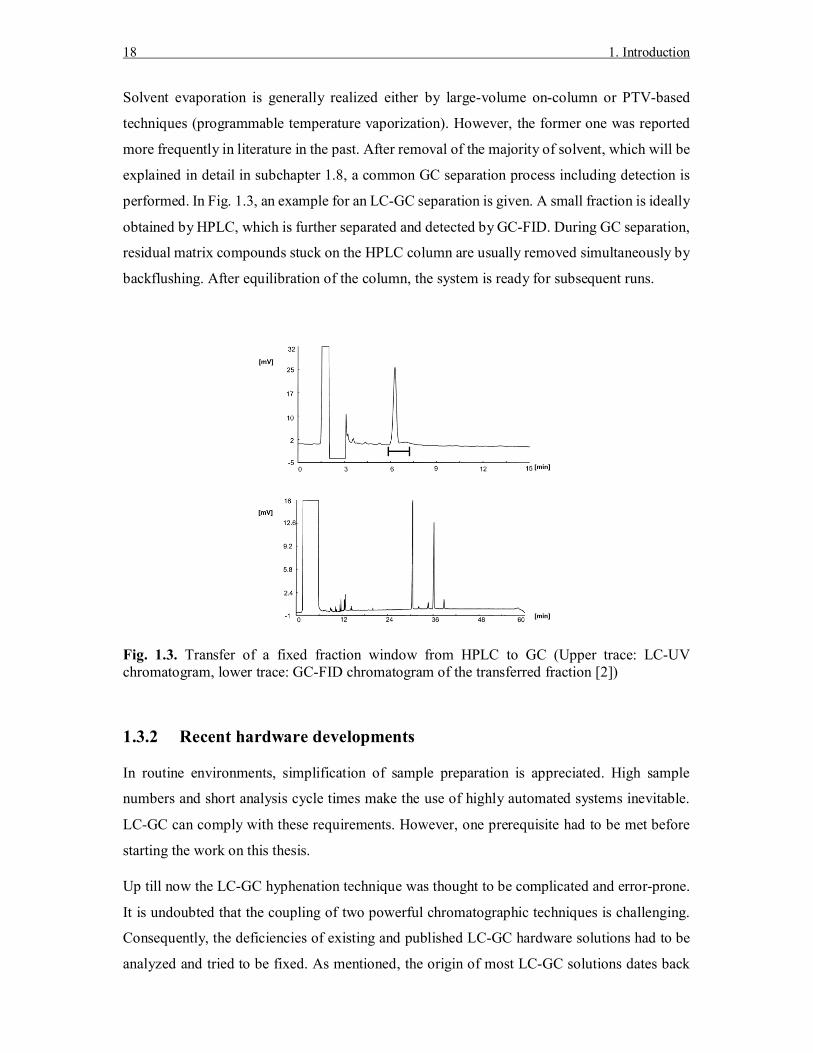
PTVs are commonly found in gas chromatographs. Opposed to the classical SSL injector
(split/splitless), it can be heated and cooled independently in a short time. Its construction can
be taken from Fig. 1.6. The injection volume for conventional split or splitless injections is
restricted to the used liner dimensions and is therefore essentially the same as for SSL injectors.
During classical 1 µL splitless injections, evaporation of the sample liquid forms gas vapors of
500 to 1000 µL [24]. If the vapor cannot be hold by the liner, expansion of the gas volume into
dead volumes, such as the carrier gas or septum purge lines, is observed being the source for
memory and carryover effects.
24 1. Introduction
Fig. 1.6. Schematic overview of a PTV injector (OPTIC-4 Multi Mode Inlet, GL Sciences B.V., Eindhoven, The Netherlands)
A technique called “Solvent Vent” tries to circumvent the problem by precise temperature and
carrier gas control during evaporation. A liner with a packing material is chosen having a high
surface area supporting rapid evaporation of introduced liquid.
Instead of total evaporation of the sample at high temperatures as in splitless injections, the
PTV temperature is held at a low temperature allowing selective evaporation of the solvent by
means of a high carrier gas flow rate. In turn, the liner volume is not the limiting factor for the
introduced sample volume anymore. Nevertheless, recovery of highly volatile compounds can
be problematic because of co-evaporation. In general, this process is comparable with common
nitrogen evaporators found in most laboratories.
1.7.1 Speed-controlled large volume injection
In simple cases, evaporation conditions are optimized to allow instantaneous evaporation of the
introduced sample liquid. In this mode of operation, virtually no limit for the sample amount
exists. Unfortunately, co-evaporation of volatile compounds renders high recovery of these
compounds impossible. In terms of carbon-numbers, analytes up to C18H38 (octadecane) are lost
[25].

1. Introduction 25
Improving recovery is possible by PTV sub-ambient cooling although being inefficient and
complicated. Another approach makes use of high retentive liner packaging, e.g., Tenax TA.
Even at elevated injection temperatures generally needed for high-boiling solvents, e.g., water,
recovery of volatile compounds becomes feasible [26]. Nevertheless, retention on the liner can
be problematic for high-boiling compounds [25]. In this case, on-column injection can offer
superior results.
Staniewski et al. investigated the physical properties needed for speed-controlled PTV
injections [27]. They proposed an equation giving an estimation for the possible sample
introduction rate. Only two assumptions were made: Firstly, the incoming carrier gas is totally
saturated with solvent vapor when leaving the injector through the split line. Secondly,
evaporation occurs under isothermal conditions.
Although neither of both assumptions is correct, fairly good starting conditions are obtained for
further practical testing.
푉 . = 푉 =푀푝휌푅푇
푝푝 푉 ,
Vinj.max: Max. Injection speed (µL/min)
Vel: Evaporation speed (µL/min)
M: Molecular mass of the solvent (g/mol)
pa: Partial pressure of the solvent, dependent on the injection temperature (Pa)
ρ: Density of the solvent (kg/m³)
po: Ambient pressure (Pa)
pi: Injector pressure (Pa)
Vt,o: Total injector gas flow (µL/min)
R: Universal gas constant (J mol-1 K-1)
To: Ambient temperature (K)
As a consequence, increase of sample introduction speed can be accomplished by:
- Increase of injector temperature
Increase of the partial pressure of the solvent inside the injector
- Increase of the carrier gas flow through the injector
Decrease of the dew point of the solvent-carrier gas mixture
- Reduction of the injector pressure
Decrease of the solvent’s boiling point

26 1. Introduction
1.7.2 At-Once/Rapid large volume injection
Another mode of operation is called “At-once” or rapid large volume injection. Here, the total
sample liquid is quickly injected into the liner. Consequently, the liner volume and packing
material must be optimized to hold the injected liquid volume. An inert material with high
surface area is used for this purpose, e.g., glass wool or diatomaceous earth.
Again, a high carrier gas flow rate is used at low temperature to induce evaporation. On the
solid support the sample liquid spontaneously starts evaporation creating a cold spot in the liner
packaging. This spot is suited for retention of highly volatile material. Before the last bit of
solvent is evaporated, the split exit of the injector is closed and a conventional PTV-splitless
injection is initiated.
Efficiency of this operation mode is significantly dependent on the used solvent. A low boiling
point with low enthalpy of vaporization favors a rapid cooldown of the liner packaging during
evaporation. For example, vaporization of n-hexane is more efficiently possible than water.
Using this technique for LC-GC hyphenation requires mostly a collection of the LC eluate.
Typically, a syringe with appropriate fraction volume is used for this purpose. After fraction
collection, a rapid large volume injection can be performed as described above. In Fig. 1.7, the
general operation scheme is given.

1. Introduction 27
Fig. 1.7. Syringe-based LC-GC interface with a PTV and the at-once mode (GL Sciences B.V.)
1.8 On-column techniques
For large volume injections and for HPLC-GC hyphenations, in particular, the use of on-column
injection techniques were also reported in the past.
Using thermal vaporizers, such as SSL or PTV injectors, the injected sample is vaporized and
only the gaseous compounds are flushed onto the GC column by means of the carrier gas. In
contrast, in on-column setups the sample is directly injected into the GC column. Consequently,
an on-column injector is mainly a fixation for the GC column. This way, an autosampler is able
to directly inject into the column (see Fig. 1.8).

28 1. Introduction
Fig. 1.8. Schematic overview of an on-column injector (Thermo Fisher Scientific, Dreieich, Germany)
Evaporation takes places inside the GC column. Thermostatting is controlled by the GC oven
itself. Opposed to classic injectors, on-column injection techniques ensure the complete transfer
of the sample into the GC [28]. Thermal degradation of labile compounds is minimized.
Furthermore, the transfer of high-boiling material is easily achieved. Unfortunately, the transfer
of non-volatile material cannot be avoided. Accumulation inside the GC column can be the
source for rapid degradation and peak shape deterioration [29].
In LC-GC setups, however, the LC pre-separation step is optimized to remove non-volatile
material. In these cases, on-column transfer is the method of choice to guarantee the complete
transfer of LC fractions.
Coupling of HPLC and GC is normally performed by means of a 6-port rotary HPLC valve.
Eluate from the LC column is guided either into waste direction or directly into the GC by a
thin fused silica capillary permanently inserted into the on-column injector (see Fig. 1.9).
One problem originating from permanent installation emerges after a finished liquid transfer.
In this situation, the transfer capillary is filled with LC eluate. If this residual liquid is not
removed, pronounced solvent peak tailing is observed on the GC detector because of diffusion
effects. Removal of this liquid (approximately 1–2 µL) is achieved by backflushing the transfer
capillary with clean GC carrier gas. Therefore, a high restriction capillary is installed on the 6-
port valve (see Fig. 1.9). The carrier gas is used to push residual liquid through the restriction
1: Syringe 2: Upper Block 3: PTFE Valve Seal 4: Fixing Nut 5: Cooling Sleeve 6: Seal 7: Stainless Steel Rotary Valve 8: Valve Lever A: Carrier Gas Inlet B: Secondary Cooling Inlet

1. Introduction 29
capillary. An inner diameter of 50 – 75 µm is sufficient to allow removal of the solvent while
maintaining the carrier gas flow rate needed for GC separation. Since this approach is working
like a carrier gas split, bigger diameter capillaries should be avoided.
Although the liquid is removed in this way, residual sample material is deposited inside the
transfer capillary. It can be the source for carryover or memory effects in a subsequent run.
Therefore, it is important to choose the right LC fraction window. The last few seconds of an
LC fraction should mainly consist of pure solvent.
Fig. 1.9. Connection between HPLC and an on-column injector (restriction capillary encircled in red) [30]
GC columns with an inner diameter of 0.53 mm permit insertion of a typical syringe needle or
fused silica transfer line. To allow the use of common GC column diameters for separation, this
wide-bore column is normally connected to a classic GC column by means of a pressfit or suited
metal connector. This way, the 0.53 mm (precolumn) can be used to allow sample injection
whereas a classic GC column is used for separation.
These fundamentals were the base for creation of the Dualchrom 3000. Nevertheless, it was
reported that a simple connection of LC and GC by an on-column injector bore the problem of
significant carryover of approximately 0.5 – 3 % [30]. Biedermann et al. investigated the

30 1. Introduction
sources and found the carryover in the dead volume inside the on-column injector. Therefore,
they proposed the use of a dead volume-free 3-way pressfit. The so called Y-interface takes the
place of the on-column injector. Carryover and memory effects were reported to be less than
0.1 % (see Fig. 1.10) [30].
Fig. 1.10. Replacement of the on-column injector by the Y-interface offering significantly less carryover and memory effects [30]
1.8.1 Alternative on-column techniques
It is worth mentioning that in the past several other on-column interfaces were reported, e.g., a
loop-type interface [31]. Nevertheless, in the past few years mainly the on-column interface
mentioned above was reported in literature.
1.8.2 Solvent trapping and band broadening
The evaporation of a sample inside a GC column follows defined rules. Injecting a liquid sample
directly into the column requires a GC oven temperature below the pressure corrected boiling
point of the sample solvent. Otherwise, evaporation of the sample at the column head would
generate a pressure surge inside the column hindering the introduction and spread-out of the
residual sample.

1. Introduction 31
The volume covered by the liquid sample inside the column is called “flooded zone”. The length
of the flooded zone is mainly dependent on the sample size, the column dimensions, and the
surface properties of the inner column walls. The process is visualized in Fig. 1.11.
Fig. 1.11. Formation of the flooded zone at the column entry: After formation of an instable film at the capillary wall, the flooded zone is generated in secondary processes thereafter [32].
Conventional capillaries are coated with nonpolar polysiloxane polymers. Therefore, surface
tension and other physical properties allow good wetting of the inner surface when nonpolar
solvents, such as alkanes, are used. This way, a stable liquid film is formed on the inner capillary
walls exhibiting a flooded zone of minimal length. On the contrary, if a polar solvent, e.g.,
methanol, is injected droplets are observed not able to wet the column surface. The observed
flooded zone is significantly enlarged. A few microliters can deeply penetrate into the column.
Evaporation of the sample is performed by saturation of the carrier gas starting at the column
entrance. As soon as it is saturated with solvent vapor, it flows unhindered through the residual
flooded zone and column. Discharge of the formed vapors requires travelling through the total
column and the installed detection system. During evaporation two observations can be made:
Primary flow as liquid plug
Secondary flow at the capillary wall

32 1. Introduction
- Volatile analytes co-evaporate with the solvent
- High boiling compounds reside at the location inside the column where they were
deposited during formation of the flooded zone
As evaporation of the flooded zone starts from the backside, volatile compounds co-evaporating
with the solvent are re-trapped and enriched in the residual solvent front. This process, called
“Solvent trapping’, is repeated till the residual solvent amount is minimized to a few microliters.
However, wetting of the column surface by the used solvent is one prerequisite for efficient
solvent trapping.
High boiling material is spread all over the flooded zone after evaporation. This phenomenon
is called “Band broadening in space”. Depending on the initial solvent amount, this size can
range from a few centimeters up to several meters. However, detection of a chromatographic
peak requires an initial band width of approximately 20–40 cm when conventional capillary
columns are used [34]. Therefore, re-focusing of high boiling material after evaporation is
necessary for a successful detection.
Narrowing of chromatographic bands requires consideration of a few aspects. Opposed to the
more common “Band broadening in time”, which is observed during conventional splitless
injections, band broadening in space is a consequence of direct injection into the column. While
effective use of solvent trapping (=lowering the GC oven temperature) can narrow the initial
band width caused by band broadening in time, this is not possible for band broadening in space.
The retention gap effect is an effective possibility to cope with large initial bands when band
broadening in space is observed. An uncoated fused silica capillary is coupled to the actual GC
column. If evaporation takes place in the uncoated capillary, the flooded zone is also located
inside this capillary. Because of missing stationary phase, migration of analytes is possible at
significantly lower GC oven temperatures compared to coated capillary columns. According to
Grob et al., migration temperatures are approximately 100 °C lower [35]. Because of this, this
type of capillary is also known as retention gap. As soon as the analytes reach the stationary
phase of the analytical column, further migration is slowed down. Enrichment of the analytes
in a small column segment is therefore possible. This effect is known as “Phase ratio focusing”.
As soon as the GC oven temperatures reaches temperatures suitable for migration in the
presence of a stationary phase, a typical chromatographic separation is thereafter feasible.
Enrichment for both analyte groups, i.e., volatile and high boiling analytes, is visualized in Fig.
1.12.

1. Introduction 33
Fig. 1.12. Reconcentration of the initial bands for volatile and high-boiling compounds inside a capillary column [32]
1.9 The early solvent vapor exit (SVE)
Discharge of the solvent vapors through the total GC column is not effective. Additionally, not
all detectors are compatible with high amounts of solvent vapors, e.g., ECD – electron capture
detector for detection of chlorinated compounds). Effective discharge of solvent vapors is
possible by using a SVE (Solvent vapor exit) [36].
Instead of direct coupling of retention gap and analytical column, an additional sidearm between
both columns is installed. At the end of this sidearm an electric valve is installed which is
opened against atmosphere during solvent evaporation. During analytical separation, however,
the valve is closed and only a small purge flow is maintained to purge the sidearm. By using an
SVE, discharge of solvent vapors is significantly increased (20 – 50 times) because flow
restriction is given only by the retention gap instead of the total column system [37].
34 1. Introduction
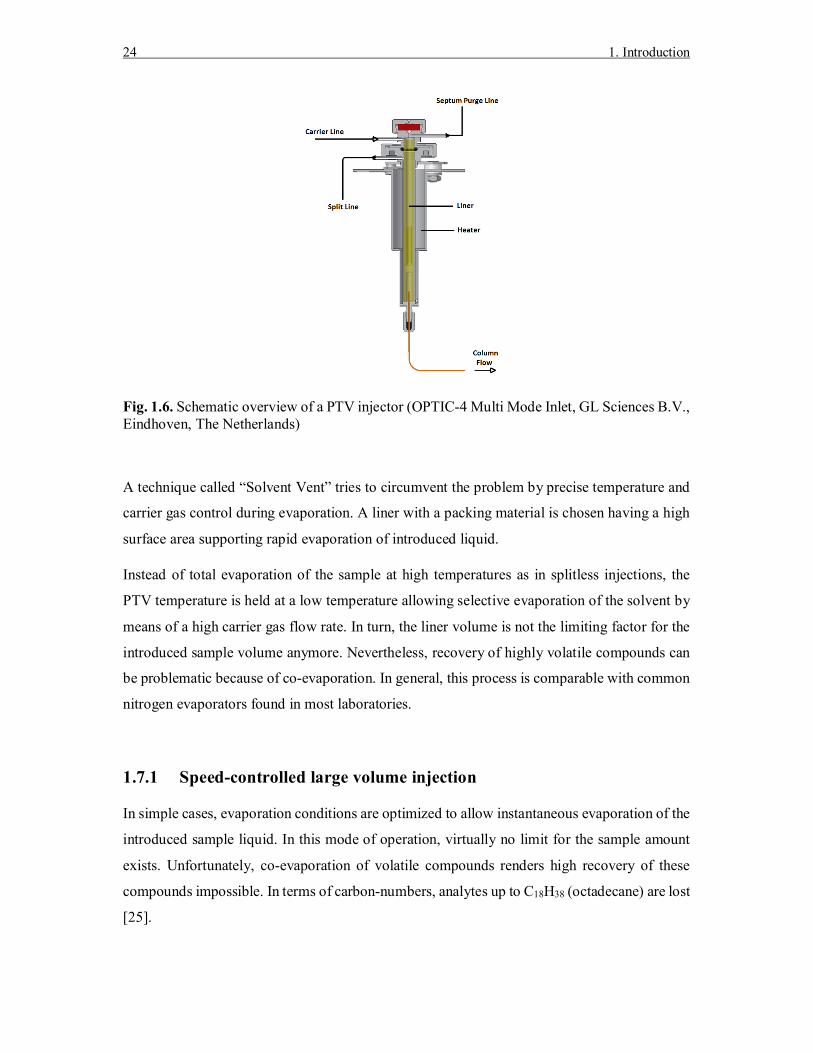
Fig. 1.13. Position of the solvent vapor exit (SVE) for the large-volume on-column technique between pre- and separation column [32]
1.9.1 Fully concurrent solvent evaporation (FCSE)
Two important kinds of sample introduction can be distinguished when using on-column
injection techniques: Fully and partially concurrent solvent evaporation. The first one
discharges the created solvent vapors at the speed of sample introduction through the SVE.
Therefore, only a short retention gap of 30–50 cm is needed providing enough flow resistance.
Since no solvent trapping is possible, highly volatile compounds are lost by solvent co-
evaporation (see Fig. 1.14). Minimizing these losses is possible by use of a retaining precolumn.
This is essentially a retention gap coated with a thin film of stationary phase, mostly a
polysiloxane polymer. When this precolumn is exposed to high solvent vapor amounts, a
swelling of the stationary phase is observed that can be used to trap volatile analytes. This effect
is known as “Phase soaking” and its consequences can be seen in Fig. 1.15.
As soon as the GC oven is heated after the sample introduction, the stationary phase swelling
is reversed and the trapped analytes can start chromatography. The length of the retaining
precolumn is derived from the maximum tolerable initial band width of the measured analyte.
Thus, approximately 30–50 cm are sufficient.
1. Introduction 35
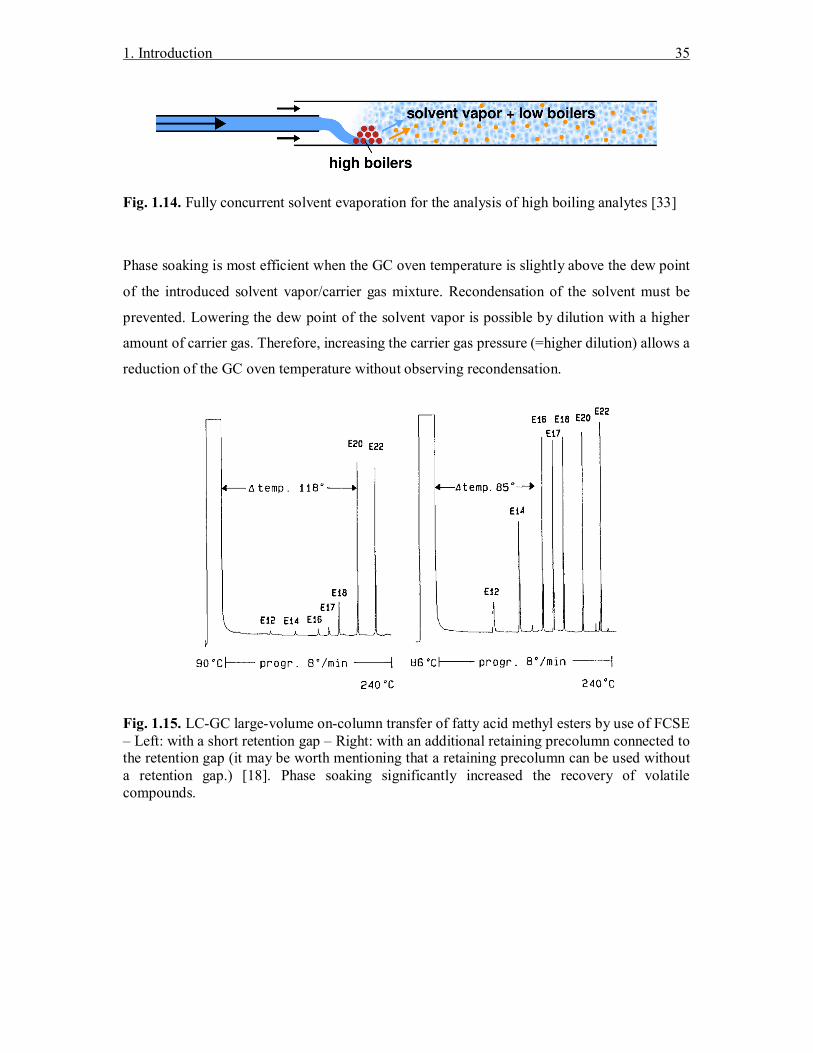
Fig. 1.14. Fully concurrent solvent evaporation for the analysis of high boiling analytes [33]
Phase soaking is most efficient when the GC oven temperature is slightly above the dew point
of the introduced solvent vapor/carrier gas mixture. Recondensation of the solvent must be
prevented. Lowering the dew point of the solvent vapor is possible by dilution with a higher
amount of carrier gas. Therefore, increasing the carrier gas pressure (=higher dilution) allows a
reduction of the GC oven temperature without observing recondensation.
Fig. 1.15. LC-GC large-volume on-column transfer of fatty acid methyl esters by use of FCSE – Left: with a short retention gap – Right: with an additional retaining precolumn connected to the retention gap (it may be worth mentioning that a retaining precolumn can be used without a retention gap.) [18]. Phase soaking significantly increased the recovery of volatile compounds.

36 1. Introduction
1.9.2 Partially concurrent solvent evaporation (PCSE)
If more volatile compounds have to be analyzed, partially concurrent solvent evaporation is the
method of choice. Retention gaps of 10 m length and 0.53 mm inner diameter allow the
introduction of approximately 1 mL of solvent. Retention of highly volatile compounds is
possible without loss (e. g. n-nonane or n-decane when n-hexane is used as solvent). Efficient
use of solvent trapping is the key point when working under PCSE conditions.
Discharge of the solvent vapors occurs at a speed slightly lower than the sample introduction
speed. Because of this, a flooded zone can be formed inside the retention gap able to trap volatile
material as explained above. After the end of transfer, the residual flooded zone is minimized
by elongation of the SVE closing time. Shortly before the last portion of solvent is evaporated,
the SVE is closed and the chromatographic separation is initiated.
Fig. 1.16. Partially concurrent solvent evaporation for the analysis of volatile compounds [33]

1. Introduction 37
1.10 References
[1] Gathungu, R. M.; Flarakos, C. C.; Satyanarayana Reddy, G.; Vouros, P. Mass Spec. Rev.
2013, 32(1), 72–86.
[2] Luke, M. A.; Froberg, J. E.; Masumoto, H. T. J. Assoc. Off. Anal. Chem. 1975, 58(5),
1020–1026.
[3] Majors, R. E. J. Chromatogr. Sci. 1980, 18(10), 571–579.
[4] Biedermann, M.; Fiselier, K.; Grob, K. J. Agric. Food Chem. 2009, 57, 8711–8721.
[5] Grob, K.; Lanfranchi, M.; Mariani, C. J. Am. Oil Chem. Soc. 1990, 67, 626–634.
[6] Grob, K.; Giuffré, A. M.; Biedermann, M.; Bronz, M. Fat Sci. Technol. 1994, 96(9),
341–345.
[7] Grob, K.; Biedermann, M.; Artho, A.; Schmid, J. P. Riv. Ital. Sost. Grasse 1994, 71,
533–538.
[8] Pietrogrande, M. C.; Michi, M.; Nunez Plasencia, M.; Dondi, F. Chromatographia
2002, 55, 189–196.
[9] Kamm, W.; Dionisi, F.; Hischenhuber, C.; Schmarr, H. G.; Engel, K. H. Eur. J. Lipid
Sci. Technol. 2002, 104, 756–761.
[10] Grob, K.; Biedermann, M.; Caramaschi, A.; Pacciarelli, B. J. High Resolut.
Chromatogr. 1991, 14, 33–39.
[11] Ong, R. C. Y.; Marriott, P. J. J. Chromatogr. Sci. 2002, 40, 276–291.
[12] Bicchi, C.; Brunelli, C.; Cordero, C.; Rubiolo, P.; Galli, M.; Sironi, A. J. Chromatogr.
A 2004, 1024(1–2), 195–207.
[13] Janssen, H. G., De Koning, S.; Brinkman, U. A. T. Anal. Bioanal. Chem. 2004, 378,
1944–1947.
[14] Nells, H. J. C. F.; De Leenheer, A. P. Anal. Chem. 1983, 55, 270–275.
[15] Grob, K.; Kälin, I. J. High Resolut. Chromatogr. 1991, 14, 451–454.
[16] Grob, K.; Kaelin, I.; Artho, A. J. High Resolut. Chromatogr. 1991, 14, 373–376.
[17] Biedermann, M.; Grob, K.; Meier, W. J. High Resolut. Chromatogr. 1989, 12, 591–598.
[18] Biedermann, M.; Bongratz, A.; Mariani, C.; Grob, K. Eur. Food Res. Technol. 2008,
228, 65–74.
[19] Lu, J.; Rustum, A. M. J. Chromatogr. Sci. 2009, 47(4), 320–323.
[20] Abbott, S. R. J. Chromatogr. Sci. 1980, 18(10), 540–550.
[21] Jandera, P. J. Chromatogr. A 2002, 965, 239–261.
[22] Meyer, V. R. J. Chromatogr. A 1997, 768, 315–319.
[23] Hoh, E.; Mastovska, K. J. Chromatogr. A 2008, 1186, 2–15.

38 1. Introduction
[24] Grob, K.; Fröhlich, D. J. High Resolut. Chromatogr. 1994, 17, 792–794.
[25] Bosboom, J. C.; Janssen, H. G.; Mol, H. G. J.; Cramers, C. A. J. Chromatogr. A 1995,
724, 384–391.
[26] Mol, H. G. J.; Hendriks, P .J .M.; Janssen, H. G.; Cramers, C. A.; Brinkman, U. A. T. J.
High Resolut. Chromatogr. 1995, 18, 124–128.
[27] Staniewski, J.; Rijks, J. A. J. Chromatogr. 1992, 623, 105–113.
[28] Purcaro, G.; Moret, S.; Conte, L.S. Talanta 2012, 105, 292–305.
[29] Grob, K. J. Chromatogr. 1984, 287, 1–14.
[30] Biedermann, M.; Grob, K. J. Chromatogr. A 2009, 1216, 8652–8658.
[31] Purcaro, G.; Moret, S.; Conte, L. J. Chromatogr. A 2012, 1255, 100–111.
[32] Mineralölanalytik im Lebensmittelbereich. Workshop des Bundesinstituts für
Risikobewertung (BfR) Berlin und des Kantonalen Labors Zürich; June 2010.
[33] Mineralöle in Lebensmittelverpackungen – Entwicklungen und Lösungsansätze.
Fachtagung des Bundesinstituts für Risikobewertung (BfR) Berlin; September 2011.
[34] Grob, K. On-Column Injection in Capillary GC; Hüthig: Heidelberg, 1987.
[35] Grob, K.; Kuhn, S. J. Chromatogr. 1984, 301, 1–9.
[36] Beens, J.; Tijssen, R. J. Microcolumn Sep. 1995, 7(4), 345–354.
[37] Grob, K.; Schmarr, H. G.; Mosandl, A. J. High Resolut. Chromatogr. 1989, 12, 375–
382.

2. Scope of this thesis 39
2. Scope of this thesis
Aim of this thesis was the generalization and expansion of the applicability of HPLC-GC
techniques in the field of food science. Methods developed as part of this work should not only
be of analytical value but also suited for the use in routine laboratories. Consequently, a
meaningful validation was part of all method developments.
Chapter three presents a method for the determination of stigmasta-3,5-diene, a marker
substance for the recognition of high temperature refining of extra virgin olive oils. This method
is chosen as a first example showing the advantages of an LC-GC hyphenation in routine
laboratories. Time-consuming column chromatography and manual work can be minimized to
the weighing process of the sample. An analytical process, which normally took hours of work,
is possible within 30 min without compromising sensitivity.
Chapter four describes the method development of an LC-GC-FID technique for the
determination of sterols in edible fats and oils. Addition of standard compounds, saponification,
and extraction of the samples is fully automated, showing that LC-GC is only a small part of a
complex analysis system. Comparison with an established ISO method shows the suitability of
the LC-GC approach in a high-throughput environment. Lastly, interfacing to a mass
spectrometer is used to elucidate the structure of a previously unknown substance solely found
in sunflower oils.
Chapter five deals with the quantitation of the vitamin D content in selected foodstuffs. The use
of an MS detector allows significantly lower detection limits and the possibility to quantify
vitamin D2 and D3 in one analysis cycle by means of deuterated standards. Again, the classical
approach is out-performed in terms of manual work and sample throughput.
The determination of polycyclic aromatic hydrocarbons (PAH) in a broad variety of foodstuffs
is the topic of chapter six. A generic sample preparation protocol is developed and combined
with a powerful two-dimensional LC-LC-GC-MS method. The second LC-dimension is needed
for sufficient sample cleanup demonstrating that even LC-GC hyphenation does not necessarily
fit every purpose of automated sample preparation.
The final seventh chapter focuses on the determination of mineral oil aromatic hydrocarbons
(MOAH) found in food. The chemical similarity to matrix-inherent constituents already
enlightened in chapter six hampers the safe quantitation of MOAH in several food matrices.
Separation of MOAH from these polyunsaturated hydrocarbons is not readily possible by
HPLC. Instead, chemical modification of the interfering compounds is used to change their
40 2. Scope of this thesis
elution behavior in the LC-GC-FID method. Usually, epoxidation is used for this purpose
exhibiting several deficiencies. As will be shown in this chapter, the reaction conditions for
epoxidation are of high importance for which automation is inevitable. Other derivatization
reactions of the polyunsaturated hydrocarbons are discussed and tested for their suitability in
the given context.
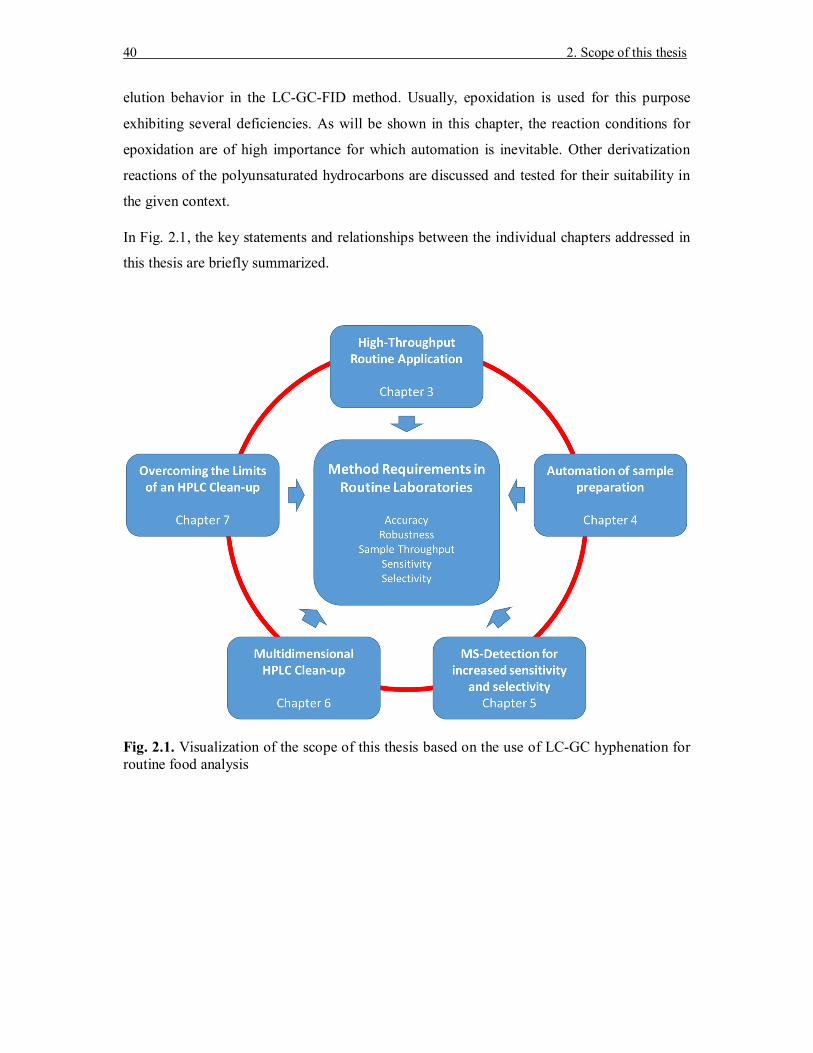
In Fig. 2.1, the key statements and relationships between the individual chapters addressed in
this thesis are briefly summarized.
Fig. 2.1. Visualization of the scope of this thesis based on the use of LC-GC hyphenation for routine food analysis

3. Quality assurance of edible oils and fats (Stigmasta-3,5-diene) 41
3. Evaluation of stigmasta-3,5-diene as indicator for
adulteration in extra virgin olive oil by online liquid
chromatography–gas chromatography–flame ionization
(LC-GC-FID)
Abstract
Detection of adulterations in high-price extra virgin olive oils is difficult and time-consuming.
Several indicators are known and needed to unmask adulterations. One of them is stigmasta-
3,5-diene that is formed mainly during forbidden high temperature treatments. Its detection is
described by two official ISO methods. One of them involves a lot of manual work while the
other is lacking selectivity, especially near the official upper limit of 0.05 mg/kg. Therefore, an
adapted analytical detection method was designed based on an LC-GC workflow combining
the advantages of both ISO approaches. Additionally, manual work could be reduced to the
sample weighing process only. The total runtime was 30 min. This new method was compared
to both ISO methods for extra virgin olive oil and aromatized truffle oil. In either case, good
agreement in terms of accuracy was found. Precisions complied with the theoretical
Horwitz/Thompson limits. The repeatability as indicated by relative standard deviations were
4.3 % and 2.0 % for olive and truffle oil, respectively. As a result, the designed method can be
recommended as high-throughput alternative for the existing ISO methods in routine
environments.
3.1 Introduction
Adulteration of high-price edible oils, such as extra virgin olive oils, is a profitable business. It
is therefore not surprising that low-quality oils are either directly classified as high-class oils or
are used as diluent for higher-class oils. In either case, the aim is to increase the profit margins
[1]. For this reason, regular quality control has to be performed in routine environments to
unmask adulterations and to maintain the high quality of edible oils.
As defined in EU regulation 1513/2001, virgin edible oils are obtained by mechanical and
physical extraction only [2]. Refining processes are regularly used to extract the last portions

42 3. Quality assurance of edible oils and fats (Stigmasta-3,5-diene)
of oil from the corresponding fruit. Additionally, during refining, the chemical and physical
properties are altered to increase the oil quality. Furthermore, properties can be specifically
optimized to match other oil qualities. Nevertheless, classification as higher-class oil is
forbidden and admixtures into higher-class oils have to be explicitly mentioned.
Revealing of adulterations is possible by analysis of specific chemical markers such as the fatty
acid composition or the sterol profile [3]. However, use of plants with inconspicuous fatty acid
compositions or desterolization, i.e., the removal of sterols during refining, can complicate the
detection of adulterations [4]. Because of this, monitoring of a variety of parameters is
necessary to detect suspicious oils.
In the literature, several marker substance classes are listed which are formed during various
refining steps [5]. For example, sterenes (steradienes and steratrienes) are known indicators for
high temperature treatments [6]. Their natural concentration in virgin oils is often negligible.
They are the dehydration products of naturally occurring plant sterols (see Table 3.1 and Fig.
3.1).
The dehydration of sterols is observable at temperatures exceeding 200 °C [7]. Furthermore, it
is known that bleaching earth is capable to lower the formation temperature.
Table 3.1. Main dehydration products of sterols
Sterol Sterene
Cholesterol Cholesta-3,5-diene
Brassicasterol Campesta-3,5,22-triene
Campesterol Campesta-3,5-diene
Stigmasterol Stigmasta-3,5,22-triene
β-Sitosterol Stigmasta-3,5-diene

3. Quality assurance of edible oils and fats (Stigmasta-3,5-diene) 43
Fig. 3.1. Dehydration of sterols shown for β-sitosterol
Sterenes can be detected in oils even after desterolization. Furthermore, the sterene profile
mostly resembles the original sterol profile giving the possibility to figure out which kind of oil
was used for adulteration [8]. Because of this, they are a valuable marker for detection of
adulterations.
Especially for olive oils, the monitoring of the sterene content seems promising. Since the total
sterol content of (extra) virgin olive oils is rather low (1000 – 2000 mg/kg) and mainly consists
of β-sitosterol, the presence of sterenes indicates the application of high temperature refining
processes or the admixture of other (refined) oils.
After temperature treatments of olive oil, for example, high amounts of stigmasta-3,5-diene and
its double bond isomers (e.g., stigmasta-2,4-diene) can be traced. They are originating from β-
sitosterol (see Table 3.1), the most abundant sterol in vegetable oils. The concentrations of other
steradienes in unaltered olive oils, however, are rather low compared to stigmasta-3,5-diene
and can be neglected [9].
Therefore, the monitoring of stigmastadiene in olive oils with stigmasta-3,5-diene as main
compound was decided by the International Olive Council (IOC). The EU regulation 1348/2013
(2568/91) regulates the allowed concentrations of stigmasta-3,5-diene for several olive oil
quality grades [10, 11]. In 2013, the maximum level was set to 0.05 mg/kg for (extra) virgin
olive oils. Lampante virgin olive oils are allowed to contain up to 0.5 mg/kg.
Consequently, the control of stigmasta-3,5-diene levels in olive oil has to performed in routine
environments to guarantee the quality of high class olive oils such as the extra virgin ones.

44 3. Quality assurance of edible oils and fats (Stigmasta-3,5-diene)
3.1.1 Analytics
Two official ISO methods for the determination of stigmasta-3,5-diene are available [12, 13].
The first method (ISO 15788-1), which is recommended as reference method by the IOC,
separates the steradiene fraction from other components in olive oils by saponification and
subsequent silica gel column chromatography of the unsaponifiable matter. Afterward,
detection and quantitation of stigmasta-3,5-diene is performed by GC-FID. Cholesta-3,5-diene
is used as internal standard (ISTD).
The second method (ISO 15788-2) is relying on HPLC-UV. In contrary to the first method, the
steradiene fraction is separated from the matrix by direct solid phase extraction (SPE) on silica
gel without previous saponification. Afterward, detection and quantitation is performed with
HPLC-UV on a C18 column under non-aqueous reversed-phase (NARP) conditions.
Collaborative trials revealed in the past that the first method gives more accurate results, while
the second method is lacking selectivity (especially for low concentrations) because of the
usage of nonselective UV detection [12, 13]. Nevertheless, it needs significantly less manual
work compared to the first one and is, therefore, suited as fast screening method.
Independently, several attempts of HPLC and GC-FID hyphenation for the determination of
steradienes were reported in the past [14–17]. Direct injection of edible oils after dilution was
possible. Normal-phase HPLC was performed on silica gel to separate the steradiene fraction
from the residual matrix. Transfer of the steradienes into the GC was generally performed by
large volume on-column transfer. Limits of detection (LOD) were reported to be as low as 0.02
mg/kg [15]. Thus, suitability for the newest limits could be insufficient or restricted.
Aim of the current work was the establishment of an online LC-GC-FID method able to cope
with the newest EU regulation limits for stigmasta-3,5-diene in (extra) virgin olive oils. The
manual work was reduced to the weighing process. Dilution, addition of ISTD, and injection
were automatically performed by an autosampler.
Comparison with the reference and screening methods was performed to check the suitability
of the method in routine environments.
3. Quality assurance of edible oils and fats (Stigmasta-3,5-diene) 45
3.2 Experimental
3.2.1 Samples
Well-characterized extra virgin olive oil and truffle oil were available from Eurofins Analytik
GmbH & Co. KG (Hamburg, Germany). They were used for method development and
validation.
3.2.2 Chemicals and solutions
Dichloromethane and n-hexane were from LGC Promochem (Picograde quality, Wesel,
Germany). Cholesta-3,5-diene (≥95 %) was from Sigma-Aldrich (Steinheim, Germany).
3.2.3 Sample preparation
Three grams of an edible oil were weighed into a 10-mL autosampler vial. The vial was placed
onto the autosampler, which added 100 µL of the ISTD solution (500 ng/µL in n-hexane) and
6.9 mL of n-hexane. The vial was placed into an agitator and was shaken at a speed of 750 rpm
(revolutions per minute) for one minute. Afterward, 70 µL of the solution were subjected to
LC-GC-FID.
3.2.4 LC-GC-FID method
LC-GC-FID experiments were performed on a system from Axel Semrau (Sprockhövel,
Germany). It consisted of a 1260 Infinity HPLC system (binary pump and variable wavelength
detector by Agilent Technologies, Waldbronn, Germany), Master GC with flame ionization
detector (DANI Instruments S.p.A., Cologno Monzese, Italy), and a DualPAL autosampler
(CTC Analytics AG, Zwingen, Switzerland).
Three rotatory switching valves (VICI AG International, Schenkon, Switzerland) were used to
guide the HPLC eluent from the HPLC into the GC. The GC was equipped with an on-column
interface and a solvent vapor exit. The on-column interface, the carrier gas, and solvent vapor
exit were controlled by CHRONECT LC-GC from Axel Semrau.
Seventy microliters (corresponding to 21 mg of edible oil) of the diluted sample were injected
onto an Allure Si HPLC column (250 mm x 2.1 mm, 5 µm, 60 Å, Restek, Bellefonte, PA, USA)

46 3. Quality assurance of edible oils and fats (Stigmasta-3,5-diene)
without additional column temperature control. The mobile phase consisted of n-hexane and
was delivered at 300 µL/min. After elution of the steradiene fraction (5.0 – 6.0 min), the column
was backflushed with dichloromethane at 500 µL/min for 10 min. Afterward, the column was
reconditioned with n-hexane at 500 µL/min for 15 min.
LC-GC transfer occurred by the retention gap technique and fully concurrent solvent
evaporation (FCSE) through the Y-interface [18]. An uncoated, deactivated precolumn (MXT
Hydroguard, 0.5 m x 0.53 mm, Restek, Bellefonte) was followed by a steel T-piece union
connecting to the solvent vapor exit and a separation column coated with a 5 % phenyl
polydimethylsiloxane film (Rxi-5Sil MS, 30 m x 0.25 mm x 0.10 µm, Restek, Bellefonte, PA,
USA).
From HPLC, the steradiene fraction was transferred to the GC (resembling 300 µL) at a carrier
gas inlet pressure of 80 kPa (hydrogen) in addition to an oven temperature of 80 °C. The elution
window was verified by UV detection at 235 nm. The solvent vapor exit was opened 0.5 min
before the elution of the sterene fraction began. Because of the high boiling points of the
analytes, fully concurrent evaporation of the solvent was possible without loss of substances
through the solvent vapor exit. The solvent vapor exit was closed 0.1 min after the fraction was
transferred. At this time, the carrier gas inlet pressure was set to 90 kPa and maintained
throughout the whole analysis. The oven temperature was programmed at 30 °C/min from 80
°C (4 min) to 170 °C and at 10 °C/min to 300 °C (3 min, total run time 23.00 min). The FID
base temperature was set to 350 °C. The gas flows for air, hydrogen, and nitrogen were set to
280, 40, and 25 mL/min, respectively.
Data processing was performed with Clarity 5.5 (DataApex, Prague, Czech Republic).
Quantitation was based on cholesta-3,5-diene used as ISTD. The stigmasta-3,5-diene content
was calculated following the equation
푆 =퐴 ∗푚퐴 ∗ 푚
with S: stigmasta-3,5-diene content [mg/kg], AStigma: peak area of analyte, AISTD: peak area of
ISTD, mISTD: mass of ISTD [mg], mSample: mass of test sample [kg].

3. Quality assurance of edible oils and fats (Stigmasta-3,5-diene) 47
3.3 Results and Discussion
The restrictions of the official ISO methods for the determination of stigmasta-3,5-diene in
edible oils were conquered by the development of an LC-GC based workflow.
For separation of the steradiene fraction from the rest of the edible oil, a silica gel HPLC column
with an inner diameter of 2.1 mm was chosen. According to the literature, a 2.1 mm x 25 cm
column can retain up to 62.5 mg of triglycerides when n-hexane is used as the mobile phase
[19]. Silica gel flooded by triglycerides is not able to retain other components anymore. Hence,
only approximately half of the calculated capacity can be used for retention of triglycerides.
For safety reasons, only 21 mg of edible oils were injected onto the chosen column. To lower
the viscosity of the injected solution, edible oils were diluted to a 30 % n-hexanic solution
before injection by the autosampler. Consequently, a desired LOQ for stigmasta-3,5-diene of
0.05 mg/kg corresponded to an amount of approximately 1 ng on column, which was readily
compatible with GC-FID detection.
Backflushing of the HPLC column after elution of the steradiene fraction was used to efficiently
remove the residual oil matrix. Dichloromethane was chosen as backflushing solvent. On the
one hand, its polarity was sufficiently high to remove the oil matrix; on the other hand, the
HPLC column could be reconditioned with n-hexane afterward in approximately 15 min.
Solvents exhibiting higher solvent strengths, such as ethers or alcohols, could not be removed
in an appropriate amount of time [20].
Cholesta-3,5-diene was chosen as internal standard. It was suited because it was commercially
available and was co-eluted with stigmasta-3,5-diene on the HPLC under normal-phase
conditions [1, 16, 17].
At first, a cholesta-3,5-diene standard (15 ng on column) was injected onto the HPLC to retrieve
the retention time of the steradiene fraction window (see Fig. 3.2a – blue trace). A wavelength
of 235 nm was used to follow the conjugated double bond of the steradiene skeleton. Afterward,
an extra virgin olive oil sample was prepared and subjected to LC-GC-FID. In Fig. 3.2 (red
traces), the obtained HPLC-UV and LC-GC-FID chromatograms are shown.

48 3. Quality assurance of edible oils and fats (Stigmasta-3,5-diene)
Fig. 3.2a. HPLC-UV chromatogram of an ISTD solution (blue trace) and extra virgin olive oil (red trace) (Wavelength: 235 nm)
Fig. 3.2b. LC-GC-FID chromatogram of extra virgin olive oil
The LC-GC-FID chromatogram did not show any sort of chromatographic interference.
Because LC elution was possible with n-hexane only, co-elution of squalene and other
polyunsaturated compounds could be prevented. Natural concentrations of squalene in olive oil
are approximately 5000 mg/kg and were reported to be the origin of chromatographic problems
in the past [16, 17].
3.3.1 Precision and trueness
Precision was determined by multiple injections of extra virgin olive oil and truffle oil
(aromatized refined sunflower oil). Truffle oil was chosen because of its inherent higher
stigmastadiene content. Repeatability was calculated from six consecutive injections of six
independently provided oils. Since no official reference material was available, the same
samples were used for the estimation of trueness instead. The results are summarized in Table
3.2.
[min.]Time
2 4 6 8
[mAU]
AU
10
15
20
25
30
[min.]Time
5 10 15 20
[mV]
Vol
tage
20
40
60
80
100
Cholesta-3,5-diene
Stigmasta-3,5-diene

3. Quality assurance of edible oils and fats (Stigmasta-3,5-diene) 49
Table 3.2. Comparison of quantitative results by LC-GC-FID, GC-FID, and HPLC-UV
Mean concentration [mg/kg]
LC-GC-FIDa GC-FIDb HPLC-UVb
Extra virgin olive oil 0.035 (± 0.002) 0.039 0.045
Truffle oil 3.06 (± 0.06) ---c 2.32 a: Mean value of six consecutive injections (n = 6) b: Data were kindly supplied by Eurofins Analytik GmbH & Co. KG. c: Data were not available.
The obtained relative standard deviations of repeatability were 4.3 % and 2.0 % for extra virgin
olive oil and truffle oil, respectively. According to Thompson, acceptable relative standard
deviations below 0.12 mg/kg under repeatability conditions are fixed at 14.7 % [21]. At 3
mg/kg, they are calculated to be approximately 9 %. Accordingly, the obtained precisions were
both acceptable.
The quantified mean concentrations corresponded well to both ISO methods. In the case of
truffle oil, slightly higher values were quantified compared to the HPLC-UV method.
In Fig. 3.3, the LC-GC-FID chromatogram of the truffle oil is shown. The chromatogram
contains various peaks besides the ISTD and stigmasta-3,5-diene. Depending on the nature of
the refined oil, additional sterol degradation products can be observed [9]. They might be
responsible for the discrepancy between the LC-GC and HPLC-UV results.
Fig. 3.3. LC-GC-FID chromatogram of the sterene fraction of truffle oil, an aromatized refined sunflower oil (1 = Cholesta-3,5-diene (ISTD), 2 = 3,5-Cyclo-6-stigmastene, 3 = Campesta-3,5-diene + Campesta-2,4-diene, 4 = Unknown Stigmastadiene + Stigmasta-3,5,22-triene, 5 = Stigmasta-2,5-diene, 6 = Stigmasta-3,5-diene + Stigmasta-2,4-diene). Nomenclature according to Grob et al. [9].
[min.]Time
13 14 15 16 17 18
[mV]
Vol
tage
10
20
30
40
50
60
70
1
2 3 4 5
6

50 3. Quality assurance of edible oils and fats (Stigmasta-3,5-diene)
3.3.2 Sensitivity
To estimate the LOQ of the designed method, extra virgin olive oil was diluted to correspond
to a concentration of 0.01 mg/kg. For this, only 6 mg of oil were injected onto the HPLC. In
Fig. 3.4, the obtained LC-GC-FID chromatogram is shown. The analyte peak is still quantifiable
without chromatographic uncertainties. Quantitation revealed an amount of 0.011 mg/kg,
closely matching the targeted value.
Fig. 3.4. LC-GC-FID chromatogram of extra virgin olive oil corresponding to 0.011 mg/kg stigmasta-3,5-diene. The signal-to-noise ratio was calculated to be 34:1.
Judging from the signal-to-noise ratio (SNR) of this injection, the LOQ (SNR = 10) was
estimated at 0.003 mg/kg. Nevertheless, it has to be kept in mind that additional matrix
components of other types of samples could increase this theoretical quantitation limit.
[min.]Time
10 12 14 16 18 20
[mV]
Volta
ge
12
13
14
15
16 Cholesta-3,5-diene
Stigmasta-3,5-diene

3. Quality assurance of edible oils and fats (Stigmasta-3,5-diene) 51
3.4 Conclusion
The determination of the stigmastadiene content in extra virgin edible oil was possible by an
LC-GC-FID method. The limit of quantitation was estimated to be approximately 0.003 mg/kg.
Therefore, the current official upper limit of 0.05 mg/kg in (extra) virgin olive oils could be
safely quantified.
Opposed to the official ISO methods, which need either significant amount of manual work or
are lacking selectivity, the shown method successfully combines both attempts. The final
analysis result was available after approximately 30 min.
The obtained quantitative results of the available reference samples were in good agreement
with both official methods. Repeatability fully complied with the Horwitz/Thompson limits.
Because of this, the method can be applied without known limitations as a replacement for
existing methods in routine environments.
Acknowledgements
Dr. Torben Küchler and Hannes Boysen from Eurofins Analytik GmbH & Co. KG are thanked
for their help during creation of this work and for the supply of samples.

52 3. Quality assurance of edible oils and fats (Stigmasta-3,5-diene)
3.5 References
[1] Grob, K.; Artho, A.; Mariani, C. Fat Sci. Technol. 1992, 94, 394–400.
[2] The European Commission. Off. J. Eur. Union 2001, 201, 4–7.
[3] Aparicio, R.; Aparicio-Ruíz, R. J. Chromatogr. A 2000, 881, 93–104.
[4] Biedermann, M.; Grob, K.; Mariani, C.; Schmid J. P. Z. Lebensm. Unters. Forsch. 1996,
202, 199–204
[5] Aparicio, R.; Conte, L. S.; Fiebig, H. In Handbook of Olive Oil: Analysis and
Properties; Aparicio, R.; Harwood, J.; Springer Science+Business Media: New York,
2013, pp. 589–653.
[6] Lanzon, A.; Cert, A.; Albi, T. Grasas y Aceites 1989, 40, 385–389.
[7] Brühl, L.; Fiebig, H. J. Fat Sci. Technol. 1995, 97, 203–208.
[8] Crews, C.; Calvet-Sarett, R.; Brereton P. JAOCS 1997, 74, 1273–1280.
[9] Grob, K.; Biedermann, M.; Artho, A.; Schmid J. P. Riv. Ital. Sost. Grasse 1994, 71,
533–538.
[10] The European Commission. Off. J. Eur. Union 2013, 338, 31−67.
[11] The European Commission. Off. J. Eur. Union 1991, 248, 1−137.
[12] International Standard Office. ISO 15788-1, 1999.
[13] International Standard Office. ISO 15788-2, 2003.
[14] Grob, K.; Giuffré, A. M.; Leuzzi, U.; Mincione, B. Fat Sci. Technol. 1994, 96, 286–
290.
[15] Grob, K.; Bronz, M. Fett 1994, 96(7), 252–255.
[16] Grob, K.; Giuffré, A. M.; Biedermann, M.; Bronz, M. Fat Sci. Technol. 1994, 96, 341–
345.
[17] Toschi, T. G.; Bendini, A.; Lercker, G. Chromatographia 1996, 43, 195–199.
[18] Biedermann, M.; Grob, K. J. Chromatogr. A 2009, 1216, 8652–8658.
[19] Grob, K.; Kaelin, I.; Artho, A. J. High Resolut. Chromatogr. 1991, 14, 373–376.
[20] Biedermann, M.; Fiselier, K.; Grob, K. J. Agric. Food Chem. 2009, 57, 8711–8721.
[21] Thompson, M. Analyst 2000, 125, 385–386.

4. Quality assurance of edible oils and fats (Sterols) 53
4. Determination of the total sterol content in edible oils
and fats by online liquid chromatography–gas
chromatography–flame ionization detection (LC-GC-
FID) with fully automated sample preparation
Abstract
Adulterations of high-price edible oils is a lucrative business. Ensuring the oil quality is
therefore of great importance. One parameter used to determine the authenticity of oils is the
analysis of their sterol profile. The gas chromatographic determination of sterols in edible oils
and fats is described by ISO norm 12228. Extraction, purification, and detection of the sterols
is time-consuming and error-prone. Collaborative trials prove this regularly. Purification by
thin-layer chromatography (TLC) and robust GC determination of all regulated sterols is not
straightforward. Therefore, a fully automated LC-GC-FID method was developed to facilitate
the determination of sterols. The only manual step left was to weigh the sample into an
autosampler vial. Saponification and extraction were performed by an autosampler while
purification, separation, and detection were accomplished by online coupled normal-phase LC-
GC-FID. Interlacing of sample preparation and analysis allowed an average sample throughput
of one sample per hour. The obtained quantitative results were fully comparable with the ISO
method with one apparent exception. In the case of sunflower oils, an additional unknown sterol
could be detected generally missed by ISO 12228. The reason was found in the omission of
sterol silylation before subjection to GC-FID. The derivatization reaction changed the retention
time and hid this compound behind a major sterol. The compound could be identified as 14-
methyl fecosterol. Its structure was elucidated by GC-MS and ensured by HPLC and GC
retention times. Finally, validation of the designed method confirmed its suitability for routine
environments.

54 4. Quality assurance of edible oils and fats (Sterols)
4.1 Introduction
Sterols are naturally occurring compounds in animals and plants. The best-known sterol is
cholesterol, which is found in animals, and stabilizes cell membranes. Similar functions can be
attributed to sitosterol in plants. Among other compounds, this sterol is counted to the plant
sterols (phytosterols) [1].
Sterols, in particular phytosterols, are important compounds for the nutrition and health
industry. They are known to have a variety of biological effects [1]. It was reported in the past
that compounds derived from phytosterols and their saturated analogues (phytostanols) have
beneficial effects on the cardiologic system [2]. Foodstuffs, such as margarines, are enriched
with phytosteryl esters to lower the cholesterol level in the human body. This effect is based on
the structural similarities between cholesterol and phytosterols. They compete for the same
absorption sites in the human organism [2]. Phytosterols are also used as emulsifiers in the
cosmetic industry and are important steroidal precursors for hormone pharmaceuticals [3].
Sterols are found in the unsaponifiable matter and belong to the class of triterpenes. The
synthesis pathway for all sterols is outlined in Fig. 4.1. The structure is derived from sterane
hydroxylated at C-3 (see Fig. 4.2). The sterol skeleton carries a double bond at varying position,
mainly found at C-5(6) (Δ5) or C-7(8) (Δ7). Compounds missing this double bond are called
stanols. Additionally, C-17 contains a variable branched alkyl sidechain with possible
additional double bonds. Sterols can be divided into three main classes based on the number of
methyl groups at C-4, two (4,4-dimethyl), one (4-methyl) and none (4-desmethyl). The term
sterol is often used as a synonym for 4-desmethyl sterols. 4,4-Dimethyl and 4-methyl sterols
are metabolic intermediates transformed into 4-desmethyl sterols at the end of the pathway.

4. Quality assurance of edible oils and fats (Sterols) 55
Fig. 4.1. Synthesis pathway for triterpenes and sterols (from [4] with permission)
Fig. 4.2. Nomenclature of sterols (from [4] with permission)
Sterols can occur either as free alcohols or bound to other molecules, e.g., fatty acids, ferulates,
or glycosides [4]. In animals, cholesterol is the most abundant sterol while in plants the most
encountered phytosterols are campesterol, stigmasterol, and sitosterol [5]. In addition,
numerous minor sterols with percentages less than 5 % of the total sterol content can be found.
The total sterol amount in edible oils generally varies between approximately 1000 and 10,000
mg/kg [6].

56 4. Quality assurance of edible oils and fats (Sterols)
4.1.1 Phytosterols as quality markers for edible oils and fats
Because of unique plant-specific compositions, phytosterols are used as quality markers for
natural products such as edible oils and fats. The control of distribution and total amount of
phytosterols is an important tool for ensuring the purity of high quality oils, e.g., extra virgin
olive oils. ISO 12228 describes a gas chromatographic method for the determination of fifteen
individual 4-desmethyl phytosterols and phytostanols in edible oils and fats [7]. In Fig. 4.3 and
Table 4.1, an overview of all regulated compounds is given.
Fig. 4.3. Phytosterols and stanols regulated by ISO 12228 (adapted from [7] – A: Sunflower, B: Rapeseed, C: Olive oil – Peak allocations found in Table 4.1)
Table 4.1. Phytosterols and stanols regulated by ISO 12228 [7]
Peak no. Compound name
1 Cholesterol
2 Cholestanol (ISTD, not shown)
3 Brassicasterol
4 24-Methylene cholesterol
5 Campesterol
6 Campestanol
7 Stigmasterol
8 Δ7-Campesterol
9 Δ5,23-Stigmastadienol
10 Clerosterol
11 Sitosterol
12 Sitostanol
13 Δ5-Avenasterol
14 Δ5,24-Stigmastadienol
15 Δ7-Stigmastenol
16 Δ7-Avenasterol

4. Quality assurance of edible oils and fats (Sterols) 57
Admixtures of low-grade oils, e.g., rapeseed or sunflower oil, can be traced down to a few
percent due to their prominent sterol distributions [8]. However, heating or bleaching of
inexpensive oils can be used for desterolization [9]. Hence, the unique sterol distribution is
destroyed. Admixtures cannot be safely detected anymore by sole analysis of the sterol profile.
Because of this, numerous quality markers have to be used to ensure oil qualities.
EU regulation 1348/2013 specifies markers to ensure the quality of olive oils. Among other
parameters, it regulates also the percentage distribution and upper limits of 4-desmethyl sterols
[10]. Depending on the olive oil quality level, e.g., extra virgin, virgin, pomace, etc., differing
limits were defined. For instance, extra virgin olive oils must contain more than 1000 mg/kg
phytosterols with a sitosterol content exceeding 93 % (with regard to the total sterol content).
4.1.2 Analytics of phytosterols in edible oils and fats
Numerous publications dealing with the determination of phytosterols in edible oils can be
found [11–14]. ISO 12228 is most widespread in routine environments in Europe. In general,
the first step involves liberation of all bound phytosterols into their free alcohol analogues. Most
of the bound phytosterols are esterified and can therefore be cleaved by alkaline saponification.
Only few foodstuffs, such as tomatoes, contain acetal-bound phytosterols, which cannot be
cleaved by alkaline treatments. Saponification is normally performed by addition of an
alcoholic solution of potassium hydroxide (KOH) to the sample. Transesterification of
esterified phytosterols is another approach described in literature [15]. After the reaction is
finished, the free sterols are most commonly solvent-extracted into diethyl ether. Newer
versions of ISO 12228 circumvent solvent-extraction, because formation of emulsions was
regularly observed. Instead, extraction by solid-phase extraction (SPE) on aluminum oxide was
established. In the following step, a chromatographic cleanup of the sterols from the rest of the
unsaponifiable matter is performed by means of thin-layer chromatography (TLC). The
cleaned-up sterol fraction is generally silylated (TMS-phytosterols) to improve analyte-
stationary phase interactions in the subsequent GC-FID separation (gas chromatography–flame
ionization detection). Due to the quasi-unity response of the FID, quantitation of all sterols is
possible by a single internal standard compound. Normally, 5α-cholestanol is used for this
purpose, which is added before saponification.
The extraction of 4-desmethyl sterols from edible oils is demanding. Besides the bulk of
triglycerides, edible oils contain many other compounds disturbing the determination of 4-

58 4. Quality assurance of edible oils and fats (Sterols)
desmethyl sterols. The unsaponifiable matter consists mainly of hydrocarbons, carotenes,
tocopherols, different sterol classes, and triterpene dialcohols [16]. Because of this complex
composition, a cleanup after extraction is inevitable. As already stated, silica TLC is the option
described by ISO 12228. Since TLC is a complicated and time-consuming method, several
alternatives were described in the past. Online coupled LC-GC-FID was one option [17–21].
The online coupling of HPLC and GC offers several advantages compared to manual methods
such as reduction of manual sample preparation, decrease of cross-contamination, and increase
of sample throughput.
After sterol extraction, the cleanup is performed by HPLC instead of silica TLC. The obtained
fraction is online transferred into GC-FID either by use of on-column transfer techniques or
programmable temperature vaporization (PTV) injectors [22]. Besides a few publications
dealing with reversed-phase HPLC, normal-phase HPLC on silica gel is encountered the most.
Silylation of the sterol fraction is omitted in most cases to facilitate the transfer into the GC.
Hence, this might be a possible source of quantitation discrepancies when comparing LC-GC
methods to ISO 12228.
The quantitation of all fifteen regulated 4-desmethyl sterols and stanols is not straightforward.
Collaborative trials showed in the past that secure determination of the minor sterols (< 5 % of
total sterol content) was error-prone [23]. Relative standard deviations under reproducibility
conditions greater than 100 % were observed. In own studies problems due to difficulties in the
TLC step and insufficient GC analyte separations were the main reasons for varying results.
Therefore, the focus of the current work was laid on automation of the sample preparation using
analytical HPLC to improve accuracy. This was accomplished by the use of a versatile
autosampler and an online LC-GC-FID approach.
4.2 Experimental
4.2.1 Samples
ISO 12228-1:2011 collaborative trial samples from 2012 were available and used for method
development and validation. They consisted of rapeseed, safflower, and sunflower oil.
Additionally, a phytosterol concentrate from a previous collaborative trial (2010) was
measured.

4. Quality assurance of edible oils and fats (Sterols) 59
4.2.2 Chemicals and solutions
Ethanol, methyl-tert-butyl ether (MTBE), n-hexane, and isopropanol were from LGC
Promochem (Picograde quality, Wesel, Germany). 5α-Cholestanol (≥95 %), citric acid (99 %),
and potassium hydroxide (≥85 %, pellets, white) were from Sigma-Aldrich (Steinheim,
Germany). Sodium sulfate was from Fluka (Buchs, Switzerland). Water was supplied from a
Milli-Q water purification system (Merck, Darmstadt, Germany).
4.2.3 Sample preparation
One hundred milligrams of an edible oil or fat were weighed into a 10-mL autosampler vial.
The vial was placed onto the autosampler, which added 100 µL of the internal standard solution
(ISTD, 1 g/L in MTBE) and 1.5 mL of an ethanolic KOH solution (1 mol/L). The vial was
placed into an agitator set to 80 °C for 40 min and was shaken at a speed of 500 rpm (revolutions
per minute). After cooling down, 4.9 mL of n-hexane and 2.5 mL of a saturated aqueous citric
acid solution were added to the vial. Neutralization and extraction of the sterol fraction was
accomplished by shaking the vial for 3 min at 750 rpm. Depending on the expected phytosterol
content of the edible oil, an intermediate dilution step was carried out to avoid overloading of
the GC column during the separation process. Reduction of the sample amount to less than 100
mg was not considered, because it would have excluded the usage of low-resolution laboratory
balances. Dilution was performed in a 2-mL autosampler vial filled with a spatula tip of sodium
sulfate to dry the sample. For edible oils with a phytosterol content up to 1500 mg/kg, 333 µL
of the n-hexanic solution from the 10-mL vial were transferred into the 2-mL vial and brought
up to a final volume of 1 mL with additional n-hexane. After shaking at 750 rpm for 1 min, 10
µL of the solution were subjected to LC-GC-FID. The whole procedure is summarized in Fig.
4.4.

60 4. Quality assurance of edible oils and fats (Sterols)
Fig. 4.4. Flowchart of automated sample preparation for edible oils and fats
4.2.4 LC-GC-FID method
LC-GC-FID experiments were performed on a system from Axel Semrau (Sprockhövel,
Germany). It consisted of a 1260 Infinity HPLC system (binary pump and variable wavelength
detector by Agilent Technologies, Waldbronn, Germany), Master GC with flame ionization
detector (DANI Instruments S.p.A., Cologno Monzese, Italy), and a DualPAL autosampler
(CTC Analytics AG, Zwingen, Switzerland).
Three rotatory switching valves (VICI AG International, Schenkon, Switzerland) were used to
guide the HPLC eluent from the HPLC into the GC. The GC was equipped with an on-column
interface and a solvent vapor exit. The on-column interface, the carrier gas, and solvent vapor
exit were controlled by CHRONECT LC-GC from Axel Semrau.
Ten microliters of the sample extracts prepared by the autosampler were injected onto an Allure
Si HPLC column (250 mm x 2.1 mm, 5 µm, 60 Å, Restek, Bellefonte, PA, USA) without

4. Quality assurance of edible oils and fats (Sterols) 61
additional column temperature control. The mobile phase consisted of n-hexane and
isopropanol (98:2, v/v) and was delivered isocratically at 300 µL/min. The 4-desmethyl sterol
fraction was eluted between 9.8 to 12.1 min. Thereafter, the column was backflushed with
MTBE at 500 µL/min for 5 min. Finally, the column was reconditioned with the mobile phase
at 300 µL/min for 15 min.
HPLC-GC transfer occurred by the retention gap technique and fully concurrent solvent
evaporation (FCSE) through the Y-interface [24]. An uncoated, deactivated precolumn (MXT
Hydroguard, 0.5 m x 0.53 mm, Restek, Bellefonte) was followed by a steel T-piece union
connecting to the solvent vapor exit and a separation column coated with a 5 % phenyl
polysiloxane film (Rxi-5Sil MS, 30 m x 0.25 mm x 0.10 µm, Restek, Bellefonte, PA, USA).
From HPLC, the sterol containing fraction was transferred to the GC (resembling 690 µL) at a
carrier gas inlet pressure of 80 kPa (helium) in addition to an oven temperature of 80 °C. The
elution window was verified by UV detection at 205 nm. The solvent vapor exit was opened
0.5 min before the elution of the sterol fraction began. Because of the high boiling points of the
analytes, fully concurrent evaporation of the solvent was possible without loss of substances
through the solvent vapor exit. The solvent vapor exit was closed 0.1 min after the fraction was
transferred. At this time, the carrier gas inlet pressure was set to 160 kPa and maintained
throughout the whole analysis. The oven temperature was programmed at 25 °C/min from 80
°C (5 min) to 225 °C (20 min), at 1.5 °C/min to 265 °C and finally at 25 °C/min to 310 °C (0.74
min, total run time 60.00 min). The FID base temperature was set to 350 °C. The gas flows for
air, hydrogen, and nitrogen were set to 280, 40, and 25 mL/min, respectively.
Data processing was performed with Clarity 5.5 (DataApex, Prague, Czech Republic).
Quantitation was based on 5α-Cholestanol used as ISTD. Sterol distribution and total content
were calculated following the equations
퐶 =퐴
∑(퐴 ) ∗ 100푆 =∑(퐴 ) ∗ 푚퐴 ∗ 푚
with Ci: Individual sterol concentration [%], S: Total sterol content [mg/kg], Ai: Individual
sterol peak area, Σ(Ai): Sum of peak areas of regulated sterols, AISTD: peak area of ISTD, mISTD:
mass of ISTD [mg], mSample: mass of test sample [kg].

62 4. Quality assurance of edible oils and fats (Sterols)
For structure elucidation, the FID was replaced by a DSQ II single quadrupole mass
spectrometer (Thermo Fisher Scientific Inc., Austin, TX, USA). The ion source and transfer
line temperatures were set to 200 and 320 °C, respectively. Data acquisition started after 20.0
min in full-scan mode (50 – 500 amu) at a rate of 3 spectra/s with EI ionization at 70 eV. Data
processing was performed with Xcalibur 2.2 (Thermo Fisher Scientific Inc.).
4.3 Results and Discussion
The time-consuming and error-prone saponification, extraction, and TLC steps were substituted
by an automated autosampler-based sample preparation followed by a normal-phase LC-GC-
FID system. The only manual step during sample preparation left was to weigh the edible oil
sample into an empty 10-mL autosampler vial.
Silylation of the cleaned-up sterol fraction was omitted to allow for an easy transfer into the
GC. However, by omitting silylation, analyte peak shapes and separations on the GC column
were significantly influenced. Thus, GC parameters had to be adapted.
4.3.1 Sample preparation
Automation of saponification and sterol extraction in closed vessels bore the problem of
emulsion formation. The reason for this was obviously the production of potassium salts of
fatty acids during saponification preventing a clear layer separation between the aqueous and
organic phase. ISO 12228 solved this problem lately by omission of solvent extraction. Instead,
an SPE step on aluminum oxide was proposed. In the current work, the problem was solved
otherwise.
An aqueous citric acid solution was given to the sample after saponification, which resulted in
protonation of the fatty acids. The formation of emulsions was thus prevented and a clear
separation of aqueous and organic phase was observed. Extraction was carried out with n-
hexane instead of diethyl ether. Its volatility was better suited for an automated approach. Since
it is less polar than diethyl ether, co-extraction of more polar material was minimized.
Nevertheless, protonation of fatty acids resulted in a change of their polarity. Protonated fatty
acids are more nonpolar. Therefore, they were partially extracted by n-hexane, which could be
verified by yellowish colored n-hexanic phases. However, during the HPLC cleanup on the
used silica column, they could be completely separated from the 4-desmethyl sterols.

4. Quality assurance of edible oils and fats (Sterols) 63
4.3.2 Influence of silylation on GC separation
As already mentioned, omission of silylation was the only significant difference between the
designed LC-GC method and ISO 12228. Therefore, the influence of silylation on GC
separation efficiency was investigated. Literature recommends the use of a GC separation
column coated with a 5 % phenyl polysiloxane stationary phase for sterol separation [7].
The sterol distributions of several oils (rapeseed, safflower, and sunflower oil) were determined
by LC-GC. Gas chromatographic separations were comparable with ISO 12228. Nevertheless,
the most apparent difference between both methods was found in the sample capacity of the
used GC column. Omission of silylation reduced the sample capacity of the stationary phase. It
was observed that smaller sample amounts had to be injected in LC-GC analyses due to column
overloading. Overloading resulted in severe fronting of major sterols and deterioration of
critical peak pair separations.
Rapid overloading and peak fronting are known indicators for insufficient analyte–stationary
phase interactions [25]. Low analyte solubility in the stationary phase liquid, i.e., a polarity
mismatch between the analyte and the stationary phase, can be the source for this observation.
In general, silylation lowers the analyte’s polarity and increases therefore its partition
coefficient between the nonpolar stationary and mobile phase. As a consequence, the sample
capacity is increased. Although silylation would have been possible in the designed LC-GC
method, it was not considered. Besides lowered sample throughput, collection of the sterol
fraction, silylation, and re-injection into GC-FID would have complicated the method
(additional glassware, contaminations, etc.).
The initial sample amounts (100 mg) and dilution factors (1:2) during LC-GC sample
preparation were chosen to match closely the ISO method [7]. Samples containing higher sterol
contents, such as rapeseed oil, showed GC column overloading in LC-GC experiments while
no such observation was made for silylated ISO samples. Therefore, adaption of the dilution
factor during sample preparation according to the measured sample was chosen to solve this
problem (see Fig. 4.4). Reduction of the injected sample amount successfully prevented
overloading. Sensitivity of the method using FID detection was not compromised, even for
minor sterol percentages below 0.5 %. In Fig. 4.5, the separation of blended sunflower-rapeseed
oil obtained by LC-GC-FID is shown.

64 4. Quality assurance of edible oils and fats (Sterols)
Fig. 4.5. LC-GC-FID chromatogram of blended sunflower-rapeseed oil obtained on a 5 % phenyl polysiloxane stationary phase (1 = Cholesterol, 2 = Cholestanol (ISTD), 3 = Brassicasterol, 4 = 24-Methylene cholesterol, 5 = Campesterol, 6 = Campestanol, 7 = Unknown, 8 = Stigmasterol, 9 = Δ7-Campesterol, 10 = Δ5,23-Stigmastadienol, 11 = Clerosterol, 12 = Sitosterol, 13 = Sitostanol, 14 = Δ5-Avenasterol, 15 = Δ5,24-Stigmastadienol, 16 = Δ7-Stigmastenol, 17 = Δ7-Avenasterol)
Quantitative comparisons of LC-GC and ISO 12228 revealed an overestimation of campestanol
of approximately 1 % (1.5 % vs. 0.5 %) by LC-GC when sunflower oils were analyzed (see
Fig. 4.5 – Peak No. 6+7). In order to clarify if this was due to the omitted silylation, sunflower
oil was prepared according to ISO 12228. The obtained extract after TLC was injected silylated
and non-silylated into the GC. The non-silylated extract showed the same overestimation of
campestanol, confirming that LC-GC and ISO 12228 were truly equivalent. The silylated
extract, however, contained the ISO-conform campestanol content. Nevertheless, a slower
temperature program of the GC oven revealed a shoulder on the campesterol peak even for the
silylated sample. This clearly indicated the presence of an additional unknown compound
regardless of silylation. The results are shown in Fig. 4.6.
Fig. 4.6. Chromatogram overlay of a sunflower oil sample prepared according to ISO 12228 (blue trace: silylated, red trace: silylated with slowed-down oven ramp, pink trace: non-silylated)
[min.]Time
36 38 40 42 44 46 48
[mV]
Volt
age
16
18
20
22
24
26
1
2
3
4
5
6 + 7
8
9
10 11
12
13
14
15
16
17

4. Quality assurance of edible oils and fats (Sterols) 65
Baseline separation of the unknown compound from the others was not possible. According to
the literature, improvement of sterol GC separations is not achievable by simple change of the
stationary phase type [26]. This could be verified by testing several stationary phases with
higher phenyl (35, 50 %) and cyanopropyl-phenyl (14 %) content. It was found that with
increasing polarity several ISO 12228 regulated sterols were co-eluted. Nevertheless, since the
unknown compound seemed to be specifically present only in sunflower oils, it could be easily
recognized. Although as will be shown in the validation subchapter, it was already origin for
discrepancies in collaborative trials.
4.3.3 Structure elucidation of the unknown compound in sunflower oil
Normal-phase HPLC on bare silica gel offered the possibility to separate Δ5, Δ7, and other low
abundant sterols. As can be seen in Fig. 4.7, the 4-desmethyl sterol fraction was separated into
several sub-groups. The first peak resembled Δ5-sterols whereas the third peak corresponded
to Δ7-sterols [9]. The fraction in-between contained stanols and sterols with double bond(s) in
the sterol skeleton at alternating positions, e.g., pro-vitamin D derivatives (Δ5,7-sterols).
Fig. 4.7. HPLC-UV chromatogram of sunflower oil showing the separation of the 4-desmethyl sterol fraction into several sub-groups (wavelength: 205 nm, the underlined elution window corresponded to other sterols than Δ5- and Δ7-sterols)
LC-GC was used to transfer parts of the sterol fraction of sunflower oil into the GC. The
unknown compound was found mainly in the intermediate fraction. The Δ5-fraction did not
contain the unknown compound whereas the Δ7-fraction contained only traces of it.
The selectivity of the used HPLC column allowed a prediction about the nature of the unknown
compound. Its HPLC retention time excluded a Δ5- and Δ7-sterol. Additionally, GC-MS was

66 4. Quality assurance of edible oils and fats (Sterols)
used for further structure elucidation. The unknown compound was not identified as
campestanol indicated by missing m/z 402. Instead, the unknown phytosterol was tentatively
identified as 14-methyl fecosterol.
The obtained mass spectrum (see Fig. 4.8) was in accordance with the literature and the NIST
reference spectra database [27]. Furthermore, the observed relative GC retention time agreed to
the literature for 14-methyl fecosterol [28]. Finally, 14-methyl sterols are eluted together with
4-desmethyl sterols on bare silica HPLC phases [27].
Fig. 4.8. Mass spectrum of the unknown 4-desmethyl phytosterol in sunflower oils. The spectrum matched 14-methyl fecosterol.
14-Methyl fecosterol is a 4-desmethyl Δ8-sterol with an additional methyl group at C-14 on the
sterol skeleton. In plants it is a sterol originating from obtusifoliol, a 4,14-dimethyl Δ8-sterol.
Obtusifoliol is also the common precursor for the three main phytosterols campesterol,
stigmasterol, and sitosterol [5]. One important reaction step during sterol biosynthesis is
accomplished by the sterol 14α-demethylase (CYP51), the first step in converting 14-methyl
sterols to 14-desmethyl sterols. In numerous consecutive steps the final 4-desmethyl sterols are
formed.
14-methyl sterols could be found in Arabidopsis (Arabidopsis thaliana) with deactivated
CYP51 [29]. Additionally, triazole-based fungicides were shown to have the ability to inhibit
the 14α-demethylase activity in fungi [30]. Thus, it is plausible to assume that sunflowers could
contain inhibited CYP51 enzymes, prohibiting the C-14 demethylation step. However, no
4. Quality assurance of edible oils and fats (Sterols) 67
literature could be found supporting this hypothesis. Further investigation is needed to verify
or falsify this assumption.
The presence of 14-methyl sterols could be an indicator for the use of triazole-based fungicides
during the cultivation of sunflowers. To test this hypothesis, virgin sunflower oil with an
organic certification (EU regulation 834/2007) was analyzed. GC-MS confirmed that it
contained the same peak identified as 14-methyl fecosterol as refined sunflower oil [31].
According to EU regulation 889/2008, organic labeled products must not be treated with
triazole-based fungicides [32]. Therefore, other reasons for the presence of 14-methyl sterols in
sunflower oils have to be evaluated.
4.3.4 Validation of the LC-GC-FID method
Since no reference material was available for the determination of sterols in edible oils and fats,
collaborative trial material was used instead.
Precision was determined by multiple injections of sunflower oil. Repeatability was calculated
from six consecutive injections of six independently prepared oils. Reproducibility is based on
the quantitative results in duplicate on three successive days. Collaborative trial materials
(rapeseed oil, safflower oil, and sunflower oil) were analyzed in triplicate to get an impression
of the trueness of the LC-GC-FID method. According to Horwitz, the allowed relative standard
deviation under reproducibility conditions ranges from 4.4 to 11.3 % depending on the analyte
concentration (10 – 5000 mg/kg) [33].
In Table 4.2, collaborative trial and LC-GC results for sunflower oil are listed. Except for
campestanol and Δ5,24-stigmastadienol, LC-GC results were in good agreement with the
collaborative trial results. The observed relative standard deviations for LC-GC fully complied
with the Horwitz requirements while the collaborative trial results showed insufficient precision
among the laboratories.
As shown previously, the discrepancy for campestanol could be attributed to 14-methyl
fecosterol. The differing results for Δ5,24-stigmastadienol could be explained by the presence
of another co-eluting sterol. The retention times on HPLC and GC corresponded to Δ7,25-
stigmastadienol [26].
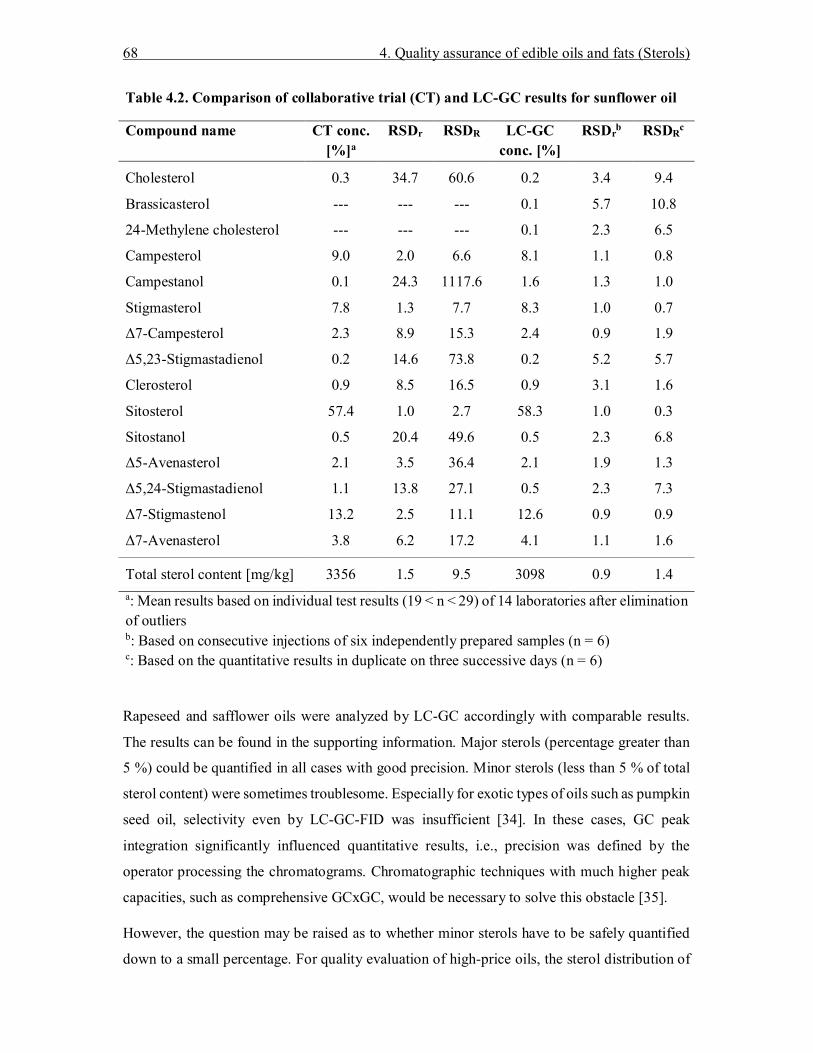
68 4. Quality assurance of edible oils and fats (Sterols)
Table 4.2. Comparison of collaborative trial (CT) and LC-GC results for sunflower oil
Compound name CT conc. [%]a
RSDr RSDR LC-GC conc. [%]
RSDrb RSDRc
Cholesterol 0.3 34.7 60.6 0.2 3.4 9.4
Brassicasterol --- --- --- 0.1 5.7 10.8
24-Methylene cholesterol --- --- --- 0.1 2.3 6.5
Campesterol 9.0 2.0 6.6 8.1 1.1 0.8
Campestanol 0.1 24.3 1117.6 1.6 1.3 1.0
Stigmasterol 7.8 1.3 7.7 8.3 1.0 0.7
Δ7-Campesterol 2.3 8.9 15.3 2.4 0.9 1.9
Δ5,23-Stigmastadienol 0.2 14.6 73.8 0.2 5.2 5.7
Clerosterol 0.9 8.5 16.5 0.9 3.1 1.6
Sitosterol 57.4 1.0 2.7 58.3 1.0 0.3
Sitostanol 0.5 20.4 49.6 0.5 2.3 6.8
Δ5-Avenasterol 2.1 3.5 36.4 2.1 1.9 1.3
Δ5,24-Stigmastadienol 1.1 13.8 27.1 0.5 2.3 7.3
Δ7-Stigmastenol 13.2 2.5 11.1 12.6 0.9 0.9
Δ7-Avenasterol 3.8 6.2 17.2 4.1 1.1 1.6
Total sterol content [mg/kg] 3356 1.5 9.5 3098 0.9 1.4 a: Mean results based on individual test results (19 < n < 29) of 14 laboratories after elimination of outliers b: Based on consecutive injections of six independently prepared samples (n = 6) c: Based on the quantitative results in duplicate on three successive days (n = 6)
Rapeseed and safflower oils were analyzed by LC-GC accordingly with comparable results.
The results can be found in the supporting information. Major sterols (percentage greater than
5 %) could be quantified in all cases with good precision. Minor sterols (less than 5 % of total
sterol content) were sometimes troublesome. Especially for exotic types of oils such as pumpkin
seed oil, selectivity even by LC-GC-FID was insufficient [34]. In these cases, GC peak
integration significantly influenced quantitative results, i.e., precision was defined by the
operator processing the chromatograms. Chromatographic techniques with much higher peak
capacities, such as comprehensive GCxGC, would be necessary to solve this obstacle [35].
However, the question may be raised as to whether minor sterols have to be safely quantified
down to a small percentage. For quality evaluation of high-price oils, the sterol distribution of

4. Quality assurance of edible oils and fats (Sterols) 69
major sterols may be sufficient. From the analytical point of view, however, the elucidation of
the complete sterol distribution of edible oils and fats is an interesting field of research.
4.4 Conclusions
A fully automated online LC-GC-FID method was designed increasing the robustness and
precision for the determination of the sterol content in edible oils and fats. Sample preparation
and analysis required approximately 2 h. Interlacing of sample preparation and analysis,
however, allowed an average sample throughput of one sample per hour. On the contrary, ISO
12228 permits 6 – 12 samples per day with a tremendous amount of manual work. The LC-GC
method was validated and showed results comparable with ISO 12228 in terms of trueness.
Furthermore, validation data revealed good precision and robustness making this automated
approach amenable to routine environments.
During the determination of the sterol content in sunflower oils, one systematic anomaly was
observed. The quantified campestanol content was higher in comparison to ISO 12228. The
reason was found in omission of the silylation step during sample preparation. Further
investigation revealed an unknown compound usually masked by campesterol in ISO 12228.
There is every indication that the unknown compound was 14-methyl fecosterol. Retention
times on HPLC and GC as well as GC-MS data supported this assumption. Gas
chromatographic separation of 14-methyl fecosterol from campestanol and other regulated
sterols was not possible with classic GC columns.
Further investigations in this field of research will address the origin of 14-methyl fecosterol in
sunflower oils. Up till now, no literature was published addressing the presence of this
compound in sunflower oils. Independent from this, the suitability of comprehensive GCxGC
techniques will be evaluated to further improve quantitation precision also for minor sterols.

70 4. Quality assurance of edible oils and fats (Sterols)
4.5 References
[1] Ostlund Jr, R. E. Annu. Rev. Nutr. 2002, 22, 533–549.
[2] Thompson, G. R.; Grundy, S. M. Am. J. Cardiol. 2005, 96, 3–9.
[3] Bouic, P. J. Curr. Opin. Clin. Nutr. Metab. Care 2001, 4, 471–475.
[4] Moreau, R. A.; Whitaker, B. D.; Hicks, K. B. Prog. Lipid Res. 2002, 41, 457–500.
[5] Thanh, T. T.; Vergnes, M. F.; Kaloustian, J.; El‐Moselhy, T. F.; Amiot‐Carlin, M. J.;
Portugal, H. J. Sci. Food Agr. 2006, 86, 220–225.
[6] Codex Alimentarius, Codex standard for named vegetable oils. Codex Stan. 1999, 210,
1–13.
[7] Determination of individual and total sterols contents – Gas chromatographic method
– Part 1: Animal and vegetable fats and oils (ISO 12228-1:2014); ISO: Geneva,
Switzerland, 2014.
[8] Mandl, A.; Reich, R.; Lindner, W. Eur. Food Res. Technol. 1999, 209, 400–406.
[9] Biedermann, M.; Grob, K.; Mariani, C.; Schmidt, J. P. Z. Lebensm. Unters. Forsch.
1996, 202, 199–204.
[10] The European Commission. Off. J. Eur. Union 2013, 338, 31−67.
[11] Cañabate-Díaz, B.; Carretero, A. S.; Fernández-Gutiérrez, A.; Vega, A. B.; Frenich, A.
G.; Vidal, J. M.; Martos, J. D. Food Chem. 2007, 102, 593–598.
[12] Cunha, S. S.; Fernandes, J. O.; Oliveira, M. B. P. J. Chromatogr. A 2006, 1128, 220–
227.
[13] Zhang, X.; Cambrai, A.; Miesch, M.; Roussi, S.; Raul, F.; Aoude-Werner, D.;
Marchioni, E. J. Agric. Food Chem. 2006, 54, 1196–1202.
[14] Breinhölder, P.; Mosca, L.; Lindner, W. J. Chromatogr. B 2002, 777, 67–82.
[15] Nota, G.; Spagna Musso, S.; Naviglio, D.; Romano, R.; Sabia, V. Anal. Lett. 1999, 32,
811–825.
[16] Aparicio, R.; Aparicio-Ruı́ z, R. J. Chromatogr. A 2000, 881, 93–104.
[17] Grob, K.; Lanfranchi, M.; Mariani, C. J. Am. Oil Chem. Soc. 1990, 67, 626–634.
[18] Biedermann, M.; Grob, K.; Mariani, C. Lipid/Fett 1993, 95, 127–133.
[19] Biedermann, M.; Grob, K.; Mariani, C. Riv. Ital. Sostanze. Gr. 1995, 72, 339–344.
[20] Toledano, R. M.; Cortés, J. M.; Rubio-Moraga, Á.; Villén, J.; Vázquez, A. Food Chem.
2012, 135, 610–615.
[21] Sanchez, R.; Vázquez, A.; Riquelme, D.; Villén, J. J. Agric. Food Chem. 2003, 51,
6098–6102.

4. Quality assurance of edible oils and fats (Sterols) 71
[22] Villén, J.; Blanch, G. P.; Ruiz del Castillo, M. L.; Herraiz, M. J. Agric. Food Chem.
1998, 46, 1419–1422.
[23] Internal document – Summary of statistical evaluation of collaborative trial 2012 with
ISO/CD 12228-1:2011; Max Rubner-Institute, Federal Research Institute for Nutrition
and Food: Detmold, Germany, 2012.
[24] Biedermann, M.; Grob, K. J. Chromatogr. A 2009, 1216, 8652–8658.
[25] Gerst, N.; Ruan, B.; Pang, J.; Wilson, W. K.; Schroepfer, G. J. J. Lipid Res. 1997, 38,
1685–1701.
[26] Itoh, T.; Tani, H.; Fukushima, K.; Tamura, T.; Matsumoto, T. J. Chromatogr. A 1982,
234, 65–76.
[27] Smith, F. D.; Köller, W. Phytopathology 1990, 80, 584–590.
[28] Patterson, G. W. Anal. Chem. 1971, 43, 1165–1170.
[29] Kim, H. B.; Schaller, H.; Goh, C. H.; Kwon, M.; Choe, S.; An, C. S.; Durst, F.;
Feldmann, K. A.; Feyereisen, R. Plant Physiol. 2005, 138, 2033–2047.
[30] Joseph-Horne, T.; Hollomon, D.; Manning, N.; Kelly, S. L. Appl. Environ. Microbiol.
1996, 62, 184–190.
[31] Council Regulation (EC) No 834/2007, Off. J. Eur. Unions 2007, 189, 1–23.
[32] Commission Regulation (EC) No 889/2008, Off. J. Eur. Unions 2008, 250, 1–84.
[33] Horwitz, W.; Albert, R. J. AOAC Int. 2006, 89, 1095–1109.
[34] Abidi, S. L. J. Chromatogr. A 2001, 935, 173–201.
[35] Tranchida, P. Q.; Salivo, S.; Franchina, F. A.; Bonaccorsi, I.; Dugo, P.; Mondello, L.
Anal. Bioanal. Chem. 2013, 405, 4655–4663.

72 4. Quality assurance of edible oils and fats (Sterols)
4.6 Supporting Information
Table S-4.1. Comparison of CT and LC-GC results for rapeseed oil
Compound name CT conc. [%]a
RSDr RSDR LC-GC conc. [%]
RSDrb
Cholesterol 0.4 8.3 28.2 0.3 2.5
Brassicasterol 10.0 1.5 3.5 10.5 0.2
24-Methylene cholesterol 0.5 15.2 66.5 0.5 14.8
Campesterol 34.9 0.7 2.1 35.7 0.2
Campestanol 0.1 20.4 79.3 0.3 10.5
Stigmasterol 0.3 13.1 25.3 0.2 6.9
Δ7-Campesterol 0.7 11.0 40.5 0.2 0.3
Δ5,23-Stigmastadienol 0.3 16.7 44.3 0.2 5.1
Clerosterol 0.6 9.9 25.1 0.5 3.8
Sitosterol 49.1 0.7 1.5 49.0 0.5
Sitostanol 0.3 16.3 76.2 0.2 9.9
Δ5-Avenasterol 1.7 9.3 13.5 1.7 1.4
Δ5,24-Stigmastadienol 0.8 8.8 12.8 0.6 0.2
Δ7-Stigmastenol 0.2 25.8 53.3 0.1 8.9
Δ7-Avenasterol 0.1 43.4 77.7 0.1 10.4
Total sterol content [mg/kg] 7365.2 2.1 5.7 7421.8 0.5 a: Mean results based on individual test results (21 < n < 29) of 14 laboratories after elimination of outliers b: Based on consecutive injections of three independently prepared samples (n = 3)

4. Quality assurance of edible oils and fats (Sterols) 73
Table S-4.2. Comparison of CT and LC-GC results for safflower oil
Compound name CT conc. [%]a
RSDr RSDR LC-GC conc. [%]
RSDrb
Cholesterol 0.6 10.9 68.1 0.3 2.2
Brassicasterol --- --- --- 0.2 3.6
24-Methylene cholesterol --- --- --- 0.1 1.9
Campesterol 12.0 0.7 5.4 13.0 0.2
Campestanol 0.4 10.7 47.7 0.6 1.0
Stigmasterol 5.3 2.4 6.9 5.3 1.3
Δ7-Campesterol 3.8 5.2 13.3 4.0 3.4
Δ5,23-Stigmastadienol 0.8 8.6 37.5 0.8 12.8
Clerosterol 1.1 15.0 31.1 1.0 13.4
Sitosterol 49.2 1.1 3.1 50.9 0.5
Sitostanol 3.0 4.5 17.5 2.6 3.0
Δ5-Avenasterol 1.7 9.2 65.7 1.1 5.6
Δ5,24-Stigmastadienol 3.6 6.2 30.6 1.6 5.0
Δ7-Stigmastenol 16.7 2.9 8.9 16.8 0.3
Δ7-Avenasterol 1.5 7.0 38.5 1.7 4.9
Total sterol content [mg/kg] 2447.8 3.5 12.8 2314.0 0.8 a: Mean results based on individual test results (19 < n < 29) of 14 laboratories after elimination of outliers b: Based on consecutive injections of three independently prepared samples (n = 3)

74 4. Quality assurance of edible oils and fats (Sterols)
Table S-4.3. Comparison of CT and LC-GC results for a phytosterol concentrate used in an international CT from 2010
Compound name CT conc. [%]a
RSDr RSDR LC-GC conc. [%]
RSDrb RSDRc
Cholesterol 0.2 18.0 49.5 0.4 5.6 12.4d
Brassicasterol 3.6 2.8 3.6 3.7 0.5 0.8
24-Methylene cholesterol 0.7 9.5 15.8 0.6 2.5 13.8d
Campesterol 16.6 0.5 1.4 16.9 0.1 1.2
Campestanol 0.9 7.0 9.1 1.0 1.7 10.8
Stigmasterol 0.6 7.2 10.1 0.5 1.7 4.8
Δ7-Campesterol 0.2 38.2 62.0 0.05 13.3 33.4d
Δ5,23-Stigmastadienol 0.1 37.5 67.0 0.04 10.8 20.4d
Clerosterol 0.4 8.9 29.9 0.4 1.9 7.9
Sitosterol 67.0 0.4 1.2 67.4 0.2 0.7
Sitostanol 7.2 3.4 5.1 6.6 0.5 3.5
Δ5-Avenasterol 1.5 13.6 26.1 1.9 2.6 14.1d
Δ5,24-Stigmastadienol 0.3 10.1 65.2 0.2 5.7 14.4d
Δ7-Stigmastenol 0.4 11.8 33.7 0.3 3.8 4.2
Δ7-Avenasterol 0.3 16.4 33.4 0.2 8.6 6.5
Total sterol content [g/100 g] 6.2 1.7 11.8 5.2 1.2 3.9 a: Mean results based on individual test results (15 < n < 21) of 11 laboratories after elimination of outliers b: Based on consecutive injections of six independently prepared samples (n = 6) c: Based on the quantitative results in duplicate on three successive days (n = 6) d: The high total sterol content (>5 %) and the apparent differences in analyte concentrations were the sources for an insufficient precision.

5. Food nutrition analysis (Vitamin D) 75
5. Determination of vitamins D2 and D3 in selected food
matrices by online high-performance liquid
chromatography–gas chromatography–mass
spectrometry (HPLC-GC-MS)
Published in: Nestola, M.;Thellmann, A. Determination of vitamins D2 and D3 in selected food
matrices by online high-performance liquid chromatography–gas chromatography–mass
spectrometry (HPLC-GC-MS). Anal. Bioanal. Chem. 2015, 407(1), 297-308.
Abstract
An online normal-phase liquid chromatography–gas chromatography–mass spectrometry
(HPLC-GC-MS) method was developed for the determination of vitamins D2 and D3 in selected
food matrices. Transfer of the sample from HPLC to GC was realized by large volume on-
column injection; detection was performed with a time-of-flight mass spectrometer (TOF-MS).
Typical GC problems in the determination of vitamin D such as sample degradation or
sensitivity issues, previously reported in the literature, were not observed. Determination of
total vitamin D content was done by quantitation of its pyro isomer based on an isotopically
labeled internal standard (ISTD). Extracted ion traces of analyte and ISTD showed cross-
contribution, but nonlinearity of the calibration curve was not determined inside the chosen
calibration range by selection of appropriate quantifier ions. Absolute limits of detection (LOD)
and quantitation (LOQ) for vitamins D2 and D3 were calculated as approximately 50 and 150
pg, respectively. Repeatability with internal standard correction was below 2 %. Good
agreement between quantitative results of an established high-performance liquid
chromatography with UV detection (HPLC-UV) method and HPLC-GC-MS was found. Sterol-
enriched margarine was subjected to HPLC-GC-MS and HPLC-MS/MS for comparison,
because HPLC-UV showed strong matrix interferences. HPLC-GC-MS produced comparable
results with less manual sample cleanup. In summary, online hyphenation of HPLC and GC
allowed a minimization in manual sample preparation with an increase of sample throughput.

76 5. Food nutrition analysis (Vitamin D)
5.1 Introduction
According to the common definition, vitamins are organic compounds which cannot be
synthesized in sufficient quantities by humans or animals and have to be externally supplied,
typically via the daily diet. Since metabolisms differ among species, a compound can be a
vitamin for a particular organism but not for the other.
The function of vitamins is not limited to a specific field of action; they can be involved in
many reactions in the metabolism. For example, they can act as hormones (e.g., vitamin D),
antioxidants (e.g., vitamin E), or precursors for enzyme cofactors (e.g., class of vitamin B).
Because of their variety in function, vitamins cannot be summarized into a dedicated class of
compounds with fixed chemical structures. Depending on their function, the chemical structure
can highly differ. Generally, vitamins are classified into water- and fat-soluble compounds.
The vitamin D class has a special standing among the vitamins. This class of fat-soluble
vitamins consists of several compounds derived from 7-dehydrosterols [1]. Through
photochemical ring opening and isomerization, the actual vitamin (calciferol) is formed. These
reactions occur in the human body. For instance, vitamin D3 is formed from the provitamin 7-
dehydrocholesterol which is available in the human skin through daily diet. Via exposure to
UV-B radiation from sunlight, the actual vitamin D3 (cholecalciferol) is synthesized. Thus, in
the narrow sense, vitamin D3 would not be added to the vitamins for the human organism;
nevertheless, historically, it is.
The chemical base structure of all vitamin D derivatives is given in Fig. 5.1. As can be seen,
the particular vitamins differ in a single side chain only. Table 5.1 shows a compilation of a
few prominent compounds.
Table 5.1. Derivatives of vitamin D (calciferols) [1]
Vitamin Trivial name
D1 1:1 mixture of ergocalciferol and lumisterol
D2 Ergocalciferol
D3 Cholecalciferol
D4 22-Dihydroergocalciferol
D5 Sitocalciferol
D6 Stigmacalciferol
D7 Campecalciferol

5. Food nutrition analysis (Vitamin D) 77
From the known derivatives, the most abundant ones are vitamin D3 (originating from
cholesterol found in animal products) and vitamin D2 (from ergosterol originating from plants)
[2, 3]. The other ones are mostly artificially created and their bioactivity is only little compared
to the naturally available ones.
The role of vitamin D in the human body is strongly related to the calcium and phosphorus
regulation of the metabolism and to the bone health. The biologically active form of vitamin D
upon intake is achieved via hydroxylation in the liver (calcidiol) and further in the kidneys
(calcitriol).
Even though sunlight may be a major source for vitamin D supplement for the population, an
additional dietary intake is recommended [2]. Based on minimal sun exposure, the
recommended dietary allowance for vitamin D is 15 μg/day for an adult.
Because of their lipophilicity, vitamin D2 and D3 are found in only a few foodstuffs in
significant amounts (>0.1 μg/100 g) [3]. Vitamin D3 is found mainly in fatty fish and milk
products whereas vitamin D2 is present, for example, in mushrooms [4]. For that reason,
enriching of several foodstuffs, e.g., margarine, is allowed to ensure the population’s supply
with vitamin D [5]. If not explicitly declared on foodstuffs, the collective term “vitamin D”
stands for vitamins D2, D3, or a mixture.
The deficiency of vitamin D (hypovitaminosis D) can lead to osteomalacia, osteoporosis, and
other severe diseases. On the other hand, vitamin D is one of the few vitamins whose extensive
intake can be toxic (hypercalcemia) [6].
5.1.1 Analytics of vitamin D in foodstuff
The analytical detection and quantitation of vitamin D in foodstuff is challenging. Extremely
low vitamin D contents (few μg/100 g) have to be safely detected in the presence of other
compounds in excess (fat, emulsifiers, proteins, sterols, and other fat-soluble vitamins) [7].
In routine analysis, quantitation is mainly done by high-performance liquid chromatography
with UV detection (HPLC-UV) [8]. In the past, gas chromatographic methods were also
evaluated [8]. Nowadays, the usage of HPLC in combination with tandem mass spectrometric
detection (HPLC-MS/MS) is frequently found in literature [9]. Its use in routine analysis is
reported for challenging food matrices and multivitamin determination approaches [10].

78 5. Food nutrition analysis (Vitamin D)
The structural relationship to other compounds derived from sterane, like sterols or hormones,
is complicating the detection and quantitation processes. For these reasons, MS/MS detections
can offer additional selectivity which UV detection is lacking. Because of the nonpolar
chemical structure of vitamin D, atmospheric pressure chemical ionization (APCI) is usually
used when MS detection is performed [11]. Although it is inherently less prone to ion
suppression effects compared to electrospray ionization (ESI), these are still reported in
literature [12]. Especially when plant sterol-enriched foodstuff like margarine is to be analyzed,
ion suppression by high amounts of co-eluting matrix has to be taken into account [10].
Besides these effects, the high costs of HPLC-MS/MS systems still hinder their routine usage
in many food control laboratories. Instead, classical HPLC-UV methods are found far more
often. The missing level of selectivity has to be compensated by time-consuming sample
preparation protocols involving error-prone manual work.
The classical approach for most foodstuffs involves saponification of the sample with
potassium hydroxide (KOH) as the first step to remove the excess of triglycerides. The
unsaponifiable matter is liquid–liquid extracted with a nonpolar organic solvent, e.g., n-hexane.
After evaporation of the solvent and enrichment step, the organic extract is further cleaned up
via solid-phase extraction (SPE) or preparative normal-phase HPLC. The eluate is evaporated
once again and the analytes are separated and quantified via reversed-phase HPLC on a C18
material [7].
Apart from the intense manual work, the quantitation by UV detection has one additional
drawback. Vitamin D2 is usually used as internal standard (ISTD) when vitamin D3 is quantified
and vice versa. Samples containing both vitamins cannot be safely processed. MS detection
solves this problem in an elegant way by the usage of isotopically labeled compounds.
As already mentioned, gas chromatography (GC) methods were reported in the past. With the
advance in HPLC separation techniques, the usage of GC methods became less important. Since
vitamin D is sensitive towards light and temperature, the usage of GC methods is furthermore
prone to analytical problems. For instance, it is reported in the literature that during the GC
injection and separation process, vitamin D isomerizes into its pyro and isopyro form at
temperatures exceeding some 150 °C (see Fig. 5.1) [13]. Because of this thermo-isomerization,
two peaks are detected for a single compound. Quantitation is still possible according to the
literature although sensitivity might be compromised.
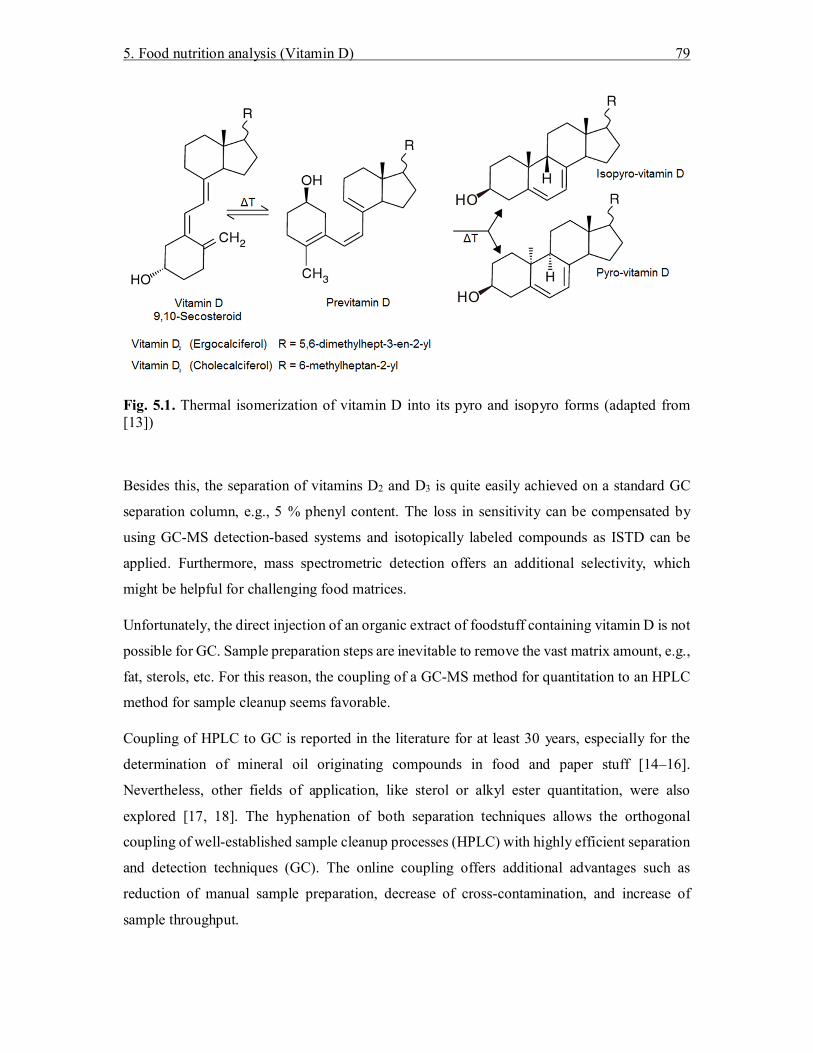
5. Food nutrition analysis (Vitamin D) 79
Fig. 5.1. Thermal isomerization of vitamin D into its pyro and isopyro forms (adapted from [13])
Besides this, the separation of vitamins D2 and D3 is quite easily achieved on a standard GC
separation column, e.g., 5 % phenyl content. The loss in sensitivity can be compensated by
using GC-MS detection-based systems and isotopically labeled compounds as ISTD can be
applied. Furthermore, mass spectrometric detection offers an additional selectivity, which
might be helpful for challenging food matrices.
Unfortunately, the direct injection of an organic extract of foodstuff containing vitamin D is not
possible for GC. Sample preparation steps are inevitable to remove the vast matrix amount, e.g.,
fat, sterols, etc. For this reason, the coupling of a GC-MS method for quantitation to an HPLC
method for sample cleanup seems favorable.
Coupling of HPLC to GC is reported in the literature for at least 30 years, especially for the
determination of mineral oil originating compounds in food and paper stuff [14–16].
Nevertheless, other fields of application, like sterol or alkyl ester quantitation, were also
explored [17, 18]. The hyphenation of both separation techniques allows the orthogonal
coupling of well-established sample cleanup processes (HPLC) with highly efficient separation
and detection techniques (GC). The online coupling offers additional advantages such as
reduction of manual sample preparation, decrease of cross-contamination, and increase of
sample throughput.

80 5. Food nutrition analysis (Vitamin D)
The aim of this work was therefore to demonstrate an online coupling of an optimized HPLC-
based sample cleanup to a GC-MS method for the detection and quantitation of vitamins D2
and D3 in selected food matrices and dietary supplements.
5.2 Experimental
5.2.1 Samples
Food samples were obtained at local supermarkets and drugstores. They consisted of yoghurt
(fat content of 2.9 g/100 g), two vitamin D3 dietary supplements, and a plant sterol-enriched
margarine (declared sterol content of 7.5 g/100 g). An internal reference instant milk powder
(fat content of 1.5 g/ 100 g) was supplied by Institute Kirchhoff GmbH (Berlin, Germany). It is
a commercially available product with a declared vitamin D3 content of 10 μg/100 g. It is used
as a quality control sample for quantitation of milk powders and is routinely monitored via
control charts.
5.2.2 Chemicals and solutions
Dichloromethane, ethanol, n-hexane, and isopropanol were from LGC Promochem (Picograde
quality, Wesel, Germany). Vitamins D2 and D3 (analytical standard quality), the corresponding
deuterated 6,19,19-d3-vitamins (97 atom % in ethanol), and potassium hydroxide (≥85 %,
pellets, white) were from Sigma-Aldrich (Steinheim, Germany). Sodium sulfate was from
Fluka (Buchs, Switzerland). Water was supplied from a Milli-Q water purification system
(Merck, Darmstadt, Germany).´
5.2.3 Sample preparation
After homogenization, to an aliquot of the sample 10 mL of n-hexane and 15 mL of
water/ethanol (1:1, v/v) were added. Aliquoting was based on the declared vitamin D content
of the sample. To this solution, 1 mL of 50 % aqueous KOH (w/w) was added. The mixture
was continuously shaken and saponified for 30 min at 60 °C in a water bath. The solution was
allowed to cool down to room temperature and the separated n-hexane layer was washed with
water/ethanol (1:1) until pH neutrality was reached. Afterward, the n-hexane phase was dried

5. Food nutrition analysis (Vitamin D) 81
over sodium sulfate. One milliliter of the n-hexane phase was transferred into a 2-mL
autosampler vial and directly analyzed by HPLC-GC-MS.
The sample preparation for the reference instant milk powder differed slightly, because the
crude extract was used also for HPLC-UV experiments. Three grams of milk powder were
suspended in 30-mL water. To this suspension, 100 μL of 2.9 μg/mL vitamin D2 were added as
internal standard. Twenty milliliters of 50 % aqueous KOH solution (w/w) were added.
Saponification was performed in a water bath for 30 min at 60 °C. After allowing the mixture
to cool down to room temperature, the unsaponifiable matter was extracted with 200 mL of n-
hexane. The n-hexane layer was separated and washed with water until pH neutrality was
reached. Afterward, it was evaporated to dryness and the residue was reconstituted in 1.75 mL
of n-hexane. This extract was directly used for HPLC-GC-MS analyses and further cleaned up
for HPLC-UV experiments.
5.2.4 HPLC-UV Analysis
In case of the reference material, 250 μL of the n-hexane phase were injected onto a Lichrospher
Si 60 preparative HPLC column (250 mm × 4.6 mm, 5 μm, 60 Å, Merck, Darmstadt, Germany).
The mobile phase consisted of 2 % isopropanol in n-hexane (v/v). The column was operated at
room temperature with a flow rate of 1.7 mL/min. UV detection was performed at 265 nm. The
used system was supplied by KNAUER (Berlin, Germany). It consisted of a pump 64 and a
variable wavelength monitor.
In a first run, vitamin D2 was injected to determine its retention time. Since vitamins D2 and D3
elute as one peak on a normal-phase HPLC column, the retention time of vitamin D2 could be
used for locating vitamin D3.
The vitamin D containing fraction eluted between 13 and 15 min. The collected eluate (3.4 mL)
was evaporated to dryness and the residue was dissolved in 500 μL of the mobile phase of the
subsequent reversed-phase HPLC step (ACN/MeOH/H2O, 97.5:2.0:0.5, v/v/v). One hundred
microliters of this solution were injected onto a Zorbax C18 column (250 mm×4.6 mm, 5 μm,
Agilent, Waldbronn, Germany). Column oven temperature was 30 °C and flow was 1.5
mL/min.
UV detection was performed with a diode array detector (DAD) at 265 nm. Confirmation
wavelengths were set to 230 and 290 nm. Vitamins D2 and D3 eluted after 18.5 and 19.8 min,
respectively.
82 5. Food nutrition analysis (Vitamin D)
Calibration solutions of vitamins D2 and D3 were prepared between 20–300 and 10–100 ng/mL,
respectively. The analyses were performed on an Agilent 1100 HPLC system. Data acquisition
and processing was done with the Chemstation.
5.2.5 HPLC-MS/MS Analysis
For the sterol-enriched margarine, HPLC-MS/MS analyses were performed. HPLC-UV
chromatograms showed big disturbances during the elution window of vitamin D2/D3 and could
therefore not be evaluated. The specific sample preparation protocol is described elsewhere
[10]. Shortly, 10 g of the sample were saponified and the extract was purified by SPE. The
eluate was evaporated to dryness and reconstituted in n-hexane. Fifty microliters were injected
onto a MultoHigh U-Si HPLC column (100 mm×4.6 mm, 2 μm, 120 Å, CS-Chromatographie-
Service GmbH, Langerwehe, Germany). The mobile phase consisted of 3 % 1,4-dioxane and
0.3 % isopropanol in n-hexane (v/v/v). The column was operated at 20 °C with a flow rate of
1.5 mL/min.
Analyses were performed on an Agilent 1100 HPLC system coupled to an API 3200 triple
quadrupole MS/MS instrument (AB SCIEX, Darmstadt, Germany). Ionization was caused by
APCI and detection was performed by multiple reaction monitoring (MRM). Deuterated ISTDs
were used for quantitation. Data acquisition and processing was done with Analyst
5.2.6 HPLC-GC-MS Analysis
HPLC-GC-MS experiments were performed on a system from Axel Semrau (Sprockhövel,
Germany). It consisted of an Agilent 1260 Infinity HPLC system (binary pump and variable
wavelength detector), Master GC and Master TOF-MS (DANI Instruments S.p.A., Cologno
Monzese, Italy), and a CombiPAL autosampler (CTC Analytics AG, Zwingen, Switzerland).
Three rotatory switching valves (VICI AG International, Schenkon, Switzerland) were used to
guide the HPLC eluent from the HPLC into the GC [19]. The latter one was equipped with an
on-column interface and a solvent vapor exit. The on-column interface, the carrier gas, and
solvent vapor exit were controlled by CHRONECT LC-GC from Axel Semrau.
Of the samples, 5–60 μL were injected onto an Allure Si HPLC column (250 mm × 2.1 mm, 5
μm, 60 Å, Restek, Bellefonte, PA, USA) without additional column temperature control. In
order to allow automation and continuous monitoring of the system performance, ISTDs were
5. Food nutrition analysis (Vitamin D) 83
not added to the samples during preparation but added before injection by the autosampler. A
disadvantage of late ISTD addition was that analyte losses during the sample preparation would
not be covered. Because of the simple one-step sample preparation, which was virtually
identical to classical workflows, the evaluation of the long-time system and method stability
was favored during method development. Because of the inherent exclusion of ISTD losses,
late ISTD addition allowed the recognition of analyte losses inside the system, e.g., during the
HPLC cleanup or the transfer from HPLC to GC. Furthermore, it allowed a check for matrix
effects during elution of the analytes in the GC dimension.
Ten microliters of a 60 ng/μL n-hexanic solution containing vitamin D2/D3-d3 (resembling 600
pg on column) were aspirated by the autosampler syringe, 5 μL n-hexane for layer separation,
and the actual injection volume. The optimized mobile phase consisted of 0.1 % isopropanol in
dichloromethane (v/v) and was delivered isocratically at 300 μL/min. After elution of the
analytes of interest, the column was backflushed with 10 % isopropanol in dichloromethane
(v/v) at 500 μL/ min for 10 min. Afterward, the column was reconditioned with the mobile
phase at 300 μL/min for 20 min.
HPLC-GC transfer occurred by the retention gap technique and fully concurrent solvent
evaporation (FCSE) through the Y interface [20]. An uncoated, deactivated precolumn (MXT
Hydroguard, 0.5 m × 0.53 mm, Restek, Bellefonte) was followed by a steel T-piece union
connecting to the solvent vapor exit and a separation column coated with a 5 % phenyl-
polysiloxane film (Rxi-5Sil MS, 30 m × 0.25 mm × 0.10 μm, Restek, Bellefonte, PA, USA).
From HPLC, the vitamin D-containing fraction was eluted between 18.0 to 20.0 min and
transferred to the GC (resembling 600 μL) at a carrier gas inlet pressure of 100 kPa (helium) in
addition to an oven temperature of 80 °C. The elution window was verified by UV detection at
265 nm. The solvent vapor exit was opened 0.5 min before the elution of the vitamin D fraction
began. Because of the high boiling points of the analytes, fully concurrent evaporation of the
solvent was possible without loss of substances through the solvent vapor exit. The solvent
vapor exit was closed 0.1 min after the fraction was transferred. At this time, the carrier gas
inlet pressure was set to 160 kPa and held for the complete analysis. The oven temperature was
programmed at 15 °C/min from 80 °C (6 min) to 310 °C (6.67 min, total time 28.00 min). The
Master TOF-MS ion source and transfer line temperatures were set to 200 and 320 °C,
respectively. Data acquisition started after 20.0 min at a rate of five spectra/s with electron
impact ionization (EI) at 70 eV. Vitamins D3 and D2 eluted after 23.1 and 23.3 min,
respectively.

84 5. Food nutrition analysis (Vitamin D)
Data processing was performed with Xcalibur 2.2 (Thermo Fisher Scientific Inc., Austin, TX,
USA). Quantitation was based on the corresponding deuterated ISTDs. Calibration was done
by plotting the ratio of the analyte signal to the internal standard signal as a function of the
analyte concentration of the standards. Calibration curves for vitamin D2 and D3 were created
from 150 to 1800 pg in seven levels (150, 300, 600, 900, 1200, 1500, 1800 pg). Each level was
measured once.
5.3 Results and Discussion
5.3.1 Optimization of HPLC conditions
As outlined in the introduction, peak detection and quantitation of vitamin D in complex
matrices can be troublesome. Comparing vitamin D to sterols like cholesterol or sitosterol (all
derived from sterane) reveals a big structural similarity. Chromatographic separation of vitamin
D from sterols can be difficult, especially when the concentrations vary by several orders of
magnitude. This can easily be the case for sterol-enriched foodstuffs like margarine. Because
of this, the chromatographic properties for the separation of vitamin D from matrix compounds
were optimized during development of this HPLC-GC-MS method.
A normal-phase HPLC on the base of bare silica gel was chosen for method development.
Firstly, normal-phase HPLC columns use organic solvents readily compatible with large
volume transfers into GC systems. Secondly, silica gel HPLC columns allow group type
separation of analytes. This feature is helpful for strongly related substance classes. For
instance, the separation of 4-desmethylsterols from 4-methyl- or 4,4-dimethylsterols is
achieved without difficulties [21].
In the first experiments with eluents on the base of n-hexane and isopropanol, it was verified
that vitamins D2/D3 and the 5-desmethylsterols could be baseline separated at equal
concentrations on a silica gel HPLC column. Cholesterol was chosen as a representative for the
class of 5-desmethylsterols.
Since desmethylsterols do not contain chromophoric groups and show therefore only limited
UV activity even at very low wavelengths, e.g., 205 nm, the vitamin D-containing fraction from
HPLC was transferred to a gas chromatography–flame ionization detection system (HPLC-GC-
FID). A vitamin D2/D3 standard mixture (ng/μL) was doped with high amounts of cholesterol

5. Food nutrition analysis (Vitamin D) 85
(μg/μL) for this purpose. Inspection of the HPLC-GC-FID chromatogram revealed that the
vitamin D fraction already contained significant amounts of cholesterol.
In further experiments, isopropanol as modifier was replaced with ethyl acetate and methyl-
tert-butylether (MTBE) without improvement of separation in the HPLC dimension.
Besides n-hexane, literature discusses the usage of dichloromethane-based eluents [22]. In pure
dichloromethane, vitamin D2/D3 eluted only after 25 min with a peak width of more than 3 min.
To minimize the elution window of the vitamin D fraction, some percentage of isopropanol was
added to the eluent. Because of the high UV cutoff of dichloromethane (>230 nm), the detection
of cholesterol was no longer possible by UV detection. Transfer of the vitamin D/cholesterol
standard mixture to GC-FID no longer showed evidence of cholesterol in the FID
chromatogram. The isopropanol fraction of the eluent was optimized to 0.1 %. On the one hand,
it allows reduction of the peak width of vitamin D2/D3 to less than 2 min; on the other hand, it
does not significantly deteriorate the separation, which was observed at higher isopropanol
percentage or with other modifiers during measurement of sterol-enriched foodstuff.
Additional testing of the optimized eluent was performed by injecting 5 μL of the extracted
reference instant milk powder (resembling 8.5 mg) into the HPLC-GC-FID system.
Figure 5.2 shows FID chromatograms of injections with two eluent compositions and a vitamin
D standard mixture as reference. As can be seen, transferred interferences are significantly
influenced by the HPLC mobile phase. The dichloromethane-based eluent (eluent B) shows less
by-products than the n-hexane based mobile phase (eluent A).
Fig. 5.2. HPLC-GC-FID chromatograms of the reference instant milk powder sample and a vitamin D2/D3 standard (Eluent A: n-hexane/isopropanol (98:2, v/v); Eluent B: dichloromethane/isopropanol (99.9:0.1, v/v))

86 5. Food nutrition analysis (Vitamin D)
Detection by FID did not allow the usage of isotopically labeled ISTDs. Furthermore, co-elution
of the pyro and isopyro isomers of vitamins D2 and D3 prevented the usage of vitamin D2 as
ISTD for vitamin D3 quantitation and vice versa. Consequently, quantitation by FID was not
possible. Instead, mass spectrometric detection was chosen for further method development
because of its advantage in sensitivity and selectivity.
5.3.2 Coupling of HPLC-GC to MS
The HPLC-GC system was coupled to a time-of-flight mass spectrometer (TOF-MS) for
quantitation. The used TOF-MS detector showed a performance comparable to quadrupole
systems operated in selected ion monitoring (SIM) mode with the advantage of full spectra data
acquisition across the complete chromatogram. This way, a retrospective view on the data was
possible.
HPLC-GC-TOF-MS chromatograms of vitamin D standards revealed two peaks per compound
with an intermediate valley in between (see Fig. 5.3). This valley indicated a reaction of vitamin
D during the GC separation process. Trapp investigated this phenomenon and used it for
quantitation of reaction kinetics [23]. From the two found peaks, only the first one was used for
qualification and quantitation because of its higher intensity. According to the literature, this
peak resembles the pyro isomer of vitamin D [24]. Fragmentation patterns of pyro and isopyro
isomers were virtually the same, but the abundance of several ions differed. Since the intensity
of the isopyro isomer is not sufficient for processing purposes, it was ignored for further data
analyses.

5. Food nutrition analysis (Vitamin D) 87
Fig. 5.3. HPLC-GC-TOF-MS chromatogram (top) and TOF-MS spectra of vitamin D2 (bottom left: pyro isomer; bottom right: isopyro isomer)
Degradation or poor ionization efficiency due to volatility or polarity problems as described in
the literature could not be observed [25]. Normally, derivatization is recommended to increase
the volatility of vitamin D (boiling point >490 °C at 1 atm). It is believed that the on-column
transfer of the vitamin D compounds offers a reliable and efficient way from the HPLC to the
GC dimension. Figure 5.4 shows the separation of vitamins D2, D3, and the corresponding
ISTDs, which was only possible by MS detection.

88 5. Food nutrition analysis (Vitamin D)
Fig. 5.4. HPLC-GC-TOF-MS extracted ion chromatogram of a standard containing vitamins D2, D3, and the corresponding ISTDs (see Table 5.2 for selected ions).
5.3.3 Calibration curves, LOD, and LOQ
Calibration curves for vitamins D2 and D3 ranged from 150 to 1800 pg on column. Table 5.2
summarizes the quantitation parameters. The available ISTDs carried only three deuterium
atoms. Because of the distinct isotopic patterns of steroid compounds, analyte isotopic ions
disturbed the abundance of the analogue ISTD ions to some extent (see Table 5.2). This
phenomenon is known as “cross-contribution” in the literature [26]. Shortly, cross-contribution
can lead to nonlinearity of calibration curves if it exceeds some percentage. Furthermore,
contribution of analyte ions to the ISTD ions can lead to underestimation at high analyte
concentrations. Therefore, the chosen quantifier ions were optimized as a compromise of cross-
contribution and sensitivity. Measured cross-contributions were in good accordance with the
theoretical calculations. Furthermore, the amount of ISTD was adjusted to minimize the effects
of cross-contribution.

5. Food nutrition analysis (Vitamin D) 89
Table 5.2. Quantitation parameters and calibration curves
Vitamin D2 Vitamin D3
Analyte (ISTD) quantifier ions [m/z] 337+396 (339+399) 325+384 (327+387)
Cross-contribution of analyte to ISTDa [%] 4.0 3.7
Coefficient of determination (R²) 0.9996 0.9995
LODb [pg] 42 52
LOQc [pg] 128 157 a: Cross-contribution was calculated on the base of the theoretical isotopic distribution pattern at equal concentrations of analyte and ISTD b: 3.3 ∗
c: 10 ∗
As can be seen in Table 5.2, good linearity is achieved for the chosen calibration range with
coefficients of determination greater than 0.999 despite a cross-contribution of approximately
4 %. To exclude the influence of cross-contribution on the quantitative results, experimental
quantitation solely based on ions not showing cross-contribution was performed (e.g., m/z 384/
387 for vitamin D3 and ISTD). Because of this, cross-contribution issues were not further taken
into account for quantitation.
Additionally, the observed calibration linearity justifies the usage of the pyro isomer for
quantitation of the total vitamin D content. The isomerization of the original vitamin D
compound during the GC separation seems to be kinetically fast, the products seem
thermodynamically stable, and the result ratio seems to be fixed. This observation is in
accordance with the literature [25].
Limits of detection (LOD) and limits of quantitation (LOQ) could be derived from the
calibration curves. Although EI ionization in GC-MS ion sources favors high fragmentation of
steroid compounds, LOD and LOQ for vitamin D2 were calculated as 42 and 128 pg,
respectively. LOD and LOQ for vitamin D3 were calculated as 52 and 157 pg. Usage of softer
ionization techniques like chemical ionization (CI) could further lower the detection and
quantitation limits [27].

90 5. Food nutrition analysis (Vitamin D)
5.3.4 Repeatability
Repeatability of the system was tested with a 600-pg standard which was subsequently injected
six times. Table 5.3 summarizes the results. Without ISTD, the relative standard deviation
(%RSD) was approximately 8 %. As can be seen by ISTD correction, the relative standard
deviation could be significantly lowered to approximately 1 %.
Table 5.3. Repeatability of HPLC-GC-MS method
Compound %RSDa without ISTD %RSDa with ISTD
Vitamin D2 7.8 1.0
Vitamin D3 6.8 1.3 a: calculated from six injections of a 600-pg standard
5.3.5 Comparison to classical method
Figure 5.5 shows a flow diagram summarizing the elementary steps of all three described
methods (HPLC-UV, HPLC-MS/ MS, and HPLC-GC-MS). As can be seen, HPLC-GC-MS
allows a significant reduction of manual work steps. Although enrichment steps during a sample
preparation are easily performed, they are rather time-consuming. Only a limited number of
samples can be processed at once. In the classical HPLC-UV approach, the necessary normal
phase HPLC cleanup step is an additional bottleneck. Because the samples have to be cleaned
up sequentially, the achievable sample throughput is limited. HPLC-GC-MS does not need
enrichment steps for most sample types, although they can be applied whenever needed.

5. Food nutrition analysis (Vitamin D) 91
Fig. 5.5. Flow diagram of elementary steps for HPLC-UV, HPLC-MS/MS, and HPLC-GC-MS
HPLC-GC-MS was compared to the classical HPLC-UV method described in the experimental
section. Comparison was performed with the reference instant milk powder. Table 5.4 and Fig.
5.6 summarize the results and compare the chromatographic characteristics. The injected
sample amount could be significantly lowered for HPLC-GC-MS with adequate sensitivity.
The results are in good agreement with the classical method. Thus, HPLC-GC-MS allows the
reduction of the manual sample preparation and cleanup processes without compromising the
analytical quality for this type of matrix.

92 5. Food nutrition analysis (Vitamin D)
Table 5.4. Quantitative comparison of HPLC-UV and HPLC-GC-MS for the reference instant milk powder
HPLC-UV HPLC-GC-MS
Injected sample amount [mg] 150 9
Vitamin D3 concentration [µg/100 g] 10.2±0.09 10.0±0.02
Injected vitamin D3 amount [ng] 15.2 0.9
Declared vitamin D3 content: 10 µg/100 g Standard deviation based on analysis in triplicate.
Fig. 5.6. Chromatographic comparison of HPLC-UV (top: UV-signal) and HPLC-GC-MS (bottom: extracted ion chromatogram) for the reference instant milk powder
Further matrices were tested to explore the potential of this approach. Table 5.5 summarizes
the quantitative results for the selected food matrices and dietary supplements. If not stated
otherwise, each sample was prepared once and analyzed in triplicate. As can be seen, the
standard deviation is below 1 % for all matrices, even for a plant sterol-enriched margarine.
Standard deviations of the ISTD areas during the measurement sequence were below 10 %,
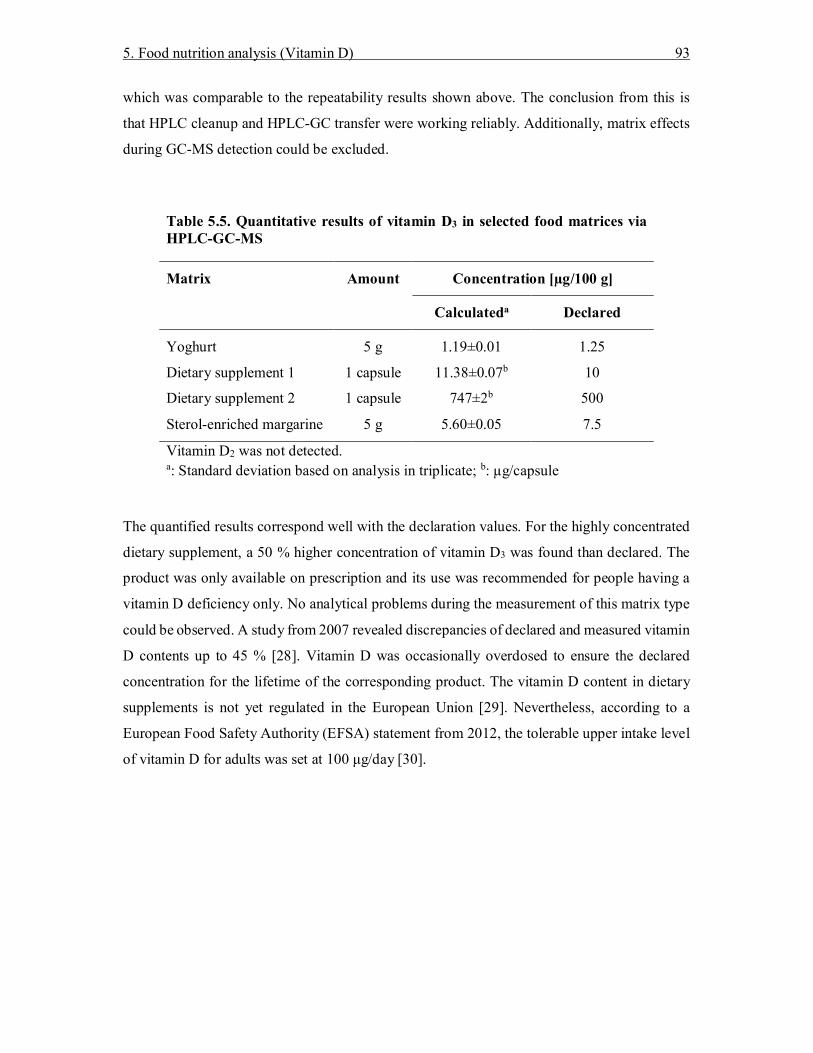
5. Food nutrition analysis (Vitamin D) 93
which was comparable to the repeatability results shown above. The conclusion from this is
that HPLC cleanup and HPLC-GC transfer were working reliably. Additionally, matrix effects
during GC-MS detection could be excluded.
Table 5.5. Quantitative results of vitamin D3 in selected food matrices via HPLC-GC-MS
Matrix Amount Concentration [µg/100 g]
Calculateda Declared
Yoghurt 5 g 1.19±0.01 1.25
Dietary supplement 1 1 capsule 11.38±0.07b 10
Dietary supplement 2 1 capsule 747±2b 500
Sterol-enriched margarine 5 g 5.60±0.05 7.5
Vitamin D2 was not detected. a: Standard deviation based on analysis in triplicate; b: µg/capsule
The quantified results correspond well with the declaration values. For the highly concentrated
dietary supplement, a 50 % higher concentration of vitamin D3 was found than declared. The
product was only available on prescription and its use was recommended for people having a
vitamin D deficiency only. No analytical problems during the measurement of this matrix type
could be observed. A study from 2007 revealed discrepancies of declared and measured vitamin
D contents up to 45 % [28]. Vitamin D was occasionally overdosed to ensure the declared
concentration for the lifetime of the corresponding product. The vitamin D content in dietary
supplements is not yet regulated in the European Union [29]. Nevertheless, according to a
European Food Safety Authority (EFSA) statement from 2012, the tolerable upper intake level
of vitamin D for adults was set at 100 μg/day [30].

94 5. Food nutrition analysis (Vitamin D)
5.3.6 Comparison of HPLC-GC-MS with HPLC-MS/MS
For the sterol-enriched margarine, additional HPLC-MS/MS analyses were performed to
compare the results with the ones from HPLC-GC-MS measurements. HPLC-UV
chromatograms showed big disturbances during the elution window of vitamin D2/D3 and could
therefore not be used for comparison.
The obtained results are comparable to the HPLC-GC-MS results. They are (7.7±0.1) μg/100 g
and (5.6±0.1) μg/100 g for HPLC-MS/MS and HPLC-GC-MS, respectively. Standard
deviations are based on analysis in triplicate. Both results were obtained independently from
each other on different days from samples acquired in different local supermarkets. Figure 5.7
compares the relevant elution windows of both methods. In direct vicinity, both approaches
show undisturbed analyte peaks. Since no manual sample pretreatment besides saponification
was performed for HPLC-GC-MS, this method is outperforming the HPLC-MS/MS method,
which needed a prior SPE and enrichment step to remove the bulk of matrix.
Inspection of the HPLC-GC-MS data of the margarine sample showed some high boiling
compounds at the end of the chromatogram (elution temperature of 310 °C). TOF-MS spectra
revealed the steroid structure of these compounds. They are not co-eluting with vitamins D2 or
D3 and are therefore not disturbing their quantitation. The GC oven program was elongated to
remove these by-products safely. Peak shapes as well as retention times of vitamin D2/D3 were
not affected in subsequent injections. Nevertheless, their occurrence indicates the transfer of
some unwanted material from HPLC to GC.

5. Food nutrition analysis (Vitamin D) 95
Fig. 5.7. Comparison of chromatographic conditions for HPLC-MS/MS (top: two MRM transitions for vitamin D3 (left) and ISTD (right)) and HPLC-GC-MS (bottom: extracted ion chromatogram for vitamin D3 and ISTD) for the sterol-enriched margarine sample. The injected amounts of vitamin D3 for HPLC-MS/MS and HPLC-GC-MS were 6.9 ng and 0.56 ng, respectively.

96 5. Food nutrition analysis (Vitamin D)
5.3.7 HPLC-GC-MS suitability for detection of vitamin D metabolites
The detection of vitamin D metabolites (calcidiols, calcitriols) is an important field of research.
The content of these metabolites in foodstuffs is typically even lower (<1 μg/100 g) than the
vitamin D content itself [3].
HPLC-GC-MS could be suited for the detection of these metabolites. Because of the additional
hydroxyl groups, the metabolites show increased polarity. Adjustments to the HPLC method
are necessary [31]. GC-MS detection of vitamin D metabolites is reported in literature [25, 32].
The hyphenation of HPLC and GC-MS could be a valuable option for quantitation of the total
vitamin D content in foodstuffs and its evaluation should be performed in the future
5.4 Conclusion
It could be shown that a HPLC-GC-MS based method is suitable for the detection and
quantitation of vitamin D derivatives in selected food matrices and dietary supplements. Usage
of the pyro isomer allows secure quantitation. The achievable LODs and LOQs are sufficiently
low to process most foodstuffs without additional enrichment steps. Further increase of
sensitivity can be expected by usage of chemical ionization GC-CI-MS to prohibit extensive
fragmentation. Additionally, online sample enrichment via SPE prior to normal-phase HPLC
will be considered. This step could be essential for the low vitamin D metabolite contents in
foodstuffs.
Sample cleanup was implemented by an optimized analytical normal-phase HPLC dimension.
HPLC was directly online coupled to GC-TOF-MS. This way a robust system could be
designed. Manual sample preparation steps could be reduced to a minimum for the selected
food matrices. Compared to classical HPLC-UV methods, the sample throughput could be
significantly increased.
In the near future, online sample preparation will be realized just in time by the autosampler on
top of the analytical system. Additional increase of sample throughput can be expected.

5. Food nutrition analysis (Vitamin D) 97
Acknowledgements
The development of the CHRONECT LC-GC platform was funded by the Central Innovation
Program SME of the Federal Ministry for Economic Affairs and Energy BWMi (Project No.
KF 2893902NT1). The authors want to thank the vitamin and toxin department of Institute
Kirchhoff. Furthermore, Prof. Torsten C. Schmidt from University Duisburg-Essen is thanked
for valuable inputs during creation of this work.
5.5 References
[1] Eisenbrand, G.; Meyer, A. H.; Schreier, P. RÖMPP Lexikon Lebensmittelchemie, 2nd
ed.; Thieme: Stuttgart, 2006.
[2] Institute of Medicine, Food and Nutrition Board; Dietary reference intakes for calcium
and vitamin D. National Academy Press, Washington, DC, 2010.
[3] Ovesen, L.; Brot, C.; Jakobsen, J. Ann. Nutr. Metab. 2003 47, 107–113.
[4] Mattila, P. H.; Piironen, V. I.; Uusi-Rauva, E. J.; Koivistoinen, P. E. J. Agric. Food
Chem. 1994, 42, 2449–2453.
[5] Wagner, C. L.; Greer, F. R. Pediatrics 2008, 122(5), 1142–1152.
[6] Jones, G. Am. J. Clin. Nutr. 2008, 88, 582–586.
[7] Perales, S.; Alegría, A.; Barberá, R.; Farré, R. Food Sci. Tech. Int. 2005, 11, 451–462.
[8] Gathungu, R. M.; Flarakos, C. C.; Satyanarayana Reddy, G.; Vouros, P. Mass Spec. Rev.
2012, 32, 72–86.
[9] Stevens, J.; Dowell, D. J. AOAC Int. 2012, 95(3), 577–582.
[10] Heudi, O.; Trisconi, M. J.; Blake, C. S. J. Chromatogr. A 2004, 1022, 115–123.
[11] Jäpelt, R. B.; Jakobsen, J. Front Plant Sci. 2013, 4(136), 1–20.
[12] Remane, D.; Wissenbach, D. K.; Meyer, M. R.; Maurer, H. H. Rapid Commun. Mass
Spectrom. 2010, 24, 859–867.
[13] Makin, H. L. J.; Gower, D. B. Steroid Analysis, 2nd ed.; Springer Science+Business
Media B.V.: Dordrecht, 2010.
[14] Biedermann, M.; Fiselier, K.; Grob, K. J Agric. Food Chem. 2009, 57, 8711–8721.
[15] Purcaro, G.; Moret, S.; Conte, L. J. Chromatogr. A 2012, 1255, 100–111.
[16] Biedermann, M.; Grob, K. J. Chromatogr. A 2012, 1255, 56–75.
[17] Biedermann, M.; Grob, K.; Mariani, C. Fat Sci. Technol. 1993, 95, 127–133.

98 5. Food nutrition analysis (Vitamin D)
[18] Biedermann, M.; Bongartz, A.; Mariani, C.; Grob, K. Eur. Food Res. Technol. 2008,
228, 65–74.
[19] Nestola, M.; Becker, E. In Der HPLC-Experte: Möglichkeiten und Grenzen der
modernen HPLC; Kromidas, S.; Wiley-VCH: Weinheim, 2014; pp 61–100.
[20] Biedermann, M.; Grob, K. J. Chromatogr. A 2009, 1216, 8652–8658.
[21] Abidi, S. L. J. Chromatogr. A 2001, 935, 173–201.
[22] Hollis, B. W.; Frank, N. E. J. Chromatogr. 1985, 343, 43–49.
[23] Trapp, O. Chirality 2006, 18, 489–497.
[24] Takada, K. J. Lipid Res. 1983, 24, 441–448.
[25] Yeung, B.; Vouros, P. Mass Spectrom. 1995, 14, 179–194.
[26] Whiting, T. C.; Liu, R. H.; Chang, W. T.; Bodapati, M. R. J. Anal. Toxicol. 2001, 25,
179–189.
[27] Okano, T.; Mizuno, K.; Matsuyama, N.; Nobuhara, N.; Kobayashi, T. Recl. Trav. Chim.
Pays-Bas 1979, 98, 253–257.
[28] Vitamin D in Lebensmitteln; State Authority for Consumer Protection Saxony-Anhalt,
Germany, 2007.
http://www.verbraucherschutz.sachsen-
anhalt.de/fileadmin/Bibliothek/Politik_und_Verwaltung/MS/LAV_Verbraucherschutz/
lebensmittelsicherheit/schwerpunktberichte/schwerpunktberichte2007/schwerpunkte_1
5.pdf. Accessed 1. April 2016.
[29] Food supplements: guidance notes on legislation implementing directive 2002/EC/46
on food supplements; Department of Health, United Kingdom, 2011.
https://www.gov.uk/government/uploads/system/uploads/attachment_data/file/204324/
Supplements_SI_guidance__Jan_2012__DH_FINAL.pdf. Accessed 1. April 2016.
[30] European Food Safety Authority. EFSA J. 2012, 10(7), 2813.
[31] Bilodeau, L.; Dufresne, G.; Deeks, J.; Clément, G.; Bertrand, J.; Turcotte, S.;
Robichaud, A.; Beraldin, F.; Fouquet, A. J. Food Comp. Anal. 2011 24, 441–448.
[32] Coldwell, R. D.; Trafford, D. J. H.; Makin, H. L. J.; Varley, M. J.; Kirk, D. N. Clin.
Chem. 1984, 30(7), 1193–1198.

6. Unwanted contaminations in food (Polycyclic aromatic hydrocarbons) 99
6. Universal route to polycyclic aromatic hydrocarbon
analysis in foodstuff: Two-dimensional heart-cut liquid
chromatography–gas chromatography–mass
spectrometry (LC-LC-GC-MS)
Published in: Nestola, M.; Friedrich, R.; Bluhme, P.; Schmidt T. C. Universal Route to Polycyclic
Aromatic Hydrocarbon Analysis in Foodstuff: Two-Dimensional Heart-Cut Liquid
Chromatography−Gas Chromatography−Mass Spectrometry. Anal. Chem. 2015, 87(12),
6195-6203.
Abstract
Analysis of polycyclic aromatic hydrocarbons (PAHs) in complex foodstuff is associated with
complicated and work-intensive sample preparation. Chromatographic interference has to be
faced in many situations. The scope of the current work was the development of a highly
efficient two-dimensional heart-cut LC-LC-GC-MS method. Detection was performed with a
time-of-flight mass spectrometer (TOF-MS) to allow for a comprehensive evaluation of the
obtained data in terms of cleanup efficiency. Additionally, routine detection was performed
with single quadrupole MS. An easy and quick generic sample preparation protocol was
realized as a first step. During method development, focus was given to optimizing HPLC
cleanup for complex foodstuff. Silica-, polymeric-, and carbon-based HPLC phases were tested.

100 6. Unwanted contaminations in food (Polycyclic aromatic hydrocarbons)
Coupling of silica gel to π-electron acceptor modified silica gel showed the best cleanup
properties. A four rotary valve configuration allowed the usage of a single binary HPLC pump.
Screening of several fatty and nonfatty food matrices showed the absence of unwanted matrix
compounds in the cleaned-up PAH fraction down to the low picogram range using TOF-MS.
Limits of quantitation (LOQ) were below 0.1 μg/kg for all EU priority PAHs. Recovery rates
ranged from 82 to 111%. Validation data fully complied with EU Regulation 836/2011. Sample
preparation was possible in 20 min. Interlacing of HPLC and GC allowed an average method
runtime of 40 min per sample.
6.1 Introduction
Polycyclic aromatic hydrocarbons (PAHs) are compounds generally known for their toxicity,
carcinogenicity, and mutagenicity. They are composed of two or more fused aromatic ring
systems. Alkylated side chains increase the number of possible isomers to several millions [1,
2]. As unwanted contaminants, their exposure to the environment and the human organism
should be minimized.
PAHs are the product of incomplete combustion or pyrolysis of organic matter [3].
Furthermore, PAHs are natural constituents of mineral oil fractions, coal, and tar. Urban air
pollution or the processing of foodstuffs in terms of drying, roasting, or smoking can be the
sources of PAH contaminations. Only few PAHs are purposefully synthesized and used in
chemical industry [4].
Besides direct exposure, daily nutrition is a significant source for PAH intake of the human
body. Therefore, PAH concentrations in foodstuff have to be regulated and constantly
monitored [5]. Because of the variety in number, specific PAHs are chosen as representatives
in the regulation process. The most important representative is benzo[a]pyrene (BaP). Its
toxicity was thoroughly investigated in the past. After intake, this PAH is metabolized in the
human organism and can covalently bind to DNA or proteins, altering their functionalities,
which can be the origin of cancer [6].
Thus, the monitoring of foodstuffs is of big importance. In 2008, the EFSA (European Food
Safety Authority) confirmed 16 (15+1) European priority PAHs that clearly showed
carcinogenic and mutagenic potential. Monitoring of these compounds was recommended,
although no upper limits for all compounds were available by law [7]. Three years later, in

6. Unwanted contaminations in food (Polycyclic aromatic hydrocarbons) 101
2011, EU Regulation 835/2011 came into force, establishing the upper limits of a subset of four
specific PAHs (PAH4) in various food matrices [8].
In the case of edible oils and fats, the upper limit for BaP was set to 2 µg/kg, whereas the sum
of benz[a]anthracene, chrysene, benzo[b]fluoranthene and BaP was fixed to 10 µg/kg.
6.1.1 Analytics of PAHs in foodstuff
The determination of PAHs in foodstuff is challenging because of the variety in matrices in
which they are found. The detection of a few micrograms per kilogram in the presence of bulk
matrix compounds like triglycerides, fatty acids, proteins, etc. is demanding. It calls for
optimized analytical methods. The performance criteria for the PAH4 determination are
summarized in Table 6.1 created from EU Regulation 836/2011 [9].
Table 6.1. Performance criteria for the determination of PAH4 [9]
Parameter Criterion
Precisiona (repeatability and reproducibility) RSDr < 29.3 % and RSDR < 44 %
Recovery 50 – 120 %
LOD ≤ 0.3 µg/kg for each PAH
LOQ ≤ 0.9 µg/kg for each PAH a: Precision derived from Horwitz ratios, and acceptable relative standard deviations according to Thompson [10]
In general, detection of PAHs is carried out either by liquid (HPLC) or by gas chromatographic
(GC) methods.
HPLC methods normally rely on optimized C18 columns coupled to fluorescence detection
(FLD). Specific excitation and emission wavelengths allow detection limits in the low picogram
(pg) range on column [11]. Unfortunately, not every PAH exhibits a fluorescence signal. For
instance, cyclopenta[c,d]pyrene does not give rise to fluorescence. Because of this, additional
UV detection is necessary to cope with all EU priority PAHs. UV detection is less sensitive and
less specific than FLD detection. Atmospheric pressure photoionization (APPI) followed by
tandem mass spectrometric detection (HPLC-APPI-MS/MS) represents another approach in
PAH analytics [12].

102 6. Unwanted contaminations in food (Polycyclic aromatic hydrocarbons)
Due to their simplicity, HPLC-based methods found their way into official methods [13].
Nevertheless, EFSA and other institutions recommend the use of methods based on gas
chromatography–mass spectrometry (GC-MS) because of the increased specificity.
Compared to HPLC methods, capillary GC techniques exhibit higher peak capacities and allow,
therefore, separations to be performed that were hardly possible in conventional HPLC
environments [14]. MS detection is generally based on electron impact (EI) ionization coupled
to single quadrupole mass analyzers operated in selected ion monitoring (SIM) mode. Because
PAHs form relatively stable fragments, mainly molecular ions M+•, detection limits are in the
low picogram range on column, which is comparable to that with HPLC-FLD methods.
Quantitation is based on isotope dilution approaches using deuterium- or 13C-labeled internal
standards.
It is worth mentioning that special GC columns are needed to enable all necessary separations
for the EU priority PAHs. These columns are typically based on 35 or 50 % diphenyl-dimethyl
polysiloxane thin film stationary phases [15].
6.1.2 Extraction of PAHs from foodstuff
Apart from the chromatographic challenges, the isolation process of PAHs from foodstuff is of
significant importance. Extraction of PAHs from the bulk of food matrix calls for specific
cleanup protocols.
Depending on the food matrix, differing extraction procedures are found in literature [16].
Nonfatty food allows the use of simple solid-phase extraction (SPE) or multi-residue techniques
like QuEChERS. However, isolation of PAHs from fatty food is more challenging. Co-
extraction of triglycerides, emulsifiers, fat-soluble vitamins, and other matrix compounds
requires more sophisticated cleanup strategies [17].
Many kinds of sample extraction and cleanup techniques can be found for PAH analytics.
Liquid-liquid extraction, complexation, SPE, solid-phase microextraction (SPME), and
microwave-assisted extraction are only a small number of the described methods. Alkaline
saponification has been used in several cases. Chromatographic cleanup steps involve the usage
of column chromatography, donor-acceptor chromatography, size-exclusion chromatography,
preparative HPLC, and many more.

6. Unwanted contaminations in food (Polycyclic aromatic hydrocarbons) 103
The bottom line is that most published methods rely on particular and specialized sample
preparation methods. Very little literature is available that deals with universal protocols
capable of analyzing a variety of food matrices without adaptions.
All these factors and variability increase the complexity during sample preparation. Obligatory
solvent evaporation steps between cleanup stages need additional time and manual work.
Because of this, extraction and detection of PAHs in foodstuff is time-consuming and error-
prone.
The aim of the current work was, therefore, to find a solution for this obstacle. Hyphenation of
multiple chromatographic techniques was explored to generalize and simplify PAH analytics.
This decision was based on literature that deals with complex samples, e.g., edible oils,
chocolate, or meat [18–20]. In these cases, multiple cleanup techniques were necessary to obtain
sufficiently clean extracts, which could be injected either in HPLC-FLD or GC-MS systems.
For instance, in the official ISO method EN ISO 22959:2009, for the detection of PAHs in
animal and vegetable oils and fats, an online LC-LC-FLD approach is described. It is based on
a tetrachlorophthalimidopropyl (TCPIP) modified silica gel column followed by C18 reversed-
phase HPLC [18]. Sufficient cleanup results are obtained for a high number of edible oils.
Nevertheless, for foodstuffs such as olive pomace oils or algae chromatographic interferences
were reported [12, 21]. Further cleanup steps or tandem MS detection were necessary.
As another approach, hyphenation of HPLC and GC was discussed in the literature.
6.1.3 LC-GC hyphenation
Coupling of HPLC to GC has been reported in the literature for at least 30 years, especially for
the determination of mineral oil originating compounds in food and paper stuff [22].
Nevertheless, other fields of application, like sterol or alkyl ester quantitation, have also been
explored [23–27]. The hyphenation of both separation techniques allows the orthogonal
coupling of well-established sample cleanup processes (HPLC) with highly efficient separation
and detection techniques (GC). Online coupling offers additional advantages, such as reducing
manual sample preparation, decreasing cross-contamination, and increasing sample throughput.
Bare silica HPLC phases are the most common for the extraction and purification of nonpolar
analytes from difficult food matrices [28–30]. The main reason for this choice is the ability of
silica to retain high amounts of triglycerides [31]. Analytes less polar than triglycerides can be

104 6. Unwanted contaminations in food (Polycyclic aromatic hydrocarbons)
safely separated from the bulk of matrix by using nonpolar mobile phases. A 10 cm x 2 mm
silica column can retain up to 25 mg of triglycerides when n-hexane is used as the mobile phase.
Silica flooded by triglycerides is not able to retain any other compound. Thus, flooding of the
entire column must be prevented. Twenty milligrams of triglycerides flood approximately 50
% of a 25 cm x 2 mm silica column when n-hexane/dichloromethane (70:30, v/v) is used as the
mobile phase [31]. The residual 50 % of the stationary phase is used for the chromatographic
separation of analytes and other matrix compounds.
6.1.4 Detection of PAHs by LC-GC-MS
Detection of PAHs in vegetable oils was realized by an LC-GC-MS method based on a single
silica cleanup [32]. Own studies revealed that vegetable oils with high squalene contents, e.g.,
olive oils, showed significant chromatographic interference. Biedermann et al. investigated the
co-elution of squalene and aromatic hydrocarbons on silica phases [33]. They analyzed mineral
oil aromatic hydrocarbons (MOAH) in foodstuffs with an LC-GC-FID system. Since MOAHs
are alkylated PAHs, the elution windows of both analyte groups are virtually the same on silica
phases. The authors discovered that not only did squalene elute inside the MOAH fraction but
also other polyunsaturates (e.g., carotenes, steradienes, isomerized squalenes, sesquiterpenes,
etc.). The last consequence of this it that silica-based LC-GC methods cannot be used for the
detection of PAHs in samples containing high amounts of polyunsaturates without adaptions.
Two-dimensional heart-cut LC-LC-GC-MS was chosen to conquer this obstacle. The addition
of a second HPLC dimension after a silica cleanup allowed for the selective removal of
polyunsaturates. Extensive band broadening caused by the large transfer volume between the
dimensions had to be prohibited. Therefore, a variety of HPLC stationary phases was probed
for retention of PAHs.
During method development, GC-MS detection was performed with a time-of-flight mass
spectrometer (TOF-MS). This allowed for a comprehensive evaluation of the obtained data as
opposed to that with selected ion monitoring, which is normally performed with quadrupole
MS. Contrary to quadrupole MS, TOF-MS allowed higher sensitivities to be achieved while
maintaining complete mass spectral information. Finally, the method was combined with a
minimized generic sample preparation protocol to cope with as many matrix types as possible.
6. Unwanted contaminations in food (Polycyclic aromatic hydrocarbons) 105
6.2 Experimental Section
6.2.1 Samples
Food samples were obtained at local supermarkets. They consisted of extra virgin olive oil,
refined sunflower oil, chicken eggs, tomato ketchup, mayonnaise, filter and instant coffee,
drinking chocolate, chamomile tea, cream cheese, butter, and phytosteryl ester-enriched
margarine. A FAPAS (Food Analysis Performance Assessment Scheme) quality control olive
oil (T0656 QC) was obtained from FERA (The Food and Environment Research Agency, Sand
Hutton, United Kingdom). This QC material was part of a proficiency trial and therefore
statistical evaluation data were available [34].
6.2.2 Chemicals and solutions
Dichloromethane, ethanol, and n-hexane were from LGC Promochem (Picograde quality,
Wesel, Germany). Naphthalene, naphthalene-d8, acenaphthylene, acenaphthylene-d8,
acenaphthene, acenaphthene-d10, fluorene, fluorene-d10, phenanthrene, phenanthrene-d10,
anthracene, anthracene-d10, fluoranthene, fluoranthene-d10, pyrene, pyrene-d10, 7H-
benzo[c]fluorene, benz[a]anthracene, benz[a]anthracene-d12, cyclopenta[c,d]pyrene, chrysene,
chrysene-d12, 5-methylchrysene, benzo[b]fluoranthene, benzo[b]fluoranthene-d12,
benzo[k]fluoranthene, benzo[k]fluoranthene-d12, benzo[j]fluoranthene, benzo[a]pyrene,
benzo[a]pyrene-d12, indeno[1,2,3-cd]pyrene, indeno[1,2,3-cd]pyrene-d12,
dibenz[a,h]anthracene, dibenz[a,h]anthracene-d14, benzo[g,h,i]perylene, benzo[g,h,i]perylene-
d12, dibenzo[a,l]pyrene, dibenzo[a,e]pyrene, dibenzo[a,i]pyrene, and dibenzo[a,h]pyrene in
cyclohexane were purchased from Neochema (Bodenheim, Germany). Citric acid (99 %) and
potassium hydroxide (≥85 %, pellets, white) were from Sigma Aldrich (Steinheim, Germany).
Sodium sulfate was from Fluka (Buchs, Switzerland). Water was supplied from a Milli-Q water
purification system (Merck, Darmstadt, Germany).
6.2.3 Sample preparation
The single steps of the sample preparation and the subsequent LC-LC-GC-MS analysis are
summarized in Fig. 6.1.

106 6. Unwanted contaminations in food (Polycyclic aromatic hydrocarbons)
Fig. 6.1. Flowchart of a foodstuff sample subjected to LC-LC-GC-MS analysis (TCPIP: tetrachlorophthalimidopropyl).
6.2.4 Generic protocol
Three grams of the homogenized sample were weighed into a 40-mL EPA vial with a screw
cap. After addition of 100 µL of the internal standard solution (ISTD, 100 pg/µL resembling
3.35 µg/kg), 15 mL of ethanol/water (1:1, v/v) and 10 mL of n-hexane were added. Depending
on the water content of the sample, the ethanol amount was increased to maintain an ethanol-
water ratio of 1:1. Less ethanol could result in problems during phase separation in the further
extraction step. The sample was thoroughly shaken for two minutes. After centrifugation (5 –
10 min, 2000 g), the lower phase was discarded and replaced by 5 mL of fresh ethanol/water.
If phase separation did not occur, then the aqueous layer was kept. Two-hundred fifty
microliters of an aqueous KOH solution (1:1, w/w) were added. After shaking for 1 min, the
solution was allowed to react for 15 min in an ultrasonic bath. If the sample contained
emulsifiers, then phase separation occurred during this time. Five milliliters of the clear upper
organic layer were transferred into a 20-mL headspace vial. Afterward, 1 g of a powder mixture
of solid citric acid and sodium sulfate (1:2, w/w) was added to neutralize and dry the n-hexanic
solution in a single step. After shaking for 1 min and centrifugation (1 min, 2000 g), 1 mL of
the dried organic phase was transferred into a 2-mL autosampler vial.

6. Unwanted contaminations in food (Polycyclic aromatic hydrocarbons) 107
6.2.5 Edible oils and fats
Edible oils and fats free from significant amounts of particles, water, and emulsifiers were
directly processed without application of the generic protocol. In a 2-mL autosampler vial, 300
mg of the sample were mixed with 690 µL of n-hexane. Ten microliters of the ISTD solution
(100 pg/µL) were added, resembling a PAH weight concentration of 3.35 µg/kg. Before
injection, it was visually inspected and found to be clear and particle-free. In uncertain
situations, a small amount of water was added. If the aqueous layer was not clearly observable
and separated from the n-hexanic layer, then the generic protocol was applied.
6.2.6 LC-LC-GC-MS method
LC-LC-GC-MS experiments were performed on a system from Axel Semrau (Sprockhövel,
Germany). It consisted of a 1260 Infinity HPLC system (binary pump and variable wavelength
detector by Agilent Technologies, Waldbronn, Germany), Master GC and Master TOF-MS
(DANI Instruments S.p.A., Cologno Monzese, Italy), and a CombiPAL autosampler (CTC
Analytics AG, Zwingen, Switzerland). The Master TOF-MS time-of-flight detector was used
for method development. Routine measurements and validation data were obtained from a DSQ
II single quadrupole mass spectrometer (Thermo Fisher Scientific Inc., Austin, TX, USA).
Four rotatory switching valves (VICI AG International, Schenkon, Switzerland) were used to
guide the HPLC eluent from the HPLC into the GC. It allowed for the usage of only one binary
pump in combination with an HPLC heart-cut method using two HPLC columns. The valve
scheme is described in detail in the Results and Discussion.
The GC was equipped with an on-column interface and a solvent vapor exit. The on-column
interface, the carrier gas, and solvent vapor exit were controlled by CHRONECT LC-GC from
Axel Semrau.
Of the sample extracts, 70 µL (20 mg) were injected onto an Allure Si HPLC column (250 mm
x 2.1 mm, 5 µm, 60 Å, Restek, Bellefonte, PA, USA) without additional column temperature
control. The second dimension HPLC column was a Chromspher Pi (80 mm x 3.0 mm, 5 µm,
120 Å, Agilent Technologies).
The mobile phase consisted of n-hexane and dichloromethane. Under standby conditions, both
columns were connected in series and supplied with 100 % n-hexane at 50 µL/min. Shortly
before injection, the second column was decoupled. Starting at 100 % n-hexane with 300

108 6. Unwanted contaminations in food (Polycyclic aromatic hydrocarbons)
µL/min, the mobile phase was changed to 65 % n-hexane in 0.5 min after injection. It was held
until 4.3 min. The PAH fraction eluted from the silica column between 4.3 and 5.5 min (1.2
min). Both columns were connected in series during this time. Shortly afterward, the silica
column was decoupled, and the mobile phase (100 % n-hexane at 500 µL/min) was delivered
solely to the second column. It was maintained until 11.0 min. The mobile phase was switched
to 100 % dichloromethane (300 µL/min), and the flow direction was reversed. After elution of
the PAH fraction between 13.4 and 14.1 min (0.7 min), both columns were backflushed with
100 % dichloromethane at 500 µL/min for 15 min. Afterward, the columns were reconditioned
with n-hexane at 500 µL/min for an additional 10 min in the forward direction.
HPLC-GC transfer occurred by the retention gap technique and fully concurrent solvent
evaporation (FCSE) through the Y-interface [35]. A coated precolumn (Rxi-1, 0.5 m x 0.53 mm
x 0.1 µm, Restek) was followed by a steel T-piece union connecting to the solvent vapor exit
and a separation column coated with a modified 50 % diphenyl-dimethyl polysiloxane film
(Select PAH, 15 m x 0.15 mm x 0.10 µm, Agilent Technologies).
The PAH fraction was transferred to the GC at a carrier gas inlet pressure of 80 kPa (helium)
in addition to an oven temperature of 50 °C. The elution window was verified by UV detection
at 230 nm. The solvent vapor exit was opened 0.5 min before the elution of the PAH fraction
began. Fully concurrent evaporation of the solvent was chosen although loss of lighter PAHs
through the solvent vapor exit was observed. Under these conditions, anthracene and
phenanthrene were still partially lost (recoveries of approximately 70 %). Higher recoveries
would have been possible, but since the focus of this work was laid on EU priority PAHs, there
was no need to optimize the evaporation conditions. The solvent vapor exit was closed 0.1 min
after the fraction was transferred. At this time, the carrier gas flow rate was set to 1.2 mL/min.
The oven temperature was programmed at 50 °C/min from 50 °C (2.6 min) to 180 °C, at 7
°C/min to 230 °C (7 min), at 50 °C/min to 280 °C (7 min), and finally at 30 °C/min to 350 °C
(3.33 min, total time 33.00 min). The Master TOF-MS ion source and transfer line temperatures
were set to 200 °C and 350 °C, respectively. Data acquisition started after 6.0 min at a rate of
5 spectra/s with EI ionization at 70 eV. In contrast, the DSQ II ion source temperature was set
to 230 °C. Data acquisition occurred in SIM mode. Data processing was performed with
Xcalibur 2.2 (Thermo Fisher Scientific Inc.).
Quantitation was based on deuterated ISTDs. Calibration was done by plotting the ratio of the
analyte signal to the internal standard signal as a function of the analyte concentration of the

6. Unwanted contaminations in food (Polycyclic aromatic hydrocarbons) 109
standards. Routine calibration curves were created from 0.1 to 5 µg/kg in six levels (2 – 100 pg
on column). Each level was measured once.
6.3 Results and Discussion
6.3.1 Necessity for a two-dimensional HPLC cleanup
The retention of triglycerides on silica highly depends on the mobile phase used. Chlorinated
hydrocarbons and ethers are virtually the only modifiers possible when fatty foodstuff is to be
analyzed [31]. Studies with dichloromethane, chloroform, and MTBE showed that they had no
influence on the separation efficiencies between polyunsaturates and PAHs. Hence, heart-cut
coupling of silica to a second stationary phase was chosen. On the one hand, the superior
cleanup properties of silica gel could be maintained; on the other hand, a second HPLC
dimension could be used for the separation of PAHs and polyunsaturates.
Apart from silica gel, further materials for the isolation of PAHs from fatty foodstuff can be
found. One type of described materials is based on polymeric polystyrene divinylbenzene (PS-
DVB) [36, 37]. It is used in SPE cleanup protocols. Edible oils diluted in n-hexane or isooctane
can be loaded onto these SPE columns. Because of hydrophobic and electrostatic quadrupole-
quadrupole interactions, PAHs are retained, whereas the matrix can be removed with solvents
like methanol or ethers. Afterward, PAHs are eluted with an appropriate solvent, e.g., toluene,
tetrahydrofuran (THF), or dichloromethane. Similar retention mechanisms can be attributed to
porous graphitic carbon (PGC) phases when used under normal-phase conditions [38].
Other types of phases are based on modified silica gel carrying ligands exposing π-electron
acceptor moieties. π-electron rich molecules like PAHs can form donor-acceptor complexes
with these ligands. As a consequence, they are highly retained. Elution is performed with
appropriate eluents, e.g., dichloromethane or acetonitrile, releasing the PAHs from the column
surface [39]. For instance, caffeine or TCPIP modified silica gel is showing this behavior [40,
41].
The usage of a single PS-DVB, PGC, or TCPIP column was not considered during the
development of this LC-GC-MS method. Regarding PS-DVB, it was found that a single SPE
cleanup did not remove all kinds of residual matrix compounds. For instance, extracts of
vegetable oils showed significant amounts of fatty acid esters in TOF-MS total ion current (TIC)

110 6. Unwanted contaminations in food (Polycyclic aromatic hydrocarbons)
chromatograms. Although detection of PAHs was not disturbed, a single PS-DVB cleanup was
not considered for further method development.
Regarding TCPIP, the available columns are normally used with isopropanol as the mobile
phase. With its high elution strength on silica, isopropanol deactivates the backbone of the
column. In contrast, isopropanol shows only little elution strength on TCPIP. Therefore,
analytes are not retained by the silica but only by the TCPIP ligands. LC-GC-TOF-MS
experiments revealed that isopropanol continuously stripped high amounts (nanogram range)
of tetrachlorophthalic anhydride and other ligand-related compounds from the column. This
effect is normally of no concern when HPLC-FLD is used because of the specific excitation
and emission wavelengths of PAHs. However, faster column aging definitely has to be
considered. Phase stripping was not observed when n-hexane was used as the mobile phase.
Nevertheless, elution of undesired polar compounds was no longer possible with such a
nonpolar solvent.
Besides other negative side effects, which will be discussed later, PGC phases also showed
retention of polar compounds when used under normal-phase conditions with nonpolar
solvents.
Overall, coupling of a silica column with a PS-DVB, PGC, or TCPIP column seemed to be the
most promising approach.
6.3.2 Screening of HPLC phase materials for the second dimension
The task for the second HPLC column would be the removal of remaining polyunsaturates from
the fraction of the first silica column. For this, band broadening caused by the large fraction
volume (>300 µL with 35 % dichloromethane) had to be prohibited. Refocusing of the PAHs
at the head of the second column was necessary. Since all three types of materials seemed
reasonably well-suited for this task, the use of all three was attempted.
TCPIP modified silica gel and PGC columns were commercially available. On the contrary,
only a few PS-DVB columns were found. Instead, SPE bulk and cartridge material was slurry-
packed in HPLC columns. As a testing procedure, HPLC-UV probing was chosen. Squalene
and naphthalene were selected as probing molecules. Since naphthalene is the smallest possible
PAH, it was expected that it would show the most critical separation to squalene. Both
substances were diluted to a concentration of 1 µg/µL each in n-hexane. n-Hexane was also
used as the mobile phase (300 µL/min). Ten microliters of both standards were consecutively

6. Unwanted contaminations in food (Polycyclic aromatic hydrocarbons) 111
injected onto each probed column. UV detection wavelength was set to 205 nm. Capacity and
selectivity factors (k and α) were calculated to quantify the separation of squalene and
naphthalene. Although experimental details differ from those of the final heart-cut system, this
test revealed interesting facts. The results are summarized in Table 6.2.
Table 6.2. Stationary phases probed for naphthalene (Na) retention and squalene (Sq) separation
Manufacturer Phasea Column dimension [mm]
k(Sq) k(Na) α(Na/Sq)
Agilent OPT 50 x 2.1 1.00 4.14 4.14
Agilent Plexa 50 x 2.1 1.36 4.04 2.97
Agilent PPL 50 x 2.1 1.14 3.07 2.70
Agilent Chromspher Pib 80 x 3.0 0.48 9.09 18.75
Benson BP-OA-Ag 125 x 4.1 0.89 1.54 1.72
Biotage Evolute ABN 50 x 2.1 1.08 3.12 2.89
Biotage Isolute ENV+ 50 x 2.1 2.10 7.52 3.57
Hamilton PRP-1 150 x 2.1 0.13 1.03 7.81
Hamilton PRP-X200 150 x 2.1 0.18 1.38 7.59
Jordi Labs Fluorinated DVB 50 x 4.6 0.71 3.08 4.34
Macherey Nagel Chromabond Easy 50 x 2.1 1.00 5.85 5.85
Macherey Nagel Chromabond HR-X 50 x 2.1 1.33 3.37 2.53
Merck LiChrolut EN 50 x 2.1 0.97 6.09 6.29
Phenomenex SDB-L 50 x 2.1 1.19 2.63 2.22
Phenomenex Strata-X 50 x 2.1 1.35 4.32 3.19
Supelco ENVI-Chrom P 50 x 2.1 1.68 3.88 2.31
Supelco SupelMIP PAH 50 x 2.1 1.50 5.35 3.57
Supelco Supel-Select HLB 50 x 2.1 1.48 4.72 3.19
Thermo HyperCarbc 150 x 2.1 1.43 3.04 2.13
Waters Oasis HLB 50 x 2.1 0.97 3.91 4.03 a: Materials based on PS-DVB unless stated otherwise b: TCPIP modified silica gel c: PGC type stationary phase A more detailed version of this Table including particle sizes, pore sizes, and available phase compositions can be found in the Supporting Information.
112 6. Unwanted contaminations in food (Polycyclic aromatic hydrocarbons)
TCPIP modified silica gel showed the highest retention (k ≈ 9) of naphthalene paired with the
best separation to squalene (α ≈ 19). Therefore, TCPIP modified silica gel (Agilent Chromspher
Pi) was chosen for the second dimension.
Despite having differing particle sizes, pore sizes, and polymer compositions, most PS-DVB
phases showed comparable retention of naphthalene. In single cases, peak shapes of squalene
and naphthalene showed strong tailing, influencing their separation. Capacity factors were
calculated at the peak apexes, so selectivity factors do not reflect peak asymmetries. In the
Supporting Information, Table 6.2 is extended by including peak widths, asymmetries, and
chromatographic resolutions.
It is noteworthy that the tested PS-DVB phases were also suited for the retention of PAHs under
LC-LC-GC-MS conditions. Nevertheless, smaller PAHs, in particular cases, up to fluoranthene
and pyrene, were not quantitatively retained. TCPIP exhibited higher retention for these PAHs.
PGC showed an undesired side effect not found on other materials. Heavy PAHs (6 ring
dibenzopyrenes) could not be quantitatively eluted even with the strongest solvents
(dichloromethane or toluene). Column heating to temperatures exceeding 75 °C was necessary
to allow elution to take place. Furthermore, unpreventable carryover effects rendered the usage
of PGC impossible.
6.3.3 Two-dimensional heart-cut HPLC method
Heart-cut HPLC techniques require dedicated valve switching solutions. A special one that
allows for the usage of only one binary HPLC pump was developed during the current work.
Both columns could be supplied with the mobile phase, stand alone or in series, in either
direction. If a column was not used, then it could be placed under stopped-flow conditions. The
valve scheme and the sequence of method’s actions are given in Fig. 6.2 and Table 6.3,
respectively.

6. Unwanted contaminations in food (Polycyclic aromatic hydrocarbons) 113
Fig. 6.2. Valve scheme for an LC-LC-GC-MS configuration with a single binary HPLC pump. A detailed version of this scheme can be found in the Supporting Information.
Table 6.3. Sequence of method’s actions during an LC-LC-GC-MS run
Time [min] Action
-0.20 Silica and TCPIP column connected in series during standby
-0.10 TCPIP column switched to stopped-flow condition
0.00 Injection on silica column
4.30 – 5.50 Heart-cut from silica to TCPIP column
5.60 Silica column switched to stopped-flow condition
11.00 Begin of backflush of TCPIP column
13.40 – 14.10 Elution of PAH fraction from TCPIP column into GC-MS
14.20 – 20.00 Backflush of TCPIP column for matrix removal
20.10 – 30.00 Backflush of silica column for matrix removal
30.10 – 40.00 Re-equilibration of silica and TCPIP column in series in forward direction
The silica column was used with n-hexane/dichloromethane to maximize its retention for
triglycerides. As already examined, this type of column was able to purify a sample and leave
behind a fraction containing only PAHs and polyunsaturates. A 25 cm x 2.1 mm column was
chosen, which was able to retain 20 mg of triglycerides. Elution of the PAH/polyunsaturated
fraction was possible in approximately 360 µL. Removal of polyunsaturates from the TCPIP
column was achieved with n-hexane in forward direction, whereas elution of PAHs occurred
with dichloromethane in backward direction.
Backflushing of both columns was important. On the one hand, it was needed to remove the
matrix left behind on the silica column; on the other hand, backflushing the TCPIP column was

114 6. Unwanted contaminations in food (Polycyclic aromatic hydrocarbons)
necessary to elute the PAH fraction in a small volume into the GC-MS system. Elution in
forward direction with dichloromethane resulted in a broad fraction of more than 1 mL.
Backflush elution, however, was possible in approximately 210 µL. Compared to the silica gel
fraction (360 µL), backflush elution of the TCPIP column allowed a band compression of
almost 42 %. This clearly showed the ability of the TCPIP column to retain PAHs from a rather
large fraction volume from the first column dimension.
Transfer of the fraction into GC-MS occurred by the retention gap technique and fully
concurrent solvent evaporation through the Y-interface [35]. It was observed that GC peaks of
all PAHs began to tail after approximately 20 injections of standards. After change of the
precolumn, peak shapes recovered. The reason for this observation was found in the usage of
dichloromethane as the eluting solvent.
Over time, hydrochloric acid was probably formed in the HPLC solvent bottle. Despite being
present in small amounts, every LC-GC transfer transported several nanograms into the
precolumn, deteriorating the column’s surface. Removal of hydrochloric acid is possible by
addition of aluminum oxide to the solvent followed by filtration or re-distillation. Since these
solutions are rather work- and time-intensive, another solution was sought. To conquer this
problem, a polysiloxane-coated precolumn (0.1 µm film thickness) was used to shield the
surface from hydrochloric acid. In fact, peak shapes remained virtually unaffected for more
than 60 injections.
6.3.4 Polyunsaturates removal capacity
Twenty milligrams of extra virgin olive oil were injected into the LC-LC-GC-TOF-MS system.
Chromatograms still showed a squalene peak. By comparison with a standard of known
quantity, the peak corresponded to approximately 50 ng on column. To calculate the squalene
removal capacity of the system, the same sample was cleaned up only by the first silica HPLC
dimension. For this purpose, the sample was diluted by factor 6700:1. The silica fraction
contained the whole squalene content of the sample. In this way, a squalene peak was obtained
whose peak area could be multiplied by the dilution factor and could be compared to the LC-
LC peak area. LC-LC generated a peak approximately 8000 times smaller than a single silica
cleanup. Further removal of squalene was possible by increasing the amount of n-hexane used
for flushing of the TCPIP column. An increase in the method’s runtime and a slight loss of

6. Unwanted contaminations in food (Polycyclic aromatic hydrocarbons) 115
smaller PAHs were the consequences of this approach. However, the residual squalene did not
disturb the detection of PAHs in any way.
6.3.5 Generic cleanup capability for multiple food matrices
Alkyl, steryl, and wax esters of fatty acids are the first eluting compounds after the end of the
PAH fraction 33. Full spectra acquisition with adequate sensitivity is an inherent property of
TOF-MS. Because of this, unwanted compounds could be easily traced in the PAH fraction.
Special care was taken to examine all TOF-MS TIC chromatograms for these compounds. In
fact, traces of water and other polar residues in high amounts were able to shift the PAH fraction
to lower retention times on the silica column. This way, esters of fatty acids could be transferred
to the TCPIP column. n-Hexane was not able to elute these compounds from the silica backbone
of the TCPIP column. Thus, these compounds could be transferred into the GC-MS system
during dichloromethane elution.
Only samples containing high amounts of emulsifiers, e.g., margarine or mayonnaise, showed
traces (low picogram range) of C16 or C18 fatty acid ethyl esters. These compounds were
partially formed from ethanol and fatty acids during the saponification step of the generic
sample preparation. However, PAH detection and quantitation was undisturbed in any case.
The sample preparation protocol was adapted as follows to minimize these undesired
compounds.
Destruction of emulsifiers during the extraction process was realized by a short and mild
saponification with an aqueous solution of KOH [42]. A high percentage of emulsifiers is
composed of phospholipids (lecithins). Saponification allows for a rapid cleavage of the
phosphoric acid ester bonds [43]. Afterward, removal of traces of water from the obtained n-
hexanic phase was performed by dispersing a powder mixture of solid citric acid and sodium
sulfate into it. Citric acid had two functions. On the one hand, it neutralized residues of KOH;
on the other hand, it was able to chelate present metal ions, mainly Ca2+ and Mg2+ [43]. For
example, emulsifiers based on Ca/Mg-phosphatidates are highly soluble in nonpolar solvents.
Emulsions can evolve, and water residues can be trapped in the n-hexanic phase. By addition
of a chelating agent, the solubility of phosphatidates is changed, and a removal from the n-
hexanic phase becomes feasible. Thus, microemulsions can be destroyed, and the trapped water
can be adsorbed by sodium sulfate. The best results in terms of residual fatty acid ethyl esters
were obtained with a dispersion time of 2 min and consecutive centrifugation.

116 6. Unwanted contaminations in food (Polycyclic aromatic hydrocarbons)
On the basis of this optimized sample preparation, several food matrices were screened for
unwanted compounds inside the PAH fraction. In Fig. 6.3, the overlay of the corresponding
TOF-MS TIC chromatograms is shown. As can be seen, few unwanted compounds are present
in the chromatograms. This clearly demonstrates the cleanup potential of the designed system.
Fig. 6.3. Overlay of LC-LC-GC-TOF-MS TIC chromatograms (50 – 500 amu) of screened food matrix types (dotted lines represent PAH ISTDs; a: diphenyl sulfone from HPLC PEEK capillaries; b: nonregulated alkylated aromatic compounds; c: C18 fatty acid ethyl ester; d: stigmasta-3,5-diene; e: solvent impurity; f: polysiloxanes from vial septa). The baseline reflects dichloromethane solvent tailing at low retention times and column bleeding at higher GC oven temperatures.
6.3.6 Validation of the LC-LC-GC-MS method
The experimental setup was tested in terms of sensitivity, linearity, robustness, trueness, and
precision. All measurements were performed with a DSQ II single quadrupole mass
spectrometer. In SIM mode, it offered superior sensitivity compared to that of TOF-MS.
Ten-point calibration curves ranging equidistantly from 0.05 µg/kg to 0.5 µg/kg (1 – 10 pg) in
n-hexane were constructed. This range was chosen because it was near the desired LODs and
LOQs. The parameters are summarized in Table 6.4.

6. Unwanted contaminations in food (Polycyclic aromatic hydrocarbons) 117
Table 6.4. Sensitivity and linearity parameters of the designed LC-LC-GC-MS method
Compound Average response factor (n=10)a
LOD [µg/kg]b LOQ [µg/kg]c
7H-Benzo[c]fluorene 0.37 (±1.29 %) 0.02 0.05
Benz[a]anthracene 0.37 (±1.89 %) 0.02 0.06
Cyclopenta[c,d]pyrene 0.37 (±2.02 %) 0.02 0.06
Chrysene 0.35 (±1.31 %) 0.02 0.05
5-Methylchrysene 0.23 (±1.55 %) 0.02 0.05
Benzo[b]fluoranthene 0.26 (±2.26 %) 0.02 0.06
Benzo[k]fluoranthene 0.22 (±3.03 %) 0.02 0.07
Benzo[j]fluoranthene 0.24 (±5.60 %) 0.02 0.07
Benzo[a]pyrene 0.22 (±3.24 %) 0.02 0.06
Indeno[1,2,3-cd]pyrene 0.25 (±3.78 %) 0.02 0.06
Dibenz[a,h]anthracene 0.30 (±2.55 %) 0.02 0.07
Benzo[g,h,i]perylene 0.32 (±4.31 %) 0.02 0.06
Dibenzo[a,l]pyrene 0.19 (±2.37 %) 0.01 0.04
Dibenzo[a,e]pyrene 0.18 (±1.47 %) 0.02 0.05
Dibenzo[a,i]pyrene 0.14 (±2.30 %) 0.02 0.05
Dibenzo[a,h]pyrene 0.07 (±4.44 %) 0.01 0.03
a: 푅푓 = ( )( )∗
b: 3.3 ∗ ; c: 10 ∗
Linearity of the calibration curves for all PAHs could be assumed due to the obtained
coefficients of determination (R² > 0.998) and average response factors with relative standard
deviations below 6 %. Extension of the calibration range in routine measurements up to 5 µg/kg
showed no indications of linearity issues. LODs and LOQs varied from 0.01 to 0.02 µg/kg and
from 0.03 to 0.07 µg/kg, respectively, fully complying with the requirements of EU Regulation
836/2011. In fact, they were tenfold below the requirements and readily compatible with even
tighter and future PAH regulations.
118 6. Unwanted contaminations in food (Polycyclic aromatic hydrocarbons)
6.3.7 Recovery
Olive oils without blank values below the LOQ were not available. Instead, recoveries were
determined by spiking a blank (sunflower oil) with PAHs at three different concentration levels
(0.1, 0.5, 1.0 µg/kg). Furthermore, a margarine sample was spiked at 0.1 µg/kg. Since this
sample was also not free of PAHs (> LOQ), blank values had to be subtracted from the
quantified results. In all cases, recoveries for all EU priority PAHs ranged from 82 to 111 %.
Due to the good sample cleanup properties verified by TOF-MS and the high recoveries for
several matrices, the evaluation of matrix-matched calibrations was not pursued.
6.3.8 Precision and trueness
Precision was determined by multiple injections of extra virgin olive oil. Repeatability was
calculated from six consecutive injections of six independently diluted olive oils.
Reproducibility is based on the quantitation results of triplicate measurements on three
successive days. Additionally, results measured on the Master TOF-MS were included. A
FAPAS quality control olive oil was analyzed in triplicate to get an impression about the
trueness of the LC-LC-GC-MS method.
Relative standard deviations of repeatability and reproducibility ranged from 1.9 to 8.1 % and
2.6 to 9.3 %, respectively. According to Thompson, the acceptable relative standard deviations
below 120 µg/kg under repeatability and reproducibility conditions are fixed to 14.7 and 22 % 10. All obtained results fully complied with these limits. Furthermore, regarding the QC sample,
all PAHs were quantified within the indicated confidence intervals. According to the material
data sheet, confidence intervals were calculated from the statistical evaluation of a proficiency
trial. Intervals were based on a z-score range of ±2. All important validation data are
summarized in Table 6.5.
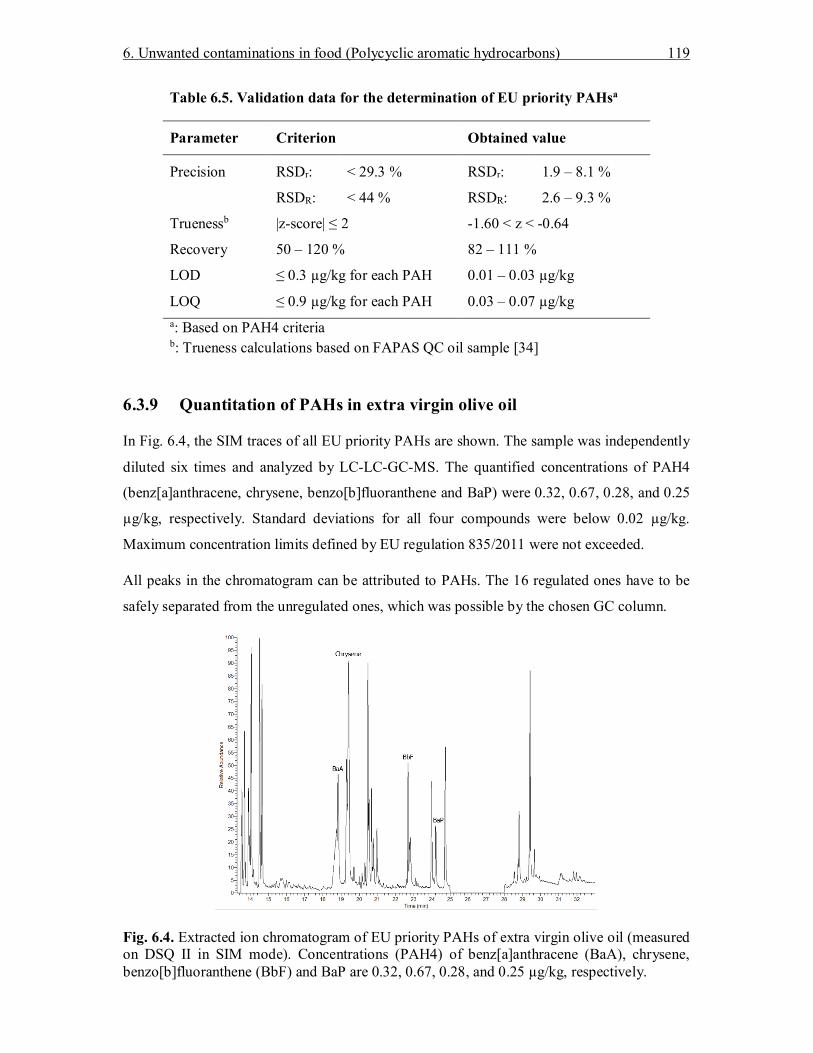
6. Unwanted contaminations in food (Polycyclic aromatic hydrocarbons) 119
Table 6.5. Validation data for the determination of EU priority PAHsa
Parameter Criterion Obtained value
Precision RSDr:
RSDR:
< 29.3 %
< 44 %
RSDr:
RSDR:
1.9 – 8.1 %
2.6 – 9.3 %
Truenessb |z-score| ≤ 2 -1.60 < z < -0.64
Recovery 50 – 120 % 82 – 111 %
LOD ≤ 0.3 µg/kg for each PAH 0.01 – 0.03 µg/kg
LOQ ≤ 0.9 µg/kg for each PAH 0.03 – 0.07 µg/kg a: Based on PAH4 criteria b: Trueness calculations based on FAPAS QC oil sample [34]
6.3.9 Quantitation of PAHs in extra virgin olive oil
In Fig. 6.4, the SIM traces of all EU priority PAHs are shown. The sample was independently
diluted six times and analyzed by LC-LC-GC-MS. The quantified concentrations of PAH4
(benz[a]anthracene, chrysene, benzo[b]fluoranthene and BaP) were 0.32, 0.67, 0.28, and 0.25
µg/kg, respectively. Standard deviations for all four compounds were below 0.02 µg/kg.
Maximum concentration limits defined by EU regulation 835/2011 were not exceeded.
All peaks in the chromatogram can be attributed to PAHs. The 16 regulated ones have to be
safely separated from the unregulated ones, which was possible by the chosen GC column.
Fig. 6.4. Extracted ion chromatogram of EU priority PAHs of extra virgin olive oil (measured on DSQ II in SIM mode). Concentrations (PAH4) of benz[a]anthracene (BaA), chrysene, benzo[b]fluoranthene (BbF) and BaP are 0.32, 0.67, 0.28, and 0.25 µg/kg, respectively.

120 6. Unwanted contaminations in food (Polycyclic aromatic hydrocarbons)
6.3.10 Sample throughput considerations
After homogenization, the generic sample preparation was possible in approximately 20 min.
The total method runtime including GC cool-down time was 52 min. The HPLC part of the
method was finished after 40 min. Interlacing of HPLC and GC parts allowed a subsequent
sample to be injected immediately.
6.4 Conclusion
Two-dimensional heart-cut LC-LC-GC-MS for the detection of PAHs in foodstuff was
employed to conquer the inadequacy of a silica-based LC-GC-MS method to deal with matrices
containing high amounts of polyunsaturates such as olive oil. Coupling of silica and π-electron-
acceptor-modified silica was found to be the best combination. Polyunsaturates could be
removed to a high degree. Screening of several fatty and nonfatty foodstuffs with TOF-MS
detection did not show significant amounts of residual matrix compounds down to the low
picogram range. This is the first report of a fully automated LC-GC based heart-cut method
able to handle various complex foodstuffs with minimal manual work.
The obtained validation data fully complied with EU Regulation 836/2011. Measurement of a
QC sample underlined the trueness of the method. Therefore, the designed method can be used
for detection of priority EU PAHs in foodstuff without known limitations. Combined with an
easy and quick generic sample preparation, the method’s benefits are the very high cleanup
potential and sample throughput.
The suitability of the method for lighter PAHs will be subject of further investigations. EPA
(Environmental Protection Agency) PAHs include two ring and three ring PAHs and are
commonly analyzed in the environmental and consumer product sectors. Biomonitoring of
complex organisms could be a second field of application that would profit from the advantages
of the presented method.

6. Unwanted contaminations in food (Polycyclic aromatic hydrocarbons) 121
6.5 References
[1] Scientific Committee on Food, Opinion of the Scientific Committee on Food on the Risks
to Human Health of Polycyclic Aromatic Hydrocarbons in Food. 4 December 2002.
European Commission (EC), Brussels, 2002.
[2] Xue, W.; Warshawsky, D. Toxicol. Appl. Pharmacol. 2005, 206, 73–93.
[3] Lee, M. L.; Novotny, M. V.; Bartle, K. D. Analytical Chemistry of Polycyclic Aromatic
Hydrocarbons; Academic Press: New York, 1981.
[4] Nagao, Y. Prog. Org. Coat. 1997, 31, 43–49.
[5] Wenzl, T.; Simon, R.; Kleiner, J.; Anklam, E. Trends Anal. Chem. 2006, 25, 716–725.
[6] IARC, Monographs on the Evaluation of Carcinogenic Risks to Humans, Overall
Evaluations of Carcinogenicity: An Updating of IARC Monographs; International
Agency for Research on Cancer, World Health Organization: Lyon, 1987 Vol. 1 to 42,
Supplement 7.
[7] European Food Safety Authority (EFSA). EFSA J. 2008, 724, 1–114.
[8] The European Commission. Off. J. Eur. Unions 2011, 215, 4–8.
[9] The European Commission. Off. J. Eur. Unions 2011, 215, 9–16.
[10] Thompson, M. Analyst 2000, 125, 385–386.
[11] Purcaro, G.; Moret, S.; Conte, L. S. J. Sep. Sci. 2008, 31, 3936–3944.
[12] Hollosi, L.; Wenzl, T. J. Chromatogr. A 2011, 1218, 23–31.
[13] Food analysis – Determination of benzo[a]pyrene, benzo[a]anthracene, chrysene and
benzo[b]fluoranthene in foodstuffs by high performance liquid chromatography with
fluorescence detection (HPLD-FD) (CEN/TS 16621:2014); CEN: Brussels, 2014.
[14] Cai, S. S.; Syage, J. A.; Hanold, K. A.; Balogh, M. P. Anal. Chem. 2009, 81, 2123–2128.
[15] Mol, H. G. J.; Plaza-Bolaños, P.;, Zomer, P.; de Rijk, T. C.; Stolker, A. A. M.; Mulder,
P. P. J. Anal. Chem. 2008, 80, 9450.
[16] Plaza-Bolaños, P.; Frenich, A. G.; Martínez Vidal, J. L. J. Chromatogr. A. 2010, 1217,
6303–6326.
[17] Purcaro, G.; Moret, S.; Conte, L. J. Chromatogr. A 2012, 1255, 100–111.
[18] Animal and Vegetable Fats and Oils -- Determination of Polycyclic Aromatic
Hydrocarbons by on-line Donor Acceptor Complex Chromatography and HPLC with
Fluorescence Detection (ISO/AWI 22959); ISO: Geneva, Switzerland, 2004.
[19] Ziegenhals, K.; Speer, K.; Jira, W. J. Verbr. Lebensm. 2009, 4, 128–135.
[20] Jira, W. Eur. Food Res. Technol. 2004, 218, 208–212.
[21] Windal, I.; Boxus, L.; Hanot, V. J. Chromatogr. A 2008, 1212, 16–22.

122 6. Unwanted contaminations in food (Polycyclic aromatic hydrocarbons)
[22] Biedermann, M.; Grob, K.; Meier, W. High Resolut. Chromatogr. 1989, 12, 591–598.
[23] Biedermann, M.; Grob, K.; Mariani, C. Fat Sci. Technol. 1993, 95, 127–133.
[24] Biedermann, M.; Bongartz, A.; Mariani, C.; Grob, K. Eur. Food Res. Technol. 2008,
228, 65–74.
[25] Grob, K.; Stoll, J.-M. J. High Resolut. Chromatogr. 1986, 9, 518–523.
[26] Pacciarelli, B.; Müller, E.; Schneider, R.; Grob, K.; Steiner, W.; Fröhlich, D. J. High
Resolut. Chromatogr. Chromatogr. Commun. 1988, 11, 135–139.
[27] Grob, K.; Artho, A.; Mariani, C. Fat Sci. Technol. 1992, 94, 394–400.
[28] Grob, K. J. Chromatogr. 1992, 626, 25–32.
[29] Purcaro, G.; Moret, S.; Conte L. J. Chromatogr. A 2012, 1255, 100–111.
[30] Hyötyläinen, T.; Riekkola, M.-L. J. Chromatogr. A 2003, 1000, 357–384.
[31] Grob, K.; Kaelin, I.; Artho, A. J. High Resolut. Chromatogr. 1991, 14, 373–376.
[32] Vreuls, J. J.; de Jong, G. J.; Brinkman, U. A. T. Chromatographia 1991, 31, 113–118.
[33] Biedermann, M.; Fiselier, K.; Grob, K. J. Agric. Food Chem. 2009, 57, 8711–8721.
[34] FAPAS T0656 QC: Olive Oil QC Material Data Sheet; FERA: York.
http://www.fapas.com/downloadDocument.cfm?id=2516. Accessed 1. April 2016.
[35] Biedermann, M.; Grob, K. J. Chromatogr. A 2009, 1216, 8652–8658.
[36] Weißhaar, R. Eur. J. Lipid Sci. Technol. 2002, 104, 282–285.
[37] Dugay, A.; Herrenknecht, C.; Czok, M.; Guyon, F.; Pages, N. J. Chromatogr. A 2002,
958, 1–7.
[38] O’Keefe, P. W.; Miller, J.; Smith, R.; Connor, S.; Clayton, W.; Storm, R. J. Chromatogr.
A 1997, 771, 169–179.
[39] Nodek, L. J. Chromatogr. 1986, 373, 61–80.
[40] Félix, G.; Bertrand, C.; Van Gastel, F. Chromatographia 1985, 20, 155–160.
[41] Holstein, W.; Hemetsberger, H. Chromatographia 1982, 15, 251–258.
[42] Lorenzini, R.; Fiselier, K.; Biedermann, M.; Barbanera, M.; Braschi, I.; Grob, K. Food
Addit. Contam. 2010, 27, 1765–1774.
[43] Hvolby, A. J. Am. Oil Chem. Soc. 1971, 48, 503–509.
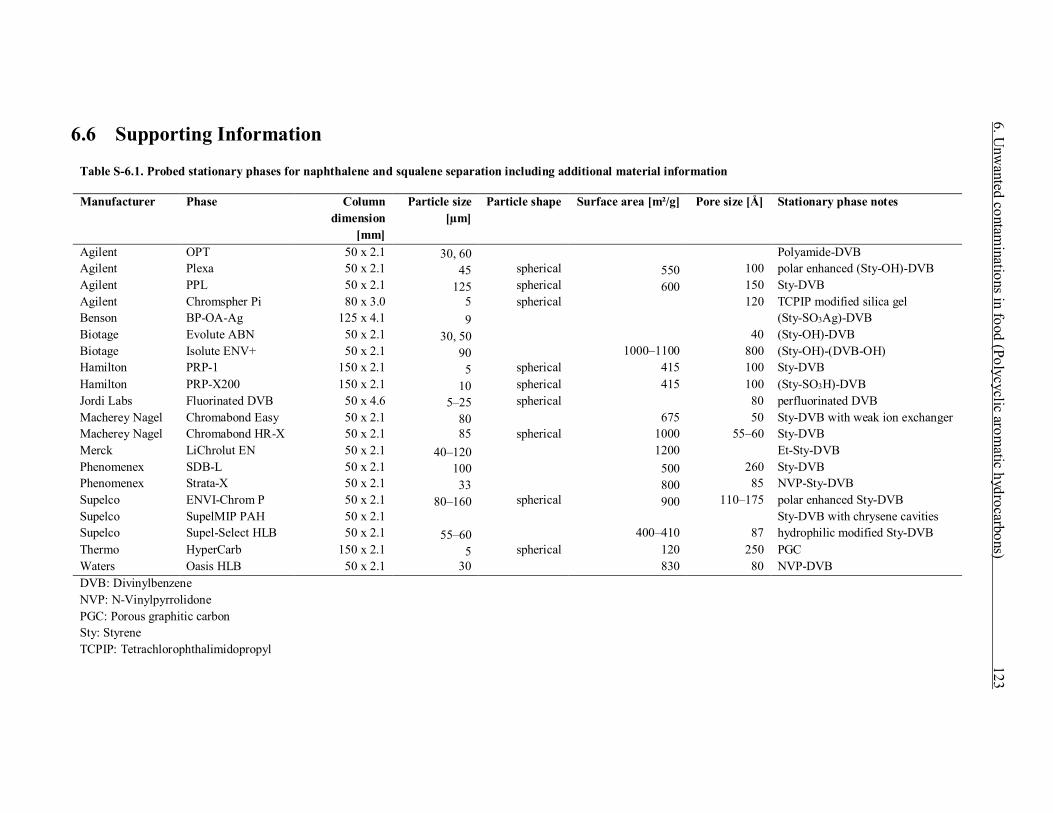
6.6 Supporting Information
Table S-6.1. Probed stationary phases for naphthalene and squalene separation including additional material information
Manufacturer Phase Column dimension
[mm]
Particle size [µm]
Particle shape Surface area [m²/g] Pore size [Å] Stationary phase notes
Agilent OPT 50 x 2.1 30, 60 Polyamide-DVB Agilent Plexa 50 x 2.1 45 spherical 550 100 polar enhanced (Sty-OH)-DVB Agilent PPL 50 x 2.1 125 spherical 600 150 Sty-DVB Agilent Chromspher Pi 80 x 3.0 5 spherical 120 TCPIP modified silica gel Benson BP-OA-Ag 125 x 4.1 9 (Sty-SO3Ag)-DVB Biotage Evolute ABN 50 x 2.1 30, 50 40 (Sty-OH)-DVB Biotage Isolute ENV+ 50 x 2.1 90 1000–1100 800 (Sty-OH)-(DVB-OH) Hamilton PRP-1 150 x 2.1 5 spherical 415 100 Sty-DVB Hamilton PRP-X200 150 x 2.1 10 spherical 415 100 (Sty-SO3H)-DVB Jordi Labs Fluorinated DVB 50 x 4.6 5–25 spherical 80 perfluorinated DVB Macherey Nagel Chromabond Easy 50 x 2.1 80 675 50 Sty-DVB with weak ion exchanger Macherey Nagel Chromabond HR-X 50 x 2.1 85 spherical 1000 55–60 Sty-DVB Merck LiChrolut EN 50 x 2.1 40–120 1200 Et-Sty-DVB Phenomenex SDB-L 50 x 2.1 100 500 260 Sty-DVB Phenomenex Strata-X 50 x 2.1 33 800 85 NVP-Sty-DVB Supelco ENVI-Chrom P 50 x 2.1 80–160 spherical 900 110–175 polar enhanced Sty-DVB Supelco SupelMIP PAH 50 x 2.1 Sty-DVB with chrysene cavities Supelco Supel-Select HLB 50 x 2.1 55–60 400–410 87 hydrophilic modified Sty-DVB Thermo HyperCarb 150 x 2.1 5 spherical 120 250 PGC Waters Oasis HLB 50 x 2.1 30 830 80 NVP-DVB DVB: Divinylbenzene NVP: N-Vinylpyrrolidone PGC: Porous graphitic carbon Sty: Styrene TCPIP: Tetrachlorophthalimidopropyl
6. Unw
anted contaminations in food (Polycyclic arom
atic hydrocarbons) 123

Table S-6.2. Peak performance parameters of naphthalene and squalene on the probed stationary phases
Phase tr(Sq) [min] w05(Sq) As(Sq) tr(Na) [min] w05(Na) As(Na) tm [min] k(Sq) k(Na) α(Na/Sq) Rs(Na/Sq) OPT 0.74 0.43 0.70 1.90 0.86 1.12 0.37 1.00 4.14 4.14 1.06 Plexa 0.59 0.56 1.99 1.26 1.10 1.99 0.25 1.36 4.04 2.97 0.48 PPL 0.62 0.70 2.39 1.18 0.92 2.33 0.29 1.14 3.07 2.70 0.41 Chromspher Pi 1.96 0.52 2.47 13.32 0.92 12.61 1.32 0.48 9.09 18.75 9.31 BP-OA-Ag 3.60 0.97 8.85 4.83 1.10 5.39 1.90 0.89 1.54 1.72 0.70 Evolute ABN 0.54 0.50 1.75 1.07 1.02 2.42 0.26 1.08 3.12 2.89 0.41 Isolute ENV+ 0.90 0.90 1.69 2.47 1.60 1.44 0.29 2.10 7.52 3.57 0.74 PRP-1 1.37 0.40 3.21 2.46 0.48 5.23 1.21 0.13 1.03 7.81 1.46 PRP-X200 1.43 0.31 2.40 2.88 0.50 6.24 1.21 0.18 1.38 7.59 2.11 Fluorinated DVB 2.77 0.59 1.08 6.61 0.87 4.89 1.62 0.71 3.08 4.34 3.10 Chromabond Easy 0.52 0.82 8.06 1.78 1.76 2.18 0.26 1.00 5.85 5.85 0.58 Chromabond HR-X 0.63 0.61 1.79 1.18 0.87 1.74 0.27 1.33 3.37 2.53 0.44 LiChrolut EN 0.63 1.10 8.71 2.27 1.07 1.60 0.32 0.97 6.09 6.29 0.89 SDB-L 0.59 0.58 1.90 0.98 0.79 2.28 0.27 1.19 2.63 2.22 0.34 Strata-X 0.73 0.45 0.62 1.65 0.86 0.77 0.31 1.35 4.32 3.19 0.83 ENVI-Chrom P 0.67 0.66 1.52 1.22 0.85 1.72 0.25 1.68 3.88 2.31 0.43 SupelMIP PAH 0.50 0.76 3.93 1.27 1.54 5.08 0.20 1.50 5.35 3.57 0.40 Supel-Select HLB 0.62 0.47 1.19 1.43 1.86 1.12 0.25 1.48 4.72 3.19 0.41 HyperCarb 2.94 0.27 2.80 4.89 0.57 10.03 1.21 1.43 3.04 2.13 2.74 Oasis HLB 0.69 0.38 1.09 1.72 0.77 1.50 0.35 0.97 3.91 4.03 1.06 As: Asymmetry factor calculated at 10 % peak height w05: Peak width at half maximum k: Capacity factor α: Selectivity factor Rs: Resolution
124 6. U
nwanted contam
inations in food (Polycyclic aromatic hydrocarbons)

Table S-6.3. Quantified PAH concentrations [µg/kg] for various food matrices shown in Fig. 6.3
Compound Butter Ketchup Mayonnaise Egg yolk
Chamomile tea
Margarine Cream cheese
Filter coffee
Instant coffee
Drinking chocolate
Olive oil
Sunflower oil
7H-Benzo[c]fluorene
< TQL
< TQL
< TQL
< TQL
< TQL
< LOQ
< TQL
< TQL
< TQL
< TQL
0.11
< LOQ
Benz[a]anthracene 0.13 0.25 0.32 Cyclopenta[c,d]pyrene < LOQ < TQL 0.13 Chrysene 0.43 0.14 0.35 0.67 5-Methylchrysene
< TQL
< LOQ
< TQL
0.08 Benzo[b]fluoranthene 0.21 0.28 Benzo[k]fluoranthene 0.11 0.15 Benzo[j]fluoranthene 0.11 0.16 Benzo[a]pyrene 0.19 0.25 Indeno[1,2,3-cd]pyrene < LOQ 0.10 Dibenz[a,h]anthracene 0.17 0.15 Benzo[g,h,i]perylene 0.20 0.32 Dibenzo[a,l]pyrene 0.05 0.06 Dibenzo[a,e]pyrene 0.03 0.07 Dibenzo[a,i]pyrene < LOQ 0.11 Dibenzo[a,h]pyrene < LOQ 0.05 Each sample was measured in duplicate (n=2). TOF-LOQ (TQL) was 0.75 µg/kg for Dibenzopyrenes and 0.25 µg/kg for all other PAHs. LOQ measured with quadrupole MS was below 0.1 µg/kg for all PAHs.
6. Unw
anted contaminations in food (Polycyclic arom
atic hydrocarbons) 125

126 6. Unwanted contaminations in food (Polycyclic aromatic hydrocarbons)
Table S-6.4. Data of FAPAS QC extra virgin olive oil in comparison to measured data
Compound QC mean concentration
[µg/kg]
Measured concentration (n=3) [µg/kg]
Calculated z-score
Benz[a]anthracene 1.49 ± 0.33 1.05 ± 0.01 -1.34
Chrysene 3.31 ± 0.73 2.62 ± 0.00 -0.95
Benzo[b]fluoranthene 2.09 ± 0.46 1.68 ± 0.01 -0.90
Benzo[k]fluoranthene 1.49 ± 0.33 1.13 ± 0.01 -1.09
Benzo[j]fluoranthene 1.48 ± 0.33 0.96 ± 0.01 -1.60
Benzo[a]pyrene 2.13 ± 0.47 1.83 ± 0.01 -0.64
Indeno[1,2,3-cd]pyrene 1.39 ± 0.31 1.04 ± 0.01 -1.15
Dibenz[a,h]anthracene 0.84 ± 0.18 0.63 ± 0.02 -1.15
Benzo[g,h,i]perylene 1.87 ± 0.41 1.41 ± 0.02 -1.12
Dibenzo[a,e]pyrene 1.43 ± 0.32 1.07 ± 0.02 -1.14
Dibenzo[a,i]pyrene 0.84 ± 0.19 0.63 ± 0.02 -1.12

6. Unwanted contaminations in food (Polycyclic aromatic hydrocarbons) 127
Table S-6.5. List of measured PAHs and ISTDs with regulation types, retention times, and analyte ions
Compound Type tr [min] Quantifier ion [m/z] Qualifier ion [m/z] Naphthalene EPA ---a 128 129 Acenaphthylene EPA 6.2 152 153 Acenaphthene EPA 6.3 153 154 Fluorene EPA 6.9 166 165 Phenanthrene EPA 8.7 178 179 Anthracene EPA 8.8 178 179 Fluoranthene EPA 11.9 202 203 Pyrene EPA 12.7 202 203 7H-Benzo[c]fluorene EU 14.0 216 215 Benz[a]anthracene EPA/EU* 18.9 228 229 Cyclopenta[c,d]pyrene EU 19.2 226 227 Chrysene EPA/EU* 19.4 228 229 5-Methylchrysene EU 20.8 242 241 Benzo[b]fluoranthene EPA/EU* 22.7 252 253 Benzo[k]fluoranthene EPA/EU 22.8 252 253 Benzo[j]fluoranthene EU 22.9 252 253 Benzo[a]pyrene EPA/EU* 24.2 252 253 Indeno[1,2,3-cd]pyrene EPA/EU 28.8 276 277 Dibenz[a,h]anthracene EPA/EU 28.8 278 279 Benzo[g,h,i]perylene EPA/EU 29.4 276 277 Dibenzo[a,l]pyrene EU 31.2 302 151 Dibenzo[a,e]pyrene EU 31.8 302 151 Dibenzo[a,i]pyrene EU 32.2 302 151 Dibenzo[a,h]pyrene EU 32.4 302 151 Naphthalene-d8 ---a 136 Acenaphthylene-d8 6.1 160 Acenaphthene-d10 6.2 164 Fluorene-d10 6.8 176 Phenanthrene-d10 8.6 188 Anthracene-d10 8.7 188 Fluoranthene-d10 11.8 212 Pyrene-d10 12.6 212 Benz[a]anthracene-d12 18.7 240 Chrysene-d12 19.2 240 Benzo[b]fluoranthene-d12 22.6 264 Benzo[k]fluoranthene-d12 22.7 264 Benzo[a]pyrene-d12 24.1 264 Indeno[1,2,3-cd]pyrene-d12 28.7 288 Dibenz[a,h]anthracene-d14 28.7 292 Benzo[g,h,i]perylene-d12 29.3 288 *: PAH4 representatives a: Naphthalene and its ISTD were completely lost in the second HPLC dimension due to low retention.

128 6. Unwanted contaminations in food (Polycyclic aromatic hydrocarbons)
6.6.1 Interaction of naphthalene and squalene with various stationary
phases
In Table S-6.1, all available information of the probed stationary phase materials are
summarized. Because of commercial interests and pending patents, only few reliable
information were available.
Peak performance parameters for all materials are collected in Table S-6.2. As can be seen from
the asymmetry factors As, most materials exhibit a significant tailing for naphthalene. This is a
typical observation for a strong interaction between an analyte and the stationary phase. On few
materials, e.g., LiChrolut EN, even squalene exhibits strong interactions with the column
surface. As can be derived from the chromatographic resolution, these materials are therefore
not suited for a baseline separation of both analytes (Rs < 1.5).
All experiments were performed with 10 µL injections of 1 µg/µL standard solutions and n-
hexane as the mobile phase (300 µL/min). The amount on column was therefore 1 µg per
analyte. These conditions do not reflect the situation in a heart-cut system. In the designed
system, the injection volume from the first column was 360 µL with 35 % dichloromethane
(126 µL). Thus, far more retention of naphthalene was needed.
Even the Chromspher Pi column was not able to retain naphthalene in a heart-cut configuration.
Acenaphthylene trapping was only partially possible. Beginning with fluorene, trapping of
heavier PAHs could be observed in HPLC-UV experiments. The enrichment of lighter PAHs
would need a stationary phase exhibiting stronger π-electron acceptor properties. To our
knowledge, no (commercial) phases are available at the current time. Synthesis and
characterization of suited materials could be an interesting field of research for the future.
6.6.2 Elution behavior of PAHs and polyunsaturates on silica gel
Twenty milligrams of extra virgin olive oil in n-hexane were injected onto a 25 cm x 2.1 mm
silica column. The PAH fraction was transferred into GC-MS. A peak massively overloading
the whole system could be seen in the TIC of the TOF-MS chromatogram. The mass spectrum
clearly identified (isomerized) squalene as compound. It rendered the evaluation of the
chromatogram for PAHs virtually impossible. Because of column overloading effects,
extensive peak broadening for most compounds was observed. During the elution of squalene,

6. Unwanted contaminations in food (Polycyclic aromatic hydrocarbons) 129
the detector of the TOF-MS went into saturation prohibiting the detection of any other
compound.
Olive oil contains approximately 5 – 7000 mg/kg of squalene [1]. An injection of 20 mg of
olive oil would therefore transfer about 100 µg of squalene into the GC-MS system if it would
not be removed by HPLC beforehand. To test this assumption, HPLC-UV measurements with
pure squalene injections were performed (again approximately 100 µg on column). An overlay
of the elution profile of squalene with a PAH standard containing all EU priority PAH (10 ng
per PAH on column) is shown in Fig. S-6.1. Although HPLC-UV suggests that a separation of
squalene and EU priority PAHs seems feasible, LC-GC-TOF-MS measurements revealed that
squalene residues still could be found several minutes after the end of the PAH fraction. HPLC-
UV clearly underestimated this effect. Because of missing chromophores, squalene could not
be detected very sensitive by UV detection.
Extensive tailing of squalene was most probably related to the high amounts overloading the
HPLC column. Mass overload results in severe peak distortion and pronounced peak tailing [2].
Grob et al. observed similar effects for triglycerides tailing from size-exclusion
chromatography (SEC) columns [3]. Sticking of analytes to valve surfaces, e.g., rotors and
stators, was found by them as additional reason.

130 6. Unwanted contaminations in food (Polycyclic aromatic hydrocarbons)
Fig. S-6.1. Overlay of HPLC-UV chromatograms of squalene and a PAH standard (Column: Restek Allure Si (250 mm x 2.1 mm, 5 µm, 60 Å), Eluent: n-hexane/MTBE (98:2, v/v), wave length: 205 nm, blue trace: 100 µg squalene on column, red trace: PAH standard with 10 ng per compound)
Fig. S-6.2. Sensitivity comparison of TOF-MS and quadrupole MS in full-scan and SIM mode for PAH detection (Extracted ion chromatogram (5-Methylchrysene, m/z: 242), 40 and 80 pg on-column, TOF-MS: 5 Hz (50–500 amu), quadrupole MS: 3 Hz (120–305 amu) for full-scan, 100 ms dwell-time for SIM)
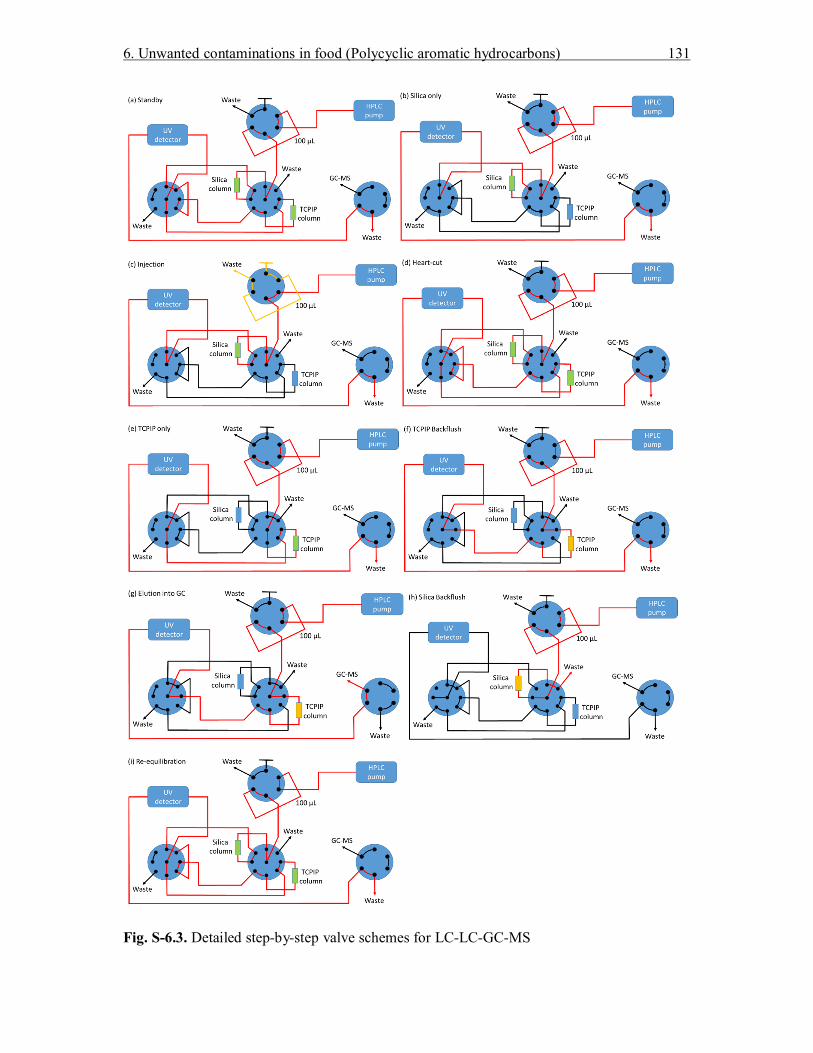
6. Unwanted contaminations in food (Polycyclic aromatic hydrocarbons) 131
Fig. S-6.3. Detailed step-by-step valve schemes for LC-LC-GC-MS

132 6. Unwanted contaminations in food (Polycyclic aromatic hydrocarbons)
Fig. S-6.4. Extracted ion chromatogram of EU priority PAHs of olive pomace oil subjected to LC-LC-GC-MS. Concentrations (PAH4) of benz[a]anthracene (BaA), chrysene, benzo[b]fluoranthene (BbF) and BaP are 1.4, 3.3, 0.2, and 0.1 µg/kg, respectively.
6.6.3 References
[1] Nenadis, N.; Tsimidou, M. J. Am. Oil Chem. Soc. 2002, 79, 257–259.
[2] Kowalczyk, J. S.; Wrobel, T. Chem. Anal. (Warsaw) 1996, 41, 139–155.
[3] Grob, K.; Kälin I. J. High Resolut. Chromatogr. 1991, 14, 451–454.

7. Unwanted contaminations in food (Mineral oil hydrocarbons) 133
7. Determination of mineral oil aromatic hydrocarbons
(MOAH) in edible oils and fats by online liquid
chromatography–gas chromatography–flame ionization
detection (LC-GC-FID) – Evaluation of automated
removal strategies for biogenic olefins
Abstract
The existence of olefins in foodstuffs, such as edible oils and fats, can be problematic for the
determination of mineral oil aromatic hydrocarbons (MOAH) by LC-GC-FID. Removal of
these interfering substances by HPLC based on polarity differences is not possible. During gas
chromatographic separation heavily overloaded peaks are observed rendering the detection of
small mineral oil contaminations almost impossible. Therefore, removal of these olefins is
necessary before subjection of the sample to LC-GC-FID. Derivatization of olefins to increase
their polarity proved to be a valuable tool in the past. In the scope of this work, bromohydrin
reaction, hydroboration, and epoxidation were examined for their potential for derivatization of
unsaturated hydrocarbons. The efficiency of the bromohydrin reaction was highly dependent
on the solvent composition while hydroboration did not show a removal of olefins under
feasible reaction conditions. Epoxidation by meta-chloroperbenzoic acid (mCPBA) delivered
the best removal of olefins. Precision and trueness of the results, however, were relying on the
exact reaction conditions and timing. Hence, an automated epoxidation technique was
developed as part of this work. Good precision (RSDr < 1.5 %) and recovery (95 – 102 %) for
MOAH were observed for sunflower and olive oils spiked with a lubricating mineral oil (24.5
mg/kg). The trueness of the method was verified by analyzing collaborative trial samples.
7.1 Introduction
Hydrocarbons of mineral oil origin account for a large proportion of the known contamination
in foodstuffs [1]. According to an EFSA (European Food Safety Agency) statement from 2012,
MOH (mineral oil hydrocarbons) contribute also to a high degree to contamination found in the
human body [2]. They can be categorized into two main groups: Saturated (MOSH) and
134 7. Unwanted contaminations in food (Mineral oil hydrocarbons)
aromatic hydrocarbons (MOAH) with alkyl chain lengths of 10 to approximately 50 carbon
numbers [3]. While the first group consists of paraffinic and naphthenic saturated hydrocarbons,
the second one is composed of alkylated (partially hydrogenated) aromatic hydrocarbons. The
MOAH content of MOH can roughly range between 0 – 35 % depending on the nature of the
mineral oil [4]. While crude oils exhibit higher MOAH contents, refined hydrogenated oils
show little to no MOAH contribution.
The presence of MOH contamination in foodstuffs can be attributed to several sources.
Packaging material made from recycled paperboard printed with mineral oil derived ink is one
important origin. Additionally, lubricants during food processing, wax coatings directly applied
to the food, environmental pollution, jute bags, etc. can be sources for contamination [5]. Found
contaminations ranged from below 1 mg/kg up to several thousands of mg/kg [6]. In 2008, in
Ukrainian sunflower oil more than 1000 mg/kg of mineral oil was found [7].
According to recent studies, acute toxicity upon oral intake of MOSH and MOAH is low [2].
Higher molecular MOSH are known to form microgranulomas in liver, spleen, lymph nodes,
and other organs [1, 2]. Because of the structural similarities to polycyclic aromatic
hydrocarbons (PAHs), some MOAH are suspected to have carcinogenic and mutagenic
potential. It is known that alkylated PAHs, e.g., 1-methylpyrene, show increased carcinogenic
potential compared to the parent compound (pyrene) [8]. In vitro assays gave indication that
MOAH from printing ink have genotoxic potential [9]. However, carcinogenicity data upon
oral intake are neither available for MOSH nor MOAH to date.
Although no legislation is established till now for upper limits of MOSH and MOAH,
minimization of both substance classes was advised by the EFSA and other national authorities
such as the German Federal Institute for risk assessment (BfR) [10]. Upper limits of 0.6 and
0.15 mg/kg for MOSH and MOAH, respectively, were proposed in the past years derived from
a temporary ADI (acceptable daily intake) of 0.01 mg/kg body weight (for a 60 kg person) and
a suspected MOAH contribution of 25 % [11]. In 2012, however, this ADI was withdrawn by
the JECFA (Joint FAO/WHO Expert Committee on Food Additives) due to insufficient
scientific data. In 2014, upper limits of 2.0 and 0.5 mg/kg for MOSH and MOAH, respectively,
found in foodstuffs packaged in recycled cardboard were proposed in the latest draft for the
22nd amendment of the German consumer goods regulation [12].
7. Unwanted contaminations in food (Mineral oil hydrocarbons) 135
7.1.1 Analytics of MOSH and MOAH
The determination of MOSH and MOAH is routinely performed by online HPLC-GC-FID
hyphenation. This method is based on a work by Biedermann et al. [13]. However, first
publications regarding this topic and HPLC-GC hyphenation can be found already in the early
1990es [14].
Shortly, HPLC on bare silica gel is used for the separation of MOH components from the food
matrix (lipids, sugars, etc.). Additionally, MOAH are separated from MOSH. The high capacity
for retention of triglycerides allows the direct injection of edible oils upon dilution [15].
Detection limits of approximately 5 mg/kg were reported for selected edible oils. For low-fat
containing matrices, such as rice or pasta, detection limits as low as 0.5 mg/kg were feasible
[13].
After the HPLC separation step, the according fraction is transferred to GC by means of a large-
volume on-column transfer technique. Typically, a retention gap method with partially
concurrent solvent evaporation in combination with a solvent vapor exit (SVE) is employed for
this purpose. It allows the quantitative recovery of volatile compounds, such as n-decane, for
the necessary transfer volumes of several hundred microliters. GC-FID is used for further
separation and detection. Because of the variety of MOH compositions, the FID is virtually the
only detector capable for quantitation. Its quasi-unity response allows quantitation without
specially adapted standards.
One remaining apparent problem with individual matrices is the co-elution of biogenic olefins
during the HPLC separation. Some monoterpenes are partially eluted in the MOSH fraction,
while polyunsaturates, such as carotenes, squalene, and sterenes, can be found in the MOAH
fraction. Because of their natural abundance, these compounds form large peaks overloading
the subsequent GC separation column pretending false-positive or overestimated quantitative
results [13]. Because of the low content found in edible oils and fats, the co-elution of biogenic
olefins in the MOSH fraction is mostly negligible and therefore out of the scope of this work.
Separation of MOAH from polyunsaturates by HPLC was found to be unsuited [13].
Alternatively, additional sample cleanup steps were developed [13, 16, 17]. Treatment of the
sample with elemental bromine was used to derivatize the biogenic unsaturated hydrocarbons.
Because of the toxicity of bromine and insufficient selectivity, epoxidation by meta-
chloroperoxybenzoic acid (mCPBA) was proposed. Increased HPLC retention of the

136 7. Unwanted contaminations in food (Mineral oil hydrocarbons)
polyunsaturates was the aim in both cases. Consequently, a removal of these compounds during
the HPLC separation became feasible.
Typical reaction conditions for mCPBA epoxidation found in the literature include the use of
dichloromethane as solvent and possible sub-ambient cooling for improved selectivity [18].
Quenching of the reaction is normally done by washing the sample with a reducing agent, such
as sodium thiosulfate, afterward. Initial addition of sodium bicarbonate or a subsequent washing
step was reported to improve the recovery of acid labile epoxides by removal of meta-
chlorobenzoic acid formed during the reaction as sodium salt [19].
The proposed reaction route by Biedermann et al. for the determination of MOAH in edible oils
and fats consisted of direct application of mCPBA in dichloromethane at sub-ambient
temperatures, i.e., ice bath cooling [13]. Thirty milligrams of mCPBA were typically
recommended for 300 mg of edible oils. Afterward, the sample was washed with a sodium
carbonate solution (10 % aq.). After a second aqueous wash and workup, the solvent was
carefully evaporated and the sample was reconstituted in n-hexane.
The authors realized that mCPBA also attacked certain MOAH constituents due to its oxidation
potential. Roughly 20 % of MOAH were reported to be lost even at sub-ambient temperatures.
Higher mCPBA amounts further increased the loss of MOAH. The presence of a food matrix
containing high amounts of unsaturated fatty acids was found to be beneficial for the recovery
of MOAH. Unsaturated fatty acids were reported to be attacked prior to MOAH compounds. In
absence of a matrix, high losses for all polycyclic aromatic compounds, such as PAHs or
thiophenes, were observed. Therefore, addition of uncontaminated edible oil as buffering agent
was recommended for samples containing only small amounts of unsaturated fatty acids [13].
However, collaborative trials showed high variances in the obtained results possibly originating
from varying reaction time, temperature, and reagent amount. Increase of method robustness is
therefore appreciated.
Consequently, other solutions for this obstacle were already explored. Mondello et al. tried to
remove the polyunsaturates by a second online LC-cleanup step [20]. After a first cleanup on
silica, the MOAH fraction was separated from the polyunsaturates on Ag+-treated silica gel. To
that end, a commercial silica HPLC column was flushed with silver nitrate. Squalene from olive
oil could be retained while MOAH with up to three aromatic rings were eluted in a transfer
volume exceeding 2 mL. MOAH with larger ring systems were retained too strongly on the
prepared column. Even further, no information were given by the authors regarding the elution

7. Unwanted contaminations in food (Mineral oil hydrocarbons) 137
behavior of sterenes or carotenes present in vegetable oils. Moreover, stability of silver-ion
impregnated HPLC columns is known to be limited [21].
For these reasons, aim of the current work was to explore possibilities for removal of
polyunsaturates from the MOAH fraction offering increased robustness. HPLC separation
techniques were not further pursued. During development of an LC-GC method for the
determination of PAHs in a variety of foodstuffs, it was found that removal of polyunsaturates
also removed large amounts of alkylated mono-aromatic hydrocarbons on donor-acceptor
HPLC columns [22].
Alternatively, derivatization of the polyunsaturates was further explored. Treatment of samples
with N-bromosuccinimide (NBS) as safe bromine supplier as well as hydroboration were
examined for their suitability for removal of polyunsaturates. Optimization and automation of
mCBPA epoxidation was also investigated as it would represent an important achievement to
increase method robustness.
7.2 Experimental
7.2.1 Samples
Extra virgin olive oil and refined sunflower oil were obtained at the local supermarket and used
for method development and validation. Additionally, edible oil samples from a collaborative
trial performed in 2015 within the CEN/TC275/WG13 work program (European Committee
for Standardization) organized by ITERG (Pessac, France) were available. They consisted of
refined olive pomace oil, extra virgin olive oil, and palm oil.
7.2.2 Chemicals and solutions
Acetonitrile, dichloromethane, ethanol, and n-hexane were from LGC Promochem (Picograde
quality, Wesel, Germany). The internal standard (ISTD) for MOH quantitation (Cat. No. 31070)
and an EPA-PAH standard (Cat. No. 31011) were supplied from Restek (Bellefonte, PA, USA).
A lubricating oil standard (K009) for spiking experiments was obtained from the Federal
Institute for Materials Research and Testing (BAM, Berlin, Germany). 9-
Borabicyclo(3.3.1)nonane (9-BBN, 0.4 M in hexanes), dibenzothiophene (DBT, 98 %) meta-
chloroperoxybenzoic acid (mCPBA, ≤77 %), N-bromosuccinimide (NBS, ReagentPlus®, 99

138 7. Unwanted contaminations in food (Mineral oil hydrocarbons)
%), and sodium thiosulfate (purum p.a., ≥98 % (RT)) were from Sigma Aldrich (Steinheim,
Germany). Sodium formate and sodium sulfate were from Fluka (Buchs, Switzerland).
Quantofix® Peroxide 25 test stripes were obtained from Macherey-Nagel (Düren, Germany).
Water was supplied from a Milli-Q water purification system (Merck, Darmstadt, Germany).
7.2.3 Sample preparation
General
Three hundred milligrams of an edible oil or fat were weighed into a 10-mL autosampler vial.
The vial was placed onto the autosampler, which added 50 µL of the ISTD solution (100 ng/µL
in n-hexane) to the sample.
Bromohydrin reaction
The autosampler added 650 µL of n-hexane, 3 mL of ethanol/water (90:10, v/v) and 700 µL of
an NBS solution (100 mg NBS in acetonitrile/water (75:25, v/v)). The vial was placed into an
agitator and was shaken at a speed of 500 rpm (revolutions per minute) for 30 min at 40 °C.
Afterward, 2.5 mL of an aqueous sodium formate solution (100 g/L) were added to destroy
excess NBS and induce phase separation. The vial was shaken at 750 rpm for 30 s. Five hundred
microliters of the n-hexanic upper phase were transferred into a 2-mL autosampler vial prefilled
with a spatula tip of sodium sulfate. The dried organic phase was subjected to LC-GC-FID.
Hydroboration
The autosampler added 550 µL of n-hexane and 100 µL of a 9-BBN solution in hexane. The
vial was placed into an agitator and was shaken at a speed of 500 rpm for 12 h at 60 °C.
Afterward, the sample was directly injected into the LC-GC-FID system.
Epoxidation
The autosampler added 650 µL of n-hexane and 500 µL of an ethanolic mCBPA solution (200
mg/mL) to the sample. The vial was placed into an agitator and was shaken at a speed of 500
rpm for 15 min at room temperature. Afterward, 500 µL of ethanol and 2 mL of an aqueous

7. Unwanted contaminations in food (Mineral oil hydrocarbons) 139
sodium thiosulfate solution (100 g/L) were added to destroy excess mCPBA and induce phase
separation. The vial was shaken at 750 rpm for 30 s. Five hundred microliters of the n-hexanic
upper phase were transferred into a 2-mL autosampler vial prefilled with a spatula tip of sodium
sulfate. The dried organic phase was subjected to LC-GC-FID.
7.2.4 LC-GC-FID method
LC-GC-FID experiments were performed on a system from Axel Semrau (Sprockhövel,
Germany). It consisted of a 1260 Infinity HPLC system (binary pump and variable wavelength
detector by Agilent Technologies, Waldbronn, Germany), Master GC with flame ionization
detector (DANI Instruments S.p.A., Cologno Monzese, Italy), and a DualPAL autosampler
(CTC Analytics AG, Zwingen, Switzerland).
Three rotatory switching valves (VICI AG International, Schenkon, Switzerland) were used to
guide the HPLC eluent from the HPLC into the GC. The GC was equipped with an on-column
interface and a solvent vapor exit. The on-column interface, the carrier gas, and solvent vapor
exit were controlled by CHRONECT LC-GC from Axel Semrau.
Typically, 50 µL (corresponding to 15 mg of edible oil or fat) of the prepared sample were
injected onto an Allure Si HPLC column (250 mm x 2.1 mm, 5 µm, 60 Å, Restek, Bellefonte,
PA, USA) without additional column temperature control. The mobile phase consisted of n-
hexane and dichloromethane. Starting at 100 % n-hexane with 300 µL/min, the mobile phase
was changed to 65 % n-hexane in 1.5 min after injection. It was held until 6.0 min. After elution
of the MOAH fraction (4.5 – 6.0 min), the column was backflushed with dichloromethane at
500 µL/min for 9 min. Afterward, the column was reconditioned with n-hexane at 500 µL/min
for 15 min.
LC-GC transfer occurred by the retention gap technique and partially concurrent solvent
evaporation (PCSE) through the Y-interface [23]. An uncoated, deactivated precolumn (MXT
Hydroguard, 10 m x 0.53 mm, Restek, Bellefonte) was followed by a steel T-piece union
connecting to the solvent vapor exit and a separation column coated with a 100 % dimethyl
polysiloxane film (MXT-1, 15 m x 0.25 mm x 0.10 µm, Restek, Bellefonte, PA, USA).
From HPLC, the MOAH fraction was transferred to the GC (resembling 450 µL) at a carrier
gas inlet pressure of 65 kPa (hydrogen) in addition to an oven temperature of 60 °C. The elution
window was verified by UV detection at 230 nm. The solvent vapor exit was opened 0.5 min
prior to elution of the MOAH fraction and was closed 0.3 min after the fraction was transferred.

140 7. Unwanted contaminations in food (Mineral oil hydrocarbons)
At this time, the carrier gas inlet pressure was set to 150 kPa and maintained throughout the
whole analysis. The oven temperature was programmed at 30 °C/min from 60 °C (4 min) to
400 °C (4 min, total run time 18.00 min). The FID base temperature was set to 350 °C. The gas
flows for air, hydrogen, and nitrogen were set to 280, 40, and 25 mL/min, respectively.
Data processing was performed with Clarity 6.2 (DataApex, Prague, Czech Republic).
Quantitation was based on 2-methylnaphthalene (2MN) used as ISTD. The MOAH content was
calculated following the equation
퐶 =퐴 ∗ 푚퐴 ∗ 푚
with C: Content [mg/kg], AMOAH: MOAH hump area without sharp peaks on top, AISTD: peak
area of ISTD, mISTD: mass of ISTD [mg], mSample: mass of test sample [kg].
For compound identification, the FID was replaced by a Bruker EVOQ GC-TQ triple
quadrupole mass spectrometer (Bruker Daltonik GmbH, Bremen, Germany). The ion source
and transfer line temperatures were set to 230 and 320 °C, respectively. Data acquisition was
performed in full-scan mode (50 – 750 amu) at a rate of 3 spectra/s with EI ionization at 70 eV.
Data processing was performed with Bruker MS Workstation 8.2.
7.3 Results and Discussion
7.3.1 Bromohydrin reaction
Opposed to elemental bromine, NBS supplies an electrophilic bromine atom in a safe manner.
In general, NBS allows most of the reactions which are also observed with elemental bromine.
Because of this, conversion of an olefin into the corresponding bromohydrin, i.e., addition of
bromine and hydroxide onto an olefinic double bond, was studied as a possible derivatization
reaction for removal of polyunsaturates.
In literature, formation of bromohydrins is most efficiently performed in acetonitrile, acetone,
or tetrahydrofuran (THF) containing min. 5–20 % of water [24, 25]. Direct application of 100
mg of NBS was tried under these conditions on olive oil (300 mg) diluted by n-hexane (700
µL). Unexpectedly, the results were not too promising. High residual amounts of squalene could
be identified in the LC-GC-FID chromatograms.

7. Unwanted contaminations in food (Mineral oil hydrocarbons) 141
Interestingly, the use of ethanol as sole solvent showed significantly better results, even though
removal of squalene was still not quantitative (as compared to epoxidation as reference). It is
assumed that the corresponding ethoxybromide is formed under these conditions [26].
Nevertheless, addition of 10 % of water further increased the removal of squalene. Higher water
contents did not improve the situation. Emerging phase separation could have been responsible
for this observation despite vigorous shaking. Best results were found at a temperature of 40 °C
and a reaction time of 30 min. In Fig. 7.1, the individual removal of squalene from the used
olive oil for selected solvent systems is shown. A comprehensive compilation of the results can
be found in the supporting information.
Fig. 7.1. Removal of squalene from olive oil by bromohydrin reaction under optimized reaction conditions for selected solvent systems (A hump area of 100 % corresponds to the squalene content prior to derivatization – Reaction conditions: 300 mg of olive oil, 50 µL of ISTD solution, 0.65 mL of n-hexane, specific solvent composition, 100 mg of NBS, 30 min, 40 °C).
The use of ethanol bore one problem. NBS oxidized ethanol in a few minutes even at room
temperature, which could be observed by the emerging orange color of the solution [27]. Thus,
stock solutions of NBS placed on the autosampler were prepared in a mixture of
acetonitrile/water (75:25, v/v). This mixture allowed dissolution of the necessary NBS amount.
The total water content was adapted accordingly. The influence on the results was negligible
compared to addition of NBS as solid.
0.04%0.13%
0.32% 0.34%
1.48%
2.78%
Residual hump area after derivatizationEpoxidation as reference
EtOH/H2O (3 mL, 87:13, v/v)
H2O (50 µL)
EtOH (3 mL)
ACN/H2O (3 mL, 73:27, v/v)
Acetone/H2O (3 mL, 93:7, v/v)

142 7. Unwanted contaminations in food (Mineral oil hydrocarbons)
An EPA-PAH standard (3 mg/kg) was directly subjected to the bromohydrin reaction to get an
estimation about its selectivity. Almost all PAHs were firstly brominated (as verified by mass
spectrometry) before they were further oxidized, even in the presence of an edible oil as possible
buffering agent. It is noteworthy that brominated PAHs were still eluted in the MOAH fraction
on HPLC. Due to the quasi-unity response of the FID, quantitation was therefore not affected.
Thus, as long as the substances were only brominated, but not further oxidized, recovery was
quantitative. Furthermore, recovery for sunflower and olive oils spiked with a lubricating oil
(MOAH content of 35 mg/kg) was virtually quantitative indicating that highly alkylated
aromatic compounds could be retrieved.
Compared to epoxidation, however, quantitation of the residual hump after optimized
bromohydrin reaction gave significantly higher amounts for the used olive oil (approximately
the threefold, compare the two columns on the left in Fig. 7.1). This indicated non-quantitative
removal of polyunsaturates rendering the reaction unsuitable as single cleanup step.
Nevertheless, as add-on procedure for persistent polyunsaturates in individual foodstuffs, such
as spices or algae, it could still be a valuable tool.
7.3.2 Hydroboration
Hydroboration is typically performed with a BH3-THF complex in an inert atmosphere, thus,
reaction conditions not suitable for automation by an autosampler. However, 9-BBN is known
to be a longtime stable alternative to BH3 allowing essentially the same reactions.
Hydroboration of olive oil with 9-BBN in n-hexane with subsequent injection into LC-GC-FID
showed no removal of squalene even after 12 h at 60 °C. Literature recommended the use of
THF as reaction solvent [28]. In most other solvents, significantly slower reaction kinetics were
observed [29]. If the reaction occurred at all, retention of the formed organoboranes did not
differ sufficiently from MOAH for a successful removal by HPLC.
Usual oxidation of organoboranes with H2O2/NaOH was avoided, since it was hardly
automatable. Besides corrosiveness, the application of NaOH on an edible oil enabled
saponification, which hindered a clear identification of the n-hexanic upper phase. Therefore,
hydroboration was abandoned as removal step for polyunsaturates from edible oils and fats.

7. Unwanted contaminations in food (Mineral oil hydrocarbons) 143
7.3.3 Optimization and automation of epoxidation
For the sake of automation, it was tried to omit the use of dichloromethane as reaction solvent.
Solvent evaporation is a time consuming step always involving the risk of losing volatile
compounds. Instead, n-hexane was tried as reaction solvent from the beginning. Solubility of
mCPBA in n-hexane was too low for a quantitative removal of polyunsaturates in edible oils
and fats. Solubility (>100 mg/100 µL) and stability of mCPBA in ethanol, however, proved to
be well suited for an automated approach. One hundred milligrams dissolved in 500 µL of
ethanol were added to the n-hexanic sample. Removal of the ethanol from n-hexane was easily
possible by addition of water. Comparison with the traditional method for freshly spiked
sunflower and olive oils (24.5 mg/kg of MOAH) showed virtually the same results.
One reason for insufficient robustness of traditional epoxidation reported in collaborative trials
could be the missing quenching step with a reducing agent. A sodium carbonate wash does not
remove excess mCPBA from the dichloromethanic phase and formed meta-chlorobenzoic acid
would be removed in the subsequent HPLC step anyhow. Even during evaporation of
dichloromethane, mCPBA could further react with the sample. Although solubility of mCPBA
in n-hexane is low (1.4 mg/100 µL), continuing reaction would still be possible during sample
storage on the LC-GC instrument.
Application of a peroxide test stripe after finished reaction of mCPBA with spiked sunflower
and olive oils did not show traces of left peracid in the solution supporting the hypothesis that
excess mCPBA is consumed by unsaturated fatty acids. In absence of a matrix, however, high
residual amounts of peracid were detected. A carbonate wash did not reduce these amounts
significantly. It is obvious that under these conditions epoxidation occurs mainly uncontrolled
and why Biedermann et al. needed to add a buffering agent for samples containing few
unsaturated fatty acids. That is precisely the reason why carbonate washing was replaced by
sodium thiosulfate washing. Thereafter, a peroxide test did not show any traces of left
peroxides.
The influence of the matrix on the recovery of MOAH was further examined. Therefore, an
EPA-PAH standard (3 mg/kg) was derivatized with and without addition of an edible oil. The
obtained results indicated that no PAHs were lost in both cases. Recoveries ranged from 92 to
104 %. Opposed to the literature, in which PAH losses were reported in absence of an edible
oil, the results provided here show that PAH oxidation can be prevented by appropriate
quenching and automated sample handling.

144 7. Unwanted contaminations in food (Mineral oil hydrocarbons)
Derivatization of a DBT standard, however, exposed substantial losses of approximately 80 %
without addition of a matrix. In presence of an edible oil, the losses were reduced to
approximately 45 %. DBT is known to be oxidized unintentionally during epoxidation and is
therefore well suited as indicator for worst-case MOAH losses [13, 30]. In literature, complete
loss of DBT was observed in absence of a matrix [13]. Thus, slightly better results were
obtained for automated epoxidation, even with significantly higher amounts of peracid (100
mg/300 mg matrix) compared to the traditional method (30 mg/300 mg matrix).
In Table 7.1, the obtained results for automated and traditional epoxidation are compared.
Table 7.1. Comparison of automated and traditional epoxidation for spiked sunflower oil
Recovery [%]
MOAHa DBTb EPA-PAHsc
Autom. Trad. Autom. Trad. Autom. Trad.d
No matrix 95 107 20 < 5 93–103 > 55
Sunflower oil 102 105 55 65 94–101 102
Virgin olive oil 101 99 56 65 92–104 95 a: BAM K009 lubricating oil MOAH spiking of 24.5 mg/kg b: Dibenzothiophene (DBT) spiking of 30 mg/kg c: EPA-PAH spiking of 3 mg/kg d: Results obtained from [13]
MOAH recovery was quantitative for traditional and automated epoxidation indicating that the
used mineral oil for spiking possibly did not contain many easily oxidable compounds, e.g.,
thiophenes. Recovery of DBT was slightly lower for spiked oil samples in the case of automated
epoxidation. This clearly reflects the higher amount of used mCPBA opposed to traditional
epoxidation. Higher amounts were chosen and validated, because for individual foodstuffs,
such as palm fatty acid distillates, higher amounts of mCPBA were needed to obtain a sufficient
cleanup.

7. Unwanted contaminations in food (Mineral oil hydrocarbons) 145
7.3.4 Validation of the automated epoxidation approach
Repeatability and recovery were determined by six individual workups and injections of spiked
olive and sunflower oils. According to Horwitz, the allowed relative standard deviation under
repeatability conditions for a spiking of 24.5 mg/kg is fixed at 6.6 % [31]. The obtained
repeatability was better than 1.5 % for both oils and complied therefore with the Horwitz
requirements. The recovery ranged from 95 to 102 % including the internal standards.
Since no certified reference materials were available for the determination of MOAH in edible
oils and fats, collaborative trial material was used instead. The three oil samples were analyzed
in duplicate on three successive days to get an impression of the reproducibility and trueness of
the automated epoxidation with subsequent LC-GC-FID analysis (see Table 7.2).
Table 7.2. Comparison of collaborative trial MOAH results and values obtained by automated epoxidation
CTa MOAH Mean value
[mg/kg]
Horwitz RSDr [%]
CT RSDr [%]b
Automated epoxidation
[mg/kg]
RSDR [%]b,c
Virgin olive oil 1.7 9.8 33 1.5 18.2
Olive pomace oil 44.7 6.0 6 70.6 2.7
Palm oil 11.4 7.4 9 13.6 5.5 a: Collaborative trial b: To eliminate the influence of the individual laboratories regarding differing chromatogram integration etc., CT repeatability was assumed as intermediate precision and therefore compared to the reproducibility of own measurements. c: Based on the quantitative results in duplicate on three successive days (n = 6)
In general, good agreement between quantitative collaborative trial mean values and automated
epoxidation results was observed. However, for the extra virgin olive oil a reproducibility
exceeding the predicted Horwitz limit was observed in own measurements. This was related to
the low quantified amount, which was hardly distinguishable from the chromatogram baseline.
As can be derived from the collaborative trial results, the participants struggled with the same
problem.
For the refined olive pomace oil significantly higher amounts were quantified in own
experiments. This was clearly related to the high-boiling mass distribution of the MOAH
contamination in this case. Contaminations exceeding elution temperatures of 350 °C were

146 7. Unwanted contaminations in food (Mineral oil hydrocarbons)
detected. The use of metal GC columns allowed GC oven temperatures of 400 °C needed for
the elution of these high boiling compounds. It is doubtful if all participants of the collaborative
trial were aware of this problem.
7.4 Conclusion
At the moment, epoxidation proved to be the method of choice for removal of polyunsaturates
from edible oils and fats. However, precise control of reaction conditions and timing is of
upmost importance for precise and valid results. Automation is therefore inevitable.
During optimization of the reaction conditions, the use of sub-ambient temperatures was not
required. Solvent evaporation and sample reconstitution was no longer necessary after
exchange of the reaction medium. Recovery of MOAH in spiked sunflower and olive oil
samples was virtually quantitative for the used lubricating mineral oil. Even PAHs could be
quantitatively recovered in absence of a matrix, which is most probably related to the use of an
efficient quenching step. Quantitative results for collaborative trial samples verified the
trueness of automated epoxidation. Precision complied with the Horwitz criteria for
contaminations higher than approximately 3 mg/kg making the method amenable to the analysis
of edible oils and fats in routine environments. Lowering the limit of quantitation is possible by
sample enrichment [13].
Exploration of other derivatization reactions showed that bromohydrin formation could be an
interesting tool for complex foodstuffs, for which epoxidation does not afford a reasonable
cleanup, such as spices or algae. As single cleanup step, the bromohydrin reaction showed
insufficient results and substantial losses of non-alkylated PAHs. Compared to literature, rather
unconventional reaction conditions proved to be the most successful. Additional optimization
of the reaction conditions could further improve the situation.
Another alternative, namely hydroboration, was not suited at all for removal of polyunsaturates
in edible oils under feasible reaction conditions. Anyhow, exploration of new possibilities for
removal of polyunsaturates will be pursued. The unlimited suitability of the developed methods
also for the removal of olefins from the MOSH fraction, namely monoterpenes etc., will be
another important aspect of future research.

7. Unwanted contaminations in food (Mineral oil hydrocarbons) 147
7.5 Acknowledgements
Florence Lacoste and Loïc Leitner from ITERG are thanked for the supply of samples.
7.6 References
[1] Barp, L.; Kornauth, C.; Wuerger, T.; Rudas, M.; Biedermann, M.; Reiner, A.; Concin,
N.; Grob, K. Food Chem. Toxicol. 2014, 72, 312–321.
[2] European Food Safety Authority, Scientific opinion on mineral oil hydrocarbons in
food. EFSA J. 2012, 10(6), 2704.
[3] Neukom, H. P.; Grob, K.; Biedermann, M.; Noti, A. Atmos. Environ. 2002, 36, 4839–
4847.
[4] Biedermann, M.; Grob, K. J. Chromatogr. A 2012, 1255, 76–99.
[5] Biedermann, M.; Grob, K. J. Chromatogr. A 2015, 1375, 136–153.
[6] Moret, S.; Barp, L.; Purcaro, G.; Conte, L. S. J. Chromatogr. A 2012, 1243, 1–5.
[7] Grob, K. Eur. J. Lipid Sci. Technol. 2008, 110, 979–981.
[8] Xue, W.; Warshawsky, D. Toxicol. Appl. Pharm. 2005, 206(1), 73–93.
[9] Tarnow, P.; Hutzler, C.; Grabiger, S.; Schön, K.; Tralau, T.; Luch, A. PloS One 2016,
11(1), 1–15.
[10] German Federal Institute for risk assessment (BfR), Stellungnahme 2015, 14, 1–19.
[11] Joint FAO/WHO Expert Committee on Food Additives (JECFA), Expert
Committee on Food Additives, 59th report, p. 11, WHO Technical Report Series
913, 2002, http://apps.who.int/iris/bitstream/10665/42601/1/WHO_TRS_913.pdf.
Accessed 1. April 2016.
[12] Federal Ministry of Food and Agriculture, Entwurf einer Zweiundzwanzigsten
Verordnung zur Änderung der Bedarfsgegenständeverordnung (BedGgstV) 24.7.2014
http://www.bmel.de/SharedDocs/Downloads/Service/Rechtsgrundlagen/Entwuerfe/Ent
wurf22VerordnungBedarfsgegnstaende.pdf?__blob=publicationFile. Accessed 1. April
2016.
[13] Biedermann, M.; Fiselier, K.; Grob, K. J. Agric. Food Chem. 2009, 57, 8711–8721.
[14] Grob, K.; Biedermann, M.; Artho, A.; Egli, J. Zeitschrift für Lebensmitteluntersuchung
und Forschung 1991, 193(3), 213–219.
[15] Grob, K.; Kaelin, I.; Artho, A. J. High Resolut. Chromatogr. 1991, 14, 373–376.

148 7. Unwanted contaminations in food (Mineral oil hydrocarbons)
[16] Wagner, C.; Neukom, H. P.; Galetti, V.; Grob, K. Mitteilungen aus
Lebensmitteluntersuchung und Hygiene 2001, 92(3), 231–249.
[17] Mariani, C. Stazione Sperimentale per le Industrie degli Oli e Grassi 2009 (private
communication mentioned in [13]).
[18] Bach, R. D.; Canepa, C.; Winter, J. E.; Blanchette, P. E. J. Org. Chem. 1997, 62(15),
5191–5197.
[19] Fringuelli, F.; Pizzo, F.; Germani, R.; Savelli, G. Org. Prep. Proc. Int. 1989, 21(6), 757–
761.
[20] Zoccali, M.; Barp, L.; Beccaria, M.; Sciarrone, D.; Purcaro, G.; Mondello, L. J. Sep.
Sci. 2015, 39(3), 623–631.
[21] Ulberth, F.; Achs, E. J Chromatogr. A 1990, 504, 202–206.
[22] Nestola, M.; Friedrich, R.; Bluhme, P.; Schmidt, T. C. Anal. Chem. 2015, 87(12), 6195–
6203.
[23] Biedermann, M.; Grob, K. J. Chromatogr. A 2009, 1216, 8652–8658.
[24] Andersh, B.; Kilby, K. N.; Turnis, M. E.; Murphy, D. L. J. Chem. Educ. 2008, 85(1),
102–103.
[25] Phukan, P.; Chakraborty, P.; Kataki, D. J. Org. Chem. 2006, 71(20), 7533–7537.
[26] Talluri, S. K.; Sudalai, A. Org. Lett. 2005, 7(5), 855–857.
[27] Kruse Jr, P. F.; Grist, K. L.; McCoy, T. A. Anal. Chem. 1954, 26(8), 1319–1322.
[28] Knights, E. F.; Brown, H. C. J. Am. Chem. Soc. 1968, 90(19), 5281–5283.
[29] Dhillon, R. S. Hydroboration and Organic Synthesis, 1st ed.; Springer-Verlag Berlin
Heidelberg: Heidelberg, 2007.
[30] McIntosh, J. M.; Sieler, R. A. Can. J. Chem. 1978, 56(2), 226–231.
[31] Horwitz, W.; Albert, R. J. AOAC Int. 2006, 89, 1095–1109.

7. Unwanted contaminations in food (Mineral oil hydrocarbons) 149
7.7 Supporting Information
Fig. S-7.1. Residual hump area after reaction in dependence of the used NBS amount (Reaction conditions: 300 mg of olive oil, 50 µL of ISTD solution, 0.65 mL of n-hexane, 3 mL of EtOH/H2O (87:13, v/v), 30 min, 40 °C)
Fig. S-7.2. Residual hump area after reaction in dependence of the water content in the solvent (Reaction conditions: 300 mg of olive oil, 50 µL of ISTD solution, 0.65 mL of n-hexane, 3 mL of EtOH/H2O (75-x:x, v/v), 100 mg of NBS, 30 min, 40 °C)
0.0%
0.1%
0.2%
0.3%
0.4%
0.5%
0.6%
0.7%
0.8%
0.9%
1.0%
0 20 40 60 80 100 120 140 160 180 200
NBS amount [mg]
0.00%
0.05%
0.10%
0.15%
0.20%
0.25%
0.30%
0.35%
0.40%
0% 2% 4% 6% 8% 10% 12% 14% 16% 18% 20%
Water content

150 7. Unwanted contaminations in food (Mineral oil hydrocarbons)

8. General Conclusions and Outlook 151
8. General Conclusions and Outlook
The here presented thesis dealt with the development and validation of analytical methods for
the determination of various compound classes in a broad range of foodstuffs by use of LC-GC
hyphenation. The connection of both chromatographic techniques combined into one analytical
system offered apparent advantages for routine environments, in which robustness and high
sample throughput are necessary prerequisites. HPLC opens very efficient cleanups of complex
food matrices, such as edible oils, coffees, or teas, while capillary GC with its selective
detectors (FID, MS) is an established cornerstone for robust and sensitive quantitation in routine
laboratories.
The individual chapters of this work approached analytical methods in the context of
“Unwanted contaminations in food (PAHs, MOHs)”, “Quality assurance of edible oils and fats
(sterols, stigmasta-3,5-diene)” and “Food nutrition analysis (vitamins D2/D3)”. Hence, the
chosen analyte spectrum ranged from nonpolar hydrocarbons up to slightly polar steroid
derivatives. Determination of these compounds in a broad range of complex foodstuffs requires
highly efficient cleanup routines, which are generally time-consuming and error-prone. LC-GC
hyphenation is a logical step as it enables automated sample cleanup with minimal manual work
and, consequently, an increase in sample throughput.
Although this type of technique is known since approximately 30 years, it has been hardly used
beyond the scientific community. Technical difficulties were reported to affect the instrument
robustness. Because of this, initial work in the context of this thesis involved the validation of
a method for the detection of high-temperature refining of extra virgin olive oils. Opposed to
the usual time-consuming column chromatography, LC-GC hyphenation allowed direct
injection of a sample upon dilution. More important than this, validation showed that high
precision, sensitivity, and robustness were achieved by use of a modern hard- and software
solution.
In the following course, it was realized that a solid workflow involving LC-GC hyphenation
frequently requires adaption to other sample preparation techniques. It is often the case that
samples have to be prepared in one or the other way prior to injection. Automation of these
steps by autosamplers and online coupling with LC-GC hyphenation was therefore evaluated.
The determination and quantitation of the sterol distribution of edible oils and fats was chosen
as a showcase model. Although a manual ISO method from 1999 is existent, which was recently
revised, collaborative trials regularly show insufficient precision among participating

152 8. General Conclusions and Outlook
laboratories [1]. For these reasons, the underlying ISO method was completely automated by
connecting LC-GC hyphenation with the necessary sample preparation (addition of the internal
standard, saponification, and extraction). The precision and trueness of the described automated
approach, as compared to collaborative trial results, showed that standardization of workflows
was an important aspect during method development.
The final chapters of the thesis were dedicated to the enlightening and overcoming of
deficiencies of classical LC-GC hyphenation based on an HPLC cleanup strategy relying on
polarity differences. In literature, multidimensional HPLC cleanups were rarely reported for
improved sample purification. Moreover, the few publications investigating such approaches
can merely be classified as proof of concept not yet evaluated for routine use [2, 3]. Thus, a
simple heart-cut two-dimensional HPLC cleanup suited for high-throughput application was
employed in the scope of this work. An HPLC cleanup based on polarity and aromaticity
differences able to efficiently extract PAHs allowed their analysis in a wide range of foodstuffs.
For MOAH analytics, another approach was pursuit. Because chromatographic removal of
matrix constituents proved to be hardly feasible, derivatization of the interfering matrix
compounds was chosen. Sample derivatization was previously reported in literature [4].
However, precisely automated conditions for these reactions were found to be essential to allow
high analyte recovery with appropriate removal of the chromatographic interference.
The key findings in this work confirmed the inherent relationship between LC-GC hyphenation
and other analytical tools. The choice of the latter was vital for the success of the here developed
analysis methods. The validation parts of all five methods in this work proved that extensive
automation (sample preparation, sample cleanup, separation, and detection) was of upmost
importance to provide high accuracy (precision and trueness). Moreover, high robustness and
sample throughput were achievable by elimination of manual work. Accordingly, these
methods are already partially in use in routine environments [5]. Just recently, a big German
discounter requested the MOH analysis of all own-brand products by online HPLC-GC-FID
[6].

8. General Conclusions and Outlook 153
Subsequent work in this field of research should involve the expansion of LC-GC hyphenation
for new analyte groups previously not considered. Extension of the application pool and steady
collection of validation data facilitates the chain of reasoning for necessary standardization
work of national authorities and responsible working groups. Even though the analytical
performance is evident, widespread distribution of such methods in routine environments is
only possible by standardization.
From the analytical point of view, HPLC cleanup modes suited for LC-GC hyphenation should
be further investigated. As was shown for PAH analysis, polarity differences between the
analytes and matrix constituents are not always existent. Specialized separation modes, e.g.,
donor-acceptor chromatography, SEC, or molecular-shape recognition, could solve this
obstacle [7, 8]. Alternatively, removal of matrix compounds by specialized derivatization as
shown for MOAH contamination could be of analytical value.
The online coupling of multiple HPLC cleanup stages is surely another interesting research
issue. As was also shown for PAH analysis, stacking of multiple cleanup stages drastically
increased the sample purity before subjection to the gas chromatographic separation dimension.
The two-dimensional heart-cut HPLC cleanup based on polarity and aromaticity differences
was only possible because of the compatibility of the necessary LC mobile phases and transfer
volumes. This is by no means a matter of fact.
Consequently, a robust online solvent exchange between multiple HPLC cleanup stages without
loss of the analytes of interest is of vital importance. As was previously shown in literature, the
hyphenation of SEC with normal-phase LC-GC (SEC-LC-GC) or normal-phase with reversed-
phase HPLC could be of high value for comprehensive sample cleanups [9, 10]. Especially for
applications in which the analytes of interest are not limited to a single substance class,
multistage cleanup techniques could be of interest. For instance, the determination of pesticides
in fatty foods requires multiple cleanup steps covering several chromatographic techniques
[11].
Even though the use of aqueous reversed-phase HPLC with gas chromatographic methods was
already explored in the past, its use could be interesting for specialized analysis questions [12].
Good recovery of volatile compounds and stable chromatographic conditions are only two
questions which have to be conquered.
Apart from this, online solvent exchange of aqueous eluents for other fields of research, e.g.,
heart-cut LC-LC or comprehensive two-dimensional LCxLC, could be of value. While in the

154 8. General Conclusions and Outlook
past mainly trapping techniques, such as online solid phase extraction (SPE) or temperature-
dependent trapping, were employed for incompatible eluent compositions in the second
dimension, robust online solvent exchange could represent a generic key achievement [13–15].
Previously described vacuum solvent evaporation interfaces were either designed for (few
microliters of) pure organic solvents or were exhibiting loss of volatile material [10, 16, 17].

8. General Conclusions and Outlook 155
8.1 References
[1] ISO 12228-1:1999, Animal and vegetable fats and oils -- Determination of individual
and total sterols contents -- Gas chromatographic method 1999.
[2] Moret, S.; Grob, K.; Conte, L. S. Zeitschrift für Lebensmitteluntersuchung und -
Forschung A 1997, 204(3), 241–246.
[3] Blomberg, J.; Mes, E. P.; Schoenmakers, P. J.; van der Does, J. J. B. J. High Resolut.
Chromatogr. 1997, 20(3), 125–130.
[4] Biedermann, M.; Fiselier, K.; Grob, K. J. Agric. Food Chem. 2009, 57, 8711–8721.
[5] Becker, E. Deutsche Lebensmittelrundschau 2012, 292–297.
[6] ALDI Süd, Mineralölbestandteile in Lebensmitteln, 10.2.2016
http://www.foodwatch.org/uploads/media/2016-02-10_Rundschreiben_Aldi-
Sued_01.pdf. Accessed 1. April 2016.
[7] Cheong, W. J.; Ali, F.; Choi, J. H.; Lee, J. O.; Sung, K. Y. Talanta 2013, 106, 45–59.
[8] Grob, K.; Kälin, I. J. High Resolut. Chromatogr. 1991, 14(7), 451–454.
[9] De Paoli, M.; Barbina, M. T.; Mondini, R.; Pezzoni, A.; Valentino, A.; Grob, K. J.
Chromatogr. A 1992, 626(1), 145–150.
[10] Moret, S.; Cericco, V.; Conte, L. S. J. Microcolumn Sep. 2001, 13(1), 13–18.
[11] Specht, W.; Tillkes, M. Fresenius' Zeitschrift für analytische Chemie 1980, 301(4),
300–307.
[12] Pocurull, E.; Biedermann, M.; Grob, K. J. Chromatogr. A 2000, 876(1), 135–145.
[13] Kittlaus, S.; Schimanke, J.; Kempe, G.; Speer, K. J. Chromatogr. A 2013, 1283, 98–
109.
[14] Gargano, A. F. G.; Duffin, M.; Navarro, P.; Schoenmakers, P. J. Anal. Chem. 2015, 88,
1785–1793.
[15] van de Ven, H. C.; Gargano, A. F. G.; van der Wal, S.; Schoenmakers, P. J. J.
Chromatogr. A 2016, 1427, 90–95.
[16] Tian, H.; Xu, J.; Guan, Y. J. Sep. Sci. 2008, 31(10), 1677–1685.
[17] Ding, K.; Xu, Y.; Wang, H.; Duan, C.; & Guan, Y. J. Chromatogr. A 2010, 1217(34),
5477–5483.

156 8. General Conclusions and Outlook

9. Appendix 157
9. Appendix
9.1 List of Abbreviations
2MN 2-Methylnaphthalene
ADI Acceptable daily intake
BfR Bundesinstitut für Risikobewertung
BTEX Benzene, toluene, ethylbenzene, xylenes
C18 n-Octadecyl carbon chain
DVB Divinylbenzene
ECD Electron capture detector
EFSA European Food Safety Agency
EPA EPA US Environmental Protection Agency
FAME Fatty acid methyl ester
FCSE Fully concurrent solvent evaporation
FID Flame ionization detector
GC Gas chromatography
GPC Gel permeation chromatography
HPLC High-performance liquid chromatography
IOC International Olive Council
ISTD Internal standard
JECFA Joint FAO/WHO Expert Committee on Food Additives
LC Liquid chromatography
LOD Limit of detection
LOQ Limit of quantitation
LVI Large volume injection
mCPBA meta-Chloroperbenzoic acid
MOH Mineral oil hydrocarbons
MOSH Mineral oil saturated hydrocarbons
MOAH Mineral oil aromatic hydrocarbons
MS Mass spectrometry
NARP Non-aqueous reversed-phase
NBS N-bromosuccinimide
PAH Polycyclic aromatic hydrocarbon
PCB Polychlorinated biphenyl
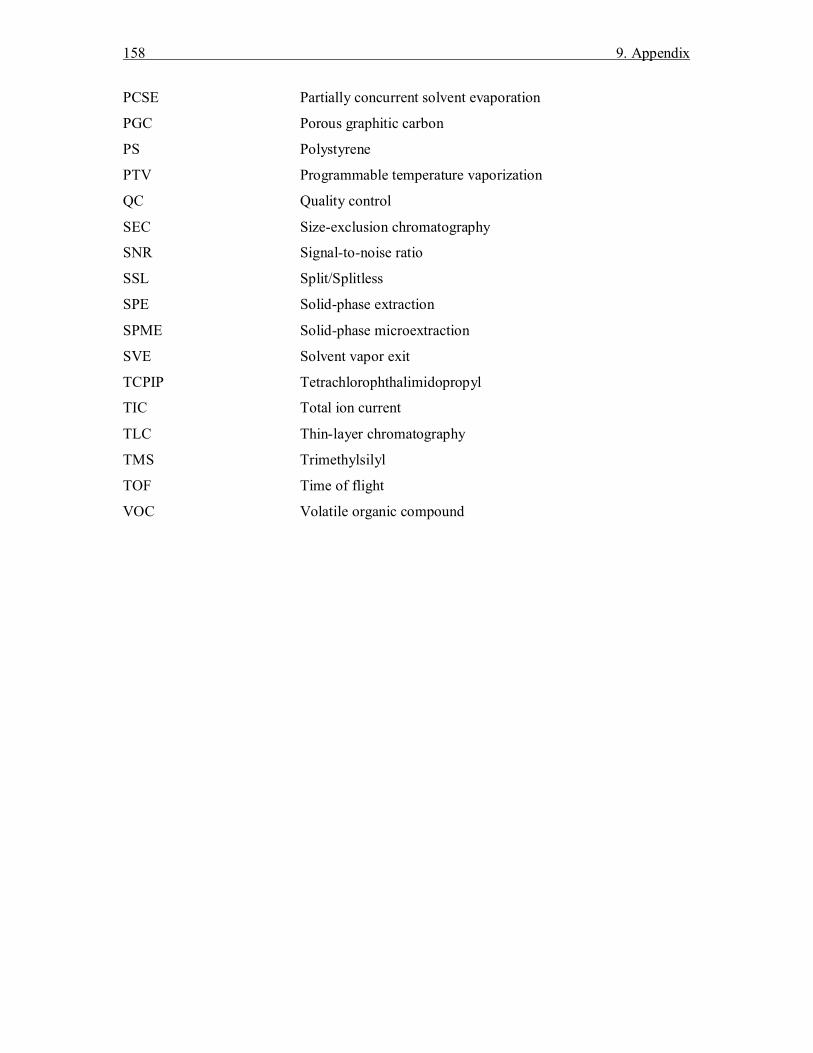
158 9. Appendix
PCSE Partially concurrent solvent evaporation
PGC Porous graphitic carbon
PS Polystyrene
PTV Programmable temperature vaporization
QC Quality control
SEC Size-exclusion chromatography
SNR Signal-to-noise ratio
SSL Split/Splitless
SPE Solid-phase extraction
SPME Solid-phase microextraction
SVE Solvent vapor exit
TCPIP Tetrachlorophthalimidopropyl
TIC Total ion current
TLC Thin-layer chromatography
TMS Trimethylsilyl
TOF Time of flight
VOC Volatile organic compound
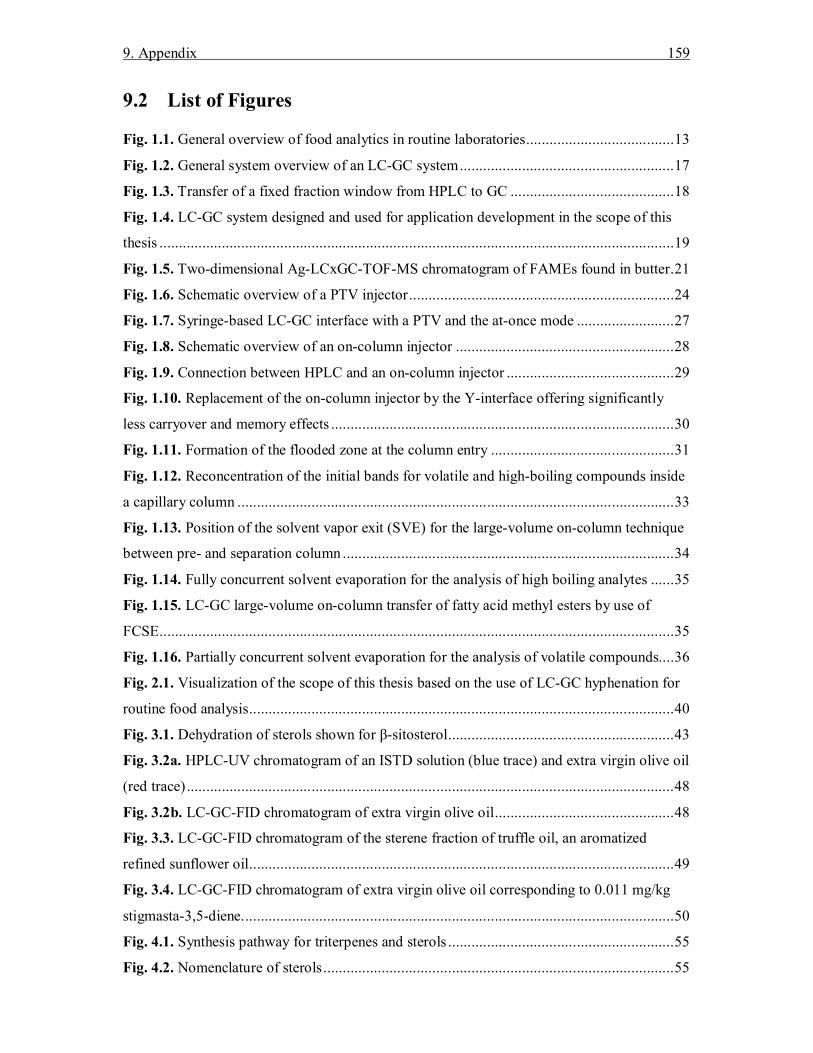
9. Appendix 159
9.2 List of Figures
Fig. 1.1. General overview of food analytics in routine laboratories ...................................... 13
Fig. 1.2. General system overview of an LC-GC system ....................................................... 17
Fig. 1.3. Transfer of a fixed fraction window from HPLC to GC .......................................... 18
Fig. 1.4. LC-GC system designed and used for application development in the scope of this
thesis .................................................................................................................................... 19
Fig. 1.5. Two-dimensional Ag-LCxGC-TOF-MS chromatogram of FAMEs found in butter . 21
Fig. 1.6. Schematic overview of a PTV injector .................................................................... 24
Fig. 1.7. Syringe-based LC-GC interface with a PTV and the at-once mode ......................... 27
Fig. 1.8. Schematic overview of an on-column injector ........................................................ 28
Fig. 1.9. Connection between HPLC and an on-column injector ........................................... 29
Fig. 1.10. Replacement of the on-column injector by the Y-interface offering significantly
less carryover and memory effects ........................................................................................ 30
Fig. 1.11. Formation of the flooded zone at the column entry ............................................... 31
Fig. 1.12. Reconcentration of the initial bands for volatile and high-boiling compounds inside
a capillary column ................................................................................................................ 33
Fig. 1.13. Position of the solvent vapor exit (SVE) for the large-volume on-column technique
between pre- and separation column ..................................................................................... 34
Fig. 1.14. Fully concurrent solvent evaporation for the analysis of high boiling analytes ...... 35
Fig. 1.15. LC-GC large-volume on-column transfer of fatty acid methyl esters by use of
FCSE .................................................................................................................................... 35
Fig. 1.16. Partially concurrent solvent evaporation for the analysis of volatile compounds.... 36
Fig. 2.1. Visualization of the scope of this thesis based on the use of LC-GC hyphenation for
routine food analysis ............................................................................................................. 40
Fig. 3.1. Dehydration of sterols shown for β-sitosterol .......................................................... 43
Fig. 3.2a. HPLC-UV chromatogram of an ISTD solution (blue trace) and extra virgin olive oil
(red trace) ............................................................................................................................. 48
Fig. 3.2b. LC-GC-FID chromatogram of extra virgin olive oil .............................................. 48
Fig. 3.3. LC-GC-FID chromatogram of the sterene fraction of truffle oil, an aromatized
refined sunflower oil ............................................................................................................. 49
Fig. 3.4. LC-GC-FID chromatogram of extra virgin olive oil corresponding to 0.011 mg/kg
stigmasta-3,5-diene. .............................................................................................................. 50
Fig. 4.1. Synthesis pathway for triterpenes and sterols .......................................................... 55
Fig. 4.2. Nomenclature of sterols .......................................................................................... 55

160 9. Appendix
Fig. 4.3. Phytosterols and stanols regulated by ISO 12228 .................................................... 56
Fig. 4.4. Flowchart of automated sample preparation for edible oils and fats ........................ 60
Fig. 4.5. LC-GC-FID chromatogram of blended sunflower-rapeseed oil obtained on a 5 %
phenyl polysiloxane stationary phase .................................................................................... 64
Fig. 4.6. Chromatogram overlay of a sunflower oil sample prepared according to ISO 12228
............................................................................................................................................. 64
Fig. 4.7. HPLC-UV chromatogram of sunflower oil showing the separation of the 4-
desmethyl sterol fraction into several sub-groups .................................................................. 65
Fig. 4.8. Mass spectrum of the unknown 4-desmethyl phytosterol in sunflower oils. ............. 66
Fig. 5.1. Thermal isomerization of vitamin D into its pyro and isopyro forms ....................... 79
Fig. 5.2. HPLC-GC-FID chromatograms of the reference instant milk powder sample and a
vitamin D2/D3 standard ......................................................................................................... 85
Fig. 5.3. HPLC-GC-TOF-MS chromatogram (top) and TOF-MS spectra of vitamin D2
(bottom left: pyro isomer; bottom right: isopyro isomer) ....................................................... 87
Fig. 5.4. HPLC-GC-TOF-MS extracted ion chromatogram of a standard containing vitamins
D2, D3, and the corresponding ISTDs .................................................................................... 88
Fig. 5.5. Flow diagram of elementary steps for HPLC-UV, HPLC-MS/MS, and HPLC-GC-
MS ....................................................................................................................................... 91
Fig. 5.6. Chromatographic comparison of HPLC-UV (top: UV-signal) and HPLC-GC-MS
(bottom: extracted ion chromatogram) for the reference instant milk powder ........................ 92
Fig. 5.7. Comparison of chromatographic conditions for HPLC-MS/MS (top: two MRM
transitions for vitamin D3 (left) and ISTD (right)) and HPLC-GC-MS (bottom: extracted ion
chromatogram for vitamin D3 and ISTD) for the sterol-enriched margarine sample. ............. 95
Fig. 6.1. Flowchart of a foodstuff sample subjected to LC-LC-GC-MS analysis ................. 106
Fig. 6.2. Valve scheme for an LC-LC-GC-MS configuration with a single binary HPLC pump
........................................................................................................................................... 113
Fig. 6.3. Overlay of LC-LC-GC-TOF-MS TIC chromatograms (50 – 500 amu) of screened
food matrix types ................................................................................................................ 116
Fig. 6.4. Extracted ion chromatogram of EU priority PAHs of extra virgin olive oil ........... 119
Fig. S-6.1. Overlay of HPLC-UV chromatograms of squalene and a PAH standard ............ 130
Fig. S-6.2. Sensitivity comparison of TOF-MS and quadrupole MS in full-scan and SIM
mode for PAH detection ..................................................................................................... 130
Fig. S-6.3. Detailed step-by-step valve schemes for LC-LC-GC-MS .................................. 131

9. Appendix 161
Fig. S-6.4. Extracted ion chromatogram of EU priority PAHs of olive pomace oil subjected to
LC-LC-GC-MS .................................................................................................................. 132
Fig. 7.1. Removal of squalene from olive oil by bromohydrin reaction under optimized
reaction conditions for selected solvent systems ................................................................. 141
Fig. S-7.1. Residual hump area after reaction in dependence of the used NBS amount ........ 149
Fig. S-7.2. Residual hump area after reaction in dependence of the water content in the
solvent ................................................................................................................................ 149
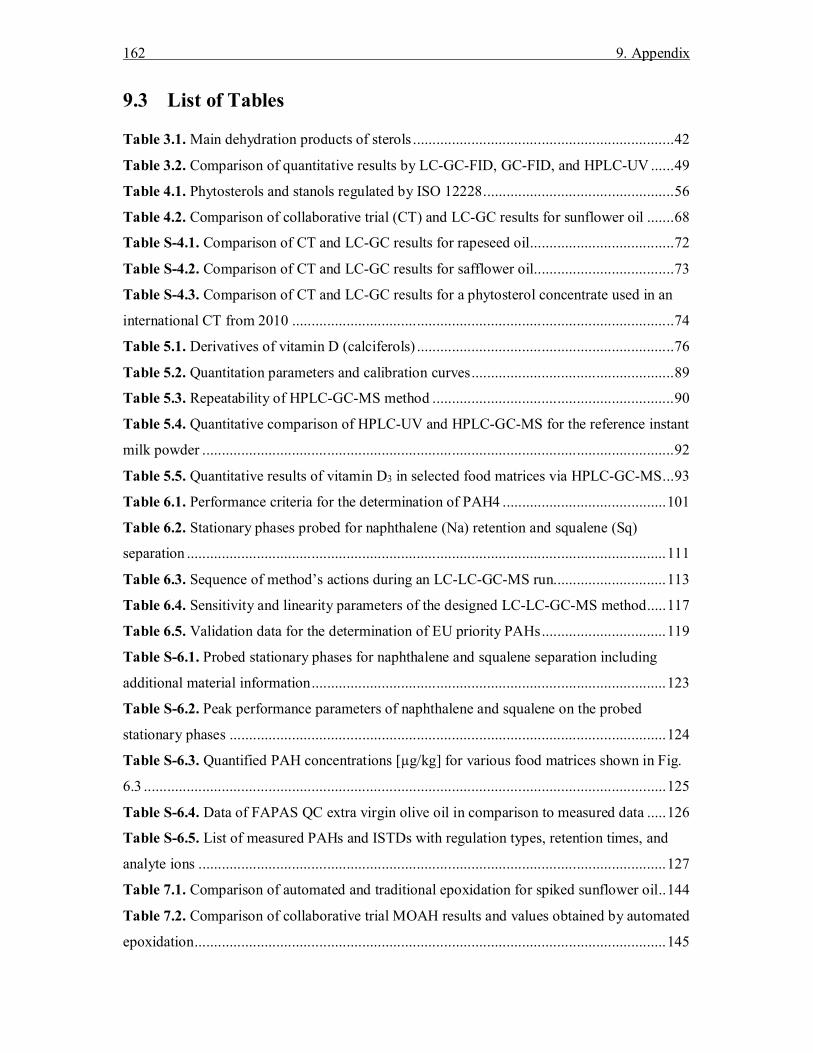
162 9. Appendix
9.3 List of Tables
Table 3.1. Main dehydration products of sterols ................................................................... 42
Table 3.2. Comparison of quantitative results by LC-GC-FID, GC-FID, and HPLC-UV ...... 49
Table 4.1. Phytosterols and stanols regulated by ISO 12228 ................................................. 56
Table 4.2. Comparison of collaborative trial (CT) and LC-GC results for sunflower oil ....... 68
Table S-4.1. Comparison of CT and LC-GC results for rapeseed oil ..................................... 72
Table S-4.2. Comparison of CT and LC-GC results for safflower oil.................................... 73
Table S-4.3. Comparison of CT and LC-GC results for a phytosterol concentrate used in an
international CT from 2010 .................................................................................................. 74
Table 5.1. Derivatives of vitamin D (calciferols) .................................................................. 76
Table 5.2. Quantitation parameters and calibration curves .................................................... 89
Table 5.3. Repeatability of HPLC-GC-MS method .............................................................. 90
Table 5.4. Quantitative comparison of HPLC-UV and HPLC-GC-MS for the reference instant
milk powder ......................................................................................................................... 92
Table 5.5. Quantitative results of vitamin D3 in selected food matrices via HPLC-GC-MS ... 93
Table 6.1. Performance criteria for the determination of PAH4 .......................................... 101
Table 6.2. Stationary phases probed for naphthalene (Na) retention and squalene (Sq)
separation ........................................................................................................................... 111
Table 6.3. Sequence of method’s actions during an LC-LC-GC-MS run............................. 113
Table 6.4. Sensitivity and linearity parameters of the designed LC-LC-GC-MS method ..... 117
Table 6.5. Validation data for the determination of EU priority PAHs ................................ 119
Table S-6.1. Probed stationary phases for naphthalene and squalene separation including
additional material information ........................................................................................... 123
Table S-6.2. Peak performance parameters of naphthalene and squalene on the probed
stationary phases ................................................................................................................ 124
Table S-6.3. Quantified PAH concentrations [µg/kg] for various food matrices shown in Fig.
6.3 ...................................................................................................................................... 125
Table S-6.4. Data of FAPAS QC extra virgin olive oil in comparison to measured data ..... 126
Table S-6.5. List of measured PAHs and ISTDs with regulation types, retention times, and
analyte ions ........................................................................................................................ 127
Table 7.1. Comparison of automated and traditional epoxidation for spiked sunflower oil .. 144
Table 7.2. Comparison of collaborative trial MOAH results and values obtained by automated
epoxidation ......................................................................................................................... 145

9. Appendix 163
9.4 List of Publications
Book chapters
1. Nestola, M.; Becker, E. In Der HPLC-Experte: Möglichkeiten und Grenzen der
modernen HPLC; Kromidas, S.; Wiley-VCH: Weinheim, 2014; pp 61–100.
Peer-reviewed publications
1. Nestola, M.; Friedrich, R.; Bluhme, P.; Schmidt, T. C. Anal. Chem. 2015, 87(12), 6195–
6203.
2. Nestola, M.; Thellmann, A. Anal. Bioanal. Chem. 2015, 407, 297–308.
3. Wittsiepe, J.; Nestola, M.; Kohne, M.; Zinn, P.; Wilhelm, M. J. Chromatogr. B 2014,
945–946, 217–224.
4. Kanthak, M,; Aniol, A.; Nestola, M.; Merz, K.; Oppel, I. M.; Dyker, G. Organometallics
2011, 30(2), 215–229.
Other publications
1. Nestola, M.; Küchler, T.; Dümmong, H.; Tablack, P. Der Lebensmittelbrief 2013.
2. Nestola, M.; Becker, E. Der Lebensmittelbrief 2012.
3. Fink, A.; Kohl, R.; Nestola, M. GIT Labor-Laborzeitschrift 2011, 55(10), 708–710.
4. Nestola, M.; Zinn, P.; Blenkers, T. GIT Labor-Laborzeitschrift 2008, 52(9), 800–802.
Posters
1. Schulz, E.; Koospal, V.; Nestola, M.; Becker, E.; Kirchhoff, E. 44.
Lebensmittelchemikertag, Karlsruhe, 2015.
2. Konetzki, J.; Becker, E.; Nestola, M.; Kirchhoff, E. 44. Lebensmittelchemikertag,
Karlsruhe, 2015.
3. Nestola, M.; Friedrich, R.; Bluhme, P.; Schmidt, T. C. HPLC 2015, Geneva, 2015.
4. Werner, P.; Nestola, M.; Kohl, R.; Tablack, P.; Voller, A.; Behnke, K.; Kuhlmann, J.;
Fischer, M. 43. Lebensmittelchemikertag, Gießen, 2014.
5. Küchler, T.; Nestola, M.; Boysen, H.; Tablack, P. Euro Fed Lipid, Montpellier, 2014.
6. Küchler, T.; Nestola, M.; Dümmong, H.; Koospal, V.; Tablack, P. Euro Fed Lipid,
Antalya, 2013.
7. Nestola, M.; Schulz, E.; Becker, E.; Kirchhoff, E.; Mantegazza, A. 42.
Lebensmittelchemikertag, Braunschweig, 2013.

164 9. Appendix
8. Nestola, M.; Tablack, P.; Becker, E.; Kirchhoff, E. ANAKON, Essen, 2013.
9. Küchler, T.; Dümmong, H.; Nestola, M., Tablack, P. Euro Fed Lipid, Kraków, 2012.
10. Nestola, M.; Tablack, P.; Becker, E.; Kirchhoff, E. Euro Fed Lipid, Kraków, 2012.
11. Nestola, M.; Tablack, P.; Becker, E.; Kirchhoff, E. 41. Lebensmittelchemikertag,
Münster, 2012.
12. Nestola, M.; Tablack, P.; Schulz, C.; Fritz, H.; Meyer. A. RAFA, Prague, 2011.
13. Schulz, C.; Meyer, A.; Fritz, H.; Nestola, M.; Tablack, P. 40. Lebensmittelchemikertag,
Halle, 2011.
Oral presentations
1. Nestola, M.; Friedrich, R.; Bluhme, P.; Schmidt, T. C. 26. Doktorandenseminar,
Hohenroda, 2016.
2. Nestola, M.; Friedrich, R.; Bluhme, P.; Schmidt, T. C. 44. Lebensmittelchemikertag,
Karlsruhe, 2015.
3. Nestola, M.; Friedrich, R.; Bluhme, P.; Schmidt, T. C. HPLC 2015, Geneva, 2015.
4. Nestola, M.; Friedrich, R.; Bluhme, P.; Schmidt, T. C. 25. Doktorandenseminar,
Hohenroda, 2015.
5. Nestola, M. NOVIA Anwenderforum „Gaschromatographie“, Bad Soden, 2013.
6. Nestola, M. ANAKON, Essen, 2013.

9. Appendix 165
9.5 Curriculum Vitae
Der Lebenslauf ist in der Online-Version aus Gründen des Datenschutzes nicht enthalten.

166 9. Appendix

9. Appendix 167
9.6 Erklärung
Hiermit versichere ich, dass ich die vorliegende Arbeit mit dem Titel
„Multidimensional high-performance liquid chromatography–gas
chromatography (HPLC-GC) hyphenation techniques for food analysis in
routine environments”
selbst verfasst und keine außer den angegebenen Hilfsmitteln und Quellen benutzt
habe, und dass die Arbeit in dieser oder ähnlicher Form noch bei keiner anderen
Universität eingereicht wurde.
Essen, im April 2016
Marco Nestola

168 9. Appendix
9.7 Acknowledgements
Firstly, I want to thank Prof. Torsten C. Schmidt for giving me the possibility to finish my thesis
in his department. I greatly appreciate the steady input and the critical discussions about my
work. I am thankful to Prof. Oliver J. Schmitz for his efforts as second assessor of this thesis.
Secondly, I would like to thank my colleagues at Axel Semrau GmbH & Co. KG, who gave me
the freedom of doing my researches apart from the routine work. I am certainly grateful for the
support of Dr. Andreas Bruchmann, Dr. Rüdiger Kohl, Sonja Augustin, and Peter Tablack.
I would also like to thank the whole team of Institute Kirchhoff Berlin GmbH. Without them I
would not have been able to finish this thesis. I am very thankful to Dr. Erhard Kirchhoff and
Dr. Jutta Kunert-Kirchhoff, who provided me accommodation for almost two years.
Additionally, I would like to highlight Erik Becker, Patrick Bluhme, Annika Braun, Rainer
Friedrich, Jörg Konetzki, Andrea Thellmann, and Eileen Schulz for giving valuable inputs
during my work.
Last but not least, I am indebted to my family, spouse, and friends, who encouraged me to finish
this work.
Recommended