1
Multi-scale analysis for structural design on engine exhausted heat recovery system using
thermoelectric element
Kazunari KAWAHARA1, Satoshi ISHIKAWA1, Katsuya MINAMI2
[1]IDAJ Co., Ltd. and [2] Honda R&D Co., Ltd.
Abstract: In order to apply thermoelectric generator (TEG) into engine exhausted heat recovery
system, the thermoelectric module needs to be compact balancing between structural durability
and thermal transfer characteristics. However, the manufacturing process of the thermoelectric
module, which can be classified into two categories, is highly complicated. The first process is to
bond the Cu electrodes onto the top and bottom surfaces of thermoelectric element, while certain
residual stress and deformation are observed in itself. The second process is the module
manufacturing which assembles large numbers of the bonded single elements with residual stress
on the exhausted plate. Regarding the structural design, the arrangement and shape of the
elements is very important to secure the strength and thermal efficiency, also to prevent damage
and crack on the system. In this paper, we explored the multi-scale analysis for the whole
manufacturing process of thermoelectric module by using Abaqus/Standard. The first process was
analyzed on micro scale with fine mesh for acquiring precise results, subsequently the results were
mapped onto the second process as macro scale analysis by an automatic mapping tool which we
developed in this study. These analyses of processes could help us to minimize the residual stress
and the design of the bonding arrangement. Furthermore the deformation and stress state under
actual operation of the system were analyzed, and those results showed the enhanced efficiency of
the electrical generation. Our proposed method contributed to new structural design concept to
resolve the above mentioned issues.
Keywords: Thermoelectric Generator, Multi-scale Analysis, Stress Mapping, Residual Stress.
1. Introduction
An efficiency improvement for automobile fuel consumption and an energy regeneration
technology are strongly demanded in the recent market. With thermal efficiency improvement and
a friction loss reduction technology, a thermal management technology attracts attention for the
energy regeneration. The exhaust loss reaches approximately 40% of fuel energy, and effective
utilization of this energy is expected. Exhaust heat recirculation systems, which warm up the
engine coolant using the exhaust heat, have been already released on market to enhance real-world
fuel economy and cabin heater performance in winter season. However the energy regeneration
technology from engine exhaust heat to electric energy does not lead to mass-production for a
passenger car at a point of view of system size and the cost effectiveness “(Minami, 2017).”
2
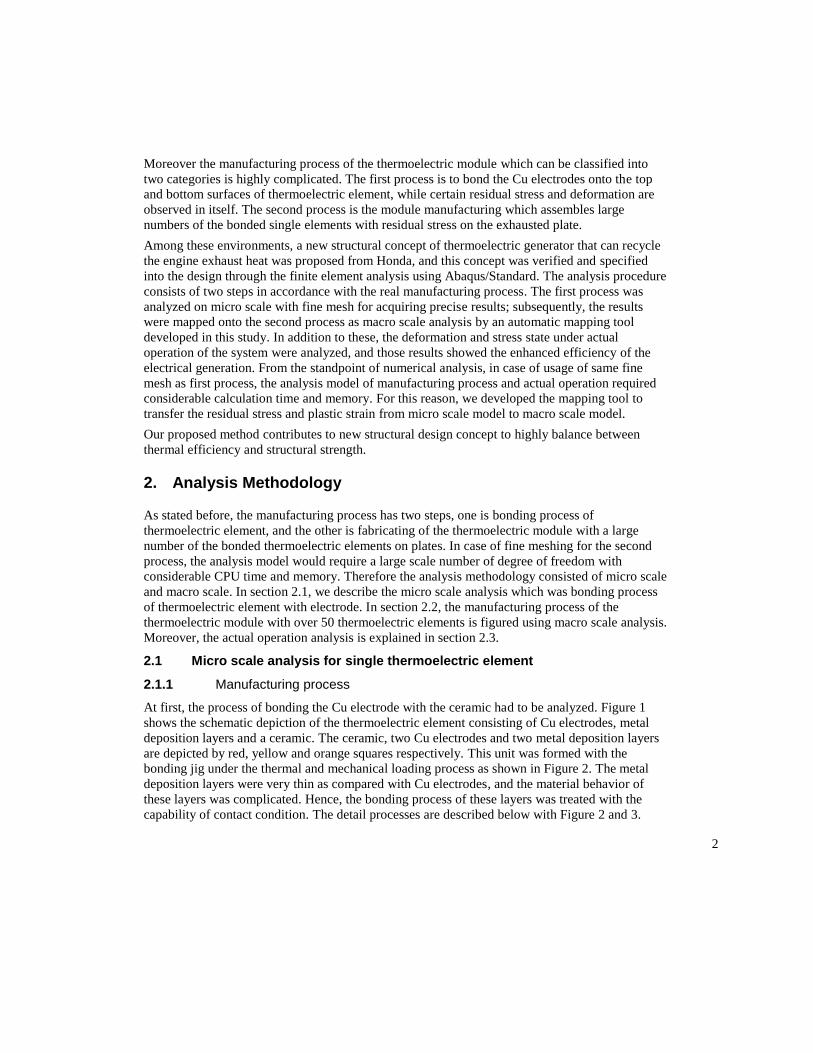
Moreover the manufacturing process of the thermoelectric module which can be classified into
two categories is highly complicated. The first process is to bond the Cu electrodes onto the top
and bottom surfaces of thermoelectric element, while certain residual stress and deformation are
observed in itself. The second process is the module manufacturing which assembles large
numbers of the bonded single elements with residual stress on the exhausted plate.
Among these environments, a new structural concept of thermoelectric generator that can recycle
the engine exhaust heat was proposed from Honda, and this concept was verified and specified
into the design through the finite element analysis using Abaqus/Standard. The analysis procedure
consists of two steps in accordance with the real manufacturing process. The first process was
analyzed on micro scale with fine mesh for acquiring precise results; subsequently, the results
were mapped onto the second process as macro scale analysis by an automatic mapping tool
developed in this study. In addition to these, the deformation and stress state under actual
operation of the system were analyzed, and those results showed the enhanced efficiency of the
electrical generation. From the standpoint of numerical analysis, in case of usage of same fine
mesh as first process, the analysis model of manufacturing process and actual operation required
considerable calculation time and memory. For this reason, we developed the mapping tool to
transfer the residual stress and plastic strain from micro scale model to macro scale model.
Our proposed method contributes to new structural design concept to highly balance between
thermal efficiency and structural strength.
2. Analysis Methodology
As stated before, the manufacturing process has two steps, one is bonding process of
thermoelectric element, and the other is fabricating of the thermoelectric module with a large
number of the bonded thermoelectric elements on plates. In case of fine meshing for the second
process, the analysis model would require a large scale number of degree of freedom with
considerable CPU time and memory. Therefore the analysis methodology consisted of micro scale
and macro scale. In section 2.1, we describe the micro scale analysis which was bonding process
of thermoelectric element with electrode. In section 2.2, the manufacturing process of the
thermoelectric module with over 50 thermoelectric elements is figured using macro scale analysis.
Moreover, the actual operation analysis is explained in section 2.3.
2.1 Micro scale analysis for single thermoelectric element
2.1.1 Manufacturing process
At first, the process of bonding the Cu electrode with the ceramic had to be analyzed. Figure 1
shows the schematic depiction of the thermoelectric element consisting of Cu electrodes, metal
deposition layers and a ceramic. The ceramic, two Cu electrodes and two metal deposition layers
are depicted by red, yellow and orange squares respectively. This unit was formed with the
bonding jig under the thermal and mechanical loading process as shown in Figure 2. The metal
deposition layers were very thin as compared with Cu electrodes, and the material behavior of
these layers was complicated. Hence, the bonding process of these layers was treated with the
capability of contact condition. The detail processes are described below with Figure 2 and 3.

3
(a) The element which was put between two bonding jig was heated from the room
temperature (300 [K]) to 823 [K]. The deposition layers were modeled as normal contact
condition as same as between the Cu electrode and the bonding jig.
(b) The mechanical loading was applied on the upper bonding jig as pressure load
117.6[MPa] as shown in blue line in Figure 2 under keeping the temperature condition
823[K].
(c) To treat the bonding process, the contact condition on the deposition layers was changed
to the rigid tie condition under keeping the temperature and pressure load.
(d) The pressure was unloaded under high temperature, and the contact condition on the jig
was released.
(e) Finally the element was cooled from 823[K] to the room temperature.
CeramicDeposition
layer
Bonding Jig
Bonding Jig
Cu Electrode
Cu Electrode
(a)
(b)
(c)
(e)
(d)
823 [K]
RT
Pressure
117.6 [MPa]
Figure 1. Schematic of Figure 2. Process time table. thermoelectric element.
(a) Heating
RT –> 823 [K]
(b) Loading
823 [K]
117.6 [MPa]
(c) Bondig
823 [K]
117.6 [MPa]
(d) Unloading
823 [K]
0 [MPa]
(e) Cooling
823[K] –> RT
Contact Contact ContactRigid
TieRigid
Tie
Rigid
Tie
Figure 3. Bonding processes.
2.1.2 Material
The ceramic was treated as an elastic material that had temperature dependency, and the material
of Cu electrode also had the temperature dependency of elastic modulus. Table 1 shows the
Young’s modulus and Poisson’s ratio only in the room temperature. The Cu electrode was dealt
with a plastic material as shown in Figure 4. Regarding the following macro analysis of heat
transfer, the material data of heat conductivity and specific heat had temperature dependency too.

4
Table 1. Elastic modulus in room temperature.
Material Young’s modulus [MPa] Poisson’s ratio
Ceramic 175200 0.28 Cu electrode 96320 0.343
Figure 4. Stress-strain relation with temperature dependency.
2.1.3 Analysis model
The micro scale model was made with quarter model as shown in Figure 5. The red part was the
ceramic, the orange parts were the Cu electrodes, and the blue and gray parts indicated the
bonding jigs as rigid parts. The finite element model was constructed out of 16020 C3D8R
elements and 18943 nodes based on the proper symmetry boundary conditions. The thermal loads
were applied as Figure 2, and the pressure load was applied on the upper rigid gray part. Not to
mention, four contact conditions were applied between the ceramic and the electrodes and the
electrodes and the bonding jigs.
Figure 5. Fine mesh for micro scale analysis.
0 0.05 0.1 0.15 0.2 0.25
Tru
e S
tres
s
Plastic Strain [-]
300[K]
373[K]
573[K]
773[K]
973[K]

5
2.2 Macro scale analysis for modules manufacturing
2.2.1 Mapping system
To clarify the mapping system, a quarter model of the thermoelectric module is depicted in Figure
6 at the beginning of this section. Figure 6 (a) shows the quarter analysis model, and Figure 6 (b)
is a section picture that shows the fin shape clearly. Figure 6 (c) shows the arrangement of 54
thermoelectric elements in this model, and an enlarged drawing of element is shown in Figure 6
(d). The difference of the mesh size between Figure 5 and Figure 6 (d) is remarkable. If the fine
mesh was applied on each thermoelectric element, this module analysis would have a large
number of degrees of freedom. Therefore, the results of residual stress and plastic strain which
analyzed in section 2.1 were mapped onto each elements of macro scale model by our developed
tool. Figure 7 shows the system flow of mapping tool. The Excel sheet included the information of
arrangement of the thermoelectric element, such as the number of X, Y row and pitch, the set
name of elements and the center coordinate of tip, etc. Our tool referred to the results of the micro
analysis and the base exhaust plate input file, after it generated automatically the Abaqus
command ‘*INITIAL CONDITIONS’ as shown in Figure 8.
Figure 6. Exhaust plate model for macro scale analysis.
(a) Quarter model (b) Cross-sectional view
(c) Arrangement of
thermoelectric element (d) Enlarged drawing
Exhaust gas zone
Cooling fin zone

6
Example of Arrangement
Excel sheet of Arrangement data
Single element
Abaqus odb file
Extract & mapping
Program
Abaqus inp file
including *INITIAL
CONDITIONS
Data of
Arrangement of
elements
Exhaust plate
input file
Figure 7. System flow of mapping.
Figure 8. Example of INITIAL CONDITIONS in input file.
2.2.2 Manufacturing process
In this study, we examined two analysis types following the real manufacturing process. One is a
diffusion bonding which is a solid state welding technique capable of joining between similar or
different metals, and the other is a brazing bonding which is a metal-joining process in which two
or more metal items are joined together by melting. At first, the diffusion bonding is explained in
the next section.
** SET PART : PLATE_COPPER_HI-1 **
*INITIAL CONDITIONS, TYPE=STRESS
264595, 42.706, 3.111, -24.081, 11.296, 13.014, -7.271
264596, 47.739, -3.510, -6.896, 16.605, 6.769, -7.619
264597, 135.077, 2.515, -6.271, 0.781, 6.836, -1.316
264598, 135.236, -1.817, -2.519, 2.712, 3.630, -4.176
*INITIAL CONDITIONS, TYPE=PLASTIC STRAIN
264595, 3.303E-05,-1.213E-05,-2.090E-05, 6.693E-06, 1.002E-05,-4.052E-06
264596, 7.953E-05,-1.124E-04, 3.289E-05, 3.229E-05, 4.096E-06, 8.570E-06
264597, 2.732E-03,-1.231E-03,-1.501E-03, 3.860E-05, 3.409E-04,-7.628E-05
264598, 2.702E-03,-1.480E-03,-1.223E-03, 1.605E-04, 1.768E-04,-2.008E-04
7
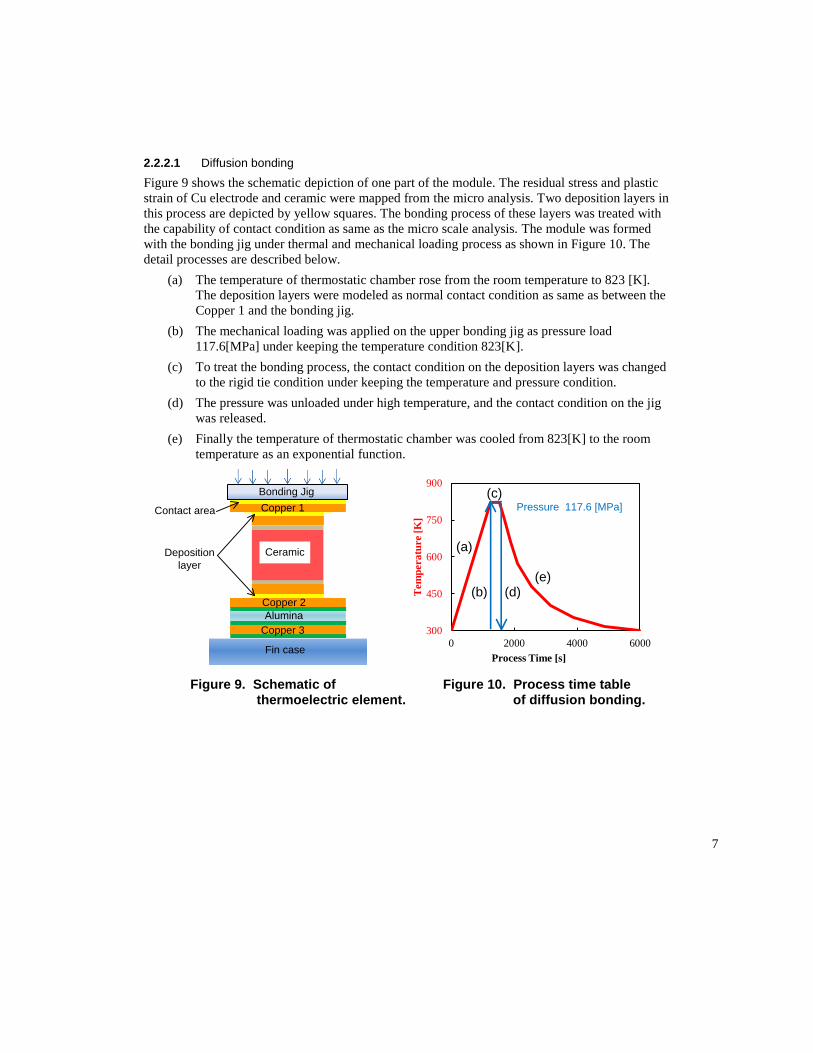
2.2.2.1 Diffusion bonding
Figure 9 shows the schematic depiction of one part of the module. The residual stress and plastic
strain of Cu electrode and ceramic were mapped from the micro analysis. Two deposition layers in
this process are depicted by yellow squares. The bonding process of these layers was treated with
the capability of contact condition as same as the micro scale analysis. The module was formed
with the bonding jig under thermal and mechanical loading process as shown in Figure 10. The
detail processes are described below.
(a) The temperature of thermostatic chamber rose from the room temperature to 823 [K].
The deposition layers were modeled as normal contact condition as same as between the
Copper 1 and the bonding jig.
(b) The mechanical loading was applied on the upper bonding jig as pressure load
117.6[MPa] under keeping the temperature condition 823[K].
(c) To treat the bonding process, the contact condition on the deposition layers was changed
to the rigid tie condition under keeping the temperature and pressure condition.
(d) The pressure was unloaded under high temperature, and the contact condition on the jig
was released.
(e) Finally the temperature of thermostatic chamber was cooled from 823[K] to the room
temperature as an exponential function.
Bonding Jig
CeramicDeposition
layer
Copper 2
Copper 3
Alumina
Fin case
Copper 1Contact area
300
450
600
750
900
0 2000 4000 6000
Tem
per
atu
re [
K]
Process Time [s]
Pressure 117.6 [MPa]
(a)
(b)
(c)
(d)(e)
Figure 9. Schematic of Figure 10. Process time table thermoelectric element. of diffusion bonding.

8
2.2.2.2 Brazing bonding
The process of brazing bonding is as almost same as the diffusion bonding, but the pressure is
much smaller than the diffusion bonding. The detail processes are described below with Figure 11.
(a) The mechanical loading was applied on the upper bonding jig as pressure load
0.98[MPa] under the room temperature. The deposition layers were modeled as normal
contact condition as same as between the Copper 1 and the bonding jig.
(b) The temperature of thermostatic chamber rose from the room temperature to 1063[K]
which was higher temperature than the diffusion process.
(c) To treat the bonding process, the contact condition on the deposition layers was changed
to the rigid tie condition under keeping the temperature and pressure load.
(d) The temperature of thermostatic chamber was cooled from 1063[K] to the room
temperature non-linearly.
(e) Finally the pressure was unloaded under the room temperature, and the contact condition
on the jig was released.
300
600
900
1200
0 3000 6000 9000
Tem
per
atu
re [
K]
Process Time [s]
(a)(e)Pressure 0.98 [MPa]
(b)
(c)
(d)
Figure 11. Process time table of brazing bonding.
2.3 Analysis model for actual operation
2.3.1 Analysis model
The structural analysis assembly was modeled in quarter model of the thermoelectric generator as
shown in Figure 12. The finite element model was constructed out of 595006 C3D8R elements
and 837475 nodes based on the proper symmetry boundary conditions. Naturally, the residual
stress and plastic strain were mapped from the macro analysis of the manufacturing process on
each thermoelectric element for example Figure 12 (d).

9
Figure 12. Quarter model of Thermoelectric generator.
2.3.2 Loading and thermal conditions
The key points of strength analysis in actual operation were the initial stress, the temperature
condition and the operation pressure in the cooling and the exhaust gas zone. Therefore, the steady
state analysis of the temperature was carried out first, and the elastic-plastic thermal analysis
including initial stress was executed successively. The blue arrow pressure shown in Figure 13
was applied on the outer case structure, the green arrows were the pressure on the cooling plate,
and also the pink arrows indicated the internal pressure as the air pressure. As for those pressure
levels, an actual work condition was assumed. Moreover, two boundary conditions of exhaust gas
pressure, 1atm and 4atm, were investigated.
Exhaust gas zone
Cooling zone
Figure 13. Quarter model of Thermoelectric generator.
(a) Quarter model
(d) Initial stress on thermoelectric element
(b) Cooling fin
(c) Exhaust gas zone
10
3. Results
3.1 Micro scale analysis results of single thermoelectric element
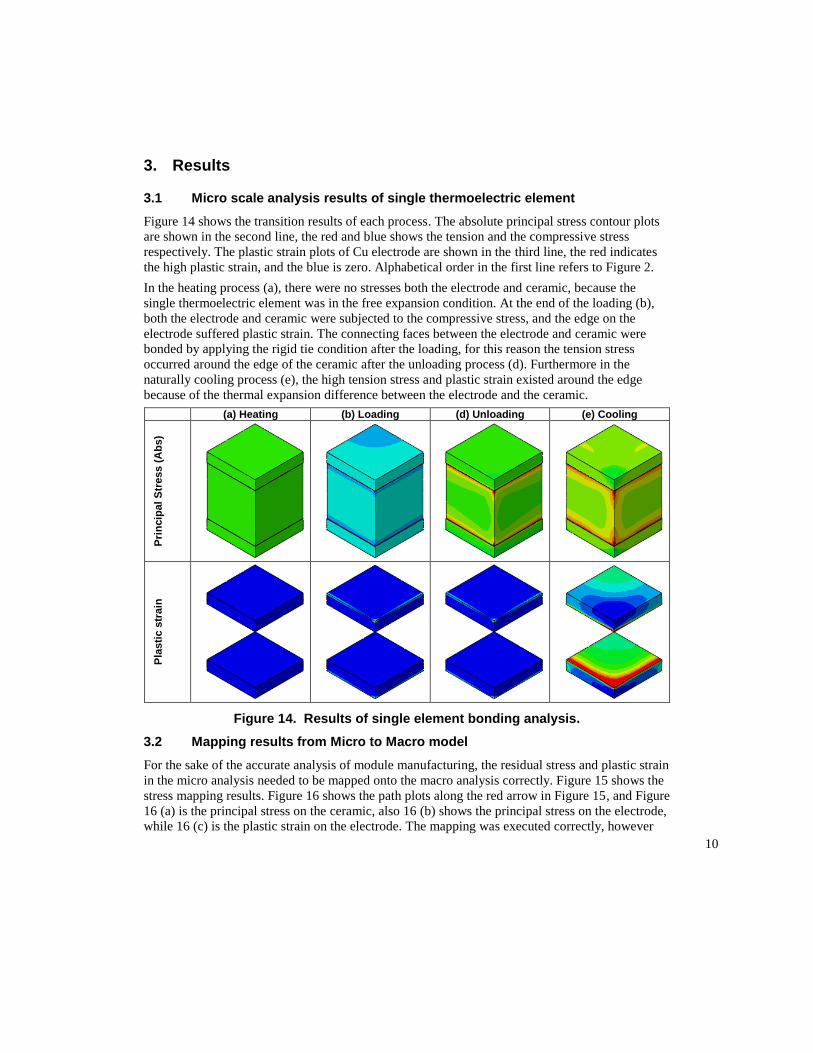
Figure 14 shows the transition results of each process. The absolute principal stress contour plots
are shown in the second line, the red and blue shows the tension and the compressive stress
respectively. The plastic strain plots of Cu electrode are shown in the third line, the red indicates
the high plastic strain, and the blue is zero. Alphabetical order in the first line refers to Figure 2.
In the heating process (a), there were no stresses both the electrode and ceramic, because the
single thermoelectric element was in the free expansion condition. At the end of the loading (b),
both the electrode and ceramic were subjected to the compressive stress, and the edge on the
electrode suffered plastic strain. The connecting faces between the electrode and ceramic were
bonded by applying the rigid tie condition after the loading, for this reason the tension stress
occurred around the edge of the ceramic after the unloading process (d). Furthermore in the
naturally cooling process (e), the high tension stress and plastic strain existed around the edge
because of the thermal expansion difference between the electrode and the ceramic.
(a) Heating (b) Loading (d) Unloading (e) Cooling
Pri
ncip
al S
tress (
Ab
s)
Pla
sti
c s
train
Figure 14. Results of single element bonding analysis.
3.2 Mapping results from Micro to Macro model
For the sake of the accurate analysis of module manufacturing, the residual stress and plastic strain
in the micro analysis needed to be mapped onto the macro analysis correctly. Figure 15 shows the
stress mapping results. Figure 16 shows the path plots along the red arrow in Figure 15, and Figure
16 (a) is the principal stress on the ceramic, also 16 (b) shows the principal stress on the electrode,
while 16 (c) is the plastic strain on the electrode. The mapping was executed correctly, however

11
the slight difference was observed at the end of ceramic as shown in Figure 16 (a). This difference
was caused from the averaging of mesh sizes. Therefore, the fine mesh at the end of the element
was taken in order to reduce the error.
Results of
micro analysis
Initial conditions for macro analysis
Mapping
Figure 15. Result of mapping from micro element to macro module.
Figure 16. Path plots of Micro and Macro analysis.
3.3 Macro scale analysis results of module manufacturing
3.3.1 Results of the diffusion bonding
Figure 17 shows the transition results of the absolute principal stress in each process, and the red
and blue shows the tension and the compressive stress respectively. The stress of the ceramic was
higher than it of the electrode during the processes due to the high elastic module of the ceramic.
Figure 18 shows the transition of the plastic strain, and the red shows the high plastic strain and
the blue indicates the zero.
The stress distribution of the element inherited from the initial stress of micro analysis after the
heating process (a) because of the free expansion condition. At the end of the loading (b), the
compressive stress occurred at the edge of the ceramic, and the edge on the electrode suffered
plastic strain. The connecting faces between the electrode and ceramic were bonded after the
loading. As a consequence, the stress distribution after the unloading process (d) was as same level
as the heating process, on the other hand the plastic strain became larger by the effect of bonding.
Finally the end of the cooling process (e), the large tension stress occurred in the ceramic and
0 0.5 1
Prin
cip
al st
ress
Results of Micro analysis
Initial stress for Macro
analysis
0
0 0.5 1
Pri
nci
pa
l st
ress
Results of Micro analysis
Initial stress for Macro
analysis
0 0.5 1
Pla
stic
str
ain
Results of Micro analysis
Initial stress for Macro
analysis
(a) stress on ceramic (b) stress on Cu electrode (c) plastic strain on Cu electrode
0

12
electrode, besides the electrode had the largest plastic strain because of the thermal expansion
difference between the electrode and the ceramic. In addition, in each arranged thermoelectric
elements, the highest stress occurred on a thermoelectric element in the outside which was marked
by a red circle in the second line fourth row in Figure 17.
(a) Heating (b) Loading (d) Unloading (e) Cooling
Figure 17. Principal stress of diffusion bonding of module.
(a) Heating (b) Loading (d) Unloading (e) Cooling
Figure 18. Plastic strain of diffusion bonding of module.
3.3.2 Results of the brazing bonding
Figure 19 shows the transition results of the absolute principal stress in each process, and Figure
20 shows the transition of the plastic strain.
The value of the pressure load of the brazing bonding was much smaller than the diffusion
bonding, thus the stress distribution of the element corresponded with the initial stress of micro
analysis after the loading process (a). The stress lowered during the heating (b) on account of the
temperature dependency of the elasticity. The connecting faces between the electrode and ceramic
were bonded after the heating, and the thermoelectric element had an effect of the difference of
thermal expansion. In this reason, the level of stress became larger after the cooling (d), and the
plastic strain also became larger especially at the bonding face to the cooling plate. The stress and
strain after the unloading process were as same as the cooling process because the value of the

13
pressure was small. Finally the highest stress was found on an element in a red circle in the second
line fourth row in Figure 19.
(a) Loading (b) Heating (d) Cooling (e) Unloading
Figure 19. Principal stress of brazing bonding of module.
(a) Loading (b) Heating (d) Cooling (e) Unloading
Figure 20. Plastic strain of brazing bonding of module.
3.4 Results of actual operation
Figure 21 shows the temperature of steady state and the absolute principal stress of the quarter
analysis model in the actual driving.
Figure 22 illustrates the principal stress of the representative thermoelectric element in each
analysis cases, and the contour range was the same in all figures. The position of the maximum
stress in the brazing bonding was the same as the diffusion bonding as shown in Figure 22 (a) and
(b) in the third line. But the stress level of the diffusion was much larger than the brazing, even in
the large exhaust gas pressure condition in Figure 22 (c) and (d).
Figure 23 illustrates the absolute principal stress path plot along the blue and black arrows in (a).
Figure 23 (b) is the path plot at the edge of the cooling side depicted in blue lines (a), while Figure
23 (c) is the path plot at the exhaust gas side depicted in black lines (a). The red line of the path

14
plots is the result of the diffusion bonding, and the other green line is the brazing bonding.
Obviously the stress of the diffusion was much larger than the brazing at the cooling side as shown
in Figure 23 (b), on the contrary the stress difference was not found at the exhaust gas side as
Figure 23 (c).
Figure 21. Results of Thermoelectric generator.
(a) Diffusion 1atm (b) Brazing 1atm (c) Diffusion 4atm (d) Brazing 4atm
Figure 22. Principal stress of representative thermoelectric element on module.
(a) Plot position (b) Stress on the cooling side (c) Stress on the exhaust gas side
Figure 23. Path plots of the principal stress along the electrode.
(a) Temperature (b) Absolute Principal stress
Diffusion
Brazing
Diffusion
Brazing
0

15
4. Discussion and Conclusion
The focus of this study was to simulate new structural design of the thermoelectric generator from
manufacturing process to actual system operation, and to optimize the manufacturing condition
and design specification. FEM analysis such as Abaqus/Standard was powerful tool for the design
validation. However if we constructed the precise FEM model on each thermoelectric elements,
the analysis would require a large quantity of computer resource. Therefore, to accomplish our
objective, we developed the multi-scale analysis system with the mapping tool from micro model
to macro model. We analyzed the micro process which was the bonding process of single
thermoelectric element, and investigated the difference between the diffusion bonding and the
brazing bonding during the manufacturing process by the macro scale analysis, furthermore the
actual operation was analyzed with each bonding process. Our study provided the following
important findings.
The micro analysis for the single thermoelectric element could make the stress transition
clear in the bonding processes as shown in Figure 14.
Figure 16 showed that the residual stress and plastic strain from micro to macro were
transferred precisely by using ‘*INITIAL CONDITIONS’. Moreover our tool enabled the
variable arrangement design of the thermoelectric elements on the exhaust plate.
The difference between the diffusion bonding and the brazing bonding was clarified by
the macro analysis as shown in the third line fourth row in Figure 17 and 19. The tension
stress was found both the electrode and the ceramic in the diffusion bonding; on the
contrary, the tension stress on the electrode was small in the brazing bonding.
The most important finding was to reveal the large difference of the stress along the
electrode on the cooling side in the actual operation as shown in Figure 23 (b). This result
elucidated the advantage of the brazing bonding.
In conclusion, we developed the multi-scale analysis system on Abaqus/Standard and analyzed the
manufacturing process and the actual system operation. This analysis system could help us to
optimize the design of the thermoelectric generator with balancing system durability and thermal
efficiency.
5. References
1. Minami, K., Matsumoto, M., and Mori, M., “Structural Design Approach on Engine
Exhausted Heat Recovery System using Thermoelectric Element”, Journal of Society of
Automotive Engineers of Japan, Vol. 71, No. 10, 2017.
2. Abaqus Users Manual, Version 6.12-1, Dassault Systèmes Simulia Corp., Providence, RI.
Recommended
![Computational Engine Structural Analysis - NASA · Computational Engine Structural Analysis (NASA-T_] ... engine structural component modeling, (3) ... resistant fan blades using](https://img.pdfslide.us/doc/110x75/5ae5b62f7f8b9a29048c9bb9/computational-engine-structural-analysis-nasa-engine-structural-analysis-nasa-t.jpg)