ww.sciencedirect.com
wat e r r e s e a r c h 5 5 ( 2 0 1 4 ) 5 2e6 2
Available online at w
ScienceDirect
journal homepage: www.elsevier .com/locate /watres
Multi-objective optimisation of wastewatertreatment plant control to reduce greenhousegas emissions
Christine Sweetapple*, Guangtao Fu, David Butler
Centre for Water Systems, College of Engineering, Mathematics and Physical Sciences, University of Exeter, North
Park Road, Exeter, Devon EX4 4QF, United Kingdom
a r t i c l e i n f o
Article history:
Received 7 November 2013
Received in revised form
6 January 2014
Accepted 3 February 2014
Available online 15 February 2014
Keywords:
Control
Greenhouse gas
Multi-objective optimisation
NSGA-II
WWTP
* Corresponding author. Tel.: þ44 (0)1392 726E-mail address: [email protected] (C. Swee
0043-1354/$ e see front matter ª 2014 Elsevhttp://dx.doi.org/10.1016/j.watres.2014.02.018
a b s t r a c t
This study investigates the potential of control strategy optimisation for the reduction of
operational greenhouse gas emissions from wastewater treatment in a cost-effective
manner, and demonstrates that significant improvements can be realised. A multi-
objective evolutionary algorithm, NSGA-II, is used to derive sets of Pareto optimal opera-
tional and control parameter values for an activated sludge wastewater treatment plant,
with objectives including minimisation of greenhouse gas emissions, operational costs and
effluent pollutant concentrations, subject to legislative compliance. Different problem
formulations are explored, to identify the most effective approach to emissions reduction,
and the sets of optimal solutions enable identification of trade-offs between conflicting
objectives. It is found that multi-objective optimisation can facilitate a significant reduc-
tion in greenhouse gas emissions without the need for plant redesign or modification of the
control strategy layout, but there are trade-offs to consider: most importantly, if opera-
tional costs are not to be increased, reduction of greenhouse gas emissions is likely to incur
an increase in effluent ammonia and total nitrogen concentrations. Design of control
strategies for a high effluent quality and low costs alone is likely to result in an inadvertent
increase in greenhouse gas emissions, so it is of key importance that effects on emissions
are considered in control strategy development and optimisation.
ª 2014 Elsevier Ltd. All rights reserved.
1. Introduction
Global warming is an internationally recognised problem
and, to help address this, the UK has committed to reduce its
greenhouse gas (GHG) emissions by 80% by 2050 with respect
to a 1990 baseline, under the Climate Change Act 2008.
Recent studies have highlighted the significance of GHG
emissions resulting from energy use in the water industry
652.tapple).
ier Ltd. All rights reserve
(e.g. Rothausen and Conway, 2011), and Defra (2008) has
attributed 56% of the industry’s emissions to wastewater
treatment. As such, the water industry must contribute to
this target, using a range of mitigation and adaptation stra-
tegies. These demands must be met whilst also complying
with increased water quality standards required by the Water
Framework Directive. The water industry is, therefore, faced
with the huge challenge of reducing carbon emissions by 80%
whilst improving standards and remaining cost efficient.
d.

wat e r r e s e a r c h 5 5 ( 2 0 1 4 ) 5 2e6 2 53
Further challenge is posed by the knowledge that reducing
energy consumption does not necessarily correspond to a
reduction in GHG emissions and local energy optimisation
can, in fact, increase the total global warming potential of
emissions from a wastewater treatment plant (WWTP)
(Flores-Alsina et al., 2014).
It has been shown that implementing automatic control in
WWTPs can have a significant impact on GHG emissions, with
reductions of up to 9.6% achieved by Flores-Alsina et al. (2011).
However, the existence of trade-offs and the need for a
balancing act has been highlighted (Flores-Alsina et al., 2011),
and a thorough investigation into the relationships and trade-
offs between GHG emissions, effluent quality and operational
costs is needed to enable assessment of the potential im-
provements achievable in existing WWTPs by altering only
the control of the system. Multi-objective optimisation en-
ables the identification of a set of Pareto-optimal solutions,
which are non-dominated based upon a given objective set
(i.e. cannot be further improved in terms of any one objective
without worsening another); this solution set can be used to
illustrate trade-offs between objectives.
The effects of implementing a range of different control
strategies and of using different setpoints for control on GHG
emissions, effluent quality and operational costs have been
explored previously (Flores-Alsina et al., 2011; Guo et al.,
2012b). Based on this, recommendations regarding the con-
trol of WWTPs to provide high quality effluent with low
operational GHG emissions have beenmade (e.g. Flores-Alsina
et al., 2014; Flores-Alsina et al. 2011; Guo et al., 2012a, 2012b).
The importance of using multiple objectives to evaluate and
compare WWTP control strategies has been highlighted pre-
viously (Flores-Alsina et al., 2014), and trade-offs between
effluent quality and operational costs have been identified
using multi-objective genetic algorithms for the optimisation
of controller setpoints (Beraud et al., 2007; Tomita and Park,
2009). However, conclusions drawn from previous studies
regarding the reduction of GHG emissions are based onWWTP
performance under only a limited number of different control
scenarios, and a global, multi-objective optimisation of mul-
tiple operational parameters has not been used to investigate
further improvements achievable or the existence of addi-
tional optimal solutions.
This study, therefore, aims to investigate the potential of
control strategy optimisation for the reduction of operational
GHG emissions resulting from wastewater treatment, and to
investigate necessary trade-offs between conflicting control
objectives. This is achieved by multi-objective optimisation of
the control of an activated sludge WWTP, in which aeration
intensities are manipulated in order to maintain a specified
dissolved oxygen (DO) concentration. Objectives considered
include the minimisation of GHG emissions, operational costs
and effluent pollutant concentrations whilst maintaining
legislative compliance. The intention of this paper is not to
prescribe a specific control strategy that can be used to reduce
emissions, since themodel used is of a hypothetical plant and
there are (necessarily) omissions in the sources of GHG
emissions modelled, rather to demonstrate that e assuming
the model represents the real phenomena reasonably well e
improvements can be realised if optimised control strategies
from multi-objective optimisation are implemented.
2. Materials and methods
2.1. Wastewater treatment plant model
2.1.1. Model scopeThe modelled WWTP is based on BSM2-e (Sweetapple et al.,
2013), a modified version of the BSM2 (Jeppsson et al., 2007)
which enables modelling of dynamic GHG emissions. BSM2-e
is computationally demanding, however, and unsuitable for
multi-objective optimisation given the high simulation time
and large number of simulations required. Reductions in GHG
emissions resulting from improved plant control have been
previously attributed predominantly to differences in power
consumption and secondary treatment process emissions
(Flores-Alsina et al., 2011), and sensitivity analysis has found
there to be negligible variance in sludge line emissions
resulting from adjustment of operational parameters
(Sweetapple et al., unpublished results). This suggests that the
most significant improvements in total GHG emissions
resulting from control strategy optimisation will be due to a
reduction in emissions resulting fromwastewater rather than
sludge treatment processes and that modelling of the waste-
water treatment processes alone is sufficient to demonstrate
the potential of control strategy optimisation to reduce GHG
emissions. The BSM2-e model is, therefore, modified to
exclude sludge treatment, significantly reducing simulation
time and thereby making multi-objective optimisation
feasible. Modelling of all operational parameters to which
effluent quality, operational cost or GHG emissions are sen-
sitive is retained (Sweetapple et al., unpublished results).
The layout of the reduced model is shown in Fig. 1 and
consists of a primary clarifier, an activated sludge reactor
containing two tanks which may be operated under anoxic or
aerobic conditions, followed by three aerobic tanks in series, a
secondary settler and a sludge thickener. The primary clarifier
has a volume of 900 m3, assumes a 50% solids removal effi-
ciency and is modelled based upon Otterpohl and Freund
(1992) and Otterpohl et al. (1994). The anoxic tanks have a
volume of 1500 m3 each and the aerobic tanks volumes of
3000 m3 each; both are modelled using a version of the ASM1
(Henze et al., 2000) modified for inclusion of GHG emissions as
detailed by Sweetapple et al. (2013). The secondary settler has
a surface area of 1500 m3, volume of 6000 m3, and is modelled
based upon Takacs et al. (1991). Sludge thickening is modelled
as an ideal and continuous process, with no biological activity
and assuming 98% solids removal efficiency.
Modelled GHG emissions include direct emissions from the
activated sludge reactors and indirect emissions resulting
frommanufacture of chemicals, energy generation and offsite
effluent degradation. Dynamic production of N2O due to
incomplete denitrification, associated CO2 emissions, and CO2
formed during substrate utilisation and biomass decay in the
activated sludge units are modelled as in BSM2-e, as are CO2
and N2O emissions from aerobic degradation of the effluent.
Emissions resulting from the generation of energy imported
are calculated using the modelled energy requirement for
activated sludge aeration and mixing, and pumping of the
internal recycle flow, return activated sludge flow, wastage
flow and the primary clarifier underflow. Further detail on
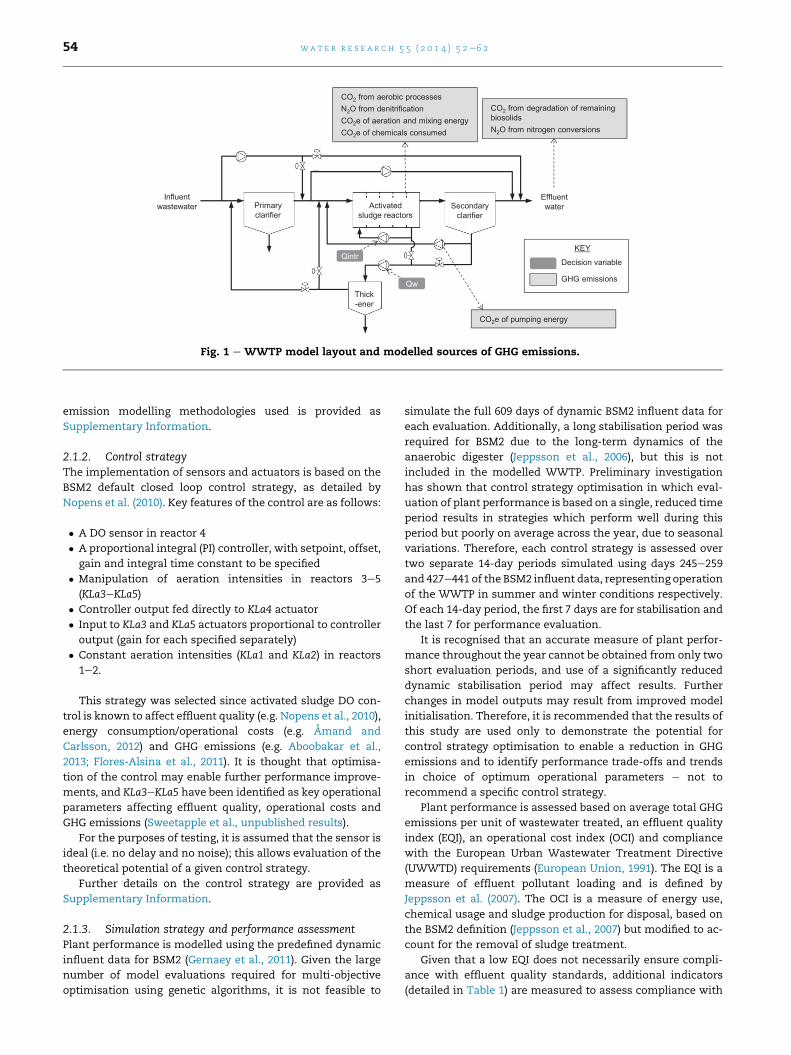
Fig. 1 e WWTP model layout and modelled sources of GHG emissions.
wat e r r e s e a r c h 5 5 ( 2 0 1 4 ) 5 2e6 254
emission modelling methodologies used is provided as
Supplementary Information.
2.1.2. Control strategyThe implementation of sensors and actuators is based on the
BSM2 default closed loop control strategy, as detailed by
Nopens et al. (2010). Key features of the control are as follows:
� A DO sensor in reactor 4
� A proportional integral (PI) controller, with setpoint, offset,
gain and integral time constant to be specified
� Manipulation of aeration intensities in reactors 3e5
(KLa3eKLa5)
� Controller output fed directly to KLa4 actuator
� Input to KLa3 and KLa5 actuators proportional to controller
output (gain for each specified separately)
� Constant aeration intensities (KLa1 and KLa2) in reactors
1e2.
This strategy was selected since activated sludge DO con-
trol is known to affect effluent quality (e.g. Nopens et al., 2010),
energy consumption/operational costs (e.g. Amand and
Carlsson, 2012) and GHG emissions (e.g. Aboobakar et al.,
2013; Flores-Alsina et al., 2011). It is thought that optimisa-
tion of the control may enable further performance improve-
ments, and KLa3eKLa5 have been identified as key operational
parameters affecting effluent quality, operational costs and
GHG emissions (Sweetapple et al., unpublished results).
For the purposes of testing, it is assumed that the sensor is
ideal (i.e. no delay and no noise); this allows evaluation of the
theoretical potential of a given control strategy.
Further details on the control strategy are provided as
Supplementary Information.
2.1.3. Simulation strategy and performance assessmentPlant performance is modelled using the predefined dynamic
influent data for BSM2 (Gernaey et al., 2011). Given the large
number of model evaluations required for multi-objective
optimisation using genetic algorithms, it is not feasible to
simulate the full 609 days of dynamic BSM2 influent data for
each evaluation. Additionally, a long stabilisation period was
required for BSM2 due to the long-term dynamics of the
anaerobic digester (Jeppsson et al., 2006), but this is not
included in the modelled WWTP. Preliminary investigation
has shown that control strategy optimisation in which eval-
uation of plant performance is based on a single, reduced time
period results in strategies which perform well during this
period but poorly on average across the year, due to seasonal
variations. Therefore, each control strategy is assessed over
two separate 14-day periods simulated using days 245e259
and 427e441 of the BSM2 influent data, representing operation
of the WWTP in summer and winter conditions respectively.
Of each 14-day period, the first 7 days are for stabilisation and
the last 7 for performance evaluation.
It is recognised that an accurate measure of plant perfor-
mance throughout the year cannot be obtained from only two
short evaluation periods, and use of a significantly reduced
dynamic stabilisation period may affect results. Further
changes in model outputs may result from improved model
initialisation. Therefore, it is recommended that the results of
this study are used only to demonstrate the potential for
control strategy optimisation to enable a reduction in GHG
emissions and to identify performance trade-offs and trends
in choice of optimum operational parameters e not to
recommend a specific control strategy.
Plant performance is assessed based on average total GHG
emissions per unit of wastewater treated, an effluent quality
index (EQI), an operational cost index (OCI) and compliance
with the European Urban Wastewater Treatment Directive
(UWWTD) requirements (European Union, 1991). The EQI is a
measure of effluent pollutant loading and is defined by
Jeppsson et al. (2007). The OCI is a measure of energy use,
chemical usage and sludge production for disposal, based on
the BSM2 definition (Jeppsson et al., 2007) but modified to ac-
count for the removal of sludge treatment.
Given that a low EQI does not necessarily ensure compli-
ance with effluent quality standards, additional indicators
(detailed in Table 1) are measured to assess compliance with

Table 1 e Discharge requirements for modelled WWTPunder the UWWTD.
Parameter 95 percentile(g/m3)
Maximum(g/m3)
Mean(g/m3)
BOD5 25 50 e
COD 125 250 e
TSS 35 87.5 e
Total nitrogen e e 15
wat e r r e s e a r c h 5 5 ( 2 0 1 4 ) 5 2e6 2 55
the UWWTD. Effluent ‘ammonia and ammonium nitrogen’ is
also measured as this may be consented, despite not being a
specific requirement of the UWWTD. The following assump-
tions apply henceforth: ‘BOD5’ refers to effluent BOD5 95
percentile, ‘COD’ refers to effluent COD 95 percentile, ‘TSS’
refers to effluent TSS 95 percentile, ‘nitrogen’ refers to mean
effluent total nitrogen and ‘ammonia’ refers to effluent
ammonia and ammonium 95 percentile.
Note that, given the modifications to the WWTP layout,
results obtained in this study are not directly comparable with
those from BSM2 or BSM2-e (e.g. Nopens et al., 2010;
Sweetapple et al., 2013).
2.2. Multi-objective optimisation
2.2.1. Optimisation algorithmControl strategy optimisation is carried out using the Non-
Dominated Sorting Genetic Algorithm-II (NSGA-II) (Deb et al.,
2002), since it is computationally fast and has been shown to
provide better coverage and maintain a better spread of so-
lutions than other multi-objective evolutionary algorithms
(MOEAs) (Deb et al., 2002). Local optimisation methods are
very efficient in finding local optima within a convex area of
the design space, but may result in suboptimal solutions for
complex optimisation problemswithmany local optima and a
highly non-linear design space. Genetic algorithms are better
suited to the optimisation of WWTP control strategies due to
their ability to handle nonlinearities whilst requiring fewer
Table 2 e Decision variables for optimisation problem.
Variable Default (base case) Optim
Min
Qintr (m3/d) 61,944 51,620
Qw (m3/d) 300 93.5
KLa1 (/d) 0 0
KLa2 (/d) 0 0
carb1 (m3/d) 2 1.5
carb2 (m3/d) 0 0
carb5 (m3/d) 0 0
Controller setpoint
(g/m3)
2 0
Controller offset 120 0
Controller amplification 25 0
Controller integral
time constant
0.002 0.0005
KLa3 gain 1 0
KLa5 gain 0.5 0
objective function evaluations than alternative techniques
(Cosenza et al., 2009), and to findmultiple optimal solutions in
a single simulation run (Deb et al., 2002). Problems with mul-
tiple objectives can be tackled by transforming them into
single objective problems with a weighting system applied to
the objectives; in this instance, however, an MOEA is selected
to enable a set of non-dominating solutions to be identified
and trade-offs between objectives to be investigated without
the need for a weighting system.
NSGA-II is implemented as follows:
1. Initialise the population (solution set for evaluation), P(0),
with random values for N individuals
2. Calculate objective values for each individual in P(0)
3. Fast non-domination sort of P(0)
4. Repeat following for t generations:
a. Use binary tournament selection to select parent pop-
ulation, Pp(t), from P(t)
b. Perform crossover and mutation of Pp(t) to create child
population, Pc(t)
c. Form intermediate population, Pi(t), from Pp(t) and Pc(t)
d. Fast non-domination sort of Pi(t)
e. Form next generation, P(t þ 1) from N best individuals of
Pi(t)
In the non-dominated sorting, Pareto dominance is used to
rank all individuals of a population. Those which are not
dominated by any other (an individual dominates another if it
performs equally well in all objectives and better in at least
one) are assigned a rank of 1. This procedure is repeated for
the remaining population to find individuals with a rank of 2,
then 3 etc. Selection of the best solutions is based on both rank
and crowding distance.
2.2.2. Decision variablesSelection of operational parameters for optimisation is guided
by the results of previous sensitivity analyses (Sweetapple
et al., unpublished results). Parameters identified as
isation range Notes
Max
72,268 BSM2 default � 10% of feasible range
506.5 BSM2 default � 10% of feasible range
24 BSM2 default � 10% of feasible range
24 BSM2 default � 10% of feasible range
2.5 BSM2 default � 10% of feasible range
0.5 BSM2 default � 10% of feasible range
0.5 BSM2 default � 10% of feasible range
10 Based on DO sensor range
240 Based on allowable KLa actuator range
500 Arbitrary range to give appropriately
scaled output
0.0035 Arbitrary range, centred on BSM2 default
1 Selected to ensure KLa3 is within
allowable actuator range
1 Selected to ensure KLa5 is within
allowable actuator range
wat e r r e s e a r c h 5 5 ( 2 0 1 4 ) 5 2e6 256
contributing significantly to variance in effluent quality,
operational cost and/or GHG emissions are either included as
decision variables or dynamically controlled, with the control
parameters and controller tuning parameters also used as
decision variables. Exceptions to this are:
� Carbon source addition rate in the fourth activated sludge
reactor is not optimised despite being classed as sensitive
based on OCI, since adjustment from the base case value
resulted only in an increase in operational costs in one-
factor-at-a-time (OAT) sensitivity analysis.
� Internal recycle flow rate (Qintr) and carbon source addition
rate in the second activated sludge reactor (carb2) are
included despite not being classified as sensitive, since
OAT sensitivity analysis suggests that they can be adjusted
to reduce GHG emissionswith negligible impact on effluent
quality.
All decision variables are listed in Table 2, with details of
their default values and range of values considered for opti-
misation given. Default values, as defined in the BSM2 default
closed loop control strategy (Nopens et al., 2010), represent the
base case (note: despite being a useful reference point, this
control strategy was designed only to provide a starting point
for further development, and not to be optimal in any way).
2.2.3. Optimisation problem formulationsThree different optimisation problem formulations with
different objective sets are implemented in separate optimi-
sation runs, in order to investigate the effectiveness of
different approaches and to enable a comparison of the po-
tential benefits achievable and the associated trade-offs. The
objective sets for the three problem formulations are defined
as follows:
Set X: 1. Minimise OCI
2. Minimise total GHG emissionsSet Y: 1. Minimise OCI
2. Minimise total GHG emissions
3. Minimise EQISet Z: 1. Minimise OCI
2. Minimise total GHG emissions
3. Minimise BOD5
4. Minimise ammonia
5. Minimise nitrogen
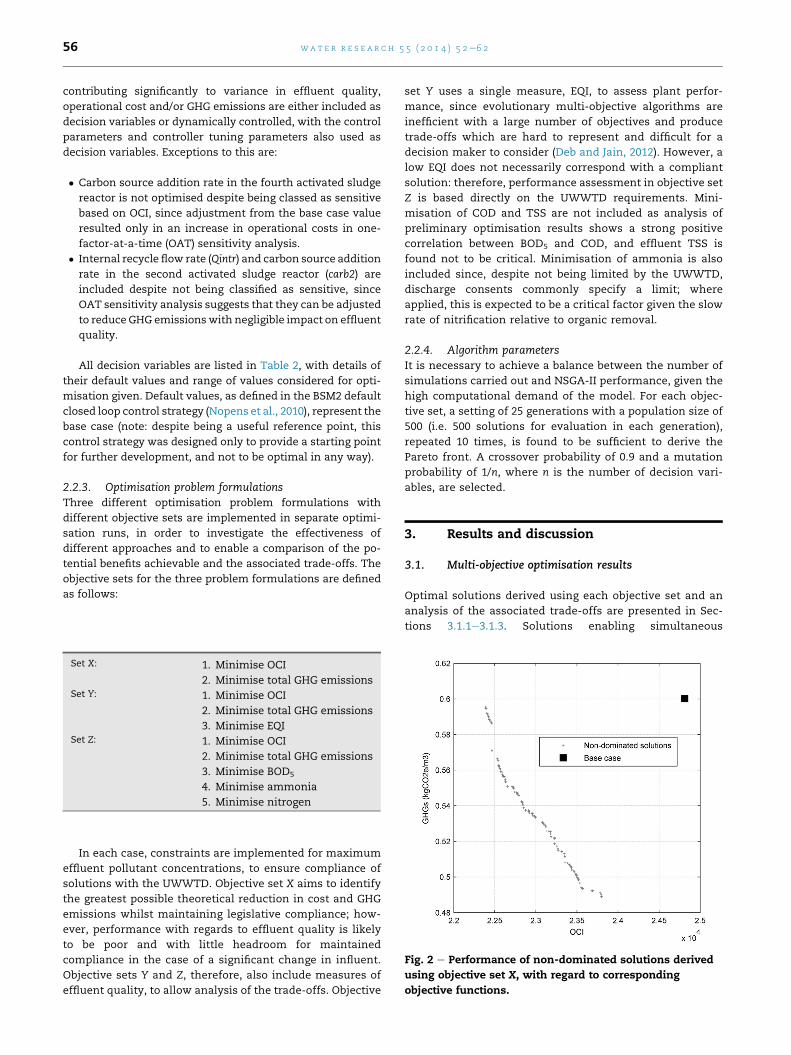
Fig. 2 e Performance of non-dominated solutions derived
using objective set X, with regard to corresponding
objective functions.
In each case, constraints are implemented for maximum
effluent pollutant concentrations, to ensure compliance of
solutions with the UWWTD. Objective set X aims to identify
the greatest possible theoretical reduction in cost and GHG
emissions whilst maintaining legislative compliance; how-
ever, performance with regards to effluent quality is likely
to be poor and with little headroom for maintained
compliance in the case of a significant change in influent.
Objective sets Y and Z, therefore, also include measures of
effluent quality, to allow analysis of the trade-offs. Objective
set Y uses a single measure, EQI, to assess plant perfor-
mance, since evolutionary multi-objective algorithms are
inefficient with a large number of objectives and produce
trade-offs which are hard to represent and difficult for a
decision maker to consider (Deb and Jain, 2012). However, a
low EQI does not necessarily correspond with a compliant
solution: therefore, performance assessment in objective set
Z is based directly on the UWWTD requirements. Mini-
misation of COD and TSS are not included as analysis of
preliminary optimisation results shows a strong positive
correlation between BOD5 and COD, and effluent TSS is
found not to be critical. Minimisation of ammonia is also
included since, despite not being limited by the UWWTD,
discharge consents commonly specify a limit; where
applied, this is expected to be a critical factor given the slow
rate of nitrification relative to organic removal.
2.2.4. Algorithm parametersIt is necessary to achieve a balance between the number of
simulations carried out and NSGA-II performance, given the
high computational demand of the model. For each objec-
tive set, a setting of 25 generations with a population size of
500 (i.e. 500 solutions for evaluation in each generation),
repeated 10 times, is found to be sufficient to derive the
Pareto front. A crossover probability of 0.9 and a mutation
probability of 1/n, where n is the number of decision vari-
ables, are selected.
3. Results and discussion
3.1. Multi-objective optimisation results
Optimal solutions derived using each objective set and an
analysis of the associated trade-offs are presented in Sec-
tions 3.1.1e3.1.3. Solutions enabling simultaneous
wat e r r e s e a r c h 5 5 ( 2 0 1 4 ) 5 2e6 2 57
reduction of GHG emissions and OCI whilst maintaining
legislative compliance were found using each set, but no
solutions also bettering the base case effluent quality were
identified.
3.1.1. Minimising GHG emissions and operational costswhilst retaining complianceThe performance of the base case and non-dominated solu-
tions derived using objective set X is presented in Fig. 2. All
solutions provide a reduction in both GHG emissions and OCI
with respect to the base case and a maximum reduction of
emissions of 18.5% is shown to be achievable with a corre-
sponding 4.1% reduction in operational costs. There is a
distinct trade-off between operational costs and GHG emis-
sions, however, with the lowest emission solutions incurring
the highest operational costs.
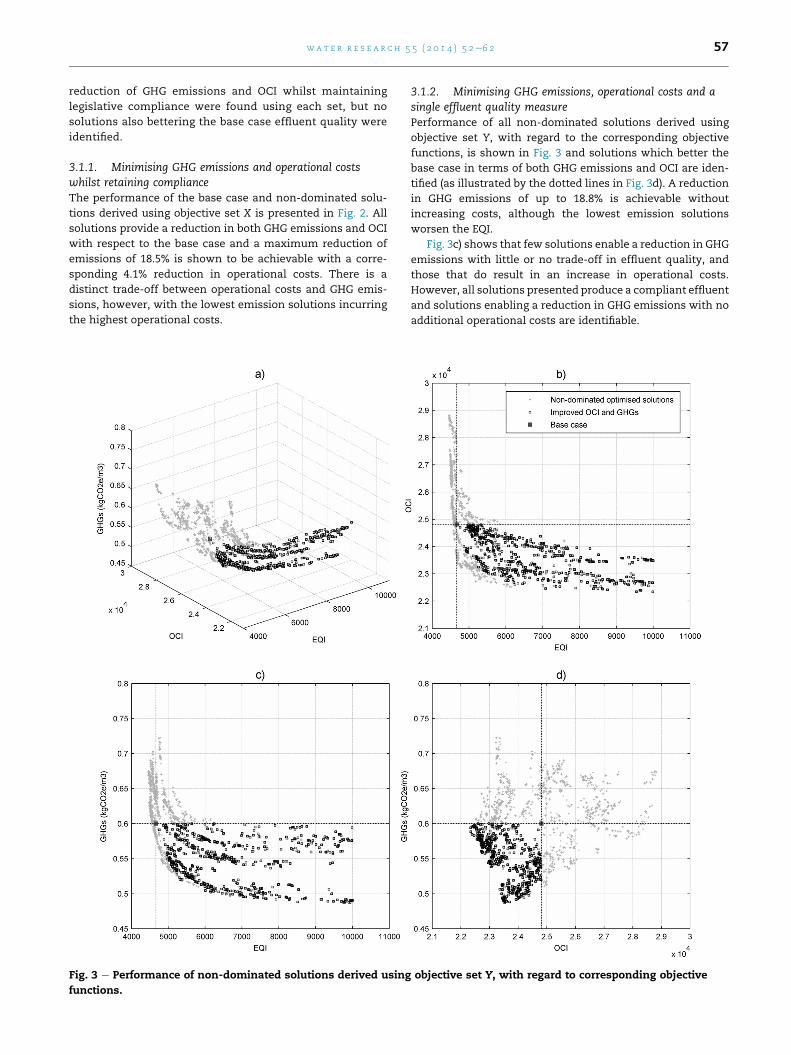
Fig. 3 e Performance of non-dominated solutions derived using
functions.
3.1.2. Minimising GHG emissions, operational costs and asingle effluent quality measurePerformance of all non-dominated solutions derived using
objective set Y, with regard to the corresponding objective
functions, is shown in Fig. 3 and solutions which better the
base case in terms of both GHG emissions and OCI are iden-
tified (as illustrated by the dotted lines in Fig. 3d). A reduction
in GHG emissions of up to 18.8% is achievable without
increasing costs, although the lowest emission solutions
worsen the EQI.
Fig. 3c) shows that few solutions enable a reduction in GHG
emissions with little or no trade-off in effluent quality, and
those that do result in an increase in operational costs.
However, all solutions presented produce a compliant effluent
and solutions enabling a reduction in GHG emissions with no
additional operational costs are identifiable.
objective set Y, with regard to corresponding objective

wat e r r e s e a r c h 5 5 ( 2 0 1 4 ) 5 2e6 258
These results also highlight the importance of considering
the effects on GHG emissions when developing control stra-
tegies: 87.6% of non-dominated solutions which improve the
base case EQI also result in an increase in emissions, sug-
gesting that if reduction of operating costs and improvement
of effluent quality are prioritised in control strategy develop-
ment, emissions may inadvertently be increased. This finding
is supported by the results of scenario analysis by Flores-
Alsina et al. (2011), in which a reduction in EQI was found to
correspond with an increase in GHG emissions in several
control strategies implemented.
3.1.3. Minimising GHG emissions, operational costs andspecific effluent pollutant loadsA pair-wise representation of the performance of all non-
dominated solutions derived using objective set Z with re-
gard to GHGs, OCI, ammonia and total nitrogen is given in
Fig. 4. Of the 2194 solutions presented, 28.9% better the base
case GHG emissions and only 23.0% do so without increasing
costs. The lowest cost solutions offer negligible reduction in
GHG emissions; however, emissions can be reduced by up to
17.4% whilst also cutting the OCI by 3.6%.
The results suggest that, for the control loop studied, a
reduction in GHG emissions and/or OCI corresponds with an
increase in ammonia concentration e and, based on objective
Fig. 4 e Performance of non-dominated solutions derived using o
nitrogen.
set Z, all optimal solutions which improve upon the base case
ammonia concentration result in an increase in both GHG
emissions and OCI. A strong correlation between ammonia
and total nitrogen is also observed and 89.1% of solutions of-
fering a reduction in GHG emissions and operating costs also
increase total nitrogen, although UWWTD compliance is
maintained in all cases. This corresponds with previous
research (Flores-Alsina et al., 2011), in which adjustment of
operational or control parameters to reduce GHG emissions
resulted in a significant increase in ammonia and nitrogen
time in violation. Non-dominated solutions which better the
base case GHG emissions and/or OCI also typically increase
the effluent BOD5, although in all cases the BOD5 is signifi-
cantly below the limit for compliance.
For all effluent quality indicators used in the objective
functions, the solutions providing the lowest pollutant levels
increase GHG emissionswith respect to base case performance,
again highlighting the importance of including assessment of
GHG emissions in the development of control strategies.
3.2. Performance and legislative compliance of optimisedcontrol strategies
Further investigation is required to determine the extent to
which it is necessary to compromise effluent quality if GHG
bjective set Z, with regard to GHGs, OCI, ammonia and total

wat e r r e s e a r c h 5 5 ( 2 0 1 4 ) 5 2e6 2 59
emissions are to be reduced without incurring additional
operational costs, and to identify the most effective objective
set for optimising WWTP control to reduce GHG emissions
whilstmaintaining satisfactory effluent quality and costs. Due
to the constraints set in optimisation, all control strategy so-
lutions presented produce an effluentwhich is fully compliant
with the requirements of the UWWTD during the evaluation
periods considered; however, some solutions are close to
breaching total nitrogen effluent limits and might not, there-
fore, remain compliant throughout an extended evaluation or
under significant system disturbances. Fig. 5, therefore, gives
an overview of the distribution of total nitrogen performance
for the sets of optimised control strategies from each objective
set with respect to the UWWTD requirement, with the base
case value indicated.
Each objective set results in a set of solutions which have a
range of no more than 6% of the compliance limit and are less
than 15%, 46% and 57% of the UWWTD limits for BOD5, COD
and TSS respectively. The most significant difference in the
solutions derived using each objective set is in the nitrogen
concentrations. Objective set X provides a set of solutions
with the lowest GHG emissions and operating costs, but this is
at the expense of elevated effluent nitrogen concentrations;
over 50% of solutions produce an effluentwith a safetymargin
of less than 6% of the UWWTD limit, suggesting that the
likelihood of failure over an extended period is highest for
solutions selected from this set. This may be attributed to
highly optimised control strategies providing insufficient time
and/or unsuitable conditions for adequate removal of nitro-
gen since, for example, bacteria responsible for nitrification of
ammonia grow much more slowly than the heterotrophic
bacteria responsible for removal of organic matter (Metcalf
and Eddy, 1994) and it is observed that, whilst BOD5 concen-
trations are acceptable, ammonia contributes up to 84% of the
high effluent total nitrogen. Optimising tominimise EQI (set Y)
rather than individual effluent concentrations (set Z) gives the
greatest proportion of solutions with a safety margin of at
least 20%.
Overall, control strategy optimisation based on the mini-
misation of GHG emissions and operational costs alone,
subject to legislative compliance, produces a set of solutions
with the poorest effluent quality and the smallest safety
margin. The wider spread of solutions derived from objective
sets Y and Z is likely to be more useful to a decisionmaker, as
these give more choice and allow for a more complete
assessment of necessary trade-offs, depending on the case-
specific priorities. Using a single index to represent effluent
Fig. 5 e Performance distribution of optimised control
strategies bettering base case GHG emissions and OCI.
quality simplifies the comparison and selection of solutions,
and it is shown that, for a fixed number ofmodel evaluations,
optimisation using objective set Y yields solutions of a
similar or better standard (with regard to effluent quality) as
those developed when specific pollutant loadings are
minimised.
3.3. Optimal control strategy designs
To allow further exploration of control strategy features
which contribute to an effective, efficient and low emission
solution, and to demonstrate the effects of optimisation on
dynamic performance, three control strategies are presented
in this section (one derived from each objective set). In each
case, a solution providing a 10% reduction in GHG emissions
without increasing the operational cost is selected. For
objective set Y, the solution with the lowest EQI which fits
these criteria is selected, and for objective set Z, the solution
with the lowest nitrogen, since this is shown to be closest to
the failure limit.
Performance indicators and optimised decision variables
for each solution and the base case are shown in Fig. 6. Deci-
sion variables are normalised within the optimisation range
and performance indicators are normalised within the
compliant range where applicable, else from zero to the
maximum observed value.
Common features in the three optimised control strategies
include:
� Introduction of a low level of aeration in the first two re-
actors, thereby creating aerobic conditions and removing
the conventional anoxic zone
� Decrease in carbon source addition in the first reactor and
an increase in the second (note that only static carbon
source addition rates were considered; additional im-
provements may be achievable with dynamic control to
reflect variations in the influent flow rate and carbon/ni-
trogen ratio deficiency)
� Reduction in controller offset (and therefore in aeration
intensity in the fourth reactor)
� Reduction in KLa3 gain, and therefore in aeration intensity
in the third reactor
� Increase of the controller integral time constant
Low level aeration in the anoxic zone is unconventional
and may not represent operating practice, but optimisation
may have led to solutions with smaller variation in DO con-
centrations of adjacent reactors since transition between
anoxic and aerobic conditions is a key condition leading to
N2O emissions (Law et al., 2012). Low aeration in the anoxic
zone may occur naturally as a side effect of mixing and pre-
vious studies have assumed this to provide a KLa of 2 d�1
(Flores-Alsina et al., 2011); however this would not fully ac-
count for the aeration intensities of up to 24 d�1 in the opti-
mised solutions. Reduction of aeration intensities in the
aerobic reactors in optimised control strategies may be
attributed to the contribution of aeration to GHG emissions
due to the significant associated energy consumption
(Fernandez et al., 2011) and effects on stripping of N2O from
solution (Law et al., 2012).

Fig. 6 e Decision variables and performance indicators for selected optimal solutions providing 10% reduction in GHG
emissions with no increase in OCI.
wat e r r e s e a r c h 5 5 ( 2 0 1 4 ) 5 2e6 260
Optimal values for carb1 and the integral time constant are
at or near the limits of their respective optimisation ranges. As
these ranges do not correspond with physical constraints,
further improvements may be achievable with a lower carb1
value and higher integral time constant.
Fig. 7 e Dynamic performance of selected optimal control strate
during the summer (days 252e259) and winter (days 434e441)
In addition to a 10% reduction in GHG emissions, the re-
sults of these changes include increases in EQI and ammonia
in all cases. Implementation of the objective set X solution
causes the greatest increase in EQI, due to its significantly
elevated nitrogen and ammonia concentrations e solutions
gies with respect to nitrogen, ammonia and GHG emissions
evaluation periods.

wat e r r e s e a r c h 5 5 ( 2 0 1 4 ) 5 2e6 2 61
from objective sets Y and Z are able to provide the same
emission reduction whilst maintaining a better effluent
quality and not increasing costs; this supports the theory that
multi-objective optimisation objectives should include mini-
misation of effluent pollutant loadings in addition to cost and
emission considerations. Representation of the pollutant
loadings by a single measure (as in objective set Y) enables the
required emission reduction to be achieved with no increase
in cost and the smallest impact on effluent quality.
Analysis of the dynamic performance of these control
strategies offers an insight into the source of overall perfor-
mance variations. The rate of GHG emissions through both the
summer and winter evaluation periods is shown in Fig. 7.
Dynamic effluent nitrogen and ammonia concentrations are
also shown since these are of greatest concern and differ
significantly between the solutions.
The rate of GHG emissions fluctuates significantly and is
greatest during the winter period, but there is little to distin-
guish the control strategies. All three proposed strategies yield
small but consistent improvements throughout, with some
greater reductions observed at the points of peak emissions in
the base case. On the basis of these results alone, no one
control strategy is preferable, as all provide the required
emission reduction. Analysis of the dynamic nitrogen and
ammonia concentrations, however, highlights the differences
between the control strategies.
The departure in effluent quality from the base case values
is most distinct in the winter period, and in particular for the
set X solution. This is likely to be due to a combination of the
reduced, optimised DO setpoints resulting in insufficient ox-
ygen for nitrification and the lower temperature reducing the
nitrifier growth rates. Over the winter period, when nitrogen
and ammonia concentrations are higher, the solution from
objective set Y consistently produces effluent with the lowest
nitrogen and ammonia concentrations (of the optimised
control strategies), reinforcing the theory that control strategy
optimisation using a single indicator to represent effluent
quality is preferable. Performance of the set X solution, opti-
mised for just GHG emissions and operational cost, is likely to
be unacceptable as nitrogen concentrations in the winter are
greater than 15 g N/m3 and, in one instance, exceed 25 g N/m3.
Whilst this solution (just) complies with the UWWTD
requirement for an annual mean total nitrogen concentration
of less than 15 g N/m3 based on the two evaluation periods
considered, failure in an extended evaluation is highly likely.
4. Conclusions
This paper has demonstrated the potential of multi-objective
optimisation of WWTP control strategies for the reduction of
GHG emissions in a cost effective manner. Exploration of
different problem formulations for the optimisation process,
investigation into performance trade-offs and analysis of
optimised solutions has led to the following key findings:
� Multi-objective optimisation of WWTP operational pa-
rameters and controller tuning parameters enables a sig-
nificant reduction in GHG emissions without the need for
plant redesign or modification of the control strategy
layout.
� A large range of options are available for reducing GHG
emissions without incurring additional operational costs
which also maintain an acceptable effluent quality.
� GHG emissions may be reduced with no loss in effluent
quality, but this is likely to incur increased operational
costs.
� If operational costs are not to be increased, reduction of
GHG emissions is likely to incur an increase in effluent
nitrogen and ammonia concentrations.
� If control strategies are selected with a preference for high
effluent quality and low costs alone, GHG emissions may
be inadvertently increased. It is, therefore, of key impor-
tance that effects on emissions are considered in control
strategy development and optimisation.
� When using multi-objective optimisation of control stra-
tegies to reduce GHG emissions, it is preferable to include
minimisation of pollutant loadings in the objective func-
tions. However, using a single index to represent effluent
quality is more effective than optimising to minimise
specific pollutants and simplifies comparison of optimal
solutions.
Acknowledgements
Thanks are given for the Matlab/Simulink implementation of
the BSM2 from the Department of Industrial Electrical Engi-
neering and Automation, Lund University, Lund, Sweden.
Christine Sweetapple gratefully acknowledges financial sup-
port provided by the University of Exeter in the form of a
studentship.
Appendix A. Supplementary data
Supplementary data related to this article can be found at
http://dx.doi.org/10.1016/j.watres.2014.02.018.
r e f e r e n c e s
Aboobakar, A., Cartmell, E., Stephenson, T., Jones, M., Vale, P.,Dotro, G., 2013. Nitrous oxide emissions and dissolved oxygenprofiling in a full-scale nitrifying activated sludge treatmentplant. Water Res. 47 (2), 524e534.
Amand, L., Carlsson, B., 2012. Optimal aeration control in anitrifying activated sludge process.WaterRes. 46 (7), 2101e2110.
Beraud, B., Steyer, J.P., Lemoine, C., Latrille, E., Manic, G.,Printemps-Vacquier, C., 2007. Towards a global multi objectiveoptimization of wastewater treatment plant based onmodeling and genetic algorithms. Water Sci. Technol. 56 (9),109e116.
Cosenza, A., Mannina, G., Viviani, G., 2009. Parameter estimationand sensitivity analysis of a nitrogen and phosphorusbiological removal model. In: Combined IMACS WorldCongress/Modelling and Simulation Society-of-Australia-and-New-Zealand (MSSANZ)/18th Biennial Conference onModelling and Simulation, 13e17 July; Cairns, Australia,pp. 3151e3157.

wat e r r e s e a r c h 5 5 ( 2 0 1 4 ) 5 2e6 262
Deb, K., Jain, H., 2012. Handling many-objective problems usingan improved NSGA-II procedure. In: IEEE Congress onComputational Intelligence, 10-15 June; Brisbane, Australia,pp. 1e8.
Deb, K., Pratap, A., Agarwal, S., Meyarivan, T., 2002. A fast andelitist multiobjective genetic algorithm: NSGA-II. IEEE Trans.Evol. Comput. 6 (2), 182e197.
Defra, 2008. Future Water. The Government’s Water Strategy forEngland. Cm. 7319. Stationery Office. http://archive.defra.gov.uk/environment/quality/water/strategy/pdf/future-water.pdf.
European Union, 1991. EC urban waste water treatment directive(91/271/EEC). Official J. Eur. Communities L 135, 40e52.
Fernandez, F.J., Castro, M.C., Rodrigo, M.A., Canizares, P., 2011.Reduction of aeration costs by tuning a multi-set point on/offcontroller: a case study. Control Eng. Pract. 19 (10), 1231e1237.
Flores-Alsina, X., Arnell, M., Amerlinck, Y., Corominas, L.,Gernaey, K.V., Guo, L., Lindblom, E., Nopens, I., Porro, J.,Shaw, A., Snip, L., Vanrolleghem, P.A., Jeppsson, U., 2014.Balancing effluent quality, economic cost and greenhouse gasemissions during the evaluation of (plant-wide) control/operational strategies in WWTPs. Sci. Total Environ. 466e467(0), 616e624.
Flores-Alsina, X., Corominas, L., Snip, L., Vanrolleghem, P.A.,2011. Including greenhouse gas emissions duringbenchmarking of wastewater treatment plant controlstrategies. Water Res. 45 (16), 4700e4710.
Gernaey, K.V., Flores-Alsina, X., Rosen, C., Benedetti, L.,Jeppsson, U., 2011. Dynamic influent pollutant disturbancescenario generation using a phenomenological modellingapproach. Environ. Modell. Softw. 26 (11), 1255e1267.
Guo, L., Martin, C., Nopens, I., Vanrolleghem, P.A., 2012a. Climatechange and WWTPs: controlling greenhouse gas (GHG)emissions and impacts of increased wet weatherdisturbances. In: IWA Nutrient Removal and Recovery 2012:Trends in NRR 23e25 Sept; Harbin, China.
Guo, L., Porro, J., Sharma, K.R., Amerlinck, Y., Benedetti, L.,Nopens, I., Shaw, A., Van Hulle, S.W.H., Yuan, Z.,Vanrolleghem, P.A., 2012b. Towards a benchmarking tool forminimizing wastewater utility greenhouse gas footprints.Water Sci. Technol. 66 (11), 2483e2495.
Henze, M., Gujer, W., Mino, M., Loosdrecht, M., 2000. ActivatedSludge Models ASM1, ASM2, ASM2d, and ASM3. IWA Scientificand Technical Report No. 9. IWA, London.
Jeppsson, U., Pons, M.N., Nopens, I., Alex, J., Copp, J.B.,Gernaey, K.V., Rosen, C., Steyer, J.P., Vanrolleghem, P.A., 2007.Benchmark simulation model no 2: general protocol andexploratory case studies. Water Sci. Technol. 56 (8), 67e78.
Jeppsson, U., Rosen, C., Alex, J., Copp, J., Gernaey, K., Pons, M.N.,Vanrolleghem, P.A., 2006. Towards a benchmark simulationmodel for plant-wide control strategy performance evaluationof WWTPs. Water Sci. Technol. 53 (1), 287e295.
Law, Y., Ye, L., Pan, Y., Yuan, Z., 2012. Nitrous oxide emissionsfrom wastewater treatment processes. Philos. Trans. R. Soc. B.Biol. Sci. 367 (1593), 1265e1277.
Metcalf, Eddy, 1994. Wastewater Engineering: Treatment andReuse. McGraw Hill, New York.
Nopens, I., Benedetti, L., Jeppsson, U., Pons, M.N., Alex, J.,Copp, J.B., Gernaey, K.V., Rosen, C., Steyer, J.P.,Vanrolleghem, P.A., 2010. Benchmark simulation model no 2:finalisation of plant layout and default control strategy. WaterSci. Technol. 62 (9), 1967e1974.
Otterpohl, R., Freund, M., 1992. Dynamic models for clarifiers ofactivated sludge plants with dry and wet weather flows. WaterSci. Technol. 26 (5e6), 1391e1400.
Otterpohl, R., Raak, M., Rolfs, T., 1994. A mathematical model forthe efficiency of the primary clarification. In: 17th IAWQBiennial International Conference, 24e29 July; Budapest,Hungary.
Rothausen, S., Conway, D., 2011. Greenhouse-gas emissions fromenergy use in the water sector. Nat. Clim. Chang. 1 (4),210e219.
Sweetapple, C., Fu, G., Butler, D., 2013. Identifying key sourcesof uncertainty in the modelling of greenhouse gasemissions from wastewater treatment. Water Res. 47 (13),4652e4665.
Sweetapple, C., Fu, G.T., Butler, D. Identifying Sensitive Sourcesand Key Operational Parameters for the Reduction ofGreenhouse Gas Emissions from Wastewater Treatment,unpublished results.
Takacs, I., Patry, G.G., Nolasco, D., 1991. A dynamic model ofthe clarification thickening process. Water Res. 25 (10),1263e1271.
Tomita, R., Park, S., 2009. Evolutionary multi-objectiveoptimization of an activated sludge process. In: 10thInternational Symposium on Process Systems Engineering,16e20 August; Salvador, Brazil, pp. 747e752.
Recommended


![Parametric design and multi-objective optimisation of ... · Parametric design and multi-objective optimisation of containerships ... [18] and consists of ... accordance with the](https://img.pdfslide.us/doc/110x75/5ae8a2817f8b9a08778ff65b/parametric-design-and-multi-objective-optimisation-of-design-and-multi-objective.jpg)