DI
SC
US
SI
ON
P
AP
ER
S
ER
IE
S
Forschungsinstitut zur Zukunft der ArbeitInstitute for the Study of Labor
Moral Hazard and Less Invasive Medical Treatment for Coronary Artery Disease: The Case of Cigarette Smoking
IZA DP No. 8492
September 2014
Jesse MargolisJason HockenberryMichael GrossmanShin-Yi Chou
Moral Hazard and Less Invasive Medical Treatment for Coronary Artery Disease:
The Case of Cigarette Smoking
Jesse Margolis CUNY Graduate Center
Jason Hockenberry Emory University and NBER
Michael Grossman
CUNY Graduate Center, NBER and IZA
Shin-Yi Chou Lehigh University and NBER
Discussion Paper No. 8492 September 2014
IZA
P.O. Box 7240 53072 Bonn
Germany
Phone: +49-228-3894-0 Fax: +49-228-3894-180
E-mail: [email protected]
Any opinions expressed here are those of the author(s) and not those of IZA. Research published in this series may include views on policy, but the institute itself takes no institutional policy positions. The IZA research network is committed to the IZA Guiding Principles of Research Integrity. The Institute for the Study of Labor (IZA) in Bonn is a local and virtual international research center and a place of communication between science, politics and business. IZA is an independent nonprofit organization supported by Deutsche Post Foundation. The center is associated with the University of Bonn and offers a stimulating research environment through its international network, workshops and conferences, data service, project support, research visits and doctoral program. IZA engages in (i) original and internationally competitive research in all fields of labor economics, (ii) development of policy concepts, and (iii) dissemination of research results and concepts to the interested public. IZA Discussion Papers often represent preliminary work and are circulated to encourage discussion. Citation of such a paper should account for its provisional character. A revised version may be available directly from the author.
IZA Discussion Paper No. 8492 September 2014
ABSTRACT
Moral Hazard and Less Invasive Medical Treatment for Coronary Artery Disease: The Case of Cigarette Smoking*
Comparisons of the effectiveness of two common procedures for Coronary Artery Disease: Percutaneous Coronary Intervention (PCI) and Coronary Artery Bypass Graft (CABG). Evidence indicates that CABG – the more invasive procedure – leads to superior long term outcomes for otherwise similar patients, though there is little consensus as to why. In this article, we propose a novel explanation: patient offsetting behavior. We hypothesize that patients who undergo the more invasive procedure, CABG, are more likely to improve their behavior – eating, exercise, smoking, and drinking – in a way that increases longevity. To test our hypothesis, we use Medicare records linked to the National Health Interview Survey to study one such behavior: smoking. We find that CABG patients are 12 percentage points more likely to quit smoking in the one-year period immediately surrounding their procedure than PCI patients, a result that is robust to alternative specifications.
HIGHLIGHTS
• Coronary Artery Disease accounts for one in seven deaths in the U.S. • Bypass surgery leads to better long term outcomes than angioplasty. • The former procedure is much more invasive than the latter. • Patients who undergo bypass surgery may be more likely to change their behavior. • They are 12 percentage points more likely to quit smoking following surgery.
JEL Classification: I10, I12 Keywords: coronary artery disease, moral hazard, smoking Corresponding author: Michael Grossman Ph.D. Program in Economics City University of New York Graduate Center 365 Fifth Avenue, 5th Floor New York, NY, 10016-4309 USA E-mail: [email protected]
* Research for this paper was supported by grant number 5R21 AG033876 from the National Institute on Aging and the Office of Behavioral and Social Sciences Research to the National Bureau of Economic Research. This paper was presented at seminars at the University of Chicago, the University of Illinois at Chicago, Johns Hopkins University, the University of Melbourne, the Ohio State University, and the University of Connecticut. It also was presented at the 2013 Bureau of the Census Research Data Centers Conference at the Federal Reserve Bank of Atlanta, at the 2014 spring meeting of the National Bureau of Economic Research Health Economics Program, and at the Fifth Biennial Conference of the American Society of Health Economists at the University of Southern California in June 2014. We would like to thank the participants in those forums for helpful comments and suggestions. We also would like to thank Peter Cram and John O’Grady for their medical insights and Sandra Decker for her advice on working with the linked NHIS/Medicare data. We are indebted to Jonathan Fisher, Research Data Center (RDC) Administrator at the New York Bureau of the Census RDC at Baruch College, and Frances McCarty, Senior Service Fellow at the National Center for Health Statistics RDC, for their assistance in helping us to gain access to and work with restricted files from the National Health Interview Survey.
1
Moral Hazard and Less Invasive Medical Treatment for Coronary Artery Disease: The Case of Cigarette Smoking
I. Introduction
Coronary Artery Disease (CAD) is a common and deadly disease. In 2010, over 350,000
people died of CAD in the United States, making the disease responsible for roughly one in
seven deaths (Murphy, Xu, and Kochanek, 2012). CAD is caused by a buildup of plaque on the
arterial walls leading to the heart, resulting in reduced blood flow. If the buildup is not checked,
CAD can result in an acute myocardial infarction (AMI, a.k.a. “heart attack”) due to insufficient
oxygen reaching the heart.
A number of medical treatments are available to patients with CAD. First, and least
invasive, is “medical management.” Medical management involves non-surgical treatment
including prescription medication, lifestyle modification, and frequent monitoring. The second
treatment is a revascularization procedure known as Percutaneous Coronary Intervention (PCI,
commonly referred to as angioplasty). A doctor (usually an interventional cardiologist)
performing PCI makes a small incision and arthroscopically inserts and inflates a balloon at the
site of the lesion to expand the vessel. PCI in the modern era usually involves the placement of a
wire mesh stent at the blockage site, which assists in keeping the arterial walls expanded to
maintain blood flow. The PCI procedure takes approximately 60 minutes and the patient usually
spends one night in the hospital.1 The third and generally most invasive treatment is Coronary
Artery Bypass Graft (CABG)2, a major surgical procedure that involves harvesting a section of
vessel from a different area of the body (either vessels in the groin or chest wall), opening the
1 http://www.medicinenet.com/coronary_artery_bypass_graft/article.htm (accessed 5/31/12) 2 Less invasive CABG procedures have been in development and increasing use in recent years, though these were very infrequent during the period we examine.
2
chest cavity via a sternectomy, and connecting one healthy part of the diseased artery to another,
surgically bypassing the lesion. CABG surgery takes approximately four hours and patients
generally spend at least a week recovering in the hospital.3
Of the two procedures, PCI is the more recent, having been initially used in the late
1970s, more than a decade after CABG was first performed. Its use expanded rapidly upon FDA
approval of the coronary stent in 1994 (Cutler and Huckman, 2003). By 2010, the CDC
estimated that there were 954,000 PCI procedures and 395,000 CABG procedures performed in
the United States, with roughly half of them performed in patients over 65 (CDC, 2010).4
Since the development of PCI, there have been numerous studies comparing the
effectiveness of the two procedures in various populations (see Hlatky et al., 2009, Weintraub et
al., 2012, and Mohr et al., 2013 for three recent studies that summarize prior research). While
the results vary, the emerging consensus is that CABG patients have worse short-run outcomes
than similar PCI patients – partly due to higher perioperative mortality – but better long term
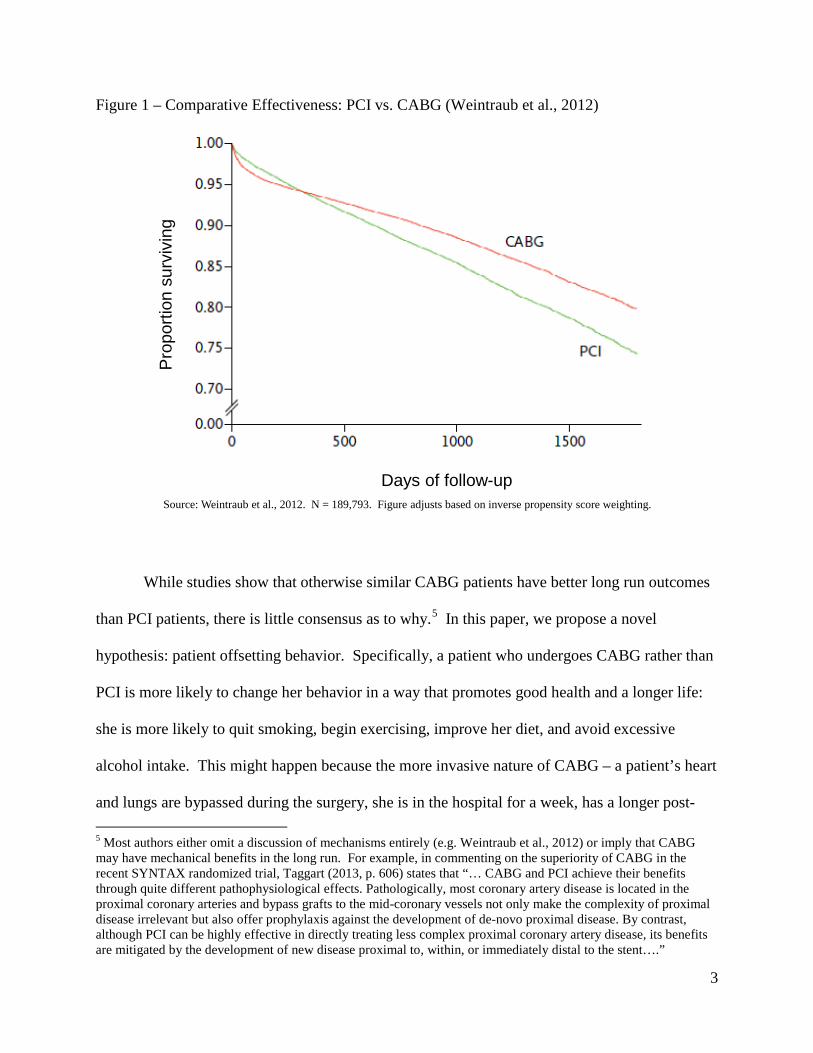
outcomes. Results from a large observational study (Weintraub et al., 2012) are reproduced in
Figure 1, showing that the survival curve for CABG patients is initially lower than for PCI
patients, but that this trend is reversed a year or more after the procedure. A meta-analysis of ten
randomized controlled trials shows a similar pattern (Hlatky et al., 2009).
3 http://www.medicinenet.com/coronary_angioplasty/article.htm (accessed 5/31/12) 4 These counts are based on ICD-9-CM procedure codes beginning with 361 for CABG and 0066, 3606, and 3607 for PCI. Note that the PCI codes used by the CDC to estimate the number of procedures are slightly different than those we use to identify PCI patients in our main analysis.
3
Figure 1 – Comparative Effectiveness: PCI vs. CABG (Weintraub et al., 2012)
While studies show that otherwise similar CABG patients have better long run outcomes
than PCI patients, there is little consensus as to why.5 In this paper, we propose a novel
hypothesis: patient offsetting behavior. Specifically, a patient who undergoes CABG rather than
PCI is more likely to change her behavior in a way that promotes good health and a longer life:
she is more likely to quit smoking, begin exercising, improve her diet, and avoid excessive
alcohol intake. This might happen because the more invasive nature of CABG – a patient’s heart
and lungs are bypassed during the surgery, she is in the hospital for a week, has a longer post- 5 Most authors either omit a discussion of mechanisms entirely (e.g. Weintraub et al., 2012) or imply that CABG may have mechanical benefits in the long run. For example, in commenting on the superiority of CABG in the recent SYNTAX randomized trial, Taggart (2013, p. 606) states that “… CABG and PCI achieve their benefits through quite different pathophysiological effects. Pathologically, most coronary artery disease is located in the proximal coronary arteries and bypass grafts to the mid-coronary vessels not only make the complexity of proximal disease irrelevant but also offer prophylaxis against the development of de-novo proximal disease. By contrast, although PCI can be highly effective in directly treating less complex proximal coronary artery disease, its benefits are mitigated by the development of new disease proximal to, within, or immediately distal to the stent….”
Source: Weintraub et al., 2012. N = 189,793. Figure adjusts based on inverse propensity score weighting.
Prop
ortio
n su
rviv
ing
Days of follow-up
4
operative recovery period, and is left with a major scar and residual pain from the sternectomy –
sends a stronger signal to the patient that she has a serious health problem.
This hypothesis is consistent with a prior economic research on moral hazard, showing
that individuals change their behavior when their perceived risks change. Peltzman’s (1975)
study of the effects of automobile safety regulation is a classic and seminal example. He
develops a model in which the legal mandate to install various safety devices on automobiles
lowers the price of fast and reckless driving because it lowers the probability that the driver will
die in an accident. Hence the demand for this activity rises. Empirically, he finds that the
increase in this offsetting behavior (reckless driving) is so large that the regulations at issue had
little impact on highway deaths and actually increased pedestrian deaths. More recently, Dave
and Kaestner (2009) investigate the impact of health insurance access on health behaviors of the
elderly, showing that access to Medicare at age 65 leads to a reduction in preventative behaviors
and an increase in risky health behavior amongst the elderly. Peltzman (2011) demonstrates how
medical technology breakthroughs can lead to offsetting behavior by showing that the age
cohorts that benefited the most from the introduction of antibiotics experienced worse mortality
rates from risky health behaviors. Kaestner, Darden, and Lakdawalla (2014) find that the use of
statins leads to a small increase in body mass index and moderate (20–33%) increases in the
probability of being obese, possibly because it changes the user’s perceived risk of consuming
high calorie fattening foods.
In this study, we test one potential behavioral response to surgery – smoking – and see
results consistent with patient offsetting behavior. Patients who undergo CABG – the more
invasive procedure – are 12 percentage points more likely to quit smoking than PCI patients.
5
Our results are robust to a number of different specifications, including a simple grouped-by-year
regression using 11 observations, done in the spirit of Donald and Lang (2007).
II. Data
We use individual Medicare data merged with responses from the National Health
Interview Survey (NHIS). The Medicare records identify those patients who have been
diagnosed with CAD and show which of them have undergone PCI or CABG, along with the
exact date of each diagnoses and procedure. The Medicare data also allow us to control for
disease severity and other conditions that might be correlated with procedure type and induce
quitting, such as a myocardial infarction (a.k.a. “heart attack”). The NHIS provides information
on smoking and quitting behavior, as well as individual characteristics.
The Medicare data are provided by the Center for Medicare and Medicaid Services
(CMS). To identify CAD patients and the type of treatment they underwent, we use the
Medicare Standard Analytical Files, including the Inpatient, Outpatient, Skilled Nursing Facility,
Carrier, Durable Medical Equipment, Home Health Agency, and Hospice claims files. These
files contain one or more records for each individual.6 Each record contains the ICD-9-CM
codes for all diagnoses made and procedures performed during that stay or claim. We identify
CAD patients as those who have at least one diagnosis code beginning with 410, 411, 412, 413,
or 414. We identify PCI patients as those CAD patients with at least one procedure code
beginning with 0066, 3601, 3602, 3605, or 3606. We identify CABG patients as those CAD
6 A single record in the Inpatient file corresponds to a stay in a hospital. A single record in the Skilled Nursing Facility file corresponds to a stay in a Skilled Nursing Facility. A single record in the Outpatient file corresponds to a claim by an institutional outpatient provider (Hospital outpatient clinic, rural health clinics, etc.). A single record in the Carrier claim file corresponds to a claim by a non-institutional outpatient provider (physicians, physician assistants, etc.)

6
patients with procedure codes beginning with 361.7 Finally, we identify medically managed
patients as those patients who have been diagnosed with CAD, but do not have a concurrent or
subsequent PCI or CABG procedure.8
The NHIS is an annual survey of approximately 85,000 individuals in over 30,000 U.S.
households run by the National Center for Health Statistics (NCHS), part of the Centers for
Disease Control and Prevention (CDC). All participants are asked questions about their general
state of health and disability. Each year, a subset of approximately 30,000 individuals is asked
about their smoking habits. These respondents are asked if they have ever smoked 100 cigarettes
in their life. For those who say yes, they are asked if they currently smoke every day, some days,
or not at all. If they do not currently smoke, they are asked when they quit, a question they can
answer in days, weeks, months, or years. We use the responses to these questions to create a
synthetic panel, identifying whether a person smoked on each date prior to their NHIS interview.
Each person is categorized as either an always smoker, a never smoker, or a quitter who smoked
up to the day she reports quitting.9
The individual NHIS responses have been linked to Medicare data by the CDC and CMS
and made available as a restricted-use dataset to researchers. The linkage is based on social
security number, date of birth, and gender. To be linked, the data must match on all three fields.
To date, the CDC and CMS have linked the 1994-1998 NHIS surveys to Medicare data from
1991-2007 and the 1999-2005 NHIS surveys to Medicare data from 1999-2007. The linkage is
described further in the appendix.
7 For both PCI and CABG, we exclude the small number of patients who do not have a concurrent or prior CAD diagnosis. 8 A patient who is diagnosed with CAD before her NHIS interview date and has PCI or CABG after her NHIS interview date is counted as medically managed at the time of the NHIS interview.. 9 This categorization vastly over-simplifies the complexity of smoking and quitting behavior, but still allows us to investigate our key question: what is the difference in quitting behavior between CAD patients undergoing medical management, PCI, and CABG.
7
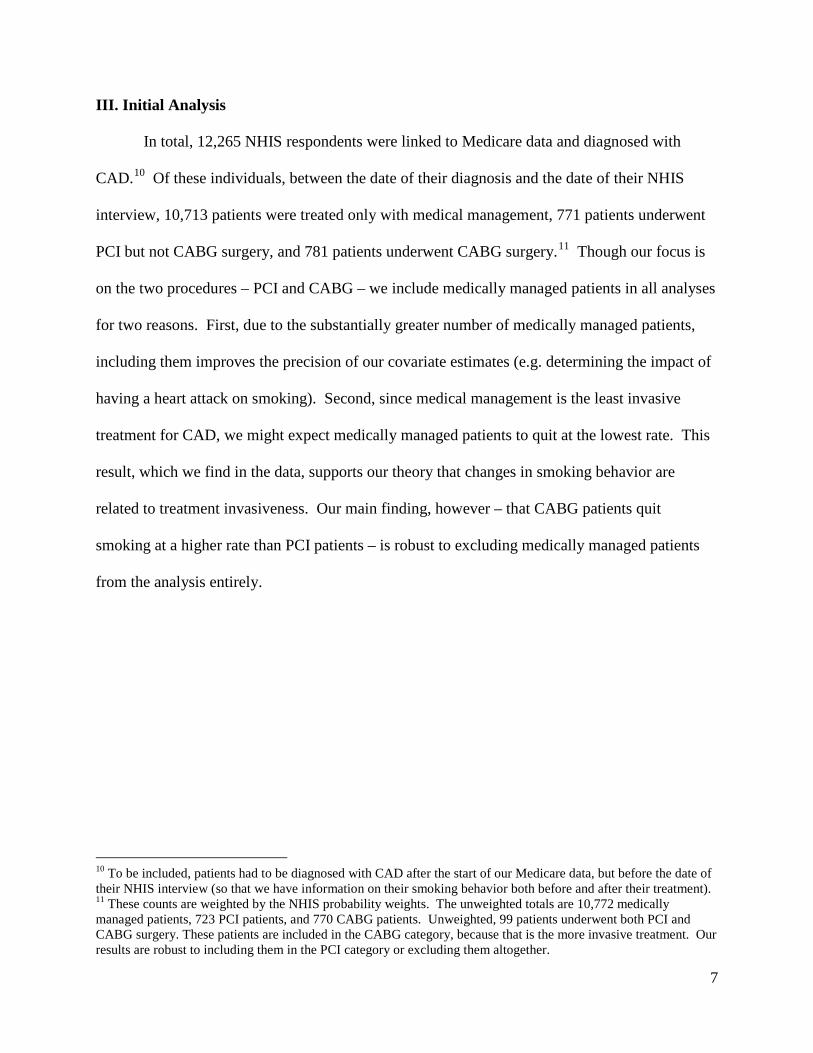
III. Initial Analysis
In total, 12,265 NHIS respondents were linked to Medicare data and diagnosed with
CAD.10 Of these individuals, between the date of their diagnosis and the date of their NHIS
interview, 10,713 patients were treated only with medical management, 771 patients underwent
PCI but not CABG surgery, and 781 patients underwent CABG surgery.11 Though our focus is
on the two procedures – PCI and CABG – we include medically managed patients in all analyses
for two reasons. First, due to the substantially greater number of medically managed patients,
including them improves the precision of our covariate estimates (e.g. determining the impact of
having a heart attack on smoking). Second, since medical management is the least invasive
treatment for CAD, we might expect medically managed patients to quit at the lowest rate. This
result, which we find in the data, supports our theory that changes in smoking behavior are
related to treatment invasiveness. Our main finding, however – that CABG patients quit
smoking at a higher rate than PCI patients – is robust to excluding medically managed patients
from the analysis entirely.
10 To be included, patients had to be diagnosed with CAD after the start of our Medicare data, but before the date of their NHIS interview (so that we have information on their smoking behavior both before and after their treatment). 11 These counts are weighted by the NHIS probability weights. The unweighted totals are 10,772 medically managed patients, 723 PCI patients, and 770 CABG patients. Unweighted, 99 patients underwent both PCI and CABG surgery. These patients are included in the CABG category, because that is the more invasive treatment. Our results are robust to including them in the PCI category or excluding them altogether.
8
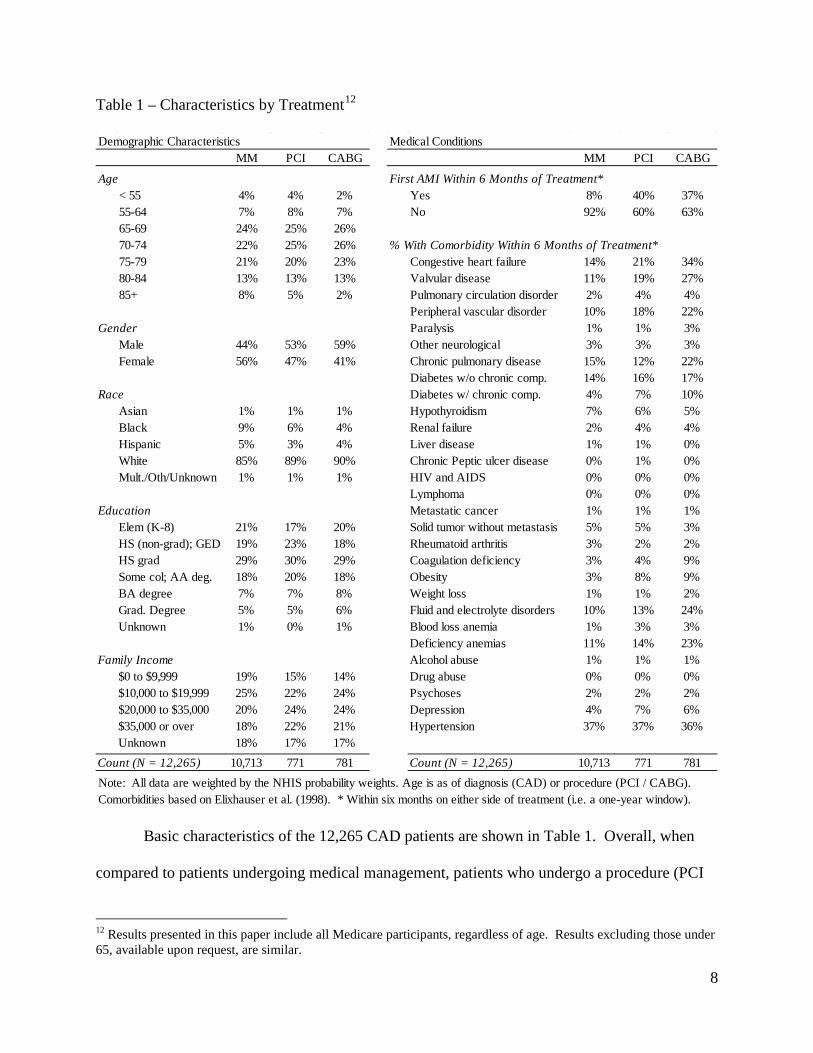
Table 1 – Characteristics by Treatment12
Basic characteristics of the 12,265 CAD patients are shown in Table 1. Overall, when
compared to patients undergoing medical management, patients who undergo a procedure (PCI
12 Results presented in this paper include all Medicare participants, regardless of age. Results excluding those under 65, available upon request, are similar.
Demographic Characteristics Medical ConditionsMM PCI CABG MM PCI CABG
Age First AMI Within 6 Months of Treatment*< 55 4% 4% 2% Yes 8% 40% 37%55-64 7% 8% 7% No 92% 60% 63%65-69 24% 25% 26%70-74 22% 25% 26% % With Comorbidity Within 6 Months of Treatment*75-79 21% 20% 23% Congestive heart failure 14% 21% 34%80-84 13% 13% 13% Valvular disease 11% 19% 27%85+ 8% 5% 2% Pulmonary circulation disorder 2% 4% 4%
Peripheral vascular disorder 10% 18% 22%Gender Paralysis 1% 1% 3%
Male 44% 53% 59% Other neurological 3% 3% 3%Female 56% 47% 41% Chronic pulmonary disease 15% 12% 22%
Diabetes w/o chronic comp. 14% 16% 17%Race Diabetes w/ chronic comp. 4% 7% 10%
Asian 1% 1% 1% Hypothyroidism 7% 6% 5%Black 9% 6% 4% Renal failure 2% 4% 4%Hispanic 5% 3% 4% Liver disease 1% 1% 0%White 85% 89% 90% Chronic Peptic ulcer disease 0% 1% 0%Mult./Oth/Unknown 1% 1% 1% HIV and AIDS 0% 0% 0%
Lymphoma 0% 0% 0%Education Metastatic cancer 1% 1% 1%
Elem (K-8) 21% 17% 20% Solid tumor without metastasis 5% 5% 3%HS (non-grad); GED 19% 23% 18% Rheumatoid arthritis 3% 2% 2%HS grad 29% 30% 29% Coagulation deficiency 3% 4% 9%Some col; AA deg. 18% 20% 18% Obesity 3% 8% 9%BA degree 7% 7% 8% Weight loss 1% 1% 2%Grad. Degree 5% 5% 6% Fluid and electrolyte disorders 10% 13% 24%Unknown 1% 0% 1% Blood loss anemia 1% 3% 3%
Deficiency anemias 11% 14% 23%Family Income Alcohol abuse 1% 1% 1%
$0 to $9,999 19% 15% 14% Drug abuse 0% 0% 0%$10,000 to $19,999 25% 22% 24% Psychoses 2% 2% 2%$20,000 to $35,000 20% 24% 24% Depression 4% 7% 6%$35,000 or over 18% 22% 21% Hypertension 37% 37% 36%Unknown 18% 17% 17%
Count (N = 12,265) 10,713 771 781 Count (N = 12,265) 10,713 771 781Note: All data are weighted by the NHIS probability weights. Age is as of diagnosis (CAD) or procedure (PCI / CABG). Comorbidities based on Elixhauser et al. (1998). * Within six months on either side of treatment (i.e. a one-year window).
9
or CABG) are more likely to be younger, male, and white. PCI and CABG patients appear to
have largely similar demographic characteristics, though CABG patients are somewhat more
likely to be male. When comparing medical conditions, both PCI and CABG patients are
substantially more likely than medically managed patients to have had their first Acute
Myocardial Infarction (AMI, a.k.a. “heart attack”) within six months of initiating treatment. A
number of other comorbidities – including congestive heart failure and valvular disease – show
up most frequently in CABG patients, followed by PCI patients. In some of our regression
specifications, we control for the covariates shown in Table 1.
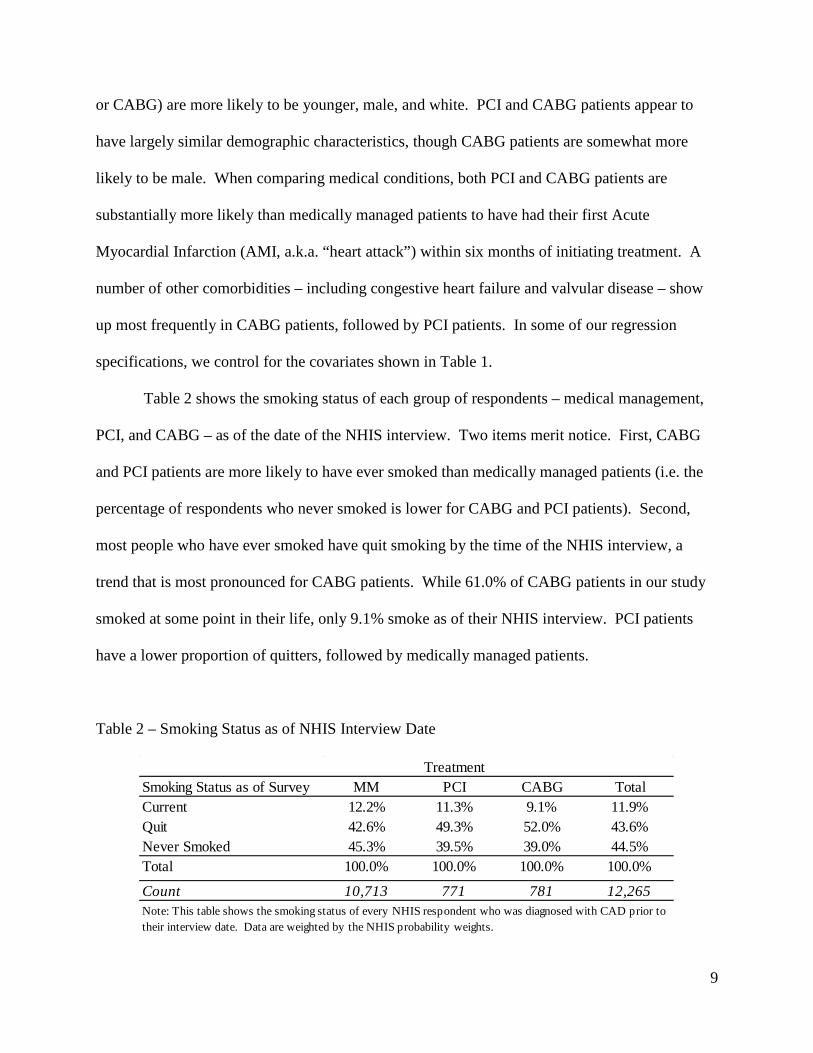
Table 2 shows the smoking status of each group of respondents – medical management,
PCI, and CABG – as of the date of the NHIS interview. Two items merit notice. First, CABG
and PCI patients are more likely to have ever smoked than medically managed patients (i.e. the
percentage of respondents who never smoked is lower for CABG and PCI patients). Second,
most people who have ever smoked have quit smoking by the time of the NHIS interview, a
trend that is most pronounced for CABG patients. While 61.0% of CABG patients in our study
smoked at some point in their life, only 9.1% smoke as of their NHIS interview. PCI patients
have a lower proportion of quitters, followed by medically managed patients.
Table 2 – Smoking Status as of NHIS Interview Date
Smoking Status as of Survey MM PCI CABG TotalCurrent 12.2% 11.3% 9.1% 11.9%Quit 42.6% 49.3% 52.0% 43.6%Never Smoked 45.3% 39.5% 39.0% 44.5%Total 100.0% 100.0% 100.0% 100.0%
Count 10,713 771 781 12,265
Treatment
Note: This table shows the smoking status of every NHIS respondent who was diagnosed with CAD prior to their interview date. Data are weighted by the NHIS probability weights.
10
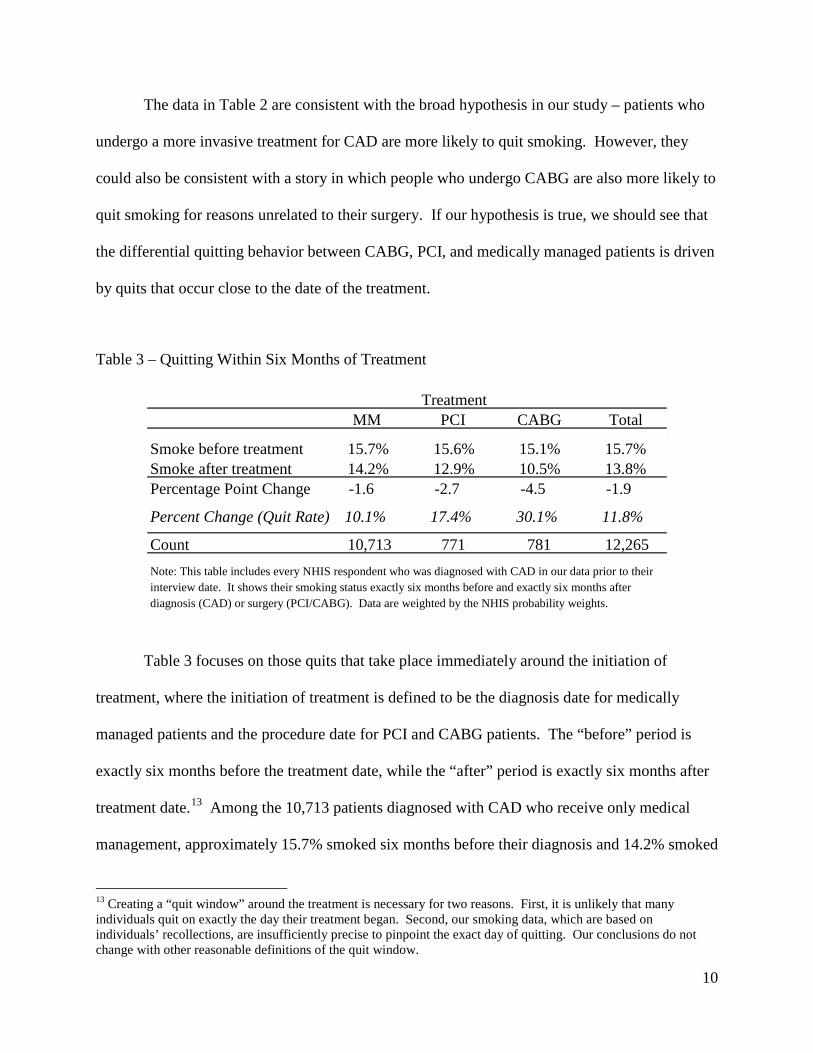
The data in Table 2 are consistent with the broad hypothesis in our study – patients who
undergo a more invasive treatment for CAD are more likely to quit smoking. However, they
could also be consistent with a story in which people who undergo CABG are also more likely to
quit smoking for reasons unrelated to their surgery. If our hypothesis is true, we should see that
the differential quitting behavior between CABG, PCI, and medically managed patients is driven
by quits that occur close to the date of the treatment.
Table 3 – Quitting Within Six Months of Treatment
Table 3 focuses on those quits that take place immediately around the initiation of
treatment, where the initiation of treatment is defined to be the diagnosis date for medically
managed patients and the procedure date for PCI and CABG patients. The “before” period is
exactly six months before the treatment date, while the “after” period is exactly six months after
treatment date.13 Among the 10,713 patients diagnosed with CAD who receive only medical
management, approximately 15.7% smoked six months before their diagnosis and 14.2% smoked
13 Creating a “quit window” around the treatment is necessary for two reasons. First, it is unlikely that many individuals quit on exactly the day their treatment began. Second, our smoking data, which are based on individuals’ recollections, are insufficiently precise to pinpoint the exact day of quitting. Our conclusions do not change with other reasonable definitions of the quit window.
MM PCI CABG Total
Smoke before treatment 15.7% 15.6% 15.1% 15.7% Smoke after treatment 14.2% 12.9% 10.5% 13.8% Percentage Point Change -1.6 -2.7 -4.5 -1.9
Percent Change (Quit Rate) 10.1% 17.4% 30.1% 11.8%
Count 10,713 771 781 12,265
Treatment
Note: This table includes every NHIS respondent who was diagnosed with CAD in our data prior to their interview date. It shows their smoking status exactly six months before and exactly six months after diagnosis (CAD) or surgery (PCI/CABG). Data are weighted by the NHIS probability weights.
11
six months after their diagnosis. The quitters represent a 1.6 percentage point reduction in the
number of smokers and a 10.1 percent reduction. The corresponding numbers for PCI are a 2.7
percentage point reduction and a 17.4 percent reduction. For CABG, they are a 4.5 percentage
point reduction and a 30.1 percent reduction.
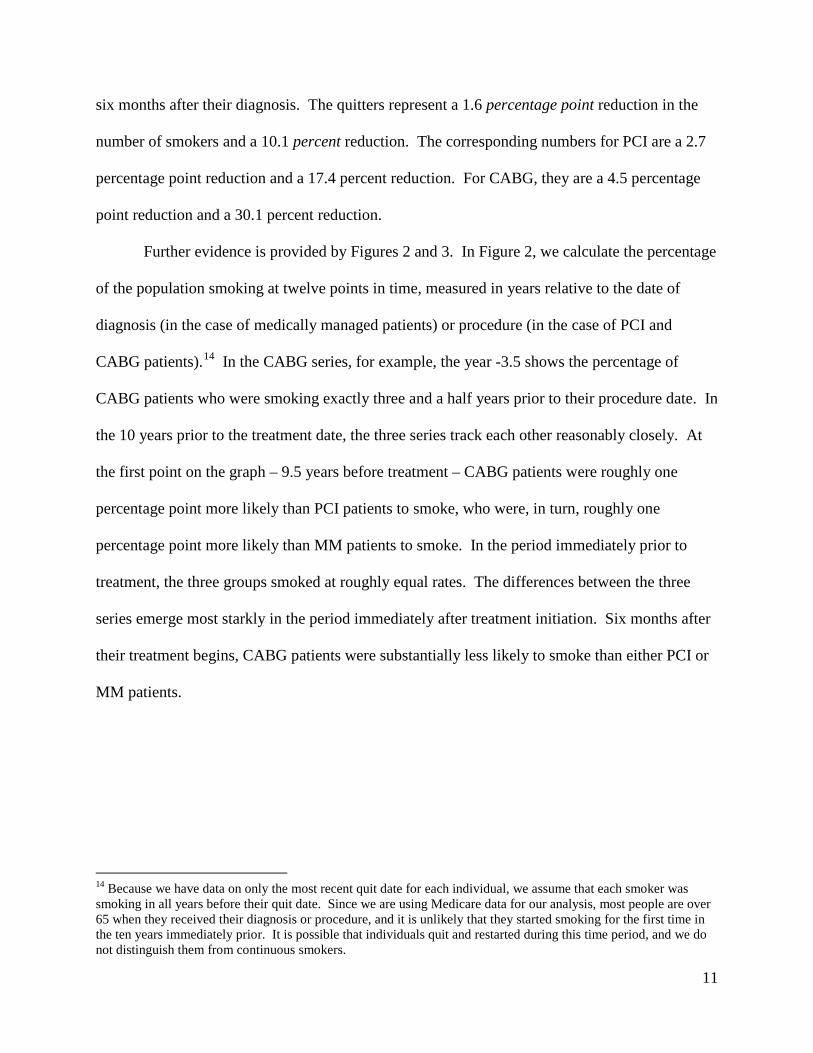
Further evidence is provided by Figures 2 and 3. In Figure 2, we calculate the percentage
of the population smoking at twelve points in time, measured in years relative to the date of
diagnosis (in the case of medically managed patients) or procedure (in the case of PCI and
CABG patients).14 In the CABG series, for example, the year -3.5 shows the percentage of
CABG patients who were smoking exactly three and a half years prior to their procedure date. In
the 10 years prior to the treatment date, the three series track each other reasonably closely. At
the first point on the graph – 9.5 years before treatment – CABG patients were roughly one
percentage point more likely than PCI patients to smoke, who were, in turn, roughly one
percentage point more likely than MM patients to smoke. In the period immediately prior to
treatment, the three groups smoked at roughly equal rates. The differences between the three
series emerge most starkly in the period immediately after treatment initiation. Six months after
their treatment begins, CABG patients were substantially less likely to smoke than either PCI or
MM patients.
14 Because we have data on only the most recent quit date for each individual, we assume that each smoker was smoking in all years before their quit date. Since we are using Medicare data for our analysis, most people are over 65 when they received their diagnosis or procedure, and it is unlikely that they started smoking for the first time in the ten years immediately prior. It is possible that individuals quit and restarted during this time period, and we do not distinguish them from continuous smokers.
12
Figure 2 – Smoking Rate by Year Relative to Diagnosis (MM) or Procedure (PCI & CABG)
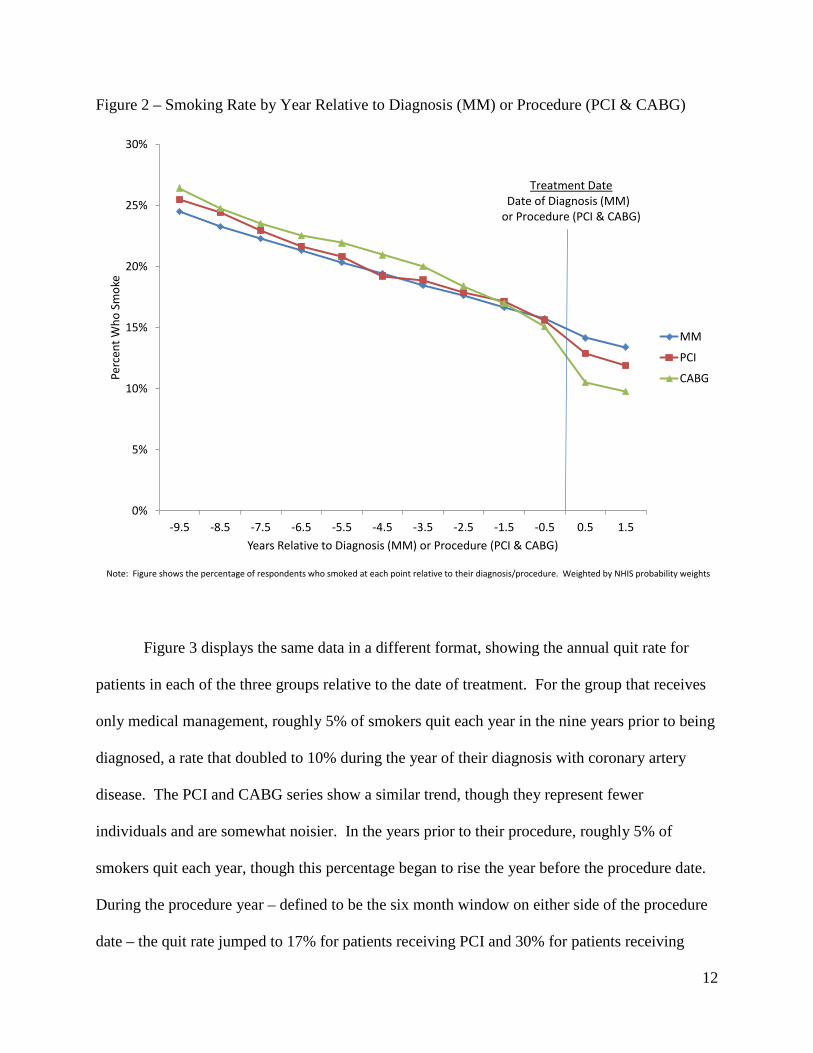
Figure 3 displays the same data in a different format, showing the annual quit rate for
patients in each of the three groups relative to the date of treatment. For the group that receives
only medical management, roughly 5% of smokers quit each year in the nine years prior to being
diagnosed, a rate that doubled to 10% during the year of their diagnosis with coronary artery
disease. The PCI and CABG series show a similar trend, though they represent fewer
individuals and are somewhat noisier. In the years prior to their procedure, roughly 5% of
smokers quit each year, though this percentage began to rise the year before the procedure date.
During the procedure year – defined to be the six month window on either side of the procedure
date – the quit rate jumped to 17% for patients receiving PCI and 30% for patients receiving
0%
5%
10%
15%
20%
25%
30%
-9.5 -8.5 -7.5 -6.5 -5.5 -4.5 -3.5 -2.5 -1.5 -0.5 0.5 1.5
Perc
ent W
ho S
mok
e
Years Relative to Diagnosis (MM) or Procedure (PCI & CABG)
MM
PCI
CABG
Treatment DateDate of Diagnosis (MM)
or Procedure (PCI & CABG)
Note: Figure shows the percentage of respondents who smoked at each point relative to their diagnosis/procedure. Weighted by NHIS probability weights
13
CABG. In the year following treatment, the quit rate for all three groups dropped back to
approximately 5%. Figures 2 and 3 provide reasonably compelling evidence that at least a
portion of the increased quit rate for more invasive treatments observed in Table 2 is related to
treatment received, and not simply a spurious correlation.
Figure 3 – Quit Rate by Year Relative to Diagnosis (MM) or Procedure (PCI & CABG)
IV. Results
To further explore the relationship between treatment for coronary artery disease and
smoking behavior, we fit two related models of quitting smoking. The first is a discrete time
linear probability hazard function with 11 periods: 9 before treatment and 2 after. We fit the
0%
5%
10%
15%
20%
25%
30%
35%
-9 -8 -7 -6 -5 -4 -3 -2 -1 0 1
Perc
ent o
f Rem
aini
ng S
mok
ers W
ho Q
uit
Years Relative to Diagnosis (MM) or Procedure (PCI & CABG)
MM
PCI
CABG
Treatment Date Date of Diagnosis (MM) or
Procedure (PCI & CABG)
Note: figure shows the % of remaining smokers who quit at each point relative to their diagnosis/procedure. Weighted by the NHIS probability weights

14
model using individual data, allowing us to control for time-varying events – like CAD diagnosis
or a patient’s first AMI – that may occur prior to, concurrent with, or after a PCI or CABG
procedure.15 The second model is a multi-period quit function using grouped data, inspired by
Donald and Lang (2007). In this model, we build a synthetic panel, grouping the individual data
by period and treatment type into 33 cells (3 treatment types and 11 periods), and run difference-
in-differences regressions with 11 data points.
Before presenting the results of these models, it is useful to point out the relationship
between a smoking participation function and a quit function. As an identity16
,q1ss
t1t
t −≡−
(1)
where st and st-1 are the smoking participation rates in periods t and t-1, respectively, and qt is the
quit rate in the window defined by periods t and t-1. All rates are defined as fractions and can be
interpreted as probabilities at the individual level. Take natural logarithms of the identity to
obtain
.)1(lnln1
ttt
t qqss
−≅−≡−
(2)
15 In this study, CAD diagnosis cannot occur after a PCI or CABG procedure, since we delete any PCI or CABG patients who did not have a prior or concurrent CAD diagnosis in our data. 16 Let St be the number of smokers in period t, and let St-1 be the number of smokers in period t-1. Let Qt be the
number of quitters in period t (the number who smoke in period t-1 but do not smoke in period t). Assume as is the
case in our data that there are no starters or re-starters. Then
St ≡ St-1 - Qt.
Divide both sides of the identity by N, the size of the population:
.N
SSQ
NS
NS 1t
1t
t1tt −
−
− −≡
Solve the last identity for
NSNS
1t
t
−
to obtain equation (1).
15
The approximation in the last part of equation (2) is better for smaller values of q (q ≤ 0.2 is
generally used as a rule of thumb). However, even for a quit rate as large as 0.3 (the largest rate
in our data), ln(1 – q) = - 0.350, which is close to 0.3. Equation (2) indicates that a regression in
which the first difference of the log of smoking participation is the dependent variable should
have approximately the same coefficients with the signs reversed as one in which the quit rate is
the dependent variable. It also suggests that it is useful to begin with a log smoking participation
function to arrive at a specification of a quit function. In particular, if the log smoking
participation function contains individual fixed effects, these effects are eliminated by taking
first differences to obtain the quit function.
Model 1: Discrete-time Linear Probability Hazard Model (Individual Data)
To implement the first model, we develop a synthetic panel with 12 points in time, as
shown in Figure 2. For CABG and PCI patients, there are 10 points in time prior to treatment
(from 9.5 years before to 0.5 years before) and two points in time after treatment (0.5 years after
and 1.5 years after). For medically managed (MM) patients, there are the same 10 points in time
before diagnosis and the same two points in time after diagnosis. To focus on the key aspects of
the model, we ignore the socioeconomic and demographic variables for the time being, assume a
single Elixhauser comorbidity, and suppress the subscript i for an individual. Let fg be a person-
specific fixed effect. Let at be a dummy variable that equals 0 at each point in time before
treatment for PCI or CABG and equals 1 at each point in time after treatment. Specifically, at
equals 1 in periods 11 and 12. This variable is not relevant for MM patients (see below). Let dt
be a dummy variable that equals 0 at all points in time before diagnosis and equals 1 at all points
in time after diagnosis. Let ht be a dummy variable that equals zero before a patient’s first AMI

16
(in our data) and equals 1 after a patient’s first AMI. Finally, let et equal 0 before an Elixhauser
comorbidity is reported and equals 1 thereafter.
The log smoking participation model for PCI and CABG patients (g = p or c)
ln sgt = fg - βgagt - φhgt - γegt - αdgt - λt, (3)
where we assume a linear trend in the absence of treatment. The model for MM patients is the
same except that amt coincides with dmt, so that we constrain βm to equal zero. After pooling and
taking first differences, one obtains
- (ln st – ln st-1) ≅ qt = λ + α(dt – dt-1) + βpp(at – at-1) + βcc(at – at-1) + φ(ht – ht-1) + γ(et – et-1). (4)
Strictly speaking, time-invariant individual characteristics, such as formal schooling, can only be
added to equation (4) by assuming that they interact with the linear trend in equation (3). Our
results are not affected by allowing the trend to be nonlinear or by allowing individual
characteristics to interact with the indicator for the period after treatment in addition to their
interactions with a linear trend.
We fit equation (4) as a discrete time linear probability hazard model. We include only
individuals who smoke at the first point in time for which we compute smoking participation (9.5
years before treatment or diagnosis), dropping everyone who never smoked or had previously
quit. Each person is assigned a qit variable that is equal to one in the period in which they quit
and zero in all other periods. Individuals are deleted once they quit. The model in equation (4)
has at most 11 observations per person corresponding to the 11 time periods in Figure 3.
17
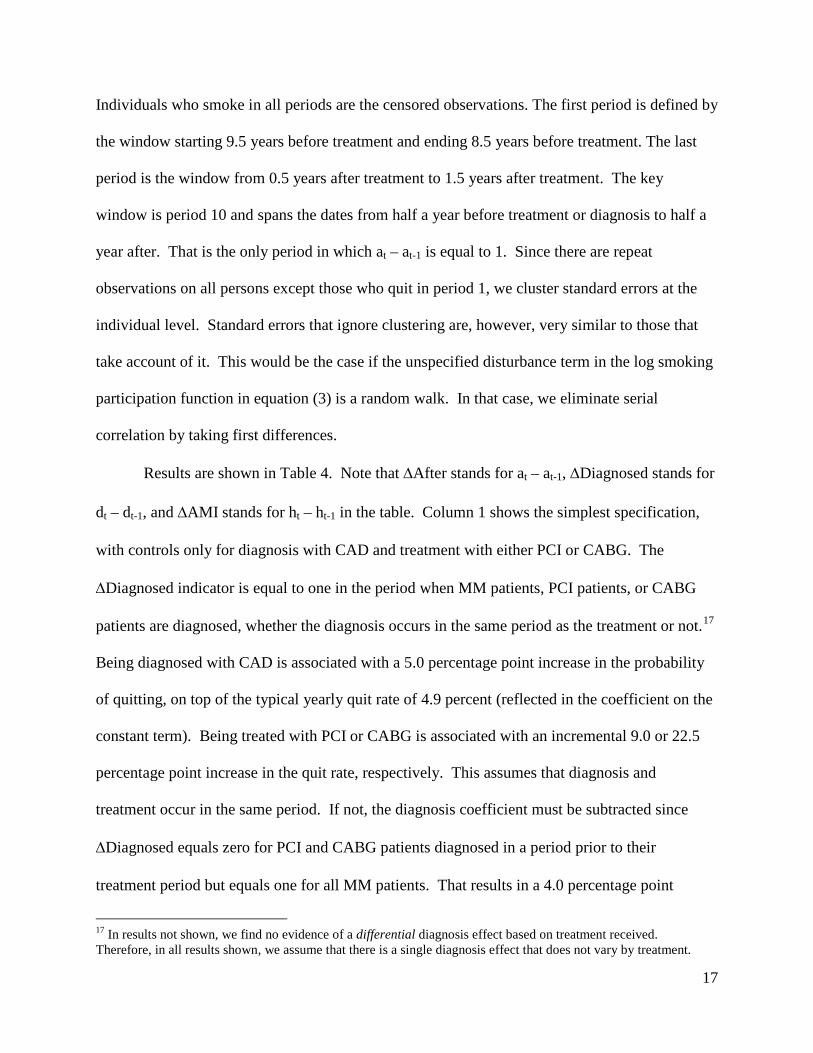
Individuals who smoke in all periods are the censored observations. The first period is defined by
the window starting 9.5 years before treatment and ending 8.5 years before treatment. The last
period is the window from 0.5 years after treatment to 1.5 years after treatment. The key
window is period 10 and spans the dates from half a year before treatment or diagnosis to half a
year after. That is the only period in which at – at-1 is equal to 1. Since there are repeat
observations on all persons except those who quit in period 1, we cluster standard errors at the
individual level. Standard errors that ignore clustering are, however, very similar to those that
take account of it. This would be the case if the unspecified disturbance term in the log smoking
participation function in equation (3) is a random walk. In that case, we eliminate serial
correlation by taking first differences.
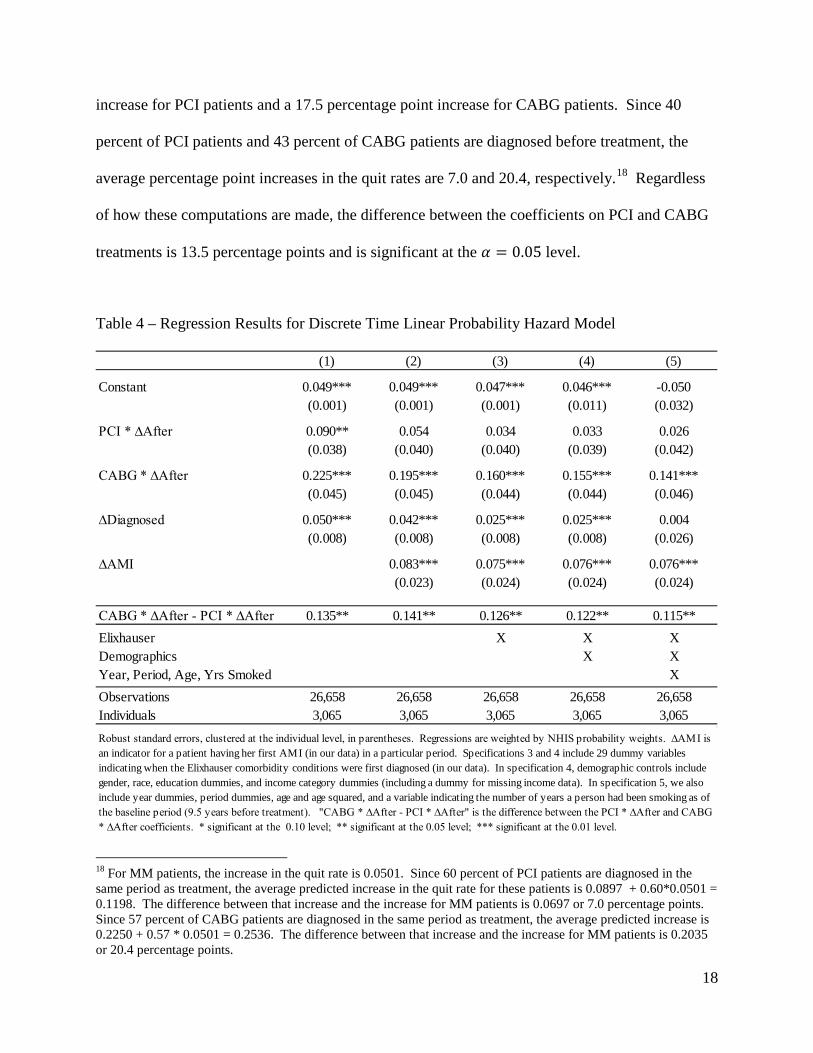
Results are shown in Table 4. Note that ∆After stands for at – at-1, ∆Diagnosed stands for
dt – dt-1, and ∆AMI stands for ht – ht-1 in the table. Column 1 shows the simplest specification,
with controls only for diagnosis with CAD and treatment with either PCI or CABG. The
∆Diagnosed indicator is equal to one in the period when MM patients, PCI patients, or CABG
patients are diagnosed, whether the diagnosis occurs in the same period as the treatment or not.17
Being diagnosed with CAD is associated with a 5.0 percentage point increase in the probability
of quitting, on top of the typical yearly quit rate of 4.9 percent (reflected in the coefficient on the
constant term). Being treated with PCI or CABG is associated with an incremental 9.0 or 22.5
percentage point increase in the quit rate, respectively. This assumes that diagnosis and
treatment occur in the same period. If not, the diagnosis coefficient must be subtracted since
∆Diagnosed equals zero for PCI and CABG patients diagnosed in a period prior to their
treatment period but equals one for all MM patients. That results in a 4.0 percentage point
17 In results not shown, we find no evidence of a differential diagnosis effect based on treatment received. Therefore, in all results shown, we assume that there is a single diagnosis effect that does not vary by treatment.
18
increase for PCI patients and a 17.5 percentage point increase for CABG patients. Since 40
percent of PCI patients and 43 percent of CABG patients are diagnosed before treatment, the
average percentage point increases in the quit rates are 7.0 and 20.4, respectively.18 Regardless
of how these computations are made, the difference between the coefficients on PCI and CABG
treatments is 13.5 percentage points and is significant at the 𝛼 = 0.05 level.
Table 4 – Regression Results for Discrete Time Linear Probability Hazard Model
18 For MM patients, the increase in the quit rate is 0.0501. Since 60 percent of PCI patients are diagnosed in the same period as treatment, the average predicted increase in the quit rate for these patients is 0.0897 + 0.60*0.0501 = 0.1198. The difference between that increase and the increase for MM patients is 0.0697 or 7.0 percentage points. Since 57 percent of CABG patients are diagnosed in the same period as treatment, the average predicted increase is 0.2250 + 0.57 * 0.0501 = 0.2536. The difference between that increase and the increase for MM patients is 0.2035 or 20.4 percentage points.
(1) (2) (3) (4) (5)
Constant 0.049*** 0.049*** 0.047*** 0.046*** -0.050(0.001) (0.001) (0.001) (0.011) (0.032)
PCI * ∆After 0.090** 0.054 0.034 0.033 0.026(0.038) (0.040) (0.040) (0.039) (0.042)
CABG * ∆After 0.225*** 0.195*** 0.160*** 0.155*** 0.141***(0.045) (0.045) (0.044) (0.044) (0.046)
∆Diagnosed 0.050*** 0.042*** 0.025*** 0.025*** 0.004(0.008) (0.008) (0.008) (0.008) (0.026)
∆AMI 0.083*** 0.075*** 0.076*** 0.076***(0.023) (0.024) (0.024) (0.024)
CABG * ∆After - PCI * ∆After 0.135** 0.141** 0.126** 0.122** 0.115**Elixhauser X X XDemographics X XYear, Period, Age, Yrs Smoked XObservations 26,658 26,658 26,658 26,658 26,658Individuals 3,065 3,065 3,065 3,065 3,065Robust standard errors, clustered at the individual level, in parentheses. Regressions are weighted by NHIS probability weights. ∆AMI is an indicator for a patient having her first AMI (in our data) in a particular period. Specifications 3 and 4 include 29 dummy variables indicating when the Elixhauser comorbidity conditions were first diagnosed (in our data). In specification 4, demographic controls include gender, race, education dummies, and income category dummies (including a dummy for missing income data). In specification 5, we also include year dummies, period dummies, age and age squared, and a variable indicating the number of years a person had been smoking as of the baseline period (9.5 years before treatment). "CABG * ∆After - PCI * ∆After" is the difference between the PCI * ∆After and CABG * ∆After coefficients. * significant at the 0.10 level; ** significant at the 0.05 level; *** significant at the 0.01 level.
19
In columns 2-5 of Table 4, we add additional control variables that may be associated
with both selection into treatment and the propensity to quit smoking. In column 2, we add a
control for a patient’s first AMI. In column 3, we further control for the Elixhauser comorbidity
conditions. In column 4, we add controls for demographic characteristics. And, in column 5, we
add controls for the period, the calendar year, an individual’s age and age squared as of the
treatment date, and the number of years she has smoked as of the baseline period (9.5 years prior
to treatment). An AMI proves to be a strong predictor of quitting smoking, increasing the
predicted probability of quitting by between 7.5 and 8.3 percentage points, depending on the
specification. Moreover, once we add AMI, the estimated size of the PCI coefficient declines
and is no longer statistically significant at conventional levels. In our final specification, we find
that patients undergoing PCI are 2.6 percentage points more likely to quit smoking, though given
the imprecision of our estimate, we cannot rule out the possibility of no association.19 While the
coefficient on CABG also declines, it remains large and strongly statistically significant, both in
comparison to medically managed patients and PCI patients. In our fifth specification,
undergoing CABG surgery in the same period in which CAD was diagnosed is associated with a
roughly 14.1 percentage point increase in the probability of quitting smoking. The increased quit
rate associated with CABG is substantially larger than the increase associated with less invasive
treatments for CAD, and approximately twice the increase associated with an AMI. Moreover,
in every specification, the difference between the CABG and PCI coefficients is consistently
large – ranging from 0.115 to 0.141 – and significant at the 0.05 level.
19 As discussed above, this estimate is for a PCI patient who was diagnosed and treated in the same period.

20
Model 2: Multi-Period Quit Model Using Grouped Data
To illustrate that our results are not sensitive to a flexible specification of period effects
and to account for clustering of disturbance terms by group and period at the individual level, we
aggregate the data into 11 periods for each of the three groups of patients. There are 33 cells in
the aggregate sample, corresponding to the 33 data points shown in Figure 3. We obtain two quit
series. The first is unadjusted for covariates and is identical to the quit rates that appear in Figure
3. The second quit series adjusts for effects due to diagnosis, AMI, and Elixhauser
comorbidities. It is obtained from the individual data by estimating a discrete time hazard
function for the probability of quitting that includes 11 period dummies interacted with each of
three treatment dummies (one for CABG, one for PCI, and one for MM), and the diagnosis,
AMI, and Elixhauser variables defined in equation (4). The 33 coefficients associated with the
period-treatment interactions are quit rates by group and period adjusted for the effects of the last
three variables just mentioned.20
In the spirit of Donald and Lang (2007), we use this data to perform simple difference-in-
differences regressions with 11 observations. To illustrate the model that we estimate, consider a
log smoking participation function for two groups (g = c or p, c = CABG, p = PCI):
ln sgt = µ + ρc + βcat + 11 period dummies + εgt. (5)
Here at, as defined in equation (3), is an indicator that equals 1 in each of the two periods after
treatment and εgt is the error term. Take the difference between each group in a given period to
20 We do not adjust for demographic and socioeconomic characteristics since the inclusion of these characteristics has a very minor impact on the adjusted quit rates.

21
eliminate the intercept (µ) and the period dummies. Then take first differences to eliminate the
group effect (ρ):
ln sct – ln sct-1 – (ln spt – ln spt-1) ≅ qct – qpt = β(at – at-1) + error. (6)
Equation (6) is a regression forced through the origin with 11 observations. The
dependent variable is the difference between the quit rate of CABG patients and the quit rate of
PCI patients in each period. The independent variable, (at – at-1), equals 1 in the window
spanning the period from 6 months before treatment to six months after treatment (period 10)
and equals 0 in each of the other 10 periods or quit windows.
This approach has a number of attractive features. First, aggregation accounts for
clustering in the disturbance term in an individual-level log smoking participation or quit
equation by group and period. Second, if the error term in equation (5) is a random walk, then
serial correlation is eliminated once first differences are taken. Third, the regression specified by
equation (6) implicitly controls for a full set of period effects. Finally, by focusing on the
difference in the quit rates in each period, we are asking whether this difference during the
treatment period is sufficiently unusual compared to past and future values that it is unlikely to
have arisen by chance. If the quit rates in the two series normally track one another but do not
during the treatment year, we would expect that there is something unusual about the treatment
year. On the other hand, if the quit rates in the two series often diverge wildly, then a substantial
divergence in the treatment year might simply be due to chance.
Six aggregate quit regressions are contained in Table 5. The three in the top row employ
the unadjusted quit series, while the three in the bottom row employ the adjusted quit series. In
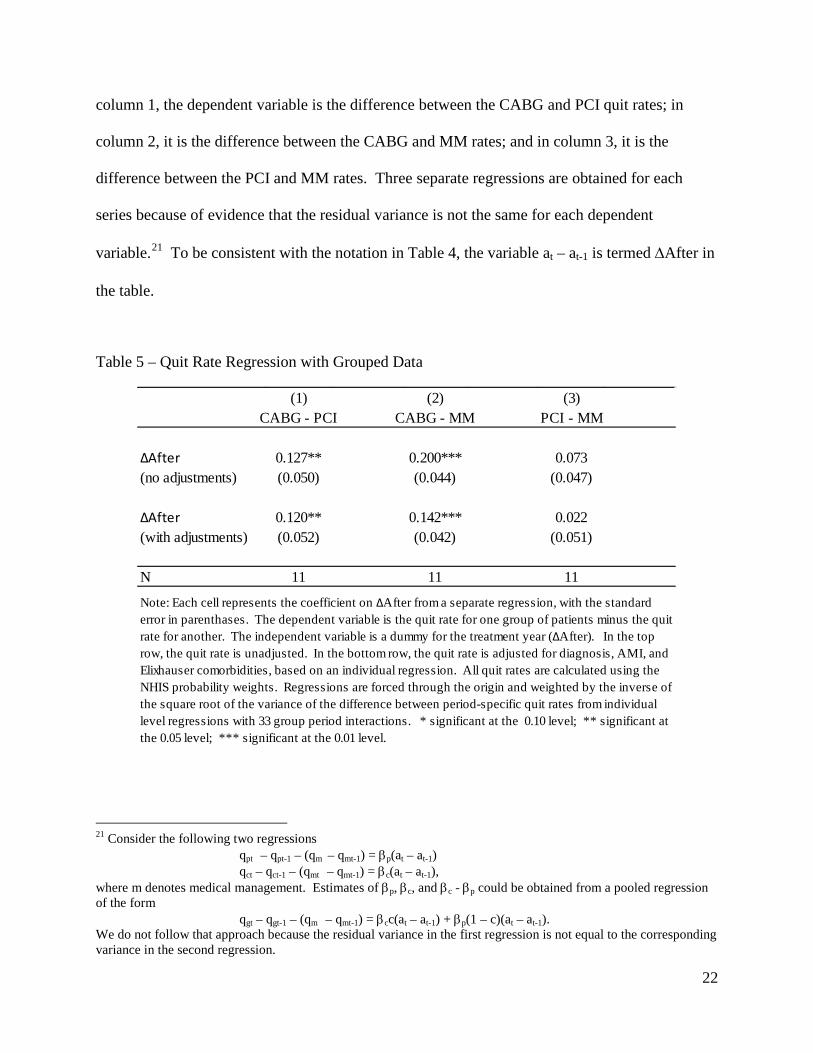
22
column 1, the dependent variable is the difference between the CABG and PCI quit rates; in
column 2, it is the difference between the CABG and MM rates; and in column 3, it is the
difference between the PCI and MM rates. Three separate regressions are obtained for each
series because of evidence that the residual variance is not the same for each dependent
variable.21 To be consistent with the notation in Table 4, the variable at – at-1 is termed ∆After in
the table.
Table 5 – Quit Rate Regression with Grouped Data
21 Consider the following two regressions qpt – qpt-1 – (qm – qmt-1) = βp(at – at-1) qct – qct-1 – (qmt – qmt-1) = βc(at – at-1), where m denotes medical management. Estimates of βp, βc, and βc - βp could be obtained from a pooled regression of the form qgt – qgt-1 – (qm – qmt-1) = βcc(at – at-1) + βp(1 – c)(at – at-1). We do not follow that approach because the residual variance in the first regression is not equal to the corresponding variance in the second regression.
(1) (2) (3)CABG - PCI CABG - MM PCI - MM
∆After 0.127** 0.200*** 0.073(no adjustments) (0.050) (0.044) (0.047)
∆After 0.120** 0.142*** 0.022(with adjustments) (0.052) (0.042) (0.051)
N 11 11 11
Note: Each cell represents the coefficient on ∆After from a separate regression, with the standard error in parenthases. The dependent variable is the quit rate for one group of patients minus the quit rate for another. The independent variable is a dummy for the treatment year (∆After). In the top row, the quit rate is unadjusted. In the bottom row, the quit rate is adjusted for diagnosis, AMI, and Elixhauser comorbidities, based on an individual regression. All quit rates are calculated using the NHIS probability weights. Regressions are forced through the origin and weighted by the inverse of the square root of the variance of the difference between period-specific quit rates from individual level regressions with 33 group period interactions. * significant at the 0.10 level; ** significant at the 0.05 level; *** significant at the 0.01 level.
23
Focusing on the first column of Table 5, one sees that the difference between the CABG
quit rate and the PCI quit rate in treatment period is between 12 and 13 percentage points,
regardless of whether one uses the raw data or adjusts the quit rate for covariates. In the second
column, we see that the difference in the quit rate between CABG and MM patients drops when
one adjusts for covariates, but remains large (14.2 percentage points) and strongly statistically
significant. In the final column, we see that while the unadjusted quit rate for PCI patients is 7.3
percentage points larger than for MM patients, once one adjusts for a patient’s CAD diagnosis
and other medical conditions, the difference between the two quit rates is substantially smaller
and not statistically distinguishable from zero.
V. Potential Mechanisms
In the analysis above, we demonstrate that CABG patients are substantially more likely to
quit smoking than those who have less invasive treatment for CAD. When combined with other
potential lifestyle modifications, this change in behavior may help explain why CABG patients
experience better mortality and morbidity outcomes over the long term than otherwise similar
PCI patients. This finding is consistent with a model in which patients undergoing CABG
receive a stronger and more persistent signal about the severity of their disease, leading them to
improve their behavior. However, other explanations are also possible.
One alternative explanation is that CABG patients quit because they are forced to go
“cold turkey” during the length of their hospital stay. For the week that they are in a hospital,
most CABG patients are presumably unable to smoke, potentially kick-starting the quitting
process and making it easier for them to stay off cigarettes when discharged. PCI patients, by
24
contrast, typically spend a day or less in the hospital, which might account for their lower quit
rate in the period surrounding their procedure.
To test this theory – and provide a falsification test for our main results – we study two
common procedures that are unrelated to smoking but require relatively long hospital stays: total
knee replacement and total hip replacement.22 23 These procedures – taken together – were
performed over one million times in 2010, with over 500,000 procedures taking place in patients
65 and older (CDC, 2010). These two surgeries – which involve replacing a knee or hip joint
with a metal or plastic replica – are generally done to relieve arthritic pain, and patients spend at
least three to four nights in the hospital recovering.24 Smoking is largely unrelated to knee or hip
pain and so undergoing knee or hip replacement surgery would be unlikely to convey any new
information to a smoker about the value of quitting.
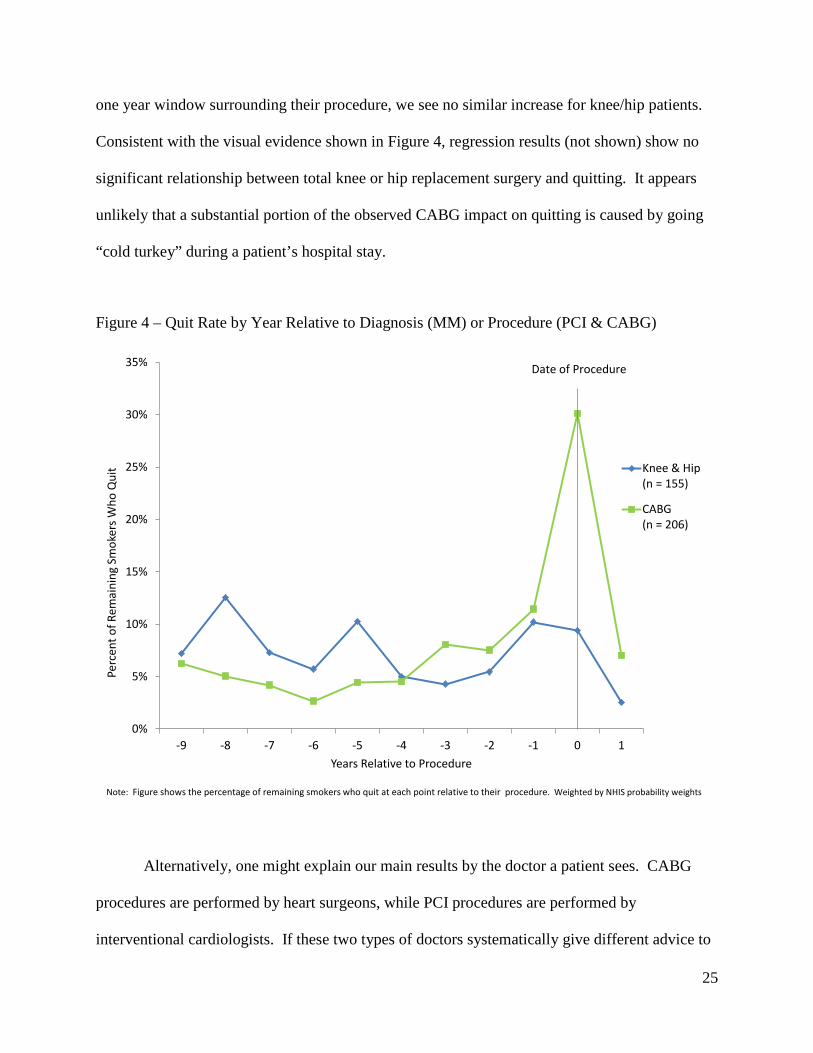
To test the impact of a long hospital stay on smoking, we identify total knee and total hip
replacement patients using the same linked NHIS / Medicare data as in the main analysis. Figure
4 reproduces the CABG quit rate from Figure 3 and adds a series showing the quit rate for
patients who undergo knee or hip replacements.25 When we combine knee and hip replacement
recipients, we have data on 155 patients who smoked nine and half years prior to their surgery,
slightly below the 206 CABG smokers in our data. In the years prior to their procedure, the quit
rate for knee/hip and CABG patients are fairly similar, with the knee/hip quit rate somewhat
higher five to nine years prior to surgery and the CABG quit rate somewhat higher one to three
years prior to surgery. However, while the quit rate for CABG patients jumps dramatically in the
22 We use ICD-9-CM procedure code 81.51 for Total Hip Replacement and 81.54 for Total Knee Replacement 23 Thanks to Isaac Sorkin, who suggested we find non-smoking related procedures to do this type of analysis. 24 http://www.emoryhealthcare.org/orthopaedics/become-patient/faq/knee-replacement.html; http://www.ucsfhealth.org/education/recovering_from_hip_replacement_surgery/ 25 The small number of patients who have both knee and hip replacements are assigned a procedure date based on their total knee replacement.
25
one year window surrounding their procedure, we see no similar increase for knee/hip patients.
Consistent with the visual evidence shown in Figure 4, regression results (not shown) show no
significant relationship between total knee or hip replacement surgery and quitting. It appears
unlikely that a substantial portion of the observed CABG impact on quitting is caused by going
“cold turkey” during a patient’s hospital stay.
Figure 4 – Quit Rate by Year Relative to Diagnosis (MM) or Procedure (PCI & CABG)
Alternatively, one might explain our main results by the doctor a patient sees. CABG
procedures are performed by heart surgeons, while PCI procedures are performed by
interventional cardiologists. If these two types of doctors systematically give different advice to
0%
5%
10%
15%
20%
25%
30%
35%
-9 -8 -7 -6 -5 -4 -3 -2 -1 0 1
Perc
ent o
f Rem
aini
ng S
mok
ers W
ho Q
uit
Years Relative to Procedure
Knee & Hip(n = 155)
CABG(n = 206)
Date of Procedure
Note: Figure shows the percentage of remaining smokers who quit at each point relative to their procedure. Weighted by NHIS probability weights
26
smokers on the importance of quitting, this might be the mechanism through which the CABG
quit rate rises above the PCI quit rate near the treatment date. Though different than our main
hypothesis – that CABG sends a stronger and more persistent signal to the patient about his or
her health problems – this mechanism is similar. Rather than the scar on a CABG patient’s
chest, it may be her heart surgeon who convinces her to quit smoking. Either way, the patient
updates her opinion on the value of quitting smoking based on the CABG experience. And,
while this alternative explanation – that heart surgeons are more persuasive smoking cessation
advocates – seems less likely to us, it arguably provides more actionable policy
recommendations.
VI. Conclusion
Coronary Artery Disease is a frequently occurring and deadly disease. There are several
common treatments – including medical management, PCI, and CABG – and each has benefits
and costs associated with it. In this paper, we have examined one previously unexplored benefit
of more invasive treatment: those who undergo a procedure, particularly the more invasive
CABG surgery, are more likely to quit smoking. In our preferred regression model, we estimate
that CAD patients who undergo CABG are 12 percentage points more likely to quit smoking in
the one-year window surrounding their surgery than patients who undergo PCI. During the same
one-year window, CABG patients are 14 percentage points more likely to quit smoking than
medically managed patients. These results are robust to a number of alternative specifications.
While we do not have data on behaviors other than smoking, we suspect that patients
undergoing more invasive surgery are also more likely to improve their diet, limit excessive
consumption of alcohol, and (when recommended) exercise more. Taken together, these

27
behavioral responses may offset the inherent risks of a more invasive surgery and help explain
why the longer term outcomes for CABG patients exceed those of similar patients receiving PCI.
Our findings also highlight the importance of emphasizing healthier behaviors to those patients
who have less invasive medical treatment.

28
VII. References
CDC (2010). National Hospital Discharge Survey. http://www.cdc.gov/nchs/fastats/inpatient-surgery.htm (accessed on 6/6/14). Cutler, David M. and Robert S. Huckman (2003). “Technological development and medical productivity: the diffusion of angioplasty in New York State.” Journal of Health Economics 22 (2): 187-217. Dave, Dhaval M. and Robert Kaestner (2009). “Health Insurance and Ex Ante Moral Hazard: Evidence from Medicare.” International Journal of Health Care Finance and Economics 9 (4): 367-390. Donald, Stephen G. and Kevin Lang (2007). “Inference with Difference-in-Differences and Other Panel Data.” The Review of Economics and Statistics 89 (2): 221–233. Elixhauser, Anne, Steiner, Claudia, Harris, D. Robert Harris and Rosanna M. Coffey (1998). “Comorbidity Measures for Use with Administrative Data.” Med Care 36(1): 8-27. Hlatky, Mark A., Boothroyd, Derek B., Bravata, Dena M., et al. (2009). “Coronary artery bypass surgery compared with percutaneous coronary interventions for multivessel disease: a collaborative analysis of individual patient data from ten randomised trials.” Lancet 373(9670): 1190–97. Kaestner, Robert, Darden, Michael and Darius Lakdawalla (2014). “Are investments in disease prevention complements? The case of statins and health behaviors.” Journal of Health Economics 36 (July): 151-163. Mohr, Friedrich W., Morice, Marie-Claude, Kappetein, A. Pieter et al., (2013). “Coronary artery bypass graft surgery versus percutaneous coronary intervention in patients with three-vessel disease and left main coronary disease: 5-year follow-up of the randomised, clinical SYNTAX trial.” Lancet 38(9867): 629–38. Murphy, Sherry L., Xu, Jiaquan and Kenneth D. Kochanek. “Deaths: Preliminary Data for 2010.” National Vital Statistics Reports; vol 60 no 4. Hyattsville, MD: National Center for Health Statistics. 2012. Peltzman, Sam. (1975). “The Effects of Automobile Safety Regulation.” Journal of Political Economy 83(4): 677-725. Peltzman, Sam. (2011). “Offsetting Behavior, Medical Breakthroughs, and Breakdowns.” Journal of Human Capital 5(3): 302-341.

29
Taggart, David P. (2013). “CABG or stents in coronary artery disease: end of the debate?” Lancet 381(9867): 605–07. Weintraub, William S., Maria V. Grau-Sepulveda, Jocelyn M. Weiss, et al. (2012). “Comparative Effectiveness of Revascularization Strategies.” New England Journal of Medicine 366(16): 1467-76.
30
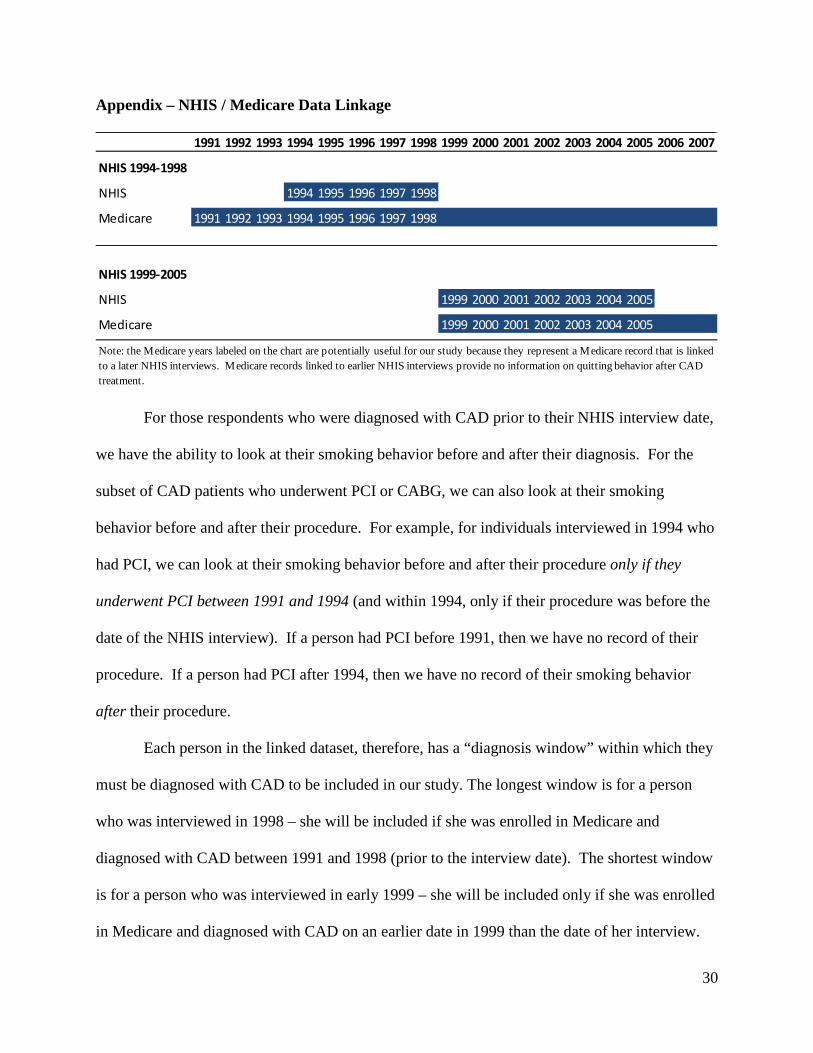
Appendix – NHIS / Medicare Data Linkage
For those respondents who were diagnosed with CAD prior to their NHIS interview date,
we have the ability to look at their smoking behavior before and after their diagnosis. For the
subset of CAD patients who underwent PCI or CABG, we can also look at their smoking
behavior before and after their procedure. For example, for individuals interviewed in 1994 who
had PCI, we can look at their smoking behavior before and after their procedure only if they
underwent PCI between 1991 and 1994 (and within 1994, only if their procedure was before the
date of the NHIS interview). If a person had PCI before 1991, then we have no record of their
procedure. If a person had PCI after 1994, then we have no record of their smoking behavior
after their procedure.
Each person in the linked dataset, therefore, has a “diagnosis window” within which they
must be diagnosed with CAD to be included in our study. The longest window is for a person
who was interviewed in 1998 – she will be included if she was enrolled in Medicare and
diagnosed with CAD between 1991 and 1998 (prior to the interview date). The shortest window
is for a person who was interviewed in early 1999 – she will be included only if she was enrolled
in Medicare and diagnosed with CAD on an earlier date in 1999 than the date of her interview.
1991 1992 1993 1994 1995 1996 1997 1998 1999 2000 2001 2002 2003 2004 2005 2006 2007
NHIS 1994-1998
NHIS 1994 1995 1996 1997 1998
Medicare 1991 1992 1993 1994 1995 1996 1997 1998
NHIS 1999-2005
NHIS 1999 2000 2001 2002 2003 2004 2005
Medicare 1999 2000 2001 2002 2003 2004 2005
Note: the Medicare years labeled on the chart are potentially useful for our study because they represent a Medicare record that is linked to a later NHIS interviews. Medicare records linked to earlier NHIS interviews provide no information on quitting behavior after CAD treatment.
Recommended