MONTHLY MARKET
REPORT
January 2017

Table of Contents
1. Market Prices ................................................................................................................ 1
1.1 Introduction ................................................................................................................... 1
1.2 Hourly Ontario Energy Price (HOEP) ............................................................................ 1
1.3 Ontario 5-Minute Market Clearing Price (MCP) ............................................................. 3
1.4 Operating Reserve Prices ............................................................................................. 4
1.5 Hourly Uplift Settlement Charges .................................................................................. 5
1.6 Monthly Uplift Charges .................................................................................................. 5
1.7 Transmission Rights Auction ......................................................................................... 6
1.8 Transmission Rights Payments ..................................................................................... 7
1.9 Transmission Rights Clearing Account .......................................................................... 7
2. Market Demand............................................................................................................. 8
2.1 Market Demand Definitions and Graphs ........................................................................ 8
2.2 Imports & Exports .......................................................................................................... 9
3. Unavailable Capacity .................................................................................................. 10
3.1 Unavailable Capacity .................................................................................................. 10
4. Weather ...................................................................................................................... 11
4.1 Temperature ............................................................................................................... 11
5. Longer-Term Trends ................................................................................................... 12
5.1 Weekly Hourly Ontario Energy Price (HOEP) Trends .................................................. 12
5.2 HOEP Prices (Monthly Arithmetic Ave) ....................................................................... 13
5.3 Operating Reserve Prices (Monthly Arithmetic Ave) .................................................... 13
5.4 Comparison to Neighbouring Control Area Prices ....................................................... 14
5.5 Ave Differences between HOEP and Pre-dispatch ...................................................... 14
5.6 Henry-Hub Natural Gas Closing Price ......................................................................... 15
5.7 Weekly Market Demand Trends .................................................................................. 15
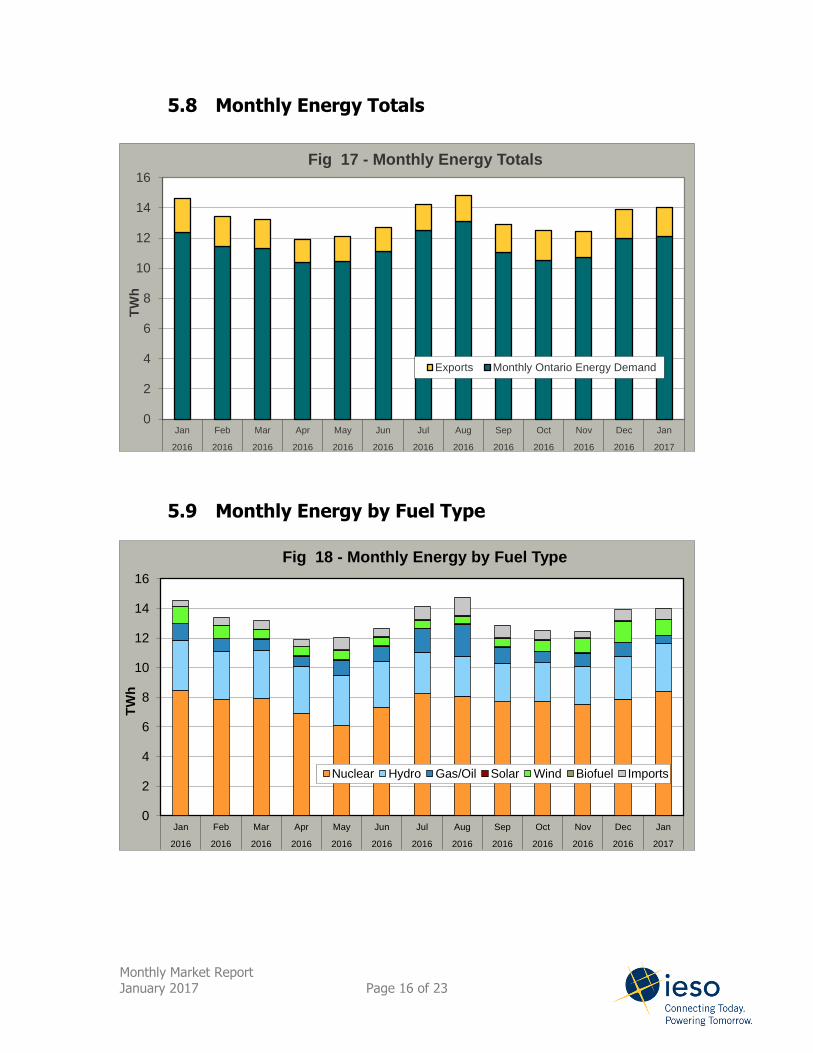
5.8 Monthly Energy Totals................................................................................................. 16
5.9 Monthly Energy by Fuel Type ...................................................................................... 16
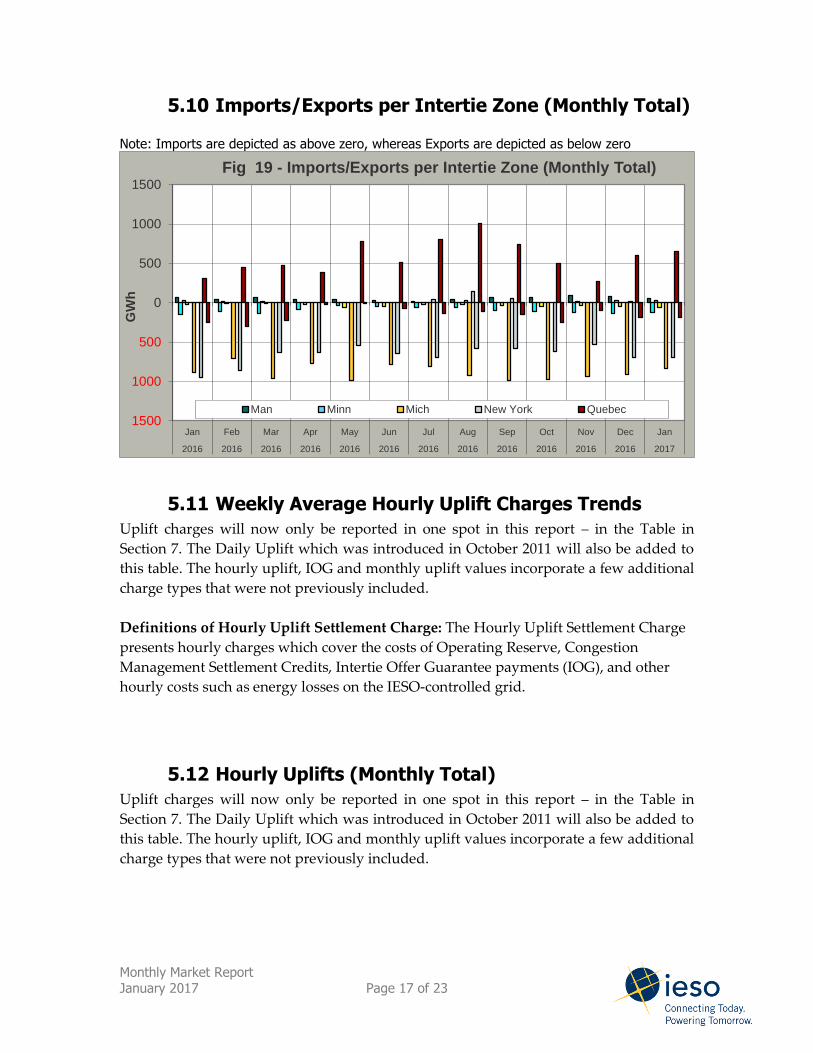
5.10 Imports/Exports per Intertie Zone (Monthly Total) ....................................................... 17
5.11 Weekly Average Hourly Uplift Charges Trends ........................................................... 17
5.12 Hourly Uplifts (Monthly Total) ..................................................................................... 17
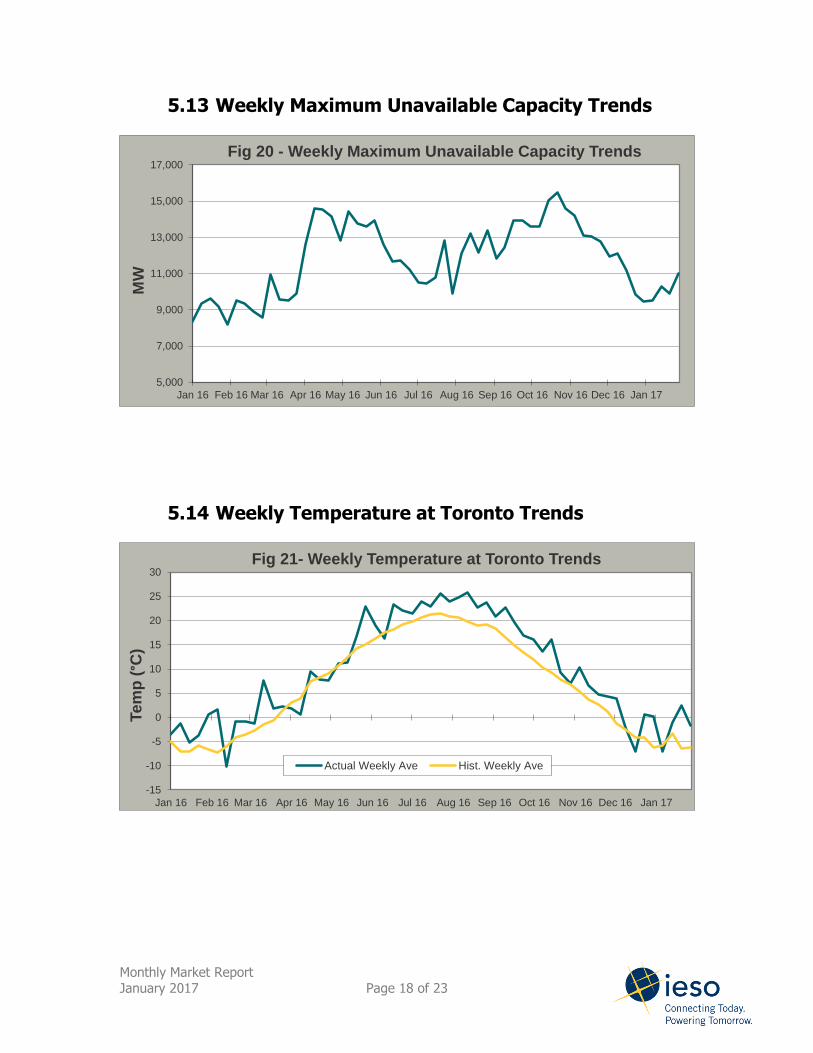
5.13 Weekly Maximum Unavailable Capacity Trends ......................................................... 18
5.14 Weekly Temperature at Toronto Trends ..................................................................... 18
6. Global Adjustment ....................................................................................................... 19
7. Summary of Wholesale Market Electricity Charges in Ontario’s Competitive Marketplace ................................................................................................................ 22

List of Figures
Figure 1 – Hourly Ontario Energy Price (HOEP) .................................................................. 2
Figure 2 – Frequency Range of HOEP ................................................................................ 3
Figure 3 – Frequency Range of MCP .................................................................................. 3
Figure 4 – Daily MCP (Max, Min, Ave) ................................................................................ 4
Figure 5 – Operating Reserve Prices (Daily Averages) ....................................................... 5
Figure 6 – Market Demand .................................................................................................. 8
Figure 7 – Imports/Exports .................................................................................................. 9
Figure 8 – Unavailable Capacity .........................................................................................10
Figure 9 – Temperature at Toronto .....................................................................................11
Figure 10 – Weekly Hourly Ontario Energy Price (HOEP) Trends ......................................12
Figure 11 – HOEP Prices (Monthly Arithmetic Ave) ............................................................13
Figure 12 – Operating Reserve Prices (Monthly Arithmetic Ave) ........................................13
Figure 13 – Comparison to Neighbouring Control Area Prices (Monthly Ave) .....................14
Figure 14 – Ave Differences Between HOEP and Pre-dispatch ..........................................14
Figure 15 – Henry-Hub Natural Gas Closing Price .............................................................15
Figure 16 – Weekly Total Market Demand Trends .............................................................15
Figure 17 – Monthly Energy Totals .....................................................................................16
Figure 18 – Monthly Energy by Fuel Type ..........................................................................16
Figure 19 – Imports/Exports per Intertie Zone (Monthly Total) ............................................17
Figure 20 – Weekly Maximum Unavailable Capacity Trends ..............................................18
Figure 21 – Weekly Temperature at Toronto Trends ..........................................................18
Figure 22 – Global Adjustment ...........................................................................................20
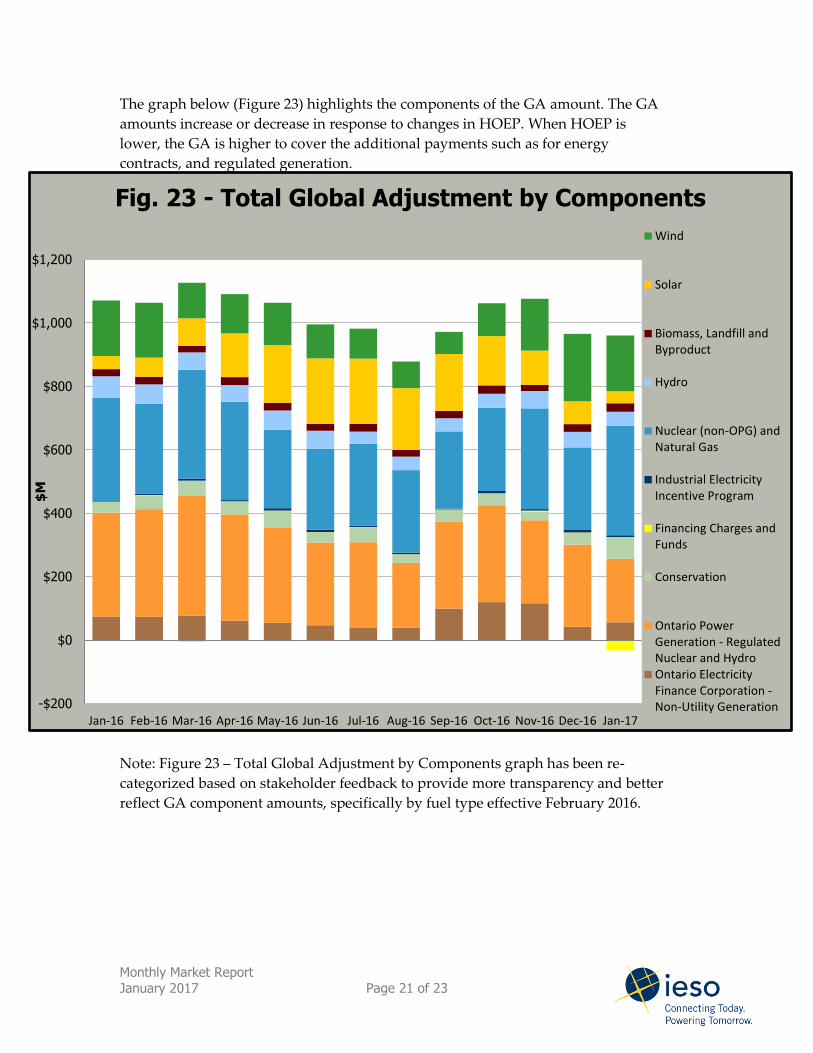
Figure 23 – Total Global Adjustment By Components ........................................................21
Monthly Market Report January 2017 Page 1 of 23
This report provides a summary of key market data from the IESO-administered
markets. It is intended to provide a quick reference for all market stakeholders. In all
cases, the data used to produce all graphs in this report, are available for download from
the Market Summaries page of the IESO Web site. Any data used in this report is
provided for information purposes only, and should not be used for settlement
purposes.
1. Market Prices
1.1 Introduction
This section provides information on several of the key prices in the Ontario wholesale
electricity market. A brief description of each displayed price item is included. For
more information on any of the price items, please refer to appropriate market rules,
market manuals and IESO Marketplace Training materials, or contact the IESO
Customer Relations.
1.2 Hourly Ontario Energy Price (HOEP)
HOEP is the hourly price that is charged to Local Distributing Companies and other
non-dispatchable loads. HOEP is also paid to self-scheduling generators. HOEP
becomes the basis of the commodity charges in the Retail electricity market if customers
receive their electricity from their Local Distributing Company. Customers who have
arranged contracts with licensed Retailers are not affected by HOEP, but instead are
charged their particular contract rate for the commodity.
Note: The IESO provides a convenient graph of HOEP prices for the current and previous day on
the Today’s Market page on the IESO Web site. These graphs also provide an estimate of future
HOEP prices for the remainder of the day, and by afternoon, estimates for the next day. The
estimates for future Hourly Ontario Energy Prices are extracted from an IESO report referred to
as the pre-dispatch. Pre-dispatch data is updated every hour. All future prices are derived by
simulating a supply/demand balance, using prices offered by suppliers in the market, prices bid
by price-sensitive consumers in the market, and the IESO's forecast of the total demand for
electricity in the province. The actual supply/demand balance can vary from these projections for
a number of reasons:
The actual demand for electricity can fluctuate as factors such as weather, (temperature,
amount of cloud cover, wind etc.), affect the amount of electricity required by consumers.
At the same time, operational difficulties or delays in a generation unit returning from an
outage can result in higher priced generation being called on to fill the gap.
Finally, any changes in price resulting from such variations can cause some price-sensitive
loads to make alternative consumption decisions, or cause importers and exporters to revise
their plans.
Monthly Market Report January 2017 Page 2 of 23
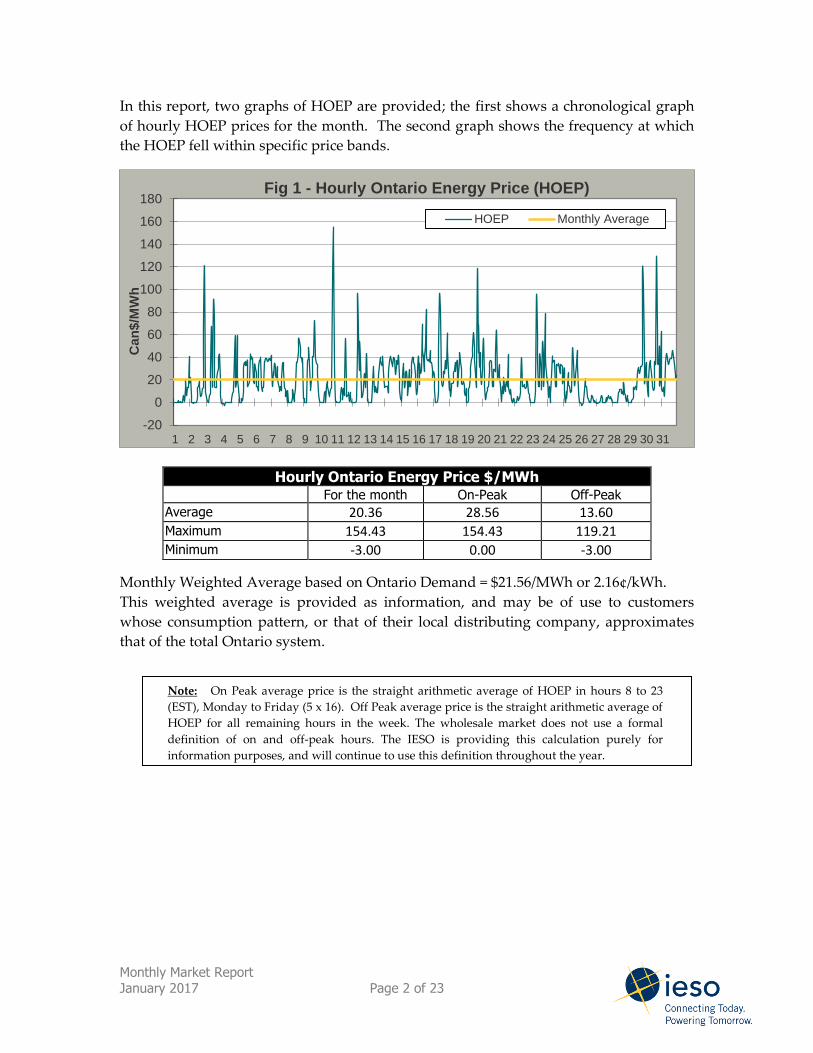
In this report, two graphs of HOEP are provided; the first shows a chronological graph
of hourly HOEP prices for the month. The second graph shows the frequency at which
the HOEP fell within specific price bands.
Monthly Weighted Average based on Ontario Demand = $21.56/MWh or 2.16¢/kWh. This weighted average is provided as information, and may be of use to customers
whose consumption pattern, or that of their local distributing company, approximates
that of the total Ontario system.
Note: On Peak average price is the straight arithmetic average of HOEP in hours 8 to 23
(EST), Monday to Friday (5 x 16). Off Peak average price is the straight arithmetic average of
HOEP for all remaining hours in the week. The wholesale market does not use a formal
definition of on and off-peak hours. The IESO is providing this calculation purely for
information purposes, and will continue to use this definition throughout the year.
-20
0
20
40
60
80
100
120
140
160
180
1 2 3 4 5 6 7 8 9 10 11 12 13 14 15 16 17 18 19 20 21 22 23 24 25 26 27 28 29 30 31
Can
$/M
Wh
Fig 1 - Hourly Ontario Energy Price (HOEP)
HOEP Monthly Average
Hourly Ontario Energy Price $/MWh
For the month On-Peak Off-Peak
Average 20.36 28.56 13.60 Maximum 154.43 154.43 119.21 Minimum -3.00 0.00 -3.00

Monthly Market Report January 2017 Page 3 of 23
1.3 Ontario 5-Minute Market Clearing Price (MCP)
The Ontario 5-minute MCP is the price paid to dispatchable generators and charged to
dispatchable loads. All other participants are charged or paid using hourly prices. The
5-minute price is calculated immediately after the fact for every 5-minute interval,
using the unconstrained dispatch algorithm. The algorithm takes generator offers to
sell and price-sensitive loads’ bids to buy and dispatches these resources to achieve a
supply-demand balance, and resulting price. The price is posted on the Market Data
page on the IESO Web site, within 5-minutes of the conclusion of an interval. The 5-
minute price, by its nature, will fluctuate more than the HOEP (an arithmetic average of
the 12 MCPs for any particular hour), as it more directly reflects the short-term
supply/demand variations caused by unexpected fluctuations in the demand for
electricity or by equipment breakdowns.
0%
5%
10%
15%
20%
25%
30%
35%
40%
<10 10-19 20-29 30-39 40-49 50-59 60-69 70-79 80-89 90-99 >100
Pe
rce
nt
of
Tim
e
Fig 2 - Frequency Range of HOEP
HOEP Range ($/MWh)
0%
10%
20%
30%
40%
50%
60%
70%
80%
90%
<10 10-19 20-29 30-39 40-49 50-59 60-69 70-79 80-89 90-99 >100
Pe
rce
nt
of
Tim
e
Fig 3 - Range of MCP
MCP Range ($/MWh)
Monthly Market Report January 2017 Page 4 of 23
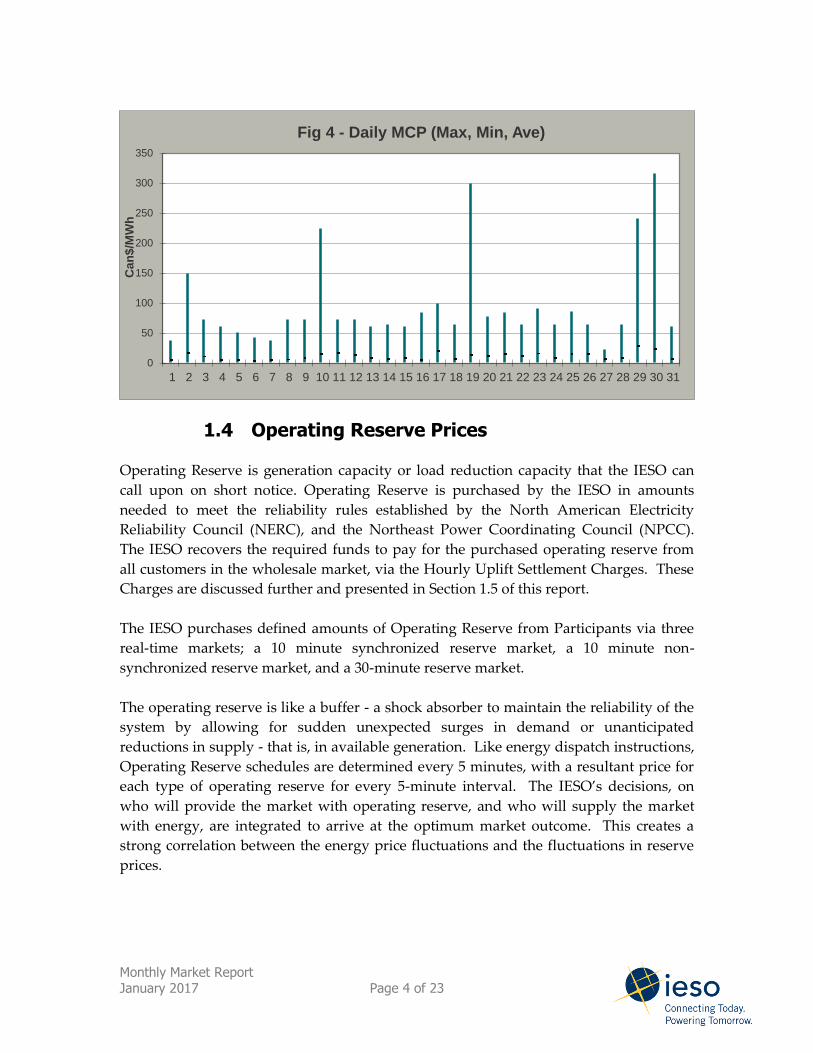
1.4 Operating Reserve Prices
Operating Reserve is generation capacity or load reduction capacity that the IESO can
call upon on short notice. Operating Reserve is purchased by the IESO in amounts
needed to meet the reliability rules established by the North American Electricity
Reliability Council (NERC), and the Northeast Power Coordinating Council (NPCC).
The IESO recovers the required funds to pay for the purchased operating reserve from
all customers in the wholesale market, via the Hourly Uplift Settlement Charges. These
Charges are discussed further and presented in Section 1.5 of this report.
The IESO purchases defined amounts of Operating Reserve from Participants via three
real-time markets; a 10 minute synchronized reserve market, a 10 minute non-
synchronized reserve market, and a 30-minute reserve market.
The operating reserve is like a buffer - a shock absorber to maintain the reliability of the
system by allowing for sudden unexpected surges in demand or unanticipated
reductions in supply - that is, in available generation. Like energy dispatch instructions,
Operating Reserve schedules are determined every 5 minutes, with a resultant price for
each type of operating reserve for every 5-minute interval. The IESO’s decisions, on
who will provide the market with operating reserve, and who will supply the market
with energy, are integrated to arrive at the optimum market outcome. This creates a
strong correlation between the energy price fluctuations and the fluctuations in reserve
prices.
0
50
100
150
200
250
300
350
1 2 3 4 5 6 7 8 9 10 11 12 13 14 15 16 17 18 19 20 21 22 23 24 25 26 27 28 29 30 31
Ca
n$
/MW
h
Fig 4 - Daily MCP (Max, Min, Ave)

Monthly Market Report January 2017 Page 5 of 23
Average Operating Reserve Prices for this month were:
10 minute synchronized reserve: $5.13/ MW/hr
10 minute non-synchronized reserve: $4.95/ MW/hr 30 minute reserve: $0.93/ MW/hr
1.5 Hourly Uplift Settlement Charges
Uplift charges will now only be reported in one spot in this report – in the Table in
Section 7. The Daily Uplift which was introduced in October 2011 will also be added to
this table. The hourly uplift, IOG and monthly uplift values incorporate a few additional
charge types that were not previously included.
Definition: The Hourly Uplift Settlement Charges presents hourly charge which covers
the costs of Operating Reserve, Congestion Management Settlement Credits, Intertie
Offer Guarantee payments (IOG), and other hourly costs such as energy losses on the
IESO-controlled grid.
.
1.6 Monthly Uplift Charges
Uplift charges will now only be reported in one spot in this report – in the Table in
Section 7. The Daily Uplift which was introduced in October 2011 will also be added to
this table. The hourly uplift, IOG and monthly uplift values incorporate a few additional
charge types that were not previously included.
0.00
2.00
4.00
6.00
8.00
10.00
12.00
14.00
1 2 3 4 5 6 7 8 9 10 11 12 13 14 15 16 17 18 19 20 21 22 23 24 25 26 27 28 29 30 31
Can
$/M
W/h
r Fig 5 - Operating Reserve Prices (Daily Averages)
10 Min Non-Sync 10 Min Sync 30 Minute
Monthly Market Report January 2017 Page 6 of 23
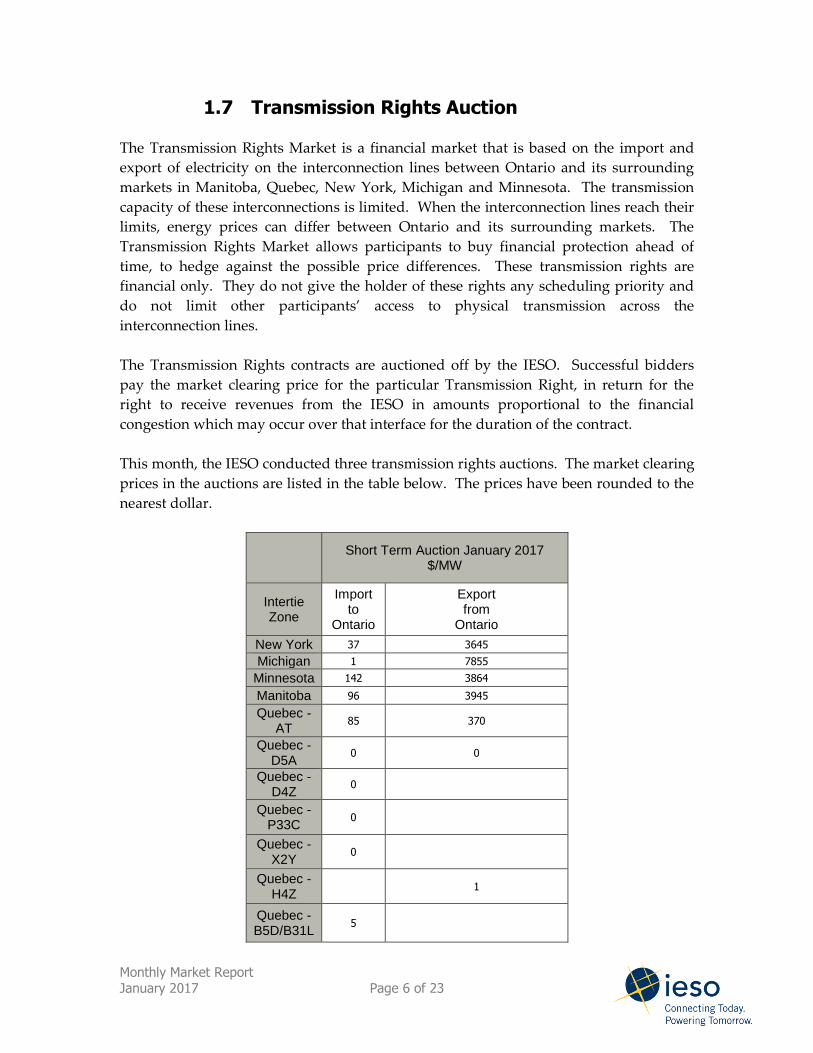
1.7 Transmission Rights Auction
The Transmission Rights Market is a financial market that is based on the import and
export of electricity on the interconnection lines between Ontario and its surrounding
markets in Manitoba, Quebec, New York, Michigan and Minnesota. The transmission
capacity of these interconnections is limited. When the interconnection lines reach their
limits, energy prices can differ between Ontario and its surrounding markets. The
Transmission Rights Market allows participants to buy financial protection ahead of
time, to hedge against the possible price differences. These transmission rights are
financial only. They do not give the holder of these rights any scheduling priority and
do not limit other participants’ access to physical transmission across the
interconnection lines.
The Transmission Rights contracts are auctioned off by the IESO. Successful bidders
pay the market clearing price for the particular Transmission Right, in return for the
right to receive revenues from the IESO in amounts proportional to the financial
congestion which may occur over that interface for the duration of the contract.
This month, the IESO conducted three transmission rights auctions. The market clearing
prices in the auctions are listed in the table below. The prices have been rounded to the
nearest dollar.
Short Term Auction January 2017
$/MW
Intertie Zone
Import to
Ontario
Export from
Ontario
New York 37 3645
Michigan 1 7855
Minnesota 142 3864
Manitoba 96 3945
Quebec - AT
85 370
Quebec - D5A
0 0
Quebec - D4Z
0
Quebec - P33C
0
Quebec - X2Y
0
Quebec - H4Z
1
Quebec - B5D/B31L
5
Monthly Market Report January 2017 Page 7 of 23
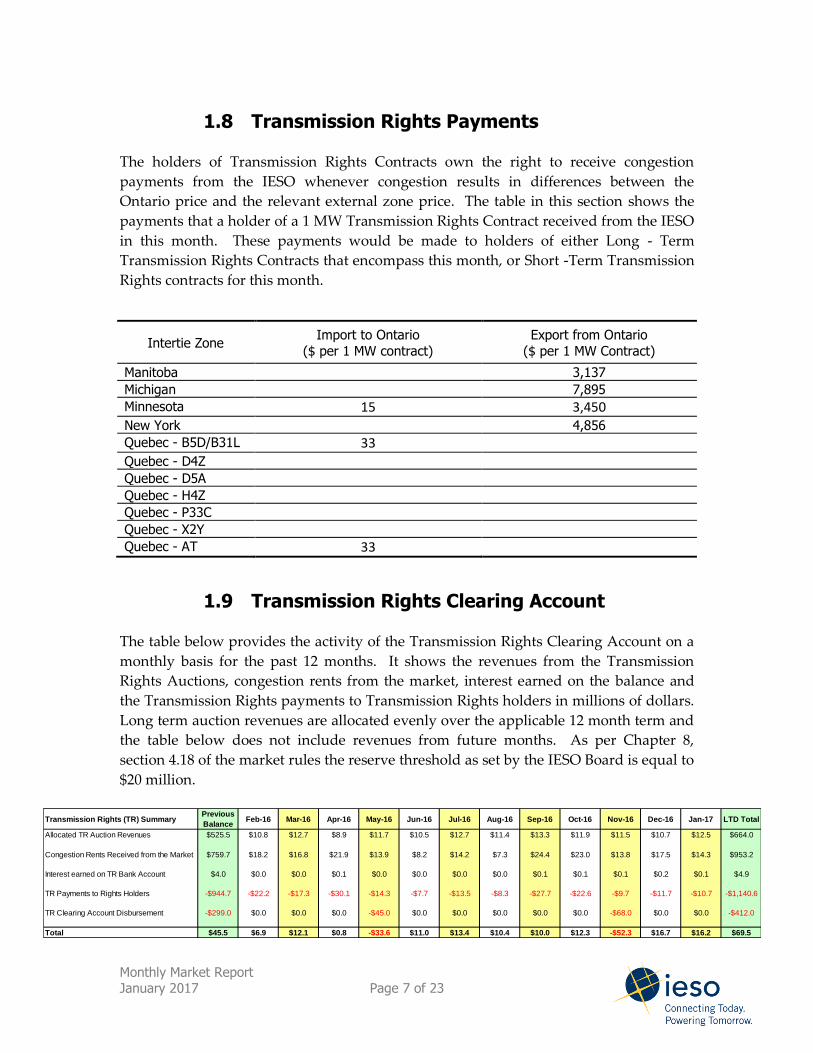
1.8 Transmission Rights Payments
The holders of Transmission Rights Contracts own the right to receive congestion
payments from the IESO whenever congestion results in differences between the
Ontario price and the relevant external zone price. The table in this section shows the
payments that a holder of a 1 MW Transmission Rights Contract received from the IESO
in this month. These payments would be made to holders of either Long - Term
Transmission Rights Contracts that encompass this month, or Short -Term Transmission
Rights contracts for this month.
Intertie Zone Import to Ontario
($ per 1 MW contract)
Export from Ontario
($ per 1 MW Contract)
Manitoba 3,137
Michigan 7,895
Minnesota 15 3,450
New York 4,856
Quebec - B5D/B31L 33
Quebec - D4Z
Quebec - D5A
Quebec - H4Z
Quebec - P33C
Quebec - X2Y
Quebec - AT 33
1.9 Transmission Rights Clearing Account
The table below provides the activity of the Transmission Rights Clearing Account on a
monthly basis for the past 12 months. It shows the revenues from the Transmission
Rights Auctions, congestion rents from the market, interest earned on the balance and
the Transmission Rights payments to Transmission Rights holders in millions of dollars.
Long term auction revenues are allocated evenly over the applicable 12 month term and
the table below does not include revenues from future months. As per Chapter 8,
section 4.18 of the market rules the reserve threshold as set by the IESO Board is equal to
$20 million.
Transmission Rights (TR) SummaryPrevious
BalanceFeb-16 Mar-16 Apr-16 May-16 Jun-16 Jul-16 Aug-16 Sep-16 Oct-16 Nov-16 Dec-16 Jan-17 LTD Total
Allocated TR Auction Revenues $525.5 $10.8 $12.7 $8.9 $11.7 $10.5 $12.7 $11.4 $13.3 $11.9 $11.5 $10.7 $12.5 $664.0
Congestion Rents Received from the Market $759.7 $18.2 $16.8 $21.9 $13.9 $8.2 $14.2 $7.3 $24.4 $23.0 $13.8 $17.5 $14.3 $953.2
Interest earned on TR Bank Account $4.0 $0.0 $0.0 $0.1 $0.0 $0.0 $0.0 $0.0 $0.1 $0.1 $0.1 $0.2 $0.1 $4.9
TR Payments to Rights Holders -$944.7 -$22.2 -$17.3 -$30.1 -$14.3 -$7.7 -$13.5 -$8.3 -$27.7 -$22.6 -$9.7 -$11.7 -$10.7 -$1,140.6
TR Clearing Account Disbursement -$299.0 $0.0 $0.0 $0.0 -$45.0 $0.0 $0.0 $0.0 $0.0 $0.0 -$68.0 $0.0 $0.0 -$412.0
Total $45.5 $6.9 $12.1 $0.8 -$33.6 $11.0 $13.4 $10.4 $10.0 $12.3 -$52.3 $16.7 $16.2 $69.5
Monthly Market Report January 2017 Page 8 of 23
2. Market Demand
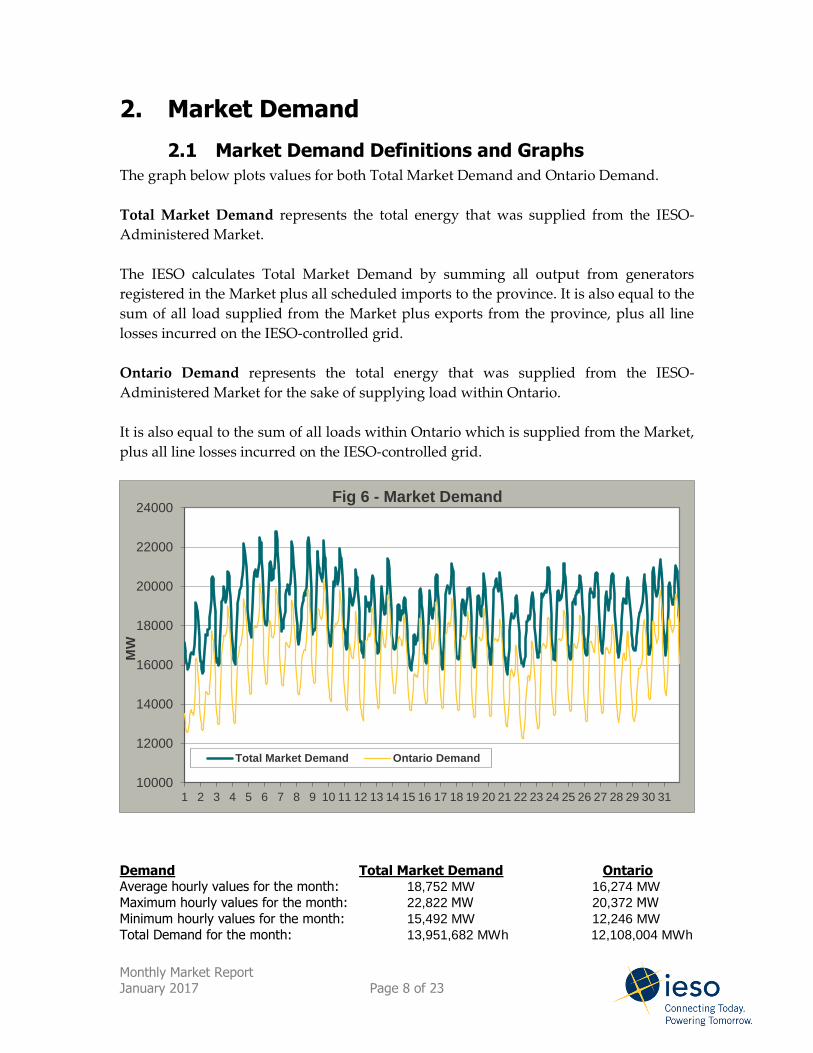
2.1 Market Demand Definitions and Graphs
The graph below plots values for both Total Market Demand and Ontario Demand.
Total Market Demand represents the total energy that was supplied from the IESO-
Administered Market.
The IESO calculates Total Market Demand by summing all output from generators
registered in the Market plus all scheduled imports to the province. It is also equal to the
sum of all load supplied from the Market plus exports from the province, plus all line
losses incurred on the IESO-controlled grid.
Ontario Demand represents the total energy that was supplied from the IESO-
Administered Market for the sake of supplying load within Ontario.
It is also equal to the sum of all loads within Ontario which is supplied from the Market,
plus all line losses incurred on the IESO-controlled grid.
Demand Total Market Demand Ontario Average hourly values for the month: 18,752 MW 16,274 MW
Maximum hourly values for the month: 22,822 MW 20,372 MW
Minimum hourly values for the month: 15,492 MW 12,246 MW
Total Demand for the month: 13,951,682 MWh 12,108,004 MWh
10000
12000
14000
16000
18000
20000
22000
24000
1 2 3 4 5 6 7 8 9 10 11 12 13 14 15 16 17 18 19 20 21 22 23 24 25 26 27 28 29 30 31
MW
Fig 6 - Market Demand
Total Market Demand Ontario Demand
Monthly Market Report January 2017 Page 9 of 23
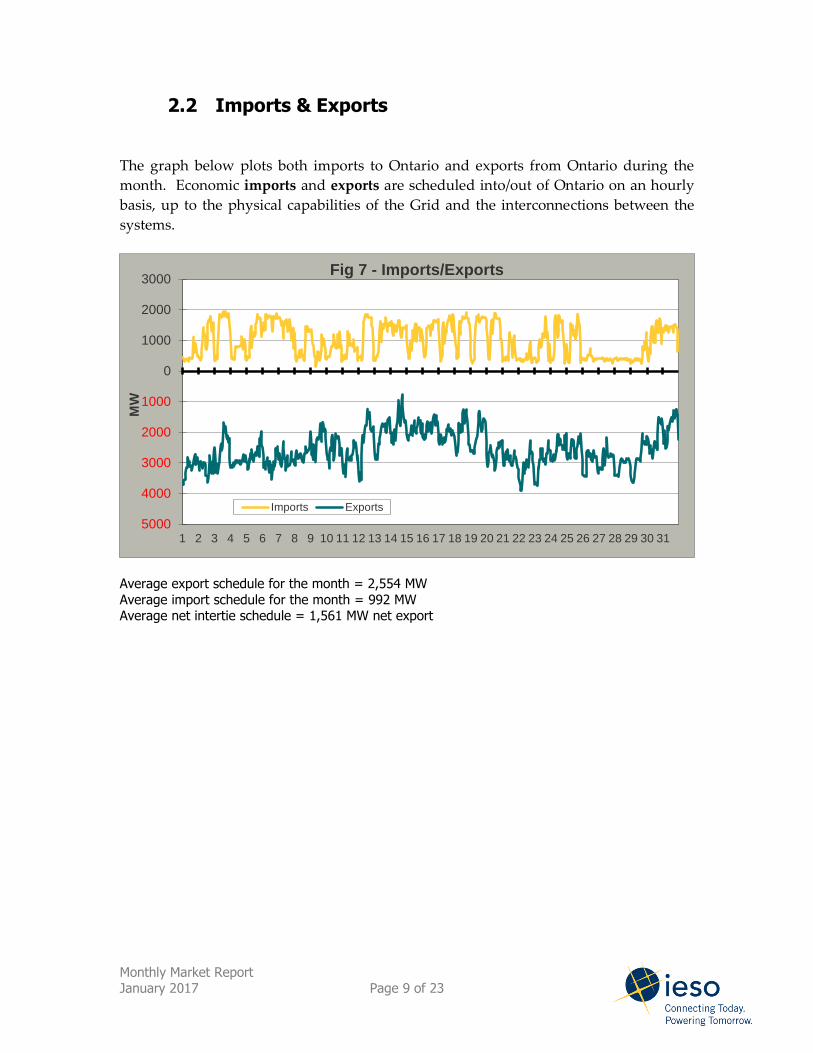
2.2 Imports & Exports
The graph below plots both imports to Ontario and exports from Ontario during the
month. Economic imports and exports are scheduled into/out of Ontario on an hourly
basis, up to the physical capabilities of the Grid and the interconnections between the
systems.
Average export schedule for the month = 2,554 MW
Average import schedule for the month = 992 MW Average net intertie schedule = 1,561 MW net export
5000
4000
3000
2000
1000
0
1000
2000
3000
1 2 3 4 5 6 7 8 9 10 11 12 13 14 15 16 17 18 19 20 21 22 23 24 25 26 27 28 29 30 31
MW
Fig 7 - Imports/Exports
Imports Exports
Monthly Market Report January 2017 Page 10 of 23
3. Unavailable Capacity
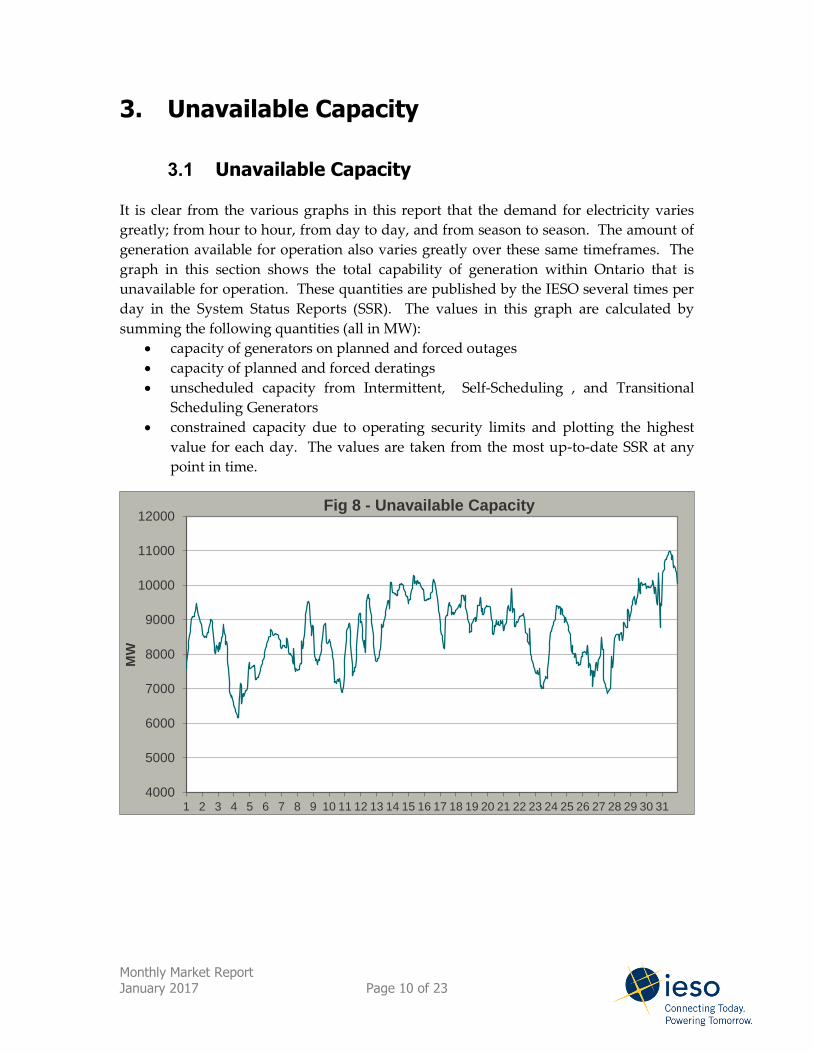
3.1 Unavailable Capacity
It is clear from the various graphs in this report that the demand for electricity varies
greatly; from hour to hour, from day to day, and from season to season. The amount of
generation available for operation also varies greatly over these same timeframes. The
graph in this section shows the total capability of generation within Ontario that is
unavailable for operation. These quantities are published by the IESO several times per
day in the System Status Reports (SSR). The values in this graph are calculated by
summing the following quantities (all in MW):
capacity of generators on planned and forced outages
capacity of planned and forced deratings
unscheduled capacity from Intermittent, Self-Scheduling , and Transitional
Scheduling Generators
constrained capacity due to operating security limits and plotting the highest
value for each day. The values are taken from the most up-to-date SSR at any
point in time.
4000
5000
6000
7000
8000
9000
10000
11000
12000
1 2 3 4 5 6 7 8 9 10 11 12 13 14 15 16 17 18 19 20 21 22 23 24 25 26 27 28 29 30 31
MW
Fig 8 - Unavailable Capacity

Monthly Market Report January 2017 Page 11 of 23
4. Weather
4.1 Temperature
Demand for electricity is affected by weather in many ways. By far the most significant
factor is temperature, with warm summer-like temperatures causing an increase in load
due to air conditioning use, and cold winter temperatures resulting in additional heating
load. The graph below shows the average daily temperature in Toronto throughout this
month, and compares it to historic average temperatures for the corresponding days.
This graph displays Toronto temperatures. However, the IESO monitors weather
conditions (temperature, humidity, wind speed, illumination, storm activities) across the
entire province and factors these conditions into our demand forecasting and our
operational decisions.
-14.0
-12.0
-10.0
-8.0
-6.0
-4.0
-2.0
0.0
2.0
4.0
6.0
1 2 3 4 5 6 7 8 9 10 11 12 13 14 15 16 17 18 19 20 21 22 23 24 25 26 27 28 29 30 31
Tem
p (
°C)
Fig 9 - Temperature at Toronto
Jan 2017 Data Hist. Jan Ave
Monthly Market Report January 2017 Page 12 of 23
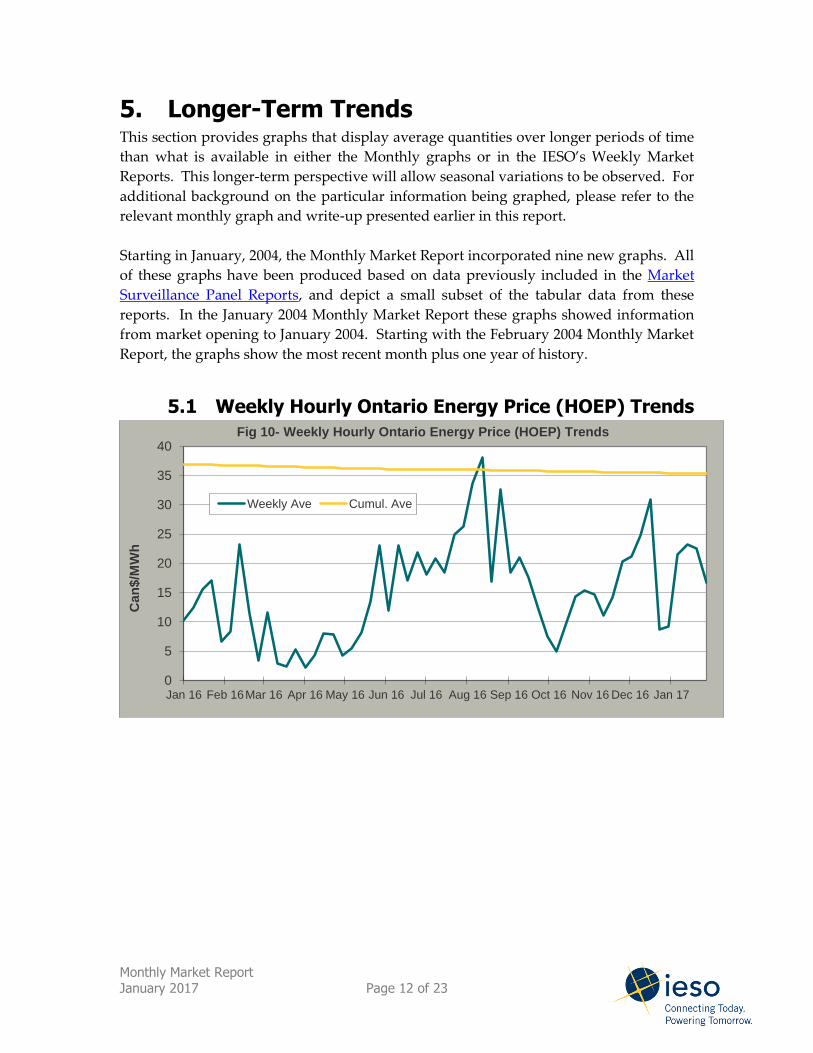
5. Longer-Term Trends This section provides graphs that display average quantities over longer periods of time
than what is available in either the Monthly graphs or in the IESO’s Weekly Market
Reports. This longer-term perspective will allow seasonal variations to be observed. For
additional background on the particular information being graphed, please refer to the
relevant monthly graph and write-up presented earlier in this report.
Starting in January, 2004, the Monthly Market Report incorporated nine new graphs. All
of these graphs have been produced based on data previously included in the Market
Surveillance Panel Reports, and depict a small subset of the tabular data from these
reports. In the January 2004 Monthly Market Report these graphs showed information
from market opening to January 2004. Starting with the February 2004 Monthly Market
Report, the graphs show the most recent month plus one year of history.
5.1 Weekly Hourly Ontario Energy Price (HOEP) Trends
0
5
10
15
20
25
30
35
40
Jan 16 Feb 16Mar 16 Apr 16 May 16 Jun 16 Jul 16 Aug 16 Sep 16 Oct 16 Nov 16 Dec 16 Jan 17
Can
$/M
Wh
Fig 10- Weekly Hourly Ontario Energy Price (HOEP) Trends
Weekly Ave Cumul. Ave

Monthly Market Report January 2017 Page 13 of 23
5.2 HOEP Prices (Monthly Arithmetic Ave)
5.3 Operating Reserve Prices (Monthly Arithmetic Ave)
0
5
10
15
20
25
30
35
40
45
Jan Feb Mar Apr May Jun Jul Aug Sep Oct Nov Dec Jan
2016 2016 2016 2016 2016 2016 2016 2016 2016 2016 2016 2016 2017
Can
$/M
W/h
r
Fig 11 - HOEP Prices (Monthly Arithmetic Ave)
Monthly Ave OnPeak Ave OffPeak Ave
0.00
2.00
4.00
6.00
8.00
10.00
12.00
14.00
Jan Feb Mar Apr May Jun Jul Aug Sep Oct Nov Dec Jan
2016 2016 2016 2016 2016 2016 2016 2016 2016 2016 2016 2016 2017
Can
$/M
W/h
r
Fig 12 - Operating Reserve Prices (Monthly Arithmetic Ave)
10 Min Sync 10 Min Non-Sync 30 Minute

Monthly Market Report January 2017 Page 14 of 23
5.4 Comparison to Neighbouring Control Area Prices
5.5 Ave Differences between HOEP and Pre-dispatch
0
10
20
30
40
50
60
70
80
Jan 16 Feb 16 Mar 16 Apr 16 May 16 Jun 16 Jul 16 Aug 16 Sep 16 Oct 16 Nov 16 Dec 16 Jan 17
Can
$/M
W/h
r
Fig 13 - Comparison to Neighbouring Control Area Prices
IESO HOEP NEPOOL NYISO PJM MISO
0
5
10
15
20
25
30
35
Jan Feb Mar Apr May Jun Jul Aug Sep Oct Nov Dec Jan
2016 2016 2016 2016 2016 2016 2016 2016 2016 2016 2016 2016 2017
Can
$/M
W/h
r
Fig 14 - Ave Differences between HOEP and Pre-dispatch
HOEP 3 hour ahead 1 hour ahead
Monthly Market Report January 2017 Page 15 of 23
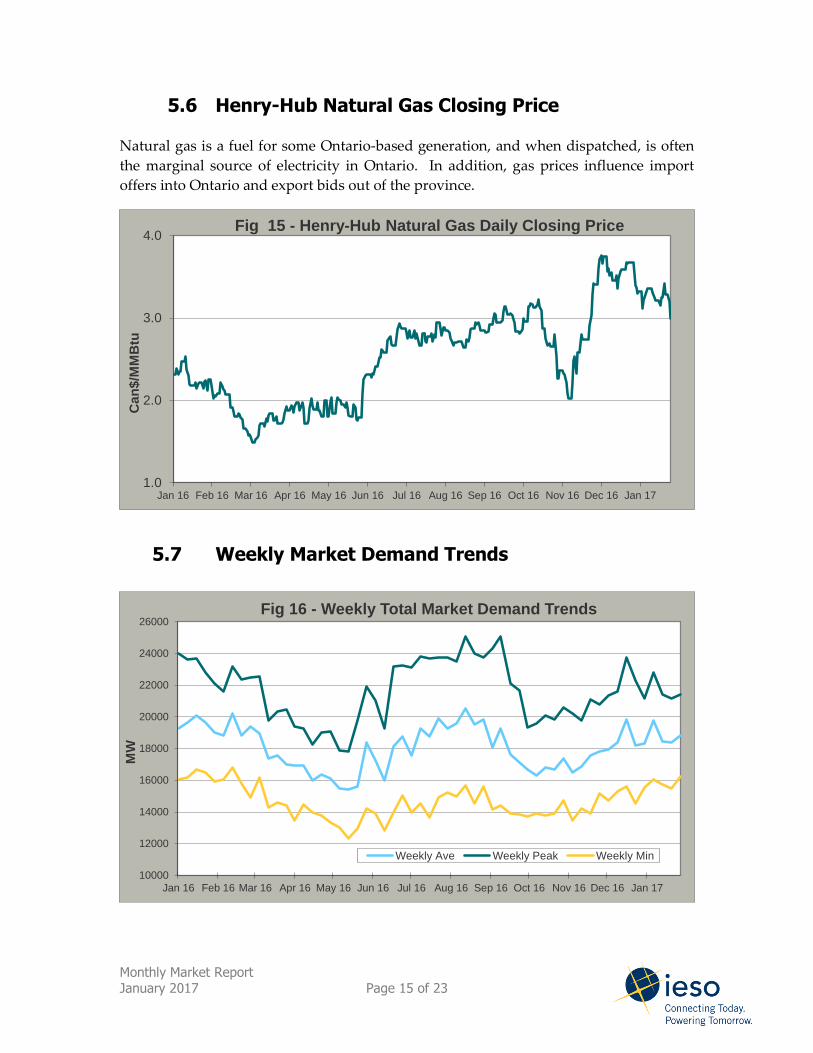
5.6 Henry-Hub Natural Gas Closing Price
Natural gas is a fuel for some Ontario-based generation, and when dispatched, is often
the marginal source of electricity in Ontario. In addition, gas prices influence import
offers into Ontario and export bids out of the province.
5.7 Weekly Market Demand Trends
1.0
2.0
3.0
4.0
Jan 16 Feb 16 Mar 16 Apr 16 May 16 Jun 16 Jul 16 Aug 16 Sep 16 Oct 16 Nov 16 Dec 16 Jan 17
Can
$/M
MB
tu
Fig 15 - Henry-Hub Natural Gas Daily Closing Price
10000
12000
14000
16000
18000
20000
22000
24000
26000
Jan 16 Feb 16 Mar 16 Apr 16 May 16 Jun 16 Jul 16 Aug 16 Sep 16 Oct 16 Nov 16 Dec 16 Jan 17
MW
Fig 16 - Weekly Total Market Demand Trends
Weekly Ave Weekly Peak Weekly Min
Monthly Market Report January 2017 Page 16 of 23
5.8 Monthly Energy Totals
5.9 Monthly Energy by Fuel Type
0
2
4
6
8
10
12
14
16
Jan Feb Mar Apr May Jun Jul Aug Sep Oct Nov Dec Jan
2016 2016 2016 2016 2016 2016 2016 2016 2016 2016 2016 2016 2017
TW
h
Fig 17 - Monthly Energy Totals
Exports Monthly Ontario Energy Demand
0
2
4
6
8
10
12
14
16
Jan Feb Mar Apr May Jun Jul Aug Sep Oct Nov Dec Jan
2016 2016 2016 2016 2016 2016 2016 2016 2016 2016 2016 2016 2017
TW
h
Fig 18 - Monthly Energy by Fuel Type
Nuclear Hydro Gas/Oil Solar Wind Biofuel Imports
Monthly Market Report January 2017 Page 17 of 23
5.10 Imports/Exports per Intertie Zone (Monthly Total)
Note: Imports are depicted as above zero, whereas Exports are depicted as below zero
5.11 Weekly Average Hourly Uplift Charges Trends
Uplift charges will now only be reported in one spot in this report – in the Table in
Section 7. The Daily Uplift which was introduced in October 2011 will also be added to
this table. The hourly uplift, IOG and monthly uplift values incorporate a few additional
charge types that were not previously included.
Definitions of Hourly Uplift Settlement Charge: The Hourly Uplift Settlement Charge
presents hourly charges which cover the costs of Operating Reserve, Congestion
Management Settlement Credits, Intertie Offer Guarantee payments (IOG), and other
hourly costs such as energy losses on the IESO-controlled grid.
5.12 Hourly Uplifts (Monthly Total)
Uplift charges will now only be reported in one spot in this report – in the Table in
Section 7. The Daily Uplift which was introduced in October 2011 will also be added to
this table. The hourly uplift, IOG and monthly uplift values incorporate a few additional
charge types that were not previously included.
1500
1000
500
0
500
1000
1500
Jan Feb Mar Apr May Jun Jul Aug Sep Oct Nov Dec Jan
2016 2016 2016 2016 2016 2016 2016 2016 2016 2016 2016 2016 2017
GW
h
Fig 19 - Imports/Exports per Intertie Zone (Monthly Total)
Man Minn Mich New York Quebec
Monthly Market Report January 2017 Page 18 of 23
5.13 Weekly Maximum Unavailable Capacity Trends
5.14 Weekly Temperature at Toronto Trends
5,000
7,000
9,000
11,000
13,000
15,000
17,000
Jan 16 Feb 16 Mar 16 Apr 16 May 16 Jun 16 Jul 16 Aug 16 Sep 16 Oct 16 Nov 16 Dec 16 Jan 17
MW
Fig 20 - Weekly Maximum Unavailable Capacity Trends
-15
-10
-5
0
5
10
15
20
25
30
Jan 16 Feb 16 Mar 16 Apr 16 May 16 Jun 16 Jul 16 Aug 16 Sep 16 Oct 16 Nov 16 Dec 16 Jan 17
Te
mp
(°C
)
Fig 21- Weekly Temperature at Toronto Trends
Actual Weekly Ave Hist. Weekly Ave

Monthly Market Report January 2017 Page 19 of 23
6. Global Adjustment
The global adjustment mechanism (GA) is the difference between the total payments
made to certain contracted or regulated generators, demand management, and
conservation programs, and any offsetting market revenues. The GA charge applied to
all customers in Ontario, including customers who pay the market price (HOEP) and
customers who have signed a contract with a licensed electricity retailer. For customers
on the Regulated Price Plan (RPP), it is factored into the rate set by the Ontario Energy
Board. The adjustment may be positive or negative depending on the fluctuation of
prices in the wholesale electricity market.
The GA is calculated as a total dollar amount for each month based on the difference
between market revenues and the following components:
Wind
• Includes projects under Renewable Energy Supply, Renewable Energy Standard
Offer Program, and the Feed-in-Tariff program
Biomass, Landfill and Byproduct
• Includes projects under Renewable Energy Supply, Renewable Energy Standard
Offer Program, Feed-in-Tariff, recently converted OPG Atikokan and Thunder
Bay facilities, and NUG contracts with the IESO
Hydro
• Facilities with agreements through Renewable Energy Supply Program,
Renewable Energy Standard Offer Program, Hydroelectric Contract Initiative,
and the Feed-in-Tariff programs. Also includes OPG's facilities that fall under
the Hydroelectric Energy Supply Agreement.
Nuclear (non-OPG) and Natural Gas
• Bruce Power nuclear and natural gas facilities including OPG’s Lennox (dual
fuel).
Solar
• Includes projects under Renewable Energy Supply, Renewable Energy Standard
Offer Program, and the Feed-in-Tariff program
Industrial Electricity Incentive Program
• An incentive for eligible consumers in Ontario to increase industrial production.
Eligible activities include building a new, or expanding a facility, in a specific
NAICS Canada 2012 sector.
Funds and Financing

Monthly Market Report January 2017 Page 20 of 23
• Includes programs supporting community group in the design and delivery of
renewable energy initiatives. It also includes contract penalties received from
generators.
Conservation
• Conservation programs including Save on Energy and the Conservation Fund
Ontario Power Generation – Regulated Nuclear and Hydro
• Regulated rates for OPG’s nuclear and remaining hydro generation set by the
Ontario Energy Board
Ontario Electricity Financial Corporation – Non-Utility Generation
• Contracts administered by the Ontario Electricity Financial Corporation with
existing generation facilities
Customers with an average demand over three megawatts are eligible to pay for the
global adjustment based on a coincident peak calculation. Consumers with an
average demand three megawatts and under pay the global adjustment based on
the total amount of energy they used for the month. For more information on how
Class A and B customers pay the GA, see: http://www.ieso.ca/Pages/Ontario%27s-
Power-System/Electricity-Pricing-in-Ontario/Global-Adjustment.aspx. The total GA
amount and the actual Class B rate are depicted below in Figure 22.
-1200
-1000
-800
-600
-400
-200
0
-120
-110
-100
-90
-80
-70
-60
-50
-40
-30
-20
-10
0Jan 16 Feb 16 Mar 16 Apr 16 May 16 Jun 16 Jul 16 Aug 16Sep 16 Oct 16 Nov 16Dec 16 Jan 17
M $
$/M
Wh
Fig. 22 - Global Adjustment
GA amount - Monthly (M $) Actual GA Class B rate - Monthly ($/MWh)
Monthly Market Report January 2017 Page 21 of 23
The graph below (Figure 23) highlights the components of the GA amount. The GA
amounts increase or decrease in response to changes in HOEP. When HOEP is
lower, the GA is higher to cover the additional payments such as for energy
contracts, and regulated generation.
Note: Figure 23 – Total Global Adjustment by Components graph has been re-
categorized based on stakeholder feedback to provide more transparency and better
reflect GA component amounts, specifically by fuel type effective February 2016.
-$200
$0
$200
$400
$600
$800
$1,000
$1,200
Jan-16 Feb-16 Mar-16 Apr-16 May-16 Jun-16 Jul-16 Aug-16 Sep-16 Oct-16 Nov-16 Dec-16 Jan-17
$M
Fig. 23 - Total Global Adjustment by Components
Wind
Solar
Biomass, Landfill andByproduct
Hydro
Nuclear (non-OPG) andNatural Gas
Industrial ElectricityIncentive Program
Financing Charges andFunds
Conservation
Ontario PowerGeneration - RegulatedNuclear and HydroOntario ElectricityFinance Corporation -Non-Utility Generation
Monthly Market Report January 2017 Page 22 of 23
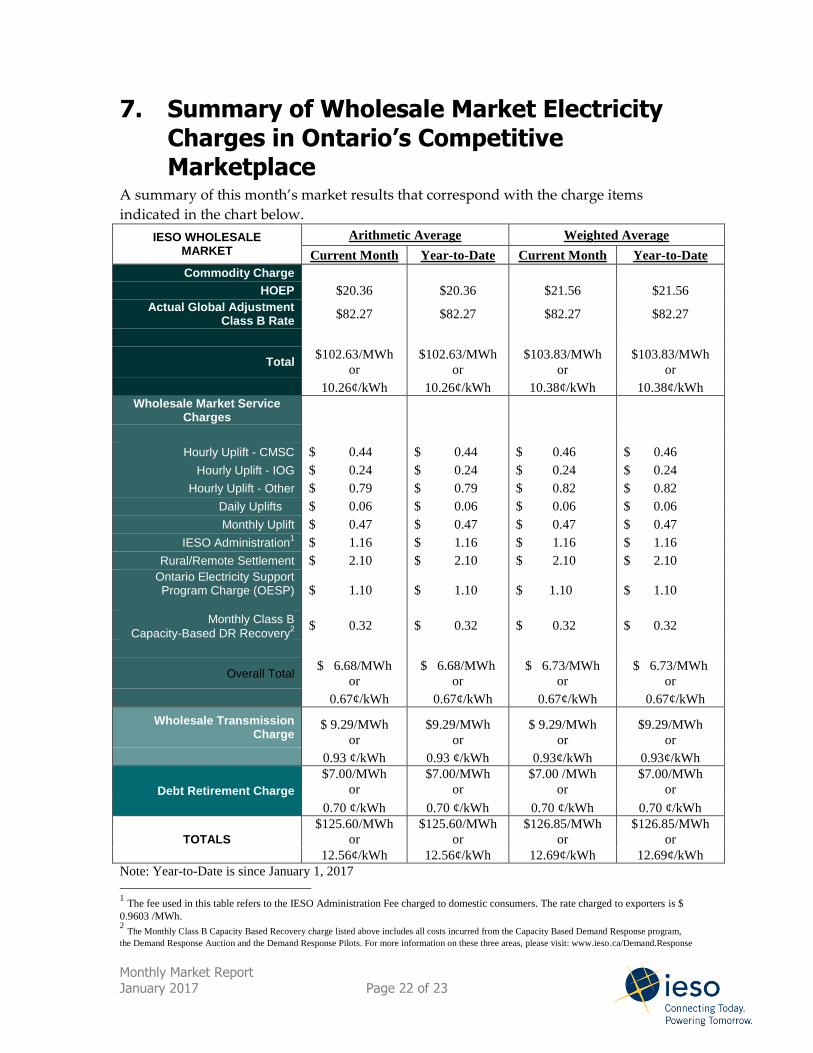
7. Summary of Wholesale Market Electricity Charges in Ontario’s Competitive Marketplace
A summary of this month’s market results that correspond with the charge items
indicated in the chart below.
IESO WHOLESALE MARKET
Arithmetic Average Weighted Average
Current Month Year-to-Date Current Month Year-to-Date
Commodity Charge HOEP $20.36 $20.36 $21.56 $21.56
Actual Global Adjustment Class B Rate
$82.27 $82.27 $82.27 $82.27
Total $102.63/MWh
or
$102.63/MWh
or
$103.83/MWh
or
$103.83/MWh
or
10.26¢/kWh 10.26¢/kWh 10.38¢/kWh 10.38¢/kWh
Wholesale Market Service Charges
Hourly Uplift - CMSC $ 0.44 $ 0.44 $ 0.46 $ 0.46
Hourly Uplift - IOG $ 0.24 $ 0.24 $ 0.24 $ 0.24
Hourly Uplift - Other $ 0.79 $ 0.79 $ 0.82 $ 0.82
Daily Uplifts $ 0.06 $ 0.06 $ 0.06 $ 0.06
Monthly Uplift $ 0.47 $ 0.47 $ 0.47 $ 0.47
IESO Administration1 $ 1.16 $ 1.16 $ 1.16 $ 1.16
Rural/Remote Settlement $ 2.10 $ 2.10 $ 2.10 $ 2.10
Ontario Electricity Support Program Charge (OESP)
$ 1.10 $ 1.10 $ 1.10 $ 1.10
Monthly Class B
Capacity-Based DR Recovery2
$ 0.32 $ 0.32 $ 0.32 $ 0.32
Overall Total $ 6.68/MWh
or
$ 6.68/MWh
or
$ 6.73/MWh
or
$ 6.73/MWh
or
0.67¢/kWh 0.67¢/kWh 0.67¢/kWh 0.67¢/kWh
Wholesale Transmission Charge
$ 9.29/MWh
or
$9.29/MWh
or
$ 9.29/MWh
or
$9.29/MWh
or
0.93 ¢/kWh 0.93 ¢/kWh 0.93¢/kWh 0.93¢/kWh
Debt Retirement Charge
$7.00/MWh
or
$7.00/MWh
or
$7.00 /MWh
or
$7.00/MWh
or
0.70 ¢/kWh 0.70 ¢/kWh 0.70 ¢/kWh 0.70 ¢/kWh
TOTALS
$125.60/MWh
or
$125.60/MWh
or
$126.85/MWh
or
$126.85/MWh
or
12.56¢/kWh 12.56¢/kWh 12.69¢/kWh 12.69¢/kWh
Note: Year-to-Date is since January 1, 2017
1 The fee used in this table refers to the IESO Administration Fee charged to domestic consumers. The rate charged to exporters is $
0.9603 /MWh. 2 The Monthly Class B Capacity Based Recovery charge listed above includes all costs incurred from the Capacity Based Demand Response program,
the Demand Response Auction and the Demand Response Pilots. For more information on these three areas, please visit: www.ieso.ca/Demand.Response
Monthly Market Report January 2017 Page 23 of 23
There are two commodity charges quoted above. The arithmetic average price would be
representative of the average commodity charge for a customer whose electrical demand is
relatively consistent throughout the day, the night and the weekends. The weighted average
price would be applicable to a customer whose consumption mirrored that of the total system.
The actual average commodity price paid by a wholesale customer will be very sensitive to their
consumption pattern.
The Wholesale Transmission Charge listed above has been calculated by summing all
transmission-related fees paid by all loads in the province, and dividing that sum by the total
energy delivered to those loads. As such, this number is not representative of the fee paid by any
particular customer. Rather, each customer’s actual fee for transmission service will depend on
many factors such as peak consumption pattern and the types of transmission services applicable
to the customer.
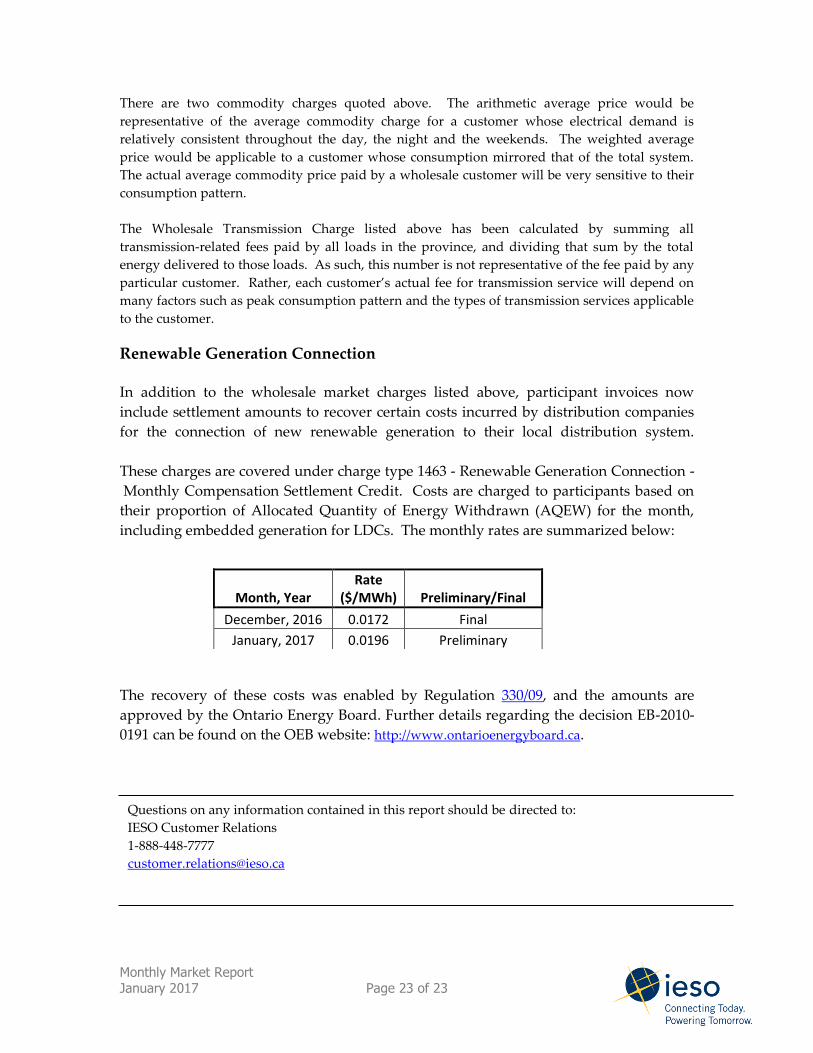
Renewable Generation Connection
In addition to the wholesale market charges listed above, participant invoices now
include settlement amounts to recover certain costs incurred by distribution companies
for the connection of new renewable generation to their local distribution system.
These charges are covered under charge type 1463 - Renewable Generation Connection -
Monthly Compensation Settlement Credit. Costs are charged to participants based on
their proportion of Allocated Quantity of Energy Withdrawn (AQEW) for the month,
including embedded generation for LDCs. The monthly rates are summarized below:
Month, Year Rate
($/MWh) Preliminary/Final
December, 2016 0.0172 Final
January, 2017 0.0196 Preliminary
The recovery of these costs was enabled by Regulation 330/09, and the amounts are
approved by the Ontario Energy Board. Further details regarding the decision EB-2010-
0191 can be found on the OEB website: http://www.ontarioenergyboard.ca.
Questions on any information contained in this report should be directed to:
IESO Customer Relations
1-888-448-7777
Recommended