Physi,tltJflY & Beha"ivr, Vol. 32, pp. 489-502. Copyright () Pergamon Press Ltd., 1984. Printed in the U.S.A.0031-9384/84 $3.00 + .00
MONOGRAPH
RICHARD L. DOTY,*t+1 PAUL SHAMAN*§ AND MICHAEL DANN*
*Clini('al Smell and Taste Research Center. tDepartment of Otorhinolaryngology and Human Communication+Department of Physiology. School of Medicine. University of Pennsylvania
Philadelphia. PA /9/04and §Department of Statistics. The Wharton SchoolUniversity of Pennsylvania. Philadelphia. PA /9/04
Received 8 July 1983
DOTY, R. L., P. SHAMAN AND M. DANN. Development (if the University (if Pennsylvania Smell Identificati(ln Test: A.\'tandardized mu'r(lencapsulated test (if (I/fact(lry functi(ln. PHYSIOL BEHA V 32(3) 489-502, 1984.-The development ofthe first standardized "scratch 'n sniff' olfactory test is described. Over 1600 subjects participated in five experiments. InExperiment I, 50 microencapsulated odorants were rated as to their intensity; pleasantness, irritation, coolness, andfamiliarity, and two procedures for releasing them were compared. In Experiment 2, the results of the first experiment andother data were used in the development of the test, which was administered to a large number of subjects. U sing multipleregression analysis, scores on this test were shown to be significantly related to the subjects' gender, ethnic background,and smoking behavior. A verage test scores decreased as a function of age, with the greatest decline occurring between thesixth and tenth decades of life. These age-related changes were not correlated with scores on the Wechsler Memory Scale.Women performed better than men within all age categories. In Experiment 3, the test was shown to differentiate betweensubjects with known olfactory disorders (e.g., Kallmann's syndrome; Korsakoffs syndrome) and normal controls, and toreliably detect persons instructed to feign total anosmia. In Experiment 4, the test-retest reliability was established(6-month interval; r=0.918, p<O.00I), and in Experiment 5 the test was shown to correlate thresholds with odor detec-tion (r=-0.794, p<O.00I). This self-administratered test now makes it possible to rapidly and accurately assess generalolfactory function in the laboratory, clinic, or through the mail without complex equipment or space-consuming stores ofchemicals.
Aging Anosmia Hyposmia Kallmann's syndrome Korsakoff's syndrome Malingering MemoryMicroencapsulation Multiple sclerosis Olfaction Olfactory thresh~ld PsychophysicsSex differences Smoking Suprathreshold scaling
THE sense of smell largely determines the flavor of the foodswe ingest and the beverages we savor, and serves as animportant early warning system for the detection of fire,dangerous fumes, leaking gas, spoiled foods, and pollutedenvironments. Despite these important functions, few phy-siology or medical textbooks discuss procedures for evaluat-ing this sense, and most fail to emphasize the fact that olfac-tory disorders commonly occur as a result of accidents, dis-ease states, medical interventions, aging, and exposure to anumber of environmental pollutants [ 14,20, 29, 59]. Further-
'Requests for reprints should be addressed to Richard L. Doty, Director, Smell and Taste Center, 5 Ravdin Building. Hospital of theUniversity of Pennsylvania, 3400 Spruce Street, Philadelphia, PA t9104. A commercial version of the University of Pennsylvania SmellIdentification Test is available through Sensonics. Inc..
more, it is rarely mentioned that smell disorders can serve asimportant diagnostic signs of a number of serious diseasesand anomalies, including ones related to the ontogeny of thehypothalamus and pituitary £10, 16, 35, 50], intracranialneoplasms £3,22], and temporal lobe epilepsy [5, 7, 46].
Such omissions do not stem from a want of personsevidencing olfactory problems. For example, data from theNational Ambulatory Medical Care Survey suggest that, for1975 and 1976 combined, 435,000 visits to physicians' officesoccurred in which a major presenting complaint was
489
DOTY. SHAMAN AND DANN490
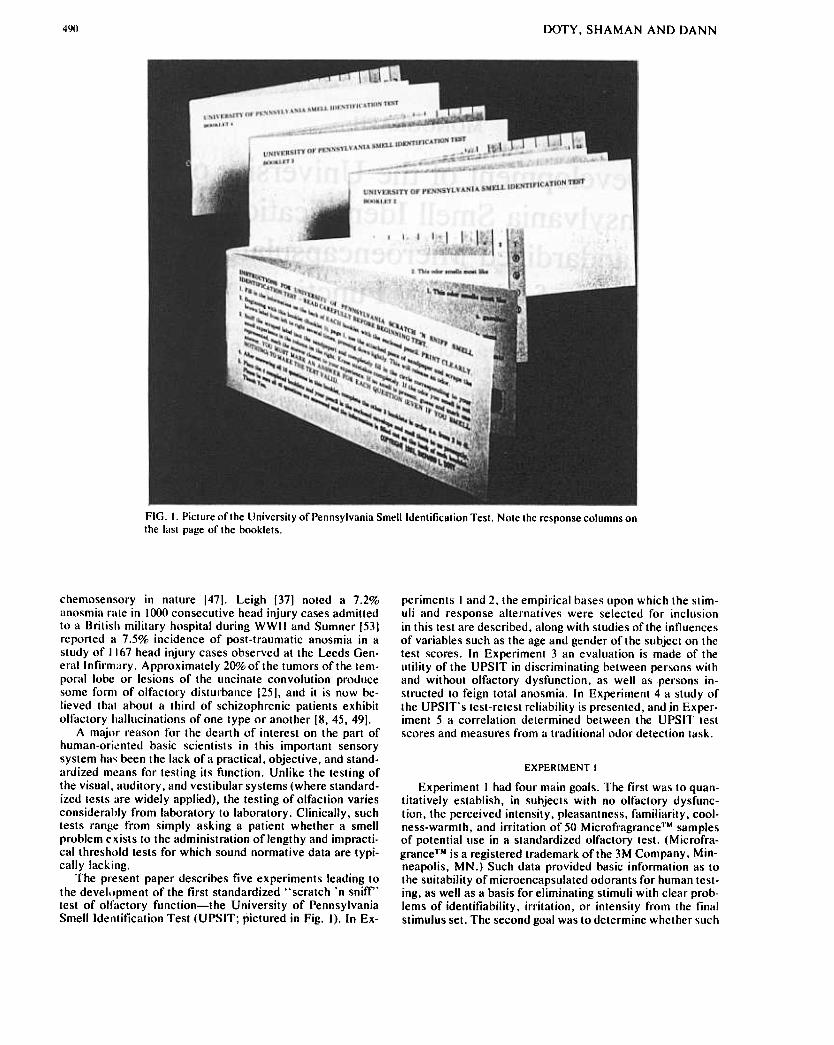
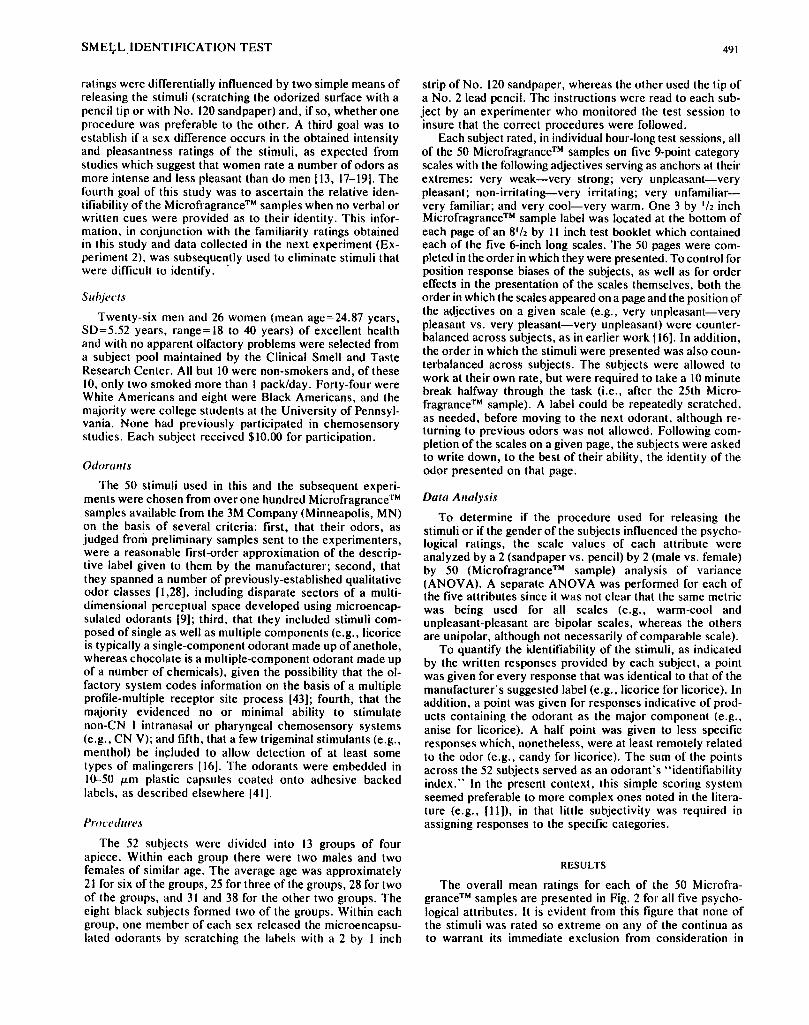
FIG. I. Picture of the University of Pennsylvania Smell Identilication Test. Note the response columns onthe last page of the booklets.
periments I and 2, the empirical bases upon which the stim-uli and response alternatives were selected for inclusionin this test are described, along with studies of the influencesof variables such as the age and gender of the subject on thetest scores. In Experiment 3 an evaluation is made of theutility of the UPSIT in discriminating between persons withand without olfactory dysfunction, as well as persons in-structed to feign total anosmia. In Experiment 4 a study ofthe UPSIT.s test-retest reliability is presented, and jn Exper-iment 5 a correlation determined between the UPSIT testscores and measures from a traditional odor detection task.
EXPERIMENT I
Experiment I had four main goals. The first was to quan-titatively establish, in subjects with no olfactory dysfunc-tion, the perceived intensity, pleasantness, familiarity, cool-ness-warmth, and irritation of 50 MicrofragranceTM samplesof potential use in a standardized olfactory test. (Microfra-granceTM is a registered trademark of the 3M Company, Min-neapolis, MN.) Such data provided basic information as tothe suitability of microencapsulated odorants for human test-ing, as well as a basis for eliminating stimuli with clear prob-lems of identifiability, irritation, or intensity from the finalstimulus set. The second goal was to determine whether such
chemosensory in nature 147]. Leigh [37] noted a 7.2%anosmia rale in 1000 consecutive head injury cases admittedto a Britisll military hospital during WWII and Sumner [53]reported a 7.5% incidence of post-traumatic anosmia in astudy of 1167 head injury cases observed at the Leeds Gen-erullnfirmary. Approximately 20% of the tumors of the tem-poral lobe or lesions of the uncinate convolution producesome form of olfactory disturbance (25], and it is now be-lieved that about a third of schizophrenic patients exhibitolfactory Ilallucinations of one type or another 18,45,49].
A major reason for the dearth of interest on the part ofhuman-ori\?nted basic scientists in this important sensorysystem has been the lack of a practical, objective, and stand-ardized m\?ans for testing its function. Unlike the testing ofthe visual, auditory, and vestibular systems (where standard-ized tests are widely applied), the testing of olfaction variesconsideralJly from laboratory to laboratory. Clinically, suchtests range from simply asking a patient whether a smellproblem e xists to the administration of lengthy and impracti-car threshold tests for which sound normative data are typi-
cally lacking.The present paper describes five experiments leading to
the devel,lpment of the first standardized "scratch 'n sniff'test of olfactory function-the University of PennsylvaniaSmell Identification Test (UPSIT; pictured in Fig. I). In Ex-
SMEI;.L,IDENTIFICATION TEST 491
ratings were differentially influenced by two simple means ofreleasing the stimuli (scratching the odorized surface with apencil tip or with No. 120 sandpaper) and, if so, whether oneprocedure was preferable to the other. A third goal was toestablish if a sex difference occurs in the obtained intensityand pleasantness ratings of the stimuli, as expected fromstudies which suggest that women rate a number of odors asmore intense and less pleasant than do men [13, 17-191. Thefourth goal of this study was to ascertain the relative iden-tifiability of the MicrofragranceTM samples when no verbal orwritten cues were provided as to their identity. This infor-illation, in conjunction with the familiarity ratings obtainedin this study and data collected in the next experiment (Ex-periment 2), was subsequently used to eliminate stimuli thatwere difficult to identify. .
strip of No.120 sandpaper, whereas the other used the tip ofa No.2 lead pencil. The instructions were read to each sub-ject by an experimenter who monitored the test session toinsure that the correct procedures were followed.
Each subject rated, in individual hour-long test sessions, allof the 50 MicrofragranceTM samples on five 9-point categoryscales with the following adjectives serving as anchors at theirextremes: very weak-very strong; very unpleasant-verypleasant; non-irritating-very irritating; very unfamiliar-very familiar; and very cool-very warm. One 3 by 1/2 inchMicrofragranceTM sample label was located at the bottom ofeach page of an 81/2 by II inch test booklet which containedeach of the five 6-inch long scales. The 50 pages were com-pleted in the order in which they were presented. To control forposition response biases of the subjects, as well as for ordereffects in the presentation of the scales themselves, both theorder in which the scales appeared on a page and the position ofthe adjectives on a given scale (e.g., very unpleasant-verypleasant vs. very pleasant-very unpleasant) were counter-balanced across subjects, as in earlier work ( 16]. In addition,the order in which the stimuli were presented was also coun-terbalanced across subjects. The subjects were allowed towork at their own rate, but were required to take a 10 minutebreak halfway through the task (i.e., after the 25th Micro-fragranceTM sample). A label could be repeatedly scratched,as needed, before moving to the next odorant, although re-turning to previous odors was not allowed. Following com-pletion of the scales on a given page, the subjects were askedto write down, to the best of their ability, the identity of theodor presented on that page.
Sllhjects
Twenty-six men and 26 women (mean age=24.87 years,SD=5.52 years, range= 18 to 40 years) of excellent healthand with no apparent olfactory problems were selected froma subject pool maintained by the Clinical Smell and TasteResearch Center. All but 10 were non-smokers and, of these10, only two smoked more than 1 pack/day. Forty-four wereWhite Americans and eight were Black Americans, and themajority were college students at the University of pennsyl-vania. None had previously participated in chemosensorystudies. Each subject received $10.00 for participation.
Odora/1ts
The 50 stimuli used in this and the subsequent experi-ments were chosen from over one hundred MicrofragranceTMsamples available from the 3M Company (Minneapolis, MN)on the basis of several criteria: first, that their odors, asjudged from preliminary samples sent to the experimenters,were a reasonable first-order approximation of the descrip-tive label given to them by the manufacturer; second, thatthey spanned a number of previously-established qualitativeodor classes [ 1,28], including disparate sectors of a multi-dimensional perceptual space developed using microencap-sulated odorants [9]; third, that they included stimuli com-posed of single as well as multiple components (e.g. , licoriceis typically a single-component odorant made up of anethole,whereas chocolate is a mulliple-component odorant made upof a number of chemicals), given the possibility that the ol-factory system codes information on the basis of a multipleprofile-mulliple receptor site process [43]; fourth, that themajority evidenced no or minimal ability to stimulatenon-CN I intranasal or pharyngeal chemosensory systems(e.g., CN V); and fifth, that a few trigeminal stimulants (e.g.,menthol) be in~luded to allow detection of at least sometypes of malingerers [ 16]. The odorants were embedded in10-50 IJ-m plastic capsules coaled onto adhesive backedlabels, as described elsewhere 141].
Dala Analysis
To determine if the procedure used for releasing thestimuli or if the gender of the subjects influenced the psycho-logical ratings, the scale values of each attribute wereanalyzed by a 2 (sandpaper vs. pencil) by 2 (male vs. female)by 50 (MicrofragranceTM sample) analysis of variance(ANOV A). A separate ANOV A was performed for each ofthe five attributes since it was not clear that the same metricwas being used for all scales (e.g., warm-cool andunpleasant-pleasant are bipolar scales, whereas the othersare unipolar, although not necessarily of comparable scale).
To quantify the identifiability of the stimuli, as indicatedby the written responses provided by each subject, a pointwas given for every response that was identical to that of themanufacturer.s suggested label (e.g., licorice for licorice). Inaddition, a point was given for responses indicative of prod-ucts containing the odorant as the major component (e.g.,anise for licorice). A half point was given to less specificresponses which, nonetheless, were at least remotely relatedto the odor (e.g. , candy for licorice). The sum of the pointsacross the 52 subjects served as an odorant.s "identifiabilityindex... In the present context, this simple scoring systemseemed preferable to more complex ones noted in the litera-ture (e.g., [II]), in that little subjectivity was required inassigning responses to the specific categories.Pr(I('cdttrc,v
The 52 subjects were divided into 13 groups of fourapiece. Within each group there were two males and twofemales of similar age. The average age was approximately21 for six of the groups, 25 for three of the groups, 28 for twoof the groups, and 31 and 38 for the other two groups. Theeight black subjects formed two of the groups. Within eachgroup, one member of each sex released the microencapsu-lated odorants by scratching the labels with a 2 by 1 inch
RESULTS
The overall mean ratings for each of the 50 Microfra-granceTM samples are presented in Fig. 2 for all five psycho-logical attributes. It is evident from this figure that none ofthe stimuli was rated so extreme on any of the continua asto warrant its immediate exclusion from consideration in
492 DOTY. SHAMAN AND DANN
Coconut
-1.:::: ~~~~~~~~[j~c
1 -1-
Mini I ~ Molor oil MIIsk I ~~.tur~1 gas
,.jlWrum~ !11=! 11:-
PM1e
Rose
~~ CkJve 5 ~
3
ji~~~
~~~~~~ ~~~~
--~~~~2~!.,Wat~~~SF I PW SF I PW SF I PW SF I PW SF I PW SF I PW SF I PW SF I PW SF I PW SF I PW
ut ut UC ut ut ut" ut ut ut ut
Psychological Attribute
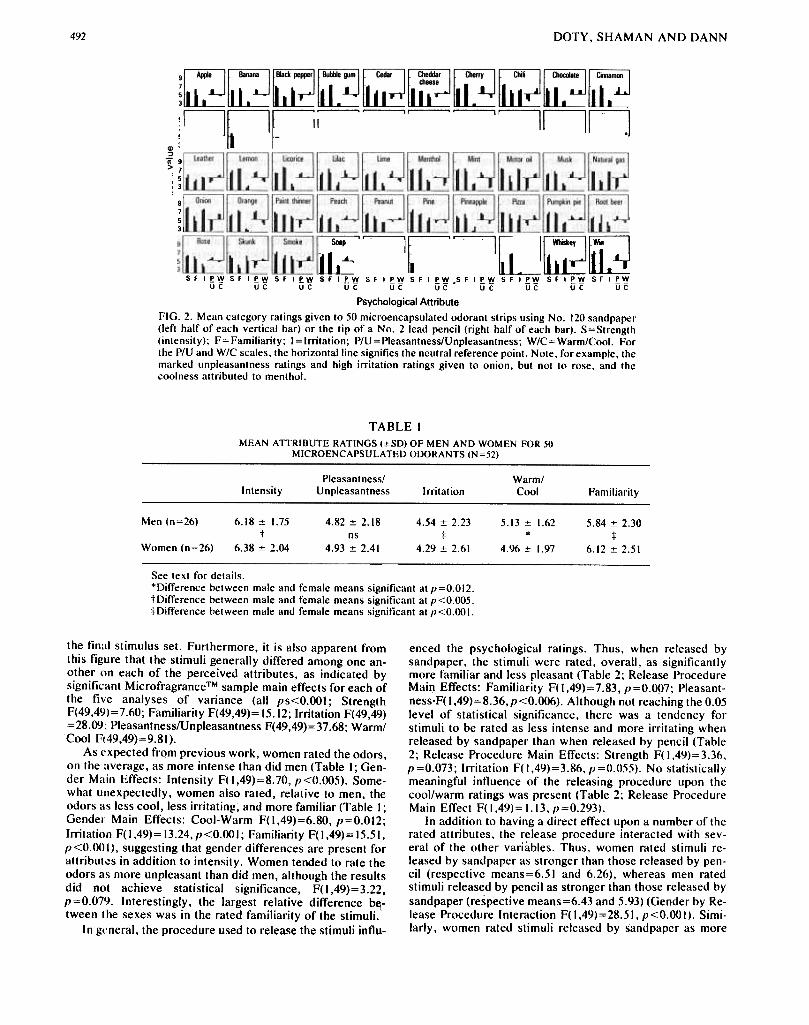
FIG. 2. Mean category ratings given to 50 microencapsulated odorant strips using No. 120 sandpaper(left half of each vertical bar) or the tip of a No.2 lead pencil (right half of each bar). S=Strength(intensity); F= Familiarity; I = Irritation; P/U = Pleasantness/Unpleasantness; W/C= Warm/Cool. Forthe P/U and W/C scales, the horizontal line signifies the neutral reference point. Note, for example, themarked unpleasantness ratings and high irritation ratings given to onion, but not to rose, and thecoolness attributed to menthol.
TABLEI
MEAN ATTRIBUTE RATINGS (:tSD) OF MEN AND WOMEN FOR 50MICROENCAPSULATED ODORANTS (N=52)
Warm/Cool
Pleasantness/
Unpleasantness IrritationIntensity Familiarity
Men (n=26) 6.18:t 1.75
t
6.38:t 2.04
4.82:!0 2.18
ns
4.93:!0 2.41Women (n=26)
5.13 :t 1.62*
4.96 :t 1.97
See text for details.*Difference between male and female means significant atp=O.OI2.tDifference between male and female means significant at p<O.005.tDifference between male and female means significant at p<O.OOI.
the firnll stimulus set. Furthermore, it is also apparent fromthis figure that the stimuli generally differed among one an-other on each of the perceived attributes, as indicated bysignificant MicrofragranceTM sample main effects for each ofthe five analyses of variance (all ps<0.001; StrengthF(49,49)=7.60; Familiarity F(49,49)= 15.12; Irritation F(49,49)=28.09; Pleasantness/Unpleasantness F(49,49)=37.68; Warm/Cool Ft49,49)=9.81).
As expected from previous work, women rated the odors,on the average, as more intense than did men (Table 1; Gen-der Main Effects: Intensity F( 1,49)=8.70, p<0.005). Some-what ullexpectedly, women also rated, relative to men, theodors as less cool, less irritating; and more familiar (Table 1 ;Gender Main Effects: Cool-Warm F(I,49)=6.80, p=0.012;Irritation F(I,49)= 13.24,p<0.00I; Familiarity F(I,49)=15.51,p <0.0!) I) , suggesting that gender differences are present forattribut~s in addition to intensity. Women tended to rate theodors as more unpleasant than did men, although the resultsdid not achieve statistical significance, F(I,49)=3.22,p =0.079. Interestingly, the largest relative difference bti-tween the sexes was in the rated familiarity of the stimuli.
In general, the procedure used to release the stimuli intlu-
enced the psychological ratings. Thus, when released bysandpaper, the stimuli were rated, overall, as significantlymore familiar and less pleasant (Table 2; Release ProcedureMaiQ Effects: Familiarity F( 1,49)=7.83, p =0.097; Pleasant-ness.F(I,49)=8.36,p<0.006). Although not reaching the 0.05level of statistical significance, there was a tendency forstimuli to be rated as less intense and more irritating whenreleased by sandpaper than when released by pencil (Table2; Release Procedure Main Effects: Strength F( 1,49)= 3.36,p =0.073; Irritation F( 1,49)=3.86, p =0.055). No statisticallymeaningful influence of the releasing procedure upon thecool/warm ratings was present (Table 2; Release ProcedureMain Effect F(I,49)=1.13,p=0.293).
In addition to having a direct effect upon a number of therated attributes, the release procedure interacted with sev-era! of the other variables. Thus, women rated stimuli re-leased by sandpaper as stronger than those released by pen-cil (respective means=6.51 and 6.26), whereas men ratedstimuli released by pencil as stronger than those released bysandpaper (respective means=6.43 and 5.93) (Gender by Re-lease Procedure Interaction F( 1,49)=28.51, p <0.00 I ). Simi-larly, women rated stimuli released by sandpaper as more
4.540!:2.23
j:
4.290!:2.61
5.84:!:2.30+
6.12:!:2.51
SMELL tOENTIFICATION TES'
Warm,Cool
Pleasantness/
UnpleasantnessIntensity Irritation Familiarity
Sandpaper 6.22 2.344.96 4.48:!: 2.44 5.01 1.74 6.08
4.35 2.42 5.08 1.87 5.88
See text for details.*Difference between means significant at p =0.055i Difference between means significant at p<O.OI.
Identifiability inde~
o 20 30
LicoriceMenthol
SoapTurpentine
lemon ~Bubble gum
~Cinnamon
Mint
CherryOrange
Chocolatelilac
CoconutGarlic
SmokeFruit punch
WatermelonRosePine
WintergreenPaint thinner
;heddar cheeseBanana
PizzaIOnion
Strawberry~ - Clove
Gasoline
Grape
Motor oil
Peanut I
Grass
Root beer
lime
Natural gas I
Dill pickle
Chili
Black pepper
Musk
Pineapple
Cedar
Gingerbread
Whiskey
leather I
Peach
Apple
Tomato ,
Skunk
Honey
Pumpkin pie
familiar than those released by pencil (respectivemeans=6.32 and 5.92), whereas this difference was not ap-parent for the men (both means=5.84) (Release Procedureby Gender Interaction F(I,49)=7.83, p=0.007). Some odor-ants were rated as slightly more familiar than others whenreleased by sandpaper than when released by pencil (Fig. 2;Release Procedure by MicrofragranceTM sample InteractionF(49,49)= 1.67, p=0.038).
Overall, there was a significant tendency for the familiar-ity ratings to differ between the sexes as a functon of theodorants evaluated (Gender by MicrofragranceTM sample In-teraction F(49,49)= 1.64, p =0.043). The few odorants ratedmore familiar by men than by women (e.g., coconut, rootbeer, tomato and honey) did not appear to be stereotypically.'masculine" odors, or to otherwise systematically differfrom the other stimuli.
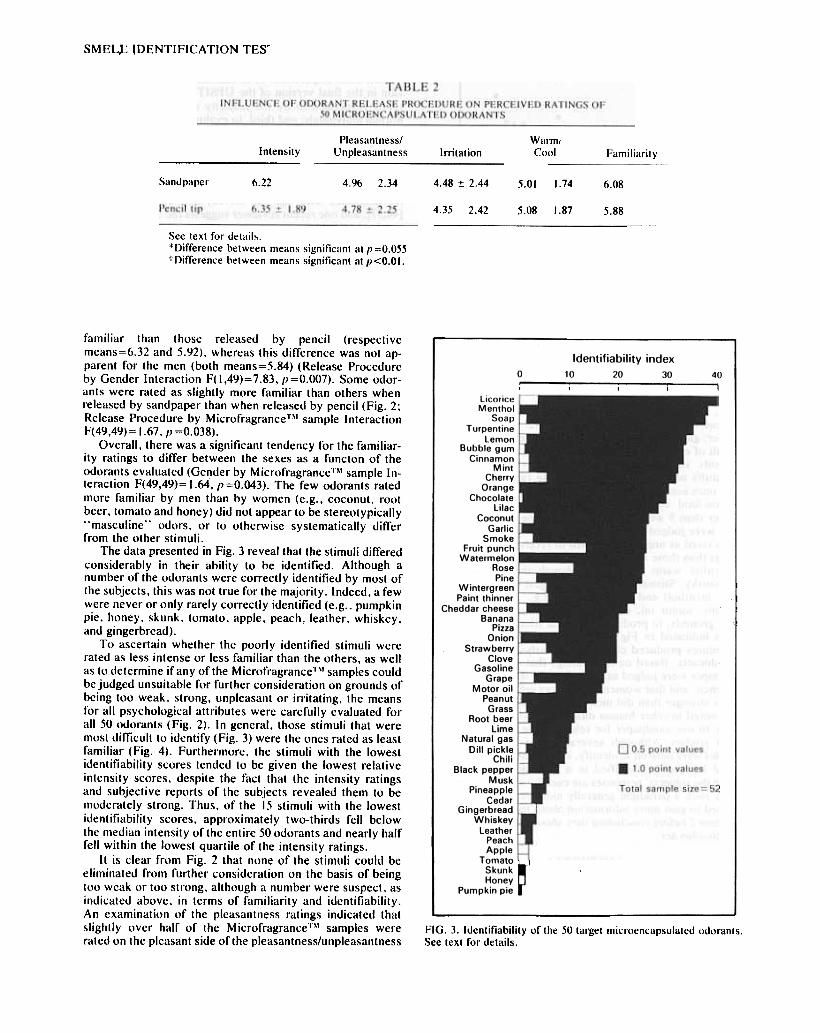
The data presented in Fig. 3 reveal that the stimuli differedconsiderably in their ability to be identified. Although anumber of the odorants were correctly identified by most ofthe subjects, this was not true for the majority. Indeed, a fewwere never or only rarely correctly identified (e.g. , pumpkinpie, honey, skunk, tomato, apple, peach, leather, whiskey,and gingerbread).
To ascertain whether the poorly identified stimuli wererated as less intense or less familiar than the others, as wellas to determine if any of the MicrofragranceTM samples couldbe judged unsuitable for further consideration on grounds ofbeing too weak, strong, unpleasant or irritating, the meansfor all psychological attributes were carefully evaluated forall 50 odorants (Fig. 2). In general, those stimuli that weremost difficult to identify (Fig. 3) were the ones rated as leastfamiliar (Fig. 4). Furthermore, the stimuli with the lowestidentifiability scores tended to be given the lowest relativeintensity scores, despite the fact that the intensity ratingsand subjective reports of the subjects revealed them to bemoderately strong. Thus, of the 15 stimuli with the lowestidentifiability scores, approximately two-thirds fell belowthe median intensity of the entire 50 odorants and nearly halffell within the lowest quartile of the intensity ratings.
It is clear from Fig. 2 that none of the stimuli could beeliminated from further consideration on the basis of beingtoo weak or too strong, although a number were suspect, asindicated above, in terms of familiarity and identifiability.An examination of the pleasantness ratings indicated thatslightly over half of the MicrofragranceT~' samples wererated on the pleasant side of the pleasantness/unpleasantness
O 0.5 point values
.1.0 point values
Total sample size=52
FIG. 3. ltlentifiability of the 50 target microencapsulatetl otlorants.See text for details.
494 DOTY, SHAMAN AND DANN
mation from Experiment I, to eliminate stimuli from inclu-sion in the final version of the UPSIT which were not cor-rectly responded to by the majority of a large number ofnormal individuals; and third, to evaluate, using multiple re-gression analysis, the relative influences of several subjectvariables, both alone and in combination. on UPSIT scoresof a rather large and heterogeneous group of subjects. Varia-bles of particular interest were those of gender, age andsmoking. Although most studies suggest that olfactory abil-ity decreases with age [6, 36. 52, 54], exceptions exist[48,51], and one recent reviewer suggests the issue is not yetresolved [24]. Similarly, general consensus is not present asto whether gender and smoking behavior influence smellability. For example, some studies report a relation betweendecreased olfactory performance and smoking behavior [30,34, 42], whereas others report no such relation [24, 40, 54].
4 5 6 7 8
Familiarity score
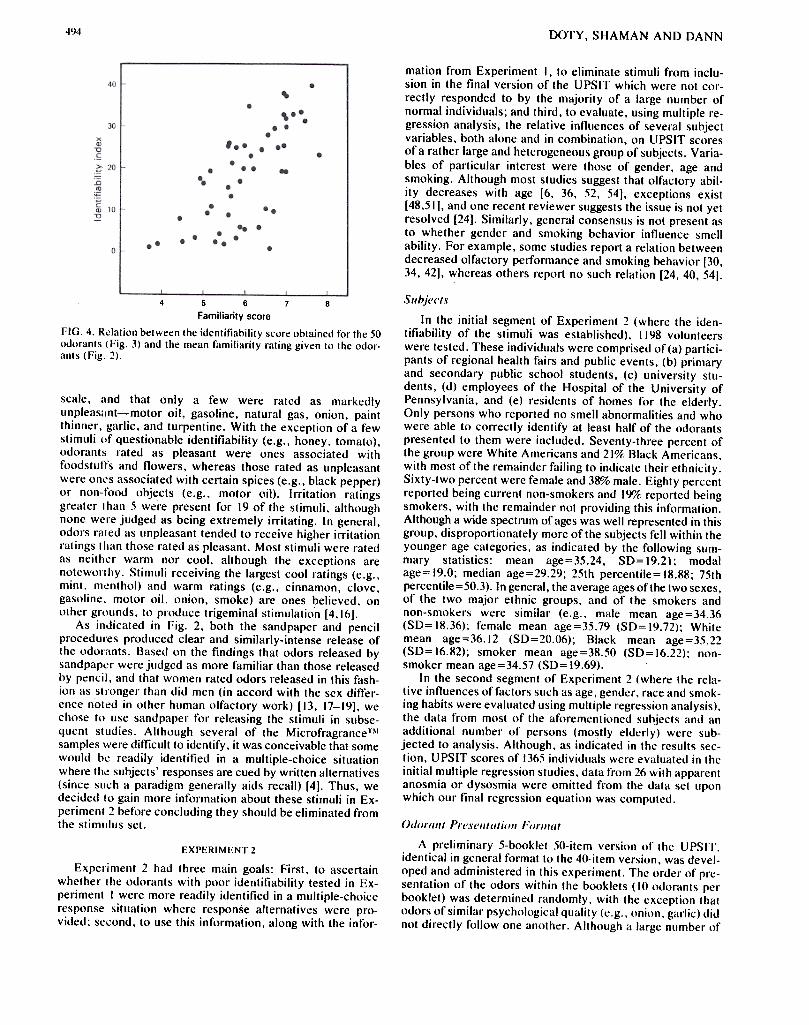
FIG. 4. Relation between the identifiability score obtained for the 50
odorants (Fig. 3) and the mean familiarity rating given to the odor-ants (Fig. 2).
scale, and that only a few were rated as markedlyunpleasant-motor oil, gasoline, natural gas, onion, paintthinner, garlic, and turpentine. With the exception of a fewstimuli (If questionable identifiability (e.g. , honey, tomato),odorants rated as pleasant were ones associated withfoodstuffs and flowers, whereas those rated as unpleasantwere onl's associated with certain spices (e.g., black pepper)or non-food objects (e.g. , motor oil). Irritation ratingsgreater I han -) were present for 19 of the stimuli, althoughnone were judged as being extremely irritating. In general,odors rated as unpleasant tended to receive higher irritationratings tllan those rated as pleasant. Most stimuli were ratedas neithl:r warm nor cool, although the exceptions arenoteworthy, Stimuli receiving the largest cool ratings (e.g.,mint, ml:nthol) and warm ratings (e.g., cinnamon, clove,gasoline, motor oil, onion, smoke) are ones believed, onother grounds, to produce trigeminal stimulation [4, 16],
As indicated in Fig. 2, both the sandpaper and pencilprocedures produced clear and similarIy-intense release ofthe odor[mts. Based on the findings that odors released bysandpapl:r were judged as more familiar than those releasedby pencil, and that women rated odors released in this fash-ion as st.'onger than did men (in accord with the sex ditfer-ence notl:d in other human olfactory work) [13, 17-19], wechose to use sandpaper for releasing the stimuli in subse-quent studies. Although several of the MicrofragranceT.\'samples were difficult to identify, it was conceivable that somewould bl: readily identified in a multiple-choice situationwhere thl: subjects' responses are cued by written alternatives(since such a paradigm generally aids recall) [4]. Thus, wedecided 10 gain more information about these stimuli in Ex-periment 2 before concluding they should be eliminated fromthe stimlllus set.
S,/~i('(.f.\'
In the initial segment of Experiment 2 (where the iden-tifiability of the stimuli was established), 1198 volunteerswere tested. These individuals were comprised of(a) partici-pants of regional health fairs and public events, (b) primaryand secondary public school students, (c) university stu-dents, (d) employees of the Hospital of the University ofPennsylvania, and (e) residents of homes for the elderly.Only persons who reported no smell abnormalities and whowere able to correctly identify at least half of the odorantspresented to them were included. Seventy-three percent ofthe group were White Americans and 21% Black Americans,with most of the remainder failing to indicate their ethnicity .Sixty-two percent were female and 38% male. Eighty percentreported being current non-smokers and !l)'}z, reported beingsmokers, with the remainder not providing this information.Although a wide spectrum of ages was well represented in thisgroup, disproportionately more of the subjects fell within theyounger age categories, as indicated by the following sum-mary statistics: mean age=35.24, SD=19.21; modalage= 19.0; median age=29.29; 25th percentile= 18,88; 75thpercentile=50.3). In general, the averdge ages of the two sexes,of the two major ethnic groups, and of the smokers andnon-smokers were similar (e.g., male mean age=34.36(SD=18.36); female mean age=35.79 (SD=19.72); Whitemean age=36.12 (SO=20.06); Black mean age=35.22(SO= 16.82); smoker mean age=38.50 (SO= 16.22); non-smoker mean age=34.57 (SO= 19.69).
In the second segment of Experiment 2 (where the rela-tive iAnuences of factors such as age. gender, race and smok-ing habits were evaluated using multiple regression analysis),the data from most of the aforementioned suhjects and anadditional number of persons (mostly elderly) were sub-jected to analysis. Although, as indicated in the results sec-tion, UPSIT scores of 1365 individuals were evaluated in theinitial multiple regression studies, data from 26 with apparentanosmia or dysosmia were omitted from the data set uponwhich our final regression equation was computed.
Vdl/rllll( Pr('s('I/(I1(il/11 f(/rl/lll(
A preliminary 5-booklet 50-item version of the UPSIT ,identical in general format to the 40-item version, was devel-oped and administered in this experiment. The order of pre-sentation of the odors within the booklets ( 10 odorants per
booklet) was determined randomly, with the exception thatodors of similar psychological quality (e.g. , onion, garlic) didnot directly follow one another. Although a large number of
EXPERIMENT 2
Experiment 2 had three main goals: First, to ascertainwhether the odorants with poor identifiability tested in Ex-periment I were more readily identified in a multiple-choice
response situation where response alternatives were pro-vided; second, to use this information, along with the infor-
49~SMEl IDENTIFICATION TEST
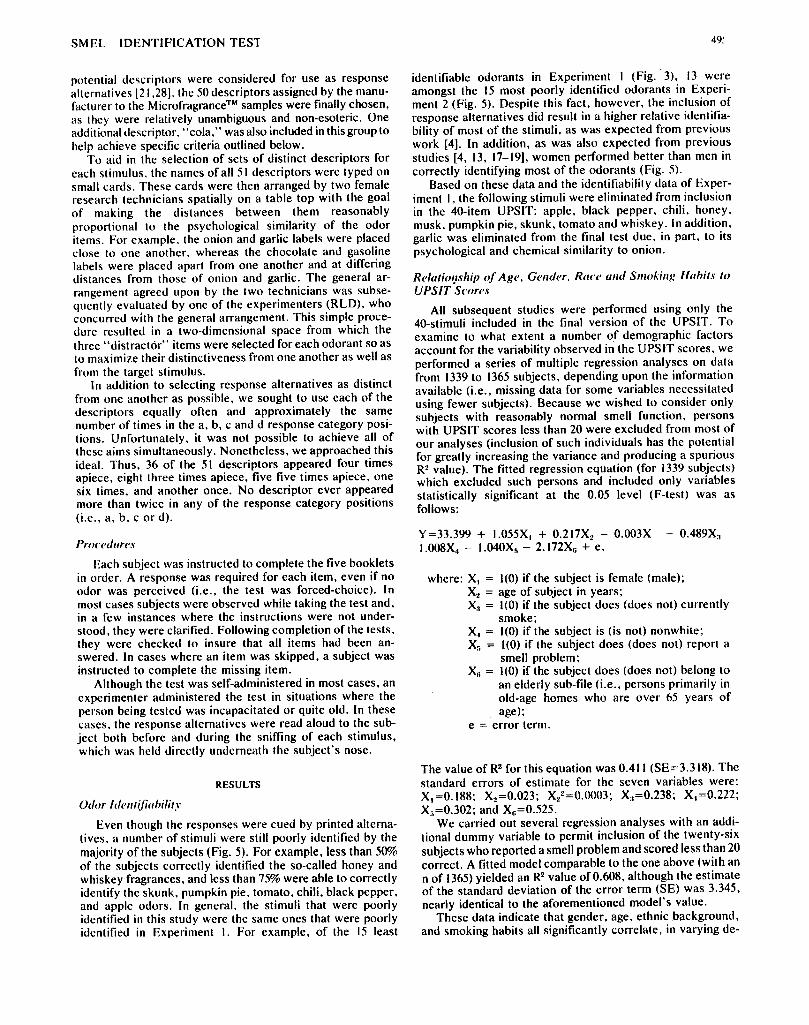
identifiable odorants in Experiment I (Fig. .3), 13 wereamongst the 15 most poorly identified odorants in Experi-ment 2 (Fig. 5). Despite this fact, however. the inclusion ofresponse alternatives did result in a higher relative identifia-bility of most of the stimuli, as was expected from previouswork [4]. In addition, as was also expected from previousstudies [4, 13, 17-19], women performed better than men incorrectly identifying most of the odorants (Fig. 5).
Based on these data and the identifiability data of Exper-iment I, the following stimuli were eliminated from inclusionin the 40-item UPSIT: apple, black pepper, chili, honey,musk, pumpkin pie, skunk, tomato and whiskey. In addition,garlic was eliminated from the final test due, in part, to itspsychological and chemical similarity to onion.
Relati(/l]ship (/f Age. Gender, Ra('e and Sl11l)kin"" Habits tllUPSIT S('lJres
All subsequent studies were performed using only the40-stimuli included in the final version of the UPSIT. Toexamine to what extent a number of demographic factorsaccount for the variability observed in the UPSIT scores, weperformed a series of multiple regression analyses on datafrom 1339 to 1365 subjects, depending upon the informationavailable (i.e., missing data for some variables necessitatedusing fewer subjects). Because we wished to consider onlysubjects with reasonably normal smell function, personswith UPSIT scores less than 20 were excluded from most ofour analyses (inclusion of such individuals has the potentialfor greatly increasing the variance and producing a spuriousR2 value). The fitted regression equation (for 1339 subjects)which excluded such persons and included only variablesstatistically significant at the 0.05 level (F-test) was asfollows:
potential descriptors were considered for use as responsealternatives [21,28], the 50 descriptors assigned by the manu-facturer to the MicrofragranceTM samples were finally chosen,as they were relatively unambiguous and non-esoteric. Oneadditional descriptor, "cola," was also included in this group tohelp achieve specific criteria outlined below,
To aid in the selection of sets of distinct descriptors foreach stimulus, the names of all 51 descriptors were typed onsmall cards. These cards were then arranged by two femaleresearch technicians spatially on a table top with the goalof making the distances between them reasonablyproportional to the psychological similarity of the odoritems. For example, the onion and garlic labels were placedclose to one another, whereas the chocolate and gasolinelabels were placed apart from one another and at differingdistances from those of onion and garlic. The general ar-rangement agreed upon by the two technicians was subse-quently evaluated by one of the experimenters (RLD), whoconcurred with the general arrangement. This simple proce-dure resulted in a two-dimensional space from which thethree '.distractor" items were selected for each odorant so asto maximize their distinctiveness from one another as well as
from the target stimulus.In addition to selecting response alternatives as distinct
from one another as possible, we sought to use each of thedescriptors equally often and approximately the samenumber of times in the a, b, c and d response category posi-tions. U nfortunately , it was not possible to achieve all ofthese aims simultaneously. Nonetheless, we approached thisideal. Thus, 36 of the 51 descriptors appeared four timesapiece, eight three times apiece, five five times apiece. onesix times, and another once, No descriptor ever appearedmore than twice in any of the response category positions(i.e., a, b, c or d).
y =33.399 + I.O55X. + O.217X2 -O.003X
1.008X4- 1.040X5 -2. 172X6 + e,-O.489X:,
where: XI = 1(0) if the subject is female (male);X:I = age of subject in years;X:1 = 1(0) if the subject does (does not) currently
smoke;X.. = 1(0) if the subject is (is not) nonwhite;X5 = 1(0) if the subject does (does not) report a
smell problem;X6 = 1(0) if the subject does (does not) belong to
an elderly sub-tile (i.e. , persons primarily inold-age homes who are over 65 years of
age);e = error term.
Pr(}("t!dllrt!s
Each subject was instructed to complete the five bookletsin order. A response was required for each item, even if noodor was perceived (i.e., the test was forced-choice). Inmost cases subjects were observed while taking the test and,in a few instances where the instructions were not under-stood, they were clarified. Following completion of the tests,they were checked to insure that all items had been an-swered. In cases where an item was skipped, a subject wasinstructed to complete the missing item.
Although the test was self-administered in most cases, anexperimenter administered the test in situations where theperson being tested was incapacitated or quite old. In thesecases, the response alternatives were read aloud to the sub-ject both before and during the sniffing of each stimulus,whi~h was held dire~tly underne,\th the subje~t's nose.
RESULTS
Udvr Id(,lIlijiahilil.\'
Even though the responses were cued by printed alterna-tives. a number of stimuli were still poorly identified by themajority of the subjects (Fig. 5). For example. less than 5<YYoof the subjects correctly identified the so-called honey andwhiskey fragrances, and less than 75% were able to correctlyidentify the skunk. pumpkin pie. tomato, chili, black pepper .and apple odors. In general. the stimuli that were poorlyidentified in this study were the same ones that were poorlyidentified in Experiment I. For example, of the 15 least
The value of R2 for this equation was 0.411 (SE=3.318). Thestandard errors of estimate for the seven variables were:
X.=0.188; X2=0.023; X22=0.0003; X:,=0.238; X4=0.222;X,;=0.302; and X6=0.525.
We carried out several regression analyses with an addi-tional dummy variable to permit inclusion of the twenty-sixsubjects who reported a smell problem and scored less than 20correct. A fitted model comparable to the one above (with ann of 1365) yielded an R2 value of 0.608, although the estimateof the standard deviation of the error term (SE) was 3.345,nearly identical to the aforementioned model's value.
These data indicate that gender, age, ethnic background,and smoking habits all significantly correlate, in varying de-
496 DOTY. SHAMAN AND DANN
PEANUT
SOAP
PAINT THINNER --
MOTOR OIL -
SMOKE -;0
LEMON
MENTHOL -
ONION -,
LICORICE
WINTERGREEN -
ORANGE --
LILAC -i
GRAPE --I
GASOLINE -(
BUBBLE GUM -,
mJ7CHOCOLATE --L:J
MINT --~'
ROOT BEER -
CHERRY --
STRAWBERRY --
FRUIT PUNCH -
ROSE
TURPENTINE -
PINE
PIZZA
,. ...,. ., ..25 50 75 100 25 50 75 100
PERCENT OF SAMPLE CORRECTL y RESPONDING (n = 1198)
FIG. 5. Percent of individuals correctly identifying the 50 microencapsulated odorants in the4-alternative forced-choice response paradigm. Note that women performed better than m.en on this
task for 44 of the stimuli.
i.i"z~~...--J;::~
~0~...t-~01:t-
~...=:1-J
~
f-
~=:1
~~Q
~
h. ~ ,.o ". ~ ., -~==~ :
, ", 1.' .7 ,. #,~ ~.,~n,
~:.
;ME, IDENTIFICATION TEST SCORESby DECADE 01 lIFE ~
~~',~,38 '",
.-.FEMALES (n ' 8781
0-0 MALES (n'5691
-TOTAL GROUP (N'14471 :~?
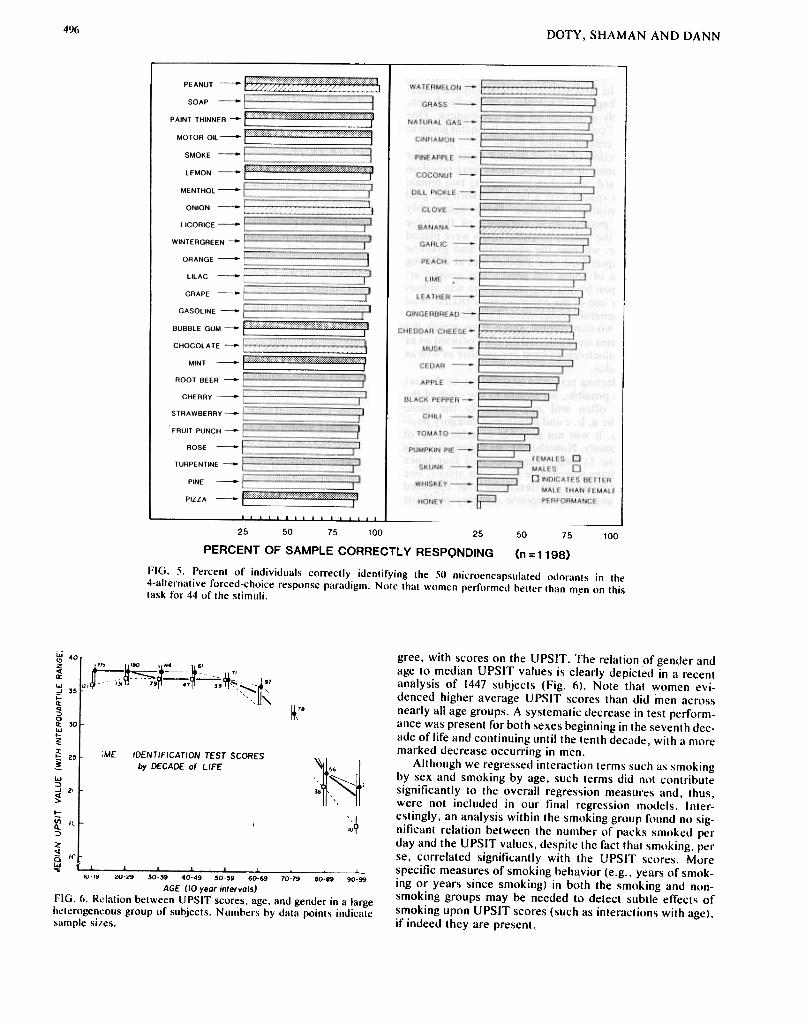
gree, with scores on the UPSIT. The relation of gender andage to median UPSIT values is clearly depicted in a recentanalysis of 1447 subjects (Fig. 6). Note that women evi-denced higher average UPSIT scores than did men acrossnearly all age groups. A systematic decrease in test perform-ance was present for both sexes beginning in the seventh dec-ade of life and continuing until the tenth decade, with a moremarked decrease occurring in men.
Although we regressed interaction terms such as smokingby sex and smoking by age, such terms did not contributesignificantly to the overall regression measures and, thus,were not included in our final regression models. Inter-estingly, an analysis within the smoking group found no sig-nificant relation between the number of packs smoked perday and the UPSIT values, despite the fact that smoking, perse, correlated significantly with the UPSIT scores. Morespecific measures of smoking behavior (e.g. , years of smok-ing or years since smoking) in both the smoking and non-smoking groups may be needed to detect subtle effects ofsmoking upon UPSIT scores (such as interactions with age),if indeed they are present,
10-19 20-29 30-39 40-49 '0-'9 60-69 70-79 80-89 90-99
AGE (10 year inlervals)FIG. 6. Relation between UPSIT scores, age, and gender in a large
heterogeneous group of subjects. Numbers by data points indicatesample sizes.
4°1
35
30
Z5j
ZO
I~
",
497SMELI;:.'IDENTIFICATION TEST
patients of Drs. Howard Kuhn and Richard J. Santen of theDepartment of Endocrinology of the Hershey Medical Cen-ter in Hershey, PA. The remaining anosmics had been diag-nosed as totally anosmic at our center on the basis of a verystringent odor detection threshold criterion (furfural orphenylethanol thresholds above 10-1 vol/vol concentration;see procedure section of Experiment 5), and had congentialtotal anosmia (n=3) or total anosmia secondary to headtrauma (n= 16), viral infection (n=6), anterior craniotomy(n= 1), sinusitis (n=2), allergy (n= 1), polyposis (n=3), orunknown factors (n=4).
To determine whether the decrease in the UPSIT scoresacross the older ages was due, whole or in part, to a decre-ment in memory, we administered the Wechsler MemoryScale Form II [56] to 47 of the elderly subjects (meanage=81.32, SD=7.75) within a day of the olfactory tests.Because 16 of these individuals evidenced probable totalanosmia (i.e., UPSIT scores less than 20), only the data fromthose persons scoring 20 or above were used in our analyses.Although the UPSIT and the Wechsler Memory Scale (totalraw score) each correlated significantly with age (respectivers: -.511 (p<0.001); -.433 (p<0.01), they did not signifi-cantly correlate with one another (r= .242, p >0.20). A partialcorrelation between UPSIT scores and the total raw scoresof the Wechsler after removal of the age factor was small andnonsignificant (r=.027), whereas that between UPSIT scoresand age after removal of the memory factor was clearly sig-nificant (r=-.465, p<0.005). Even though the UPSIT didnot significantly correlate with any of the Wechsler sub-scales, its correlation with the Visual Reproduction subscale(VII) approached significance (r= .295, 0.05<p<0.06).Again, however, a partial correlation between the UPSITscores and the scores on this subscale revealed no clear rela-tion after removal of the effects of age (r=0.02 I ). These datasuggest that the major decline in performance on the UPSITacross the older age range is not due to a decline in memory,but likely reflects a true sensory decrement.
EXPERIMENT 3
The purpose of Experiment 3 was to establish the utilityof the UPSIT in distinguishing between (a) persons withnormal olfactory function, (b) persons with known or sus-pected olfactory dysfunction, and (c) persons instructed tofeign total anosmia under the make believe condition of re-ceiving a large sum of money if they successfully did so.
Sll~i('(.t.~ {/lId Prl'(.('d,lr('.~
The UPSIT was administered to several groups of sub-
jects. These groups, along with the rationale for their testing,
are described in detail below.
Per.\"lJ/I.\. With Nl)rJ/Il/l Oljl/(.tl)ry Sellsitil'il." tllld N() KIll)II.II
Di.\"etl.\"e ~.ttlle.\"
This group of subjects was comprised of the study popu-lation described in Experiment 2 minus persons over the ageof 65 and consisted of 1215 persons (481 men, 734 women;mean age=33.69 years. SO= 17.69), including 890 WhiteAmericans and 252 Black Americans (the remaining 73 wereeither of other ethnic background or did not provide thisinformation). Persons older than 65 years of age were omit-ted because a disproportionate number evidenced anosmiaor other forms of olfactory pathology.
Persvns With Kvrsakvn's Syndrv//le
To determine if the UPSIT was sensitive to a well-documented odor recognition dysfunction of probable CNSorigin, we tested 21 men with Korsakoff's psychosis (meanage=57.05, SD=8.13), an organic brain syndrome associatedwith (a) a consistent pattern of lesions in the midline areas ofthe brain stem and diencephalon and (b) impairment onnumerous tests of olfactory function [32, 33, 38]. Thirteenwere patients of Dr. Thomas Skaloda of the Veterans Admin-istration Medical Center in Coatesville, PA, whereas eightwere patients of Drs. Robert Mair and William J. Mc Entee ofthe Veterans Administration Medical Center in Providence,RI. This latter group had met a stringent set of diagnosticcriteria, including a verified Wernicke stage and no history ofcerebral anoxia or stroke. Although these patients were ofrelatively normal intelligence (I.Q.'s above 90), they evi-denced clear-cut memory deficits (Wechsler M.Q. valuesless than 24 points below the 1.0. values; scores on the NewYork University Memory Test falling 2 SD's below the
mean).
Persvns With Mttltiple Sder(lsis
We tested 31 persons with multiple sclerosis (14 men, 17women; mean age=49.03, SD= 12.56), a disease having seri-ous motor and sensory pathologies. These individuals werevolunteers from various MS Society chapters in the Dela-ware Valley. Unlike the case with vision, the neural de-myelinization associated with this disease reportedly sparesthe olfactory system (at least in the large majority of cases),as evidenced by (a) a notable absence of specific olfactorytract pathology at autopsy and (b) olfactory detectionthresholds equivalent to those of matched normal controls[2]. Despite the general belief that olfactory function is nor-m~1 in MS patients, there is at least one clinical report whichsuggests that the ability to identify odors may be affected insome individuals [57].
The mean estimated duration of the disease was availablefor 25 persons of this group and was 15.92 years (SD= 10.80).Two of the subjects were blind, four reported being unable toread, two reported difficulty in reading, and the remaindernoted no major problems with vision. No data were availableon this point for three of the subjects. Nine of the subjectsreported being able to walk with minimal assistance and didnot use a wheel chair. twelve reported some walking butreliance on a wheel chair at le.lst some of the lime. and fivenoted a major dependence upon a wheelch.lir. Ambulatoryinformation was not available for the remaining five subjects.
/"ff.V(Ill.\. With T(ltl/1 A}/(ISlllil/
The total anosmia validation group consisted of 51 indi-viduals ( mean age =40.76 years. SD= 20.75). Fifteen of theseanosmics had Kallmann's syndrome, a congenital hypogon-adal disorder whose associated anosmia is believed due toagenesis of sectors of the olfactory system [ 10,35]. All hadthe typical endocrine manifestations of Kallmann's syn-drome, as detailed elsewhere [50]. Nine of these subjectswere patients of Dr. Peter J. Snyder of the Endocrine Sec-tion, Department of Medicine, and seven had served in ear-lier studies in our laboratory [12,16]. The other six were
Pers/I11S /,I.\1r//("led III Feigll Tlllal AIllIsl11ia
Ninety-six women and sixty-two men (mean age=28.30years, SO= 10.44) served as "cheaters" who were instructedto feign total anosmia on the test. One hundred and three of
498
I 0.35 :D(1)
0.30 S
0.25 ~.
0.20 -...0.15 ~
C0.10 (1)
:)0.05 ..2
~
~
~
~
~
Total anosmics Normals
In"'511 In"' 1215!
,\", ,,'.
,',',""', "",,',"'
, ,..'~ ,
~
, ., ", ,
~
C~"Ic~,\ '
1\.'15
DOTY, SHAMAN AND DANN
-{ ,.
l'-I
I'-, l
I -' II
~
, "40
.'35-, .' ' 30, ' 25
, ' 20
~" 5 UPSlr score
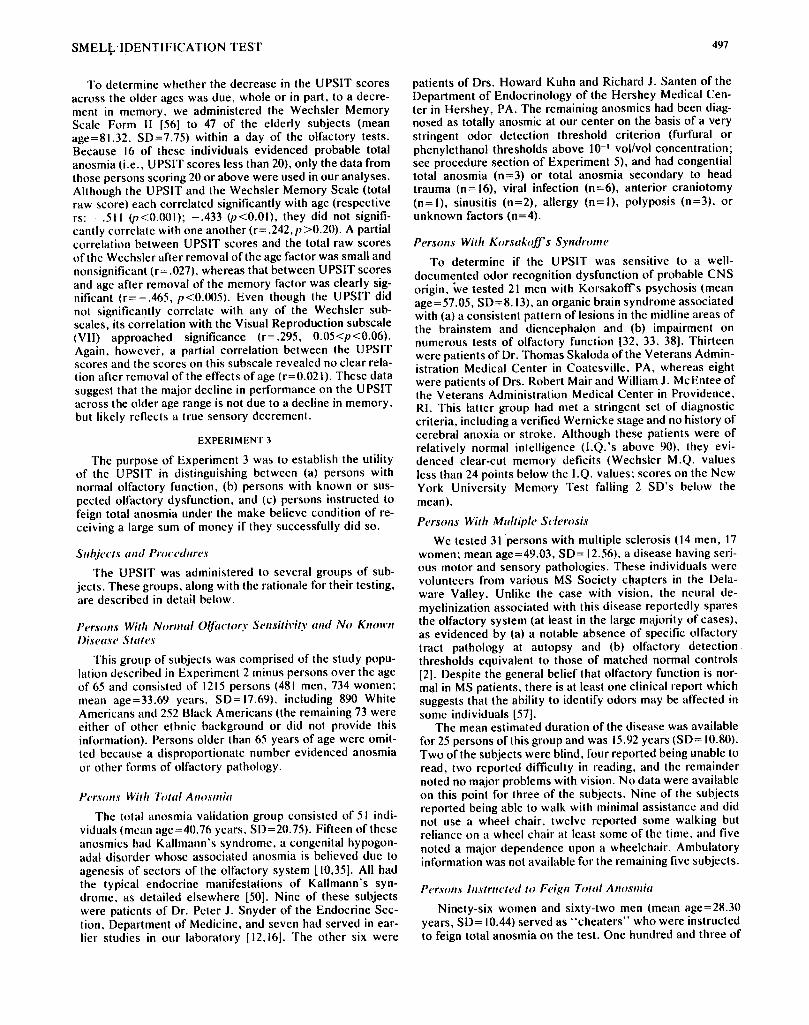
FIG. 7. Frequency distribution of scores on the UPSIT for 5 groups of subjects. MS=multiplesclerosis.
these persons had at least one year of college, whereas theremaind.:r had a high school education or less. All were inapparent good health and none reported having any prob-lems with smell function. The inclusion of both college-educated and non-college educated individuals was done toascertain if the strategy adopted to feign total anosmia wasrelated to education level.
(r=.425, p<O.O5), we performed a partial correlation be-tween the UPSIT scores and the estimated duration of thedisease after controlling for the effects of age. The correla-tion (r= -.428, p<O.O5) was still present. A partial correla-tion in which the relation between age and scores on theUPSIT was established after controlling for the effects ofthe duration of the disease was not statistically significant
(r=-.084,p>O.20).The subjects instructed to feign total anosmia reported
fewer correct responses on the UPSIT than expected on thebasis of chance, with the modal number correct being zero(Fig. 7). Overlap between the distribution of the "cheaters"with the distribution of the total anosmics occurred in only aminority of cases. No clear differences were present be-tween the responses of the college-educated and non-collegeeducated subjects. (Based upon the cheating strategies ofexperimental subjects and the combined probabilities of de-tection by anosmics of specific sets of trigeminal stimulantscontained in the UPSIT, we have developed a "malingeringscale'. for the UPSIT. This scale, which is available to prac-titioners who clinically evaluate olfactory function, is notpresented here.)
EXPERIMENT 4
A major faclor which determines the usefulness and va-lidity of a perceptual test is its reliability or stability overtime, i.e., its ability to consistently measure what it is in-tended to measure. The purpose of Experiment 4 was to
quantitatively determine the test-retest reliability (after aminimum of 6 months between test administralions) of the
UPSIT in a group of subjects composed of persons withvarious degrees of olfactory function.
RESULTS
On the average, persons with total bilateral anosmia per-formed as expected on the smell identification test; namely,their total correct responses were distributed around a valueclose to that expected on the basis of random responding(i.e., 10). Because several stimuli were included whichelicit non-olfactory intranasal trigeminal sensations, the av-erage scores ofthe totally-anosmic group were slightly abovethe expected number (Mean= 12.25, SD=3.04, Me-dian= 13.00; Fig. 7). Although the data set is comparativelysmall, the distribution of responses appears reasonably nor-mal.
The majority of Korsakoff patients evidenced clearlyaberrant scores, as was expected from previous studies ofsuch persons. Furthermore, as was also expected from pre-vious studies, a wide range in the degree of deficit was found(Mean= 15.95, SD=7.97, Median= 14.00, Range=5 to 37;Fig. 7). The recent demonstration of a high correlation be-tween scores on the UPSIT and lumbar CSF levels of
4-methoxy-3-hydroxy-phenyl glycol (a major noradrenergicmetabolite) in a subgroup of these patients suggests that thewide range of scores may be a reflection of the degree ofdamage ill CNS noradrenergic pathways [39]. Metabolites ofdopamine and serotonin were not similarly related.
In general, persons with multiple sclerosis scored withinthe normal range, although a disproportionate number fellinto the lower section of the normal range, and two fell out-side this range (Fig. 7). A close evaluation of the datasuggests that a subtle relation may exist between UPSITscores and the estimated duration of the disease. Thus, forthe 25 persons for whom duration data were available,UPSIT scores correlated -.489 (p<O.025) with duration.Since age was related to the estimated duration of the disease
SIIh:il'l'/.\' lIIld Pr{)('l'dllrl'.\,
Fifty three persons (23 women. 30 men: mean age =44.13years, SD= 19.98) were selected from our subject populationfor readministration of the UPSIT at an interval exceedingsix months from the time of their initial test. To allow for avalid computation of the test-retest correlation coefficient.we selected persons who represented the entire continuumof UPSIT scores on the initial test. This study group
499SMELL IDENTIFICATION TEST
consisted of five persons with scores on the initial test be-tween 6 and 10, seven with scores between II and 15, fourwith scores between 16 and 20, thirteen with scores between21 and 25. five with scores between 26 and 30, eight withscores between 31 and 35, and eleven with scores between 36and 40, inclusive.
RESULTS
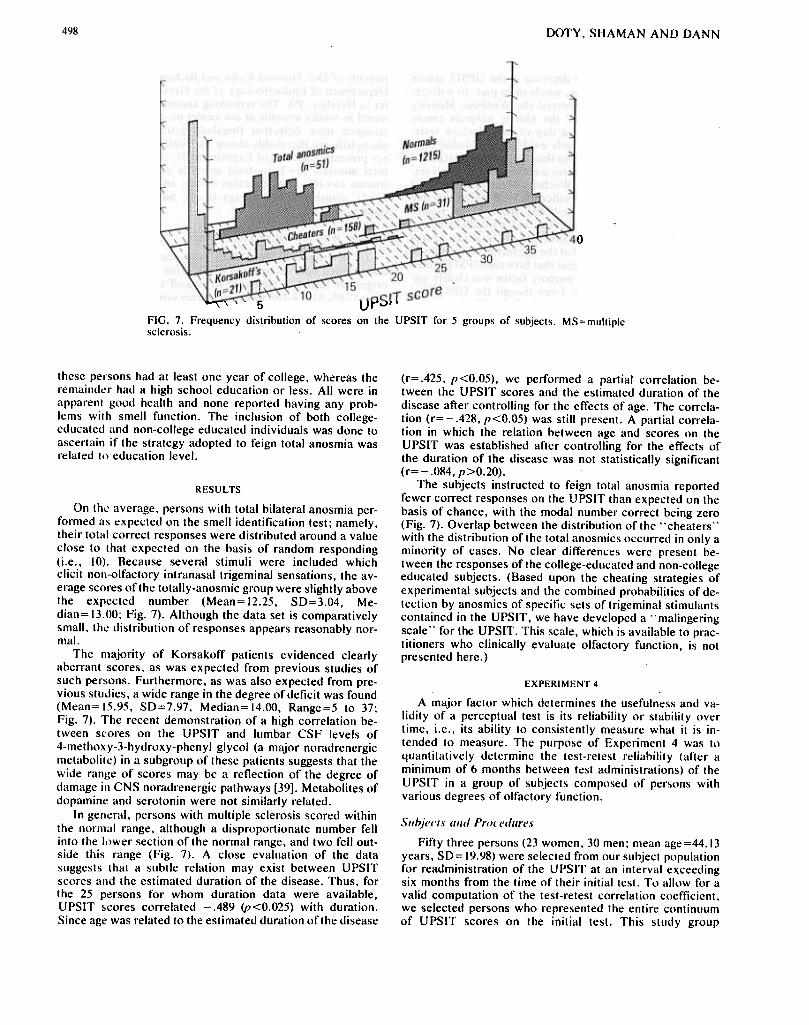
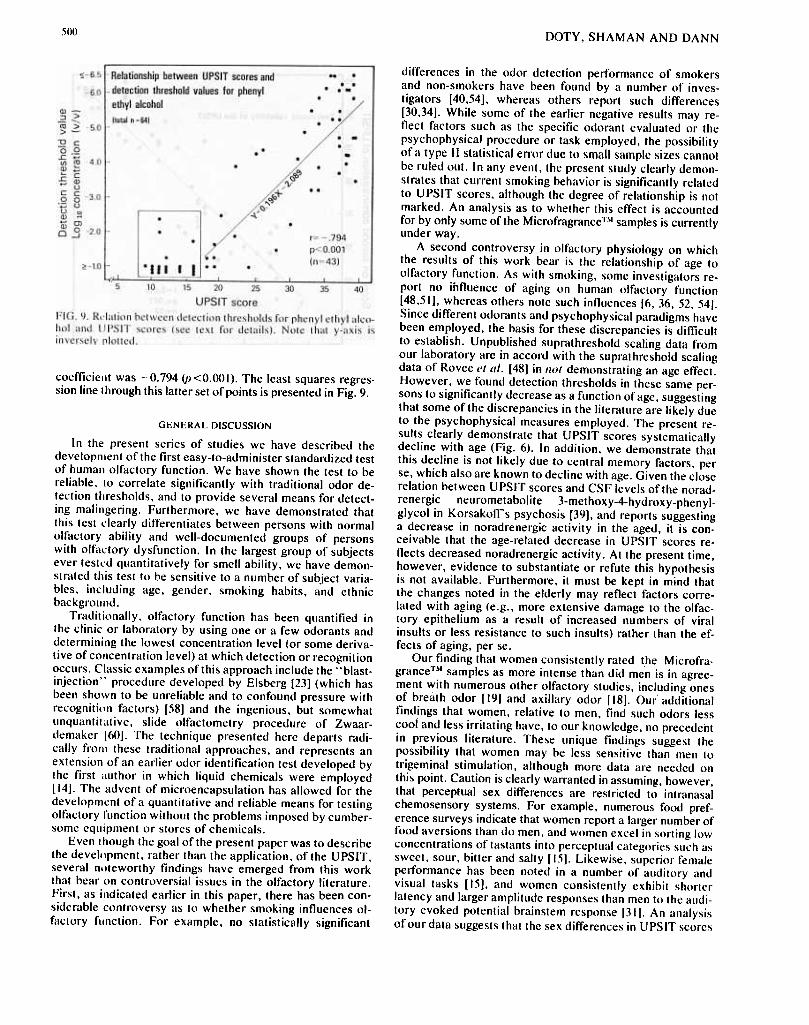
The UPSIT scores from the two test administrations arepresented in Fig. 8, along with the least squares regressionline fitted to these data. Despite the long interval betweenthe two test administrations, the scores were extremelystable (Pearson r=.918, p<O.OOI), which suggests that theshort-term reliability of this test may be even higher. Thevalue of the intercept ( 1.409) suggests at least some of thesubjects improved their performance slightly on the secondadministration of the test. Whether this phenomenon reflects achange in the olfactory function of some subjects or is simplydue to experience in the situation or to sampling artifactsrequires further study.
0 5 10 15 20 25 30 35 40
Score on first administration of UPSIT
FIG. 8. Test-retest relation between UPSIT scores determined in thesame individuals on two administrations separated by a minimum of6 months (see text for details).
EXPERIMENT 5
The purpose of Experiment 5 was to determine whethersubjects' scores on Ihe UPSIT correlate significantly withmeasures from a traditional odor detection threshold task.Theoretically, scores on a suprathreshold odor identificationtask need not correlate with detection threshold values, al-though some degree of correlation would be expected if theyboth measure a common underlying dimension of olfactoryfunction. A significant correlation between UPSIT scores andthreshold values provides an additional verification of theUPSIT's measuring capacity.
tion step of a half-log step (volume/volume) dilution seriesextending from -6.50 to -1.00 log concentrations. and wasmoved upward in 1.00 log steps (two trials per step) untilcorrect detection occurred on both trials. At this point, twoadditional trials at that concentration level were given todecrease the likelihood of chance detection at that concen-tration. If a correct response was not made on both of thesetrials, the staircase was again moved upward in 1.00 log stepsuntil detection was evidenced on four consecutive trials at agiven concentration. When correct responses occurred on allfour trials, the staircase was reversed and subsequentlymoved up or down in 0.50 log increments or decrements,depending upon the subject's performance. Thus, the stair-case was moved up 0.50 log units if an incorrect responseoccurred on either of the two trials, and down 0.50 log unitsif a correct response occurred on both trials. If an incorrectresponse occurred on the first of the two trials, the secondtrial was not run and a new pair of trials was begun at theappropriate next higher concentration. A minimum of 20seconds was interposed between the pairs of trials. Thegeometric mean of the first four staircase reversal pointsfollowing the third staircase reversal was used as thethreshold estimate. For cases where a subject's thresholdwas located outside the -6.50 to -1.00 log concentrationrange, the procedure of assigning the subject either the-6.50 or the -1.00 log step value. as appropriate, was
adopted.
S//~i('(.ls
Sixty-four men and women (mean age=42.41 ; SO= 18.93)were tested. With the exception of six college students, all ofthese persons were patients of our Center, with a numberhaving at least some degree of olfactory dysfunction. Be-cause of this, they evidenced a comparatively broad range ofscores on both the UPSIT and the threshold test, allowingfor a valid correlation coefficient to be determined betweenthese two tests.
RESULTS
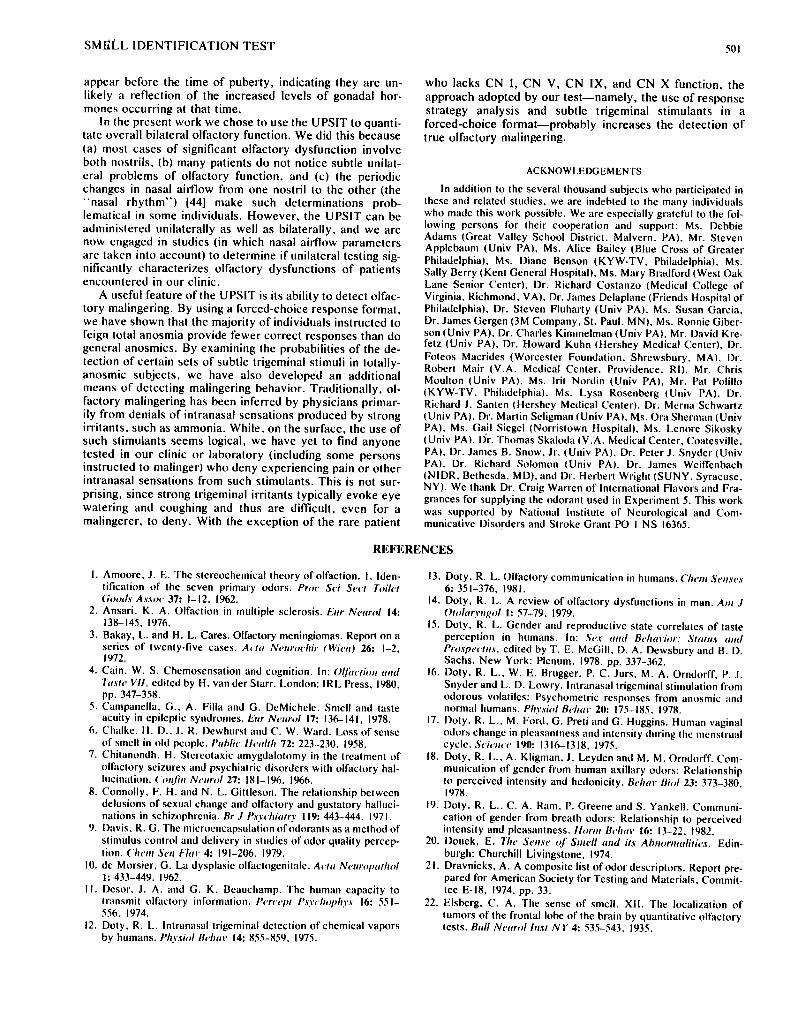
The UPSIT and detection threshold values are presentedin Fig. 9. Although the correlation coefficient between thesetwo sets of measures was remarkably strong (Pearsonr=-0.89, p<O.OOI), it was likely inflated by the largenumber of scores of total anosmics Which clustered at thelower end of the continua. When these scores (see box inFig. 9) were omitted from the comp~tation, the correlation
(;('I!er{/ll-'r(I(.ed,lre.\"
The subjects were administered the UPSIT and the olfac-tory threshold task on the same day. The threshold taskconsisted of a forced-choice single staircase procedure simi-lar to that described by Ghorbanian et {/1. (26]. In the presentcontext, a trial consisted of the presentation of two 100 mlglass sniff bottles in a rapid succession to the subject. Thebottles were opened and held over the subject's nose in astandardized manner pictured elsewhere ( 16]. One bottlecontained a given concentration of perfume-grade phenylethyl alcohol (a rose-like odorant with minimal trigeminalstimulative ability relative to other commonly-used com-pounds) dissolved in 20 ml of propylene glycol, whereas theother contained 20 ml of the propylene glycol alone. Thesubject's task was to report which of the two randomly-presented bottles evoked the stronger sensation. Even if nosensation was present, the subject was required to chooseone or the other bottle. No feedback was provided as to thecorrectness of the responses.
The staircase was begun around the -6.0 log concentra-
500DOTY, SHAMAN AND DANN
coefficient was -0.794 (p<0.001). The least squares regres-sion line 1 hrough this latter set of points is presented in Fig. 9.
differences in the odor detection performance of smokersand non-smokers have been found by a number of inves-tigators [40,54], whereas others report such differences[30,34]. While some of the earlier negative results may re-flect factors such as the specific odorant evaluated or thepsychophysical procedure or task employed, the possibilityof a type I I statistical error due to small sample sizes cannotbe ruled out. In any event, the present study clearly demon-strates that current smoking behavior is significantly relatedto UPSIT scores, although the degree of relationship is notmarked. An analysis as to whether this effect is accountedfor by only some of the MicrofragranceTM samples is currentlyunder way.
A second controversy in olfactory physiology on whichthe results of this work bear is the relationship of age toolfactory function. As with smoking, some investigators re-port no influence of aging on human olfactory function[48,51 ], whereas others note such influences [6, 36, 52, 54].Since different odorants and psychophysical paradigms havebeen employed, the basis for these discrepancies is difficultto establish. Unpublished suprathreshold scaling data fromour laboratory are in accord with the suprathreshold scalingdata of Rovee ('I al. [48] in nvt demonstrating an age effect.However, we found detection thresholds in these same per-sons to significantly decrease as a function of age, suggestingthat some of the discrepancies in the literature are likely dueto the psychophysical measures employed. The present re-suIts clearly demonstrate that UPSIT scores systematicallydecline with age (Fig. 6). In addition, we demonstrate thatthis decline is not likely due to central memory factors, perse, which also are known to decline with age. Given the closerelation between UPSIT scores and CSF levels of the norad-renergic neurometabolite 3-methoxy-4-hydroxy-phenyl-glycol in Korsakoff's psychosis [39], and reports suggestinga decrease in noradrenergic activity in the aged, it is con-ceivable that the age-related decrease in UPSIT scores re-flects decreased noradrenergic activity. At the present time,however, evidence to substantiate or refute this hypothesisis not available. Furthermore, it must be kept in mind thatthe changes noted in the elderly may reflect factors corre-lated with aging (e.g., more extensive damage to the olfac-tory epithelium as a result of increased numbers of viralinsults or less resistance to such insults) rather than the ef-fects of aging, per se.
Our finding that women consistently rated the Microfra-granceTM samples as more intense than did men is in agree-ment with numerous other olfactory studies, including onesof breath odor r 19] and axillary odor r 18). Our additionalfindings that women, relative to men, find such odors lesscoot and less irritating have, to our knowledge, no precedentin previous literature. These unique findings suggest thepossibility that women may be less sensitive than men totrigeminal stimulation, although more data are needed onthis point. Caution is clearly warranted in assuming, however ,that perceptual sex differences are restricted to intranasalchemosensory systems. For example, numerous food pref-erence surveys indicate that women report a larger number offood aversions than do men, and women excel in sorting lowconcentrations of tastants into perceptual categories such assweet, sour, bitter and salty [ 15]. Likewise, superior femaleperformance has been noted in a number of auditory andvisual tasks [ 15], and women consistently exhibit shorterlatency and larger amplitude responses than men to the audi-tory evoked potential brainstem response [31 ). An analysisof our data suggests that the sex differences in UPSIT scores
GENERAL DISCUSSION
In the present series of studies we have described thedevelopment of the first easy-to-administer standardized testof human olfactory function. We have shown the test to bereliable, to correlate significantly with traditional odor de-tection thresholds, and to provide several means for detect-ing malingering. Furthermore, we have demonstrated thatthis test ..:Iearly differentiates between persons with normalolfactory ability and well-documented groups of personswith olfactory dysfunction. In the largest group of subjectsever test0.:d quantitatively for smell ability, we have demon-strated tJ)is test to be sensitive to a number of subject varia-bles, including age, gender, smoking habits, and ethnicbackground.
Traditionally, olfactory function has been quantified inthe clinic or laboratory by using one or a few odorants anddetermining the lowest concentration level (or some deriva-tive of concentration level) at which detection or recognitionoccurs. Classic examples ofthis approach include the "blast-injection" procedure developed by Elsberg [23] (which hasbeen shown to be unreliable and to confound pressure withrecognition factors) [58] and the ingenious, but somewhatunquantitative, slide olfactometry procedure of Zwaar-demaker [60]. The technique presented here departs radi-cally from these traditional approaches, and represents anextension of an earlier odor identification test developed bythe first OIuthor in which liquid chemicals were employed[ 14]. The advent of microencapsulation has allowed for thedevelopment of a quantitative and reliable means for testingolfactory function without the problems imposed by cumber-some equipment or stores of chemicals.
Even though the goal of the present paper was to describethe development, rather than the application, of the UPSIT ,several noteworthy findings have emerged from this workthat bear on controversial issues in the olfactory literature.First, as indicated earlier in this paper, there has been con-siderable controversy as to whether smoking influences ol-factory function. For example, no statistically significant
SMI1LL IDENTIFICATION TEST 501
who lacks CN I, CN V, CN IX, and CN X function, theapproach adopted by our test-namely, the use of responsestrategy analysis and subtle trigeminal stimulants in aforced-choice format-probably increases the detection oftrue olfactory malingering.
ACKNOWLEDGEMENTS
In addition to the several thousand subjects who participated inthese and related studies, we are indebted to the many individualswho made this work possible. We are especially grateful to the fol-lowing persons for their cooperation and suppt)rt: Ms. DebbieAdams (Great Valley School District, Malvern, PA). Mr. StevenApplebaum (Univ PA). Ms. Alice Bailey (Blue Cross of GreaterPhiladelphia). Ms. Diane Benson (KYW- TV. Philadelphia). Ms.Sally Berry (Kent General Hospital), Ms. Mary Bradford (West OakLane Senior Center), Dr. Richard Costanzo (Medical College ofVirginia. Richmond. V A). Dr. James Delaplane (Friends Hospital ofPhiladelphia), Dr. Steven Fluharty (Univ PA), Ms. Susan Garcia.Dr. James Gergen (3M Company. St. Paul. MN). Ms. Ronnie Giber-son (Univ PA). Dr. Charles Kimmelman (Univ PA), Mr. David Kre-fetz (Univ PA). Dr. Howard Kuhn (Hershey Medical Center). Dr.Foteos Macrides (Worcester Foundation, Shrewsbury. MA). Dr.Robert Mair (V.A. Medical Center. Providence, RI). Mr. ChrisMoulton (Univ PA). Ms. Irit Nordin (Univ PA), Mr. Pat Polillo(KYW-TV. Philadelphia). Ms. Lysa Rosenberg (Univ PA). Dr.Richard J. Santen (Hershey Medical Center). Dr. Merna Schwartz(Univ PA), Dr. Martin Seligman (Univ PA). Ms. Ora Sherman (UnivPA), Ms. Gail Siegel (Norristown Hospital). Ms. Lenore Sikosky(Univ PA). Dr. Thomas Skaloda (V .A. Medical Center. Coatesville.PA). Dr. James B. Snow. Jr. (Univ PA). Dr. Peter J. Snyder (UnivPA). Dr. Richard Solomon (Univ PA). Dr. James Weiffenbach(NIDR, Bethesda. MD), and Dr. Herbert Wright (SUNY .Syracuse.NY). We thank Dr. Craig Warren of International Flavors and Fra-grances for supplying the odorant used in Experiment 5. This workwas supported by National Institute of Neurological and Com-municative Disorders and Stroke Grant PO I NS 16365.
appear before the time of puberty, indicating they are un-likely a reflection of the increased levels of gonadal hor-mones occurring at that time.
In the present work we chose to use the UPSIT to quanti-tate overall bilateral olfactory function. We did this because(a) most cases of significant olfactory dysfunction involveboth nostrils, (b) many patients do not notice subtle unilat-eral problems of olfactory function, and (c) the periodicchanges in nasal airflow from one nostril to the other (the..nasal rhythm'.) [44] make such determinations prob-lematical in some individuals. However, the UPSIT can beadministered unilaterally as well as bilaterally, and we arenow engaged in studies (in which nasal airflow parametersare taken into account) to determine if unilateral testing sig-nificantly characterizes olfactory dysfunctions of patientsencountered in our clinic.
A useful feature of the UPSIT is its ability to detect olfac-tory malingering. By using a forced-choice response format,we have shown that the majority of individuals instructed tofeign total an9smia provide fewer correct responses than dogeneral anosmics. By examining the probabilities of the de-tection of certain sets of subtle trigeminal stimuli in totally-anosmic subjects, we have also developed an additionalmeans of detecting malingering behavior. Traditionally, ol-factory malingering has been inferred by physicians primar-ily from denials of intranasal sensations produced by strongirritants, such as ammonia. While, on the surface, the use ofsuch stimulants seems logical, we have yet to find anyonetested in our clinic or laboratory (including some personsinstructed to malinger) who deny experiencing pain or otherintranasal sensations from such stimulants. This is not sur-prising, since strong trigeminal irritants typically evoke eyewatering and coughing and thus are difficult, even for amalingerer, to deny. With the exception of the rare patient
REFERENCES
13. Doty. R. L. Olfactory communication in humans. Ch('/11 5('/ls(,s6: 351-376.1981.
14. Doty. R. L. A review of olfactory dysfunctions in man. A/II J()ltll(/r.\.,I.1.'tlll: 57-79. 1979.
15. Doty. R. L. Gender and reproductive state correlates of tasteperception in humans. In: 5('.r (1/Id B('h(II'i/Ir; 51(11(IS (111dPrvsp('('IIIS. edited by T. E. McGill. D. A. Dewsbury and B. D.Sachs. New York: Plenum. 1978. pp. 337-362.
16. Doty. R. L.. W. E;. Brugger. P. C. Jurs. M. A. Orndorff. P. J.Snyder and L. D. Lowry. Intranasal trigeminal stimulation fromodorous volatiles: Psychometric responses from anosmic andnormal humans. Ph.\'sivl B('h(ll. 20: 175-185. 1978.
17. Doty. R. L.. M. Ford. G. Preti and G. Huggins. Human vaginalodors change in pleasantness and intensity during the menstrualcycle. ,\"('i('IIN' 190: 1316-1318. 1975.
18. Doty. R. L.. A. Kligman. J. Leyden and M. M. Orndorff. Com-munication of gender from human axillary odors: Relationshipto perceived intensity and hedonicity. B('h(ll. Billl 23: 373-380.1978.
19. Doty. R. L.. C. A. Ram. P. Greene and S. Yankell. Communi-cation of gender from breath odors: Relationship to perceivedintensity and pleasantness. IIvrlll B('h(II' 16: 13-22. 1982.
20. Douek. E. 7"l,(' 5('11,\.(' /if ~i,I('1l (111(1 ils Ah,lvrl1/(llili(',\'. Edin-burgh: Churchill Livingstone. 1974.
21. Dravnieks. A. A composite list of odor descriptors. Report pre-pared for American Society for Testing and Materials. Commit-tee E-18. 1974. pp. 33.
22. Elsberg. C. A. The sense of smell. XII. The localization oftumors of the frontal lobe of the brain by quantitative olfactorytests. B,11l N('llrvl',ISI N y 4: 535-543. 193.~.
I. Amoore. J. E. The stereochemical theory of olfaction. I. Iden-tilication of the seven primary odors. Prlll' SI'i SI'11 Tllill,1Gllllds AssIlI. 37: 1-12. 1962.
2. Ansari. K. A. Olfaction in multiple sclerosis. E,lr NI'llrll/ 14:13S-145.1976.
3. Bakay, L. and H. L. Cares. Olfactory meningiomas. Report on ascries of twenty-live cases. AI1l1 NI'llrll("hir (Wil'll) 26: 1-2.1972.
4. Cain. W. S. Chemosensation and cognition. In: ()(!l,("/iI,11 lllld711.v/I' VII, edited by H. van der Starr. London: IRL Press. 1980.pp.347-358.
5. Campanclla. G.. A. Filla and G. DcMichcle. Smcll and tasteacuity in cpileptic syndromes. tl,r NI'llrll/17: 136-141, 1978.
6. Chalkc, H. D.. J. R. Dewhurst and C. W. Ward. Loss ofscnseof smell in old people. 1'llh/il' Ilt'll/th 72: 223-230. 195!1.
7. Chitanondh. H. Stereotaxic amygdalotomy in the trcatment ofolfactory seizures and psychiatric disorders with olfactory hal-lucination. (("!fill NI'llrlJ! 27: 1!11-196. 1966.
8. Connolly. F. H. and N. L. Gittleson. The relationship betweendelusions of sexual change and olfactory and gustatory halluci-nations in schizophrenia. Br.l P,vyl'hialr.l' 119: 443-444. 1971.
9. Davis. R. G. The microencapsulation of odorants as a mcthod ofstimulus control and delivcry in studies of odor quality percep-tion. ('hl'l11 SI'II filii' 4: 191-206. 1979.
10. de Morsicr. G. La dysplasic olfactogcnitale. AI1a NI'llrIlpath,J!1: 433-449.1962.
II. Desor. J. A. and G. K. Beauchamp. The human capacity totransmit olfactory information. PI'r("I'pt l's.l'I'hIlph.l',v 16: 551-556, 1974,
12. Doty. R. L. Intranasal trigeminal detection of chemical vaporsby humans. Ph.l'.viI,/ BI'ha\' 14: 855-859. 1975.
DOTY, SHAMAN AND DANN502
23. Elsberg, C. A. and E. D. Brewer. The sense of smell x. Adetaile,1 description of the technique of two olfactory tests usedfor the localization of supratentorial tumors of the brain. BII//N('llr{///lIsI NY 4: 501-510, 1935.
24. Engen. T. Th(, Perceplillll {/1 ()d{/rs. New York: AcademicPress, 1982.
25. Furstenberg, A. C., E. Crosby and B. Farrior. Neurologicallesions which influence the sense of smell. Ar('h ()llllllr.vIl~{/1 48:529-530. 1943.
26. Ghorbanian, S. N ., J. L. Paradise and R. L. Doty. Odor per-ception in children in relation to nasal obstruction. Pedialric,572: 510-516,1983.
27. Griffitlls, N. M. and R. L. S. Patterson. Human olfactory re-sponses to 5a-androst-16-en-3-one-Principal component ofboar taint. J Sci F{/{/d Agric 21: 4-6, 1970.
28. Harper, R., E. C. Bate-Smith and D. G. Land. ()d(llIr D('.5crip-li{/ll Ulld ()(/{/r ('/(15,5(fic(llillIl: A Mll/lidi.l.cip/in(lr.v t..'f(ll11inali(lIl.London: Churchill, 1968.
29. Herberhold, C. Funktionsprufiigen und stiirungen desgeruchssinnes. Ar(h ()I{/rhin(l/ar.I'llg(1/ 210: 67-164, 1975.
30. Hubert, H. B., R. R. Fabsitz, M. Feinleib and K. S. Brown.Olfactory sensitivity in humans: Genetic versus enviornmentalcontrol. S(.i('/l(.(' 208: 607-608, 1980.
31. Jerger, J. and J. Hall. Effects of age and sex on auditorybrainslem response. Arch ()1(l/ar.I'llg(1/ 106: 387-391, 1980.
32. Jones, B. P. , N. Butters, H. R. Moskowitz and K. Montogmery.Olfactory and gustatory capacities of alcoholic Korsakoff pa-tients. Nellr(lp,~.1'('h(l/{/gia 16: 323-333, 1978.
33. Jones, B. P., H. R. Moskowitz and N. Butters. Olfactory dis-crimination in alcoholic Korsakoff patients. Nellr{/p.~.v(.h(I/(lgia13: 173-179, 1975.
34, Joyner, R. E. Effect of cigarette smoking on olfactory acuity.AMA !1r('h ()1(l/ar.vIl,!1{// 80: 576-579, 1964.
35, Kallmann, F. J ., w. A. Schoenfeld and S. E. Barrera. Thegenetic aspects of primary eunuchoidism. AlII J Melll f)(1ic 48:203-236,1944.
36. Kimblell, G. M. and E. Furchgott. The effects of aging onolfactory threshold. J Ger(IllI(1/ 18: 364-365, 1963.
37. Leigh, A. D. Defect of smell after head injury. L(l11c('1 1: 38-40,1943.
38. Mair. R. G., C. Capra. W. J. McEntee and T. Engen. Odordiscrimination and memory in Korsakoffs Psychosis. J I:',\pP.~.vchl,f (HlIllII>er('epl) 6: 455-458, 1980.
39. Mair. R. B., w. J. McEntee and R. L. Doty. Olfactory percep-tion in Korsakoffs psychosis: Correlation with brain norad-renerl!ic activity. N(,lIr(I/(lg.l. 33: 64-65, 1983.
40. Martin, S. and R. M. Pangborn. A note on responses to ethylalcohol before and after smoking. Pen.('pt Psy('h(lphys 8: 169-170, 1970.
41. Matson, a. w. Microcapsules and process of making. U.S. Pat-ent No.3516941, 1970.
42. Moncrieff, R. W. Sensory discrimination and smoking. F(I(I/IPnl/' Mark('ting 37: 303-305, 1968,
43. Polak, E. a. Multiple profile-multiple receptor site model forvertebrate olfaction. .1 Thellr Bill/ 40: 469-484, 1973.
44. Principato, J. J. and J. M. Ozenberger. Cyclical changes in nasalresistance. Arch ()tll/aryngll/ 91: 71-77, 1970.
45. Pryse-Phillips, W. An olfactory reference syndrome. Acta Psy-chiat Scalld 47: 484-509, 1971.
46. Rausch, R. and E. A. Serafetinides. Specific alterations of olfac-tory function in humans with temporal lesions. Natllre 255:557-558, 1975.
47. Report of the Panel on Communicative Disorders to the Na-tional Advisory Neurological and Communicative Disordersand Stroke Council. June I, 1979, Washington, D.C. PublicHealth Service, NIH Publication No.81-1914.
48. Rovee, C. K., R. Y. Cohen and W. Shlapack. Life-span stabilityin olfactory sensitivity. Del' Psychll/ll: 311-318, 1975.
49. Rubert, S. L., M. H. Hollender and E. a. Mehrholf. Olfactoryhallcuinations. Arch Gen Ps)'chiatry 5: 313-318, 1961.
50. Santen, R. J. and C. A. Paulsen. Hypogonadotropiceunuchoidism. I. Clinical study of. the mode of inheritance. JC/in f:ndllcrillll/ Metah 36: 47-54, 1973.
51. Schemper, T., S. Voss and W. S. Cain. Odor identification inyoung and elderly persons: Sensory and cognitive limitations. JGer(l/ltll/l: 225-231, 1980.
52. Schiffman, S. S., J. Moss and R. P. Erickson. Threshold forfood odors in the elderly. J f:.o\"p Aging Res 2: 389-398, 1976.
53. Sumner, D. Post-traumatic anosmia. Brain 87: 107-120, 1964.54. Venstrom, D. and J. E. Amoore. Olfactory threshold in relation
to age, sex or smoking. J /-/'/Id Sci 33: 264-265, 1968.55. Wallace, P. Individual discrimination of humans by odor.
Ph)',\jll/ Behal' 19: 577-579, 1977.56. Wechsler, D. A standardized scale for clinical use. J 1',\)'chll/19:
87-95, 1945.57. Wender, M. and Z. Szmeja. Examination of hearing, vestibular
system function, taste and olfactory systems in patients withdisseminated sclerosis. N('llrll/ Nellr(I/'hir 1'/1/21: 179-184, 1971.
58. Wenzel, B. M. Techniques in olfactometry: a critical review ofthe last one hundred years. P.~)'chll/ BII// 45: 231-247, 1948.
59. Zilstorff, K. Olfactory disturbances: diagnosis and treatment,VRL Dige,\1 34: 37-43, 1972.
60. Zwaardemaker, H. On measurement of the sense of smell inclinical examination. IAI/I(°et 1: 1300-1302, 1889.
Recommended