Monitoring Tomcat with JMXMonitoring Tomcat with JMX
Christopher SchultzChief Technology OffcerTotal Child Health, Inc.
Christopher SchultzChief Technology OffcerTotal Child Health, Inc.
* Slides available on the Linux Foundation / ApacheCon2014 web site and at http://people.apache.org/~schultz/ApacheCon NA 2014/Tomcat Monitoring/
Java Management ExtensionsJava Management Extensions
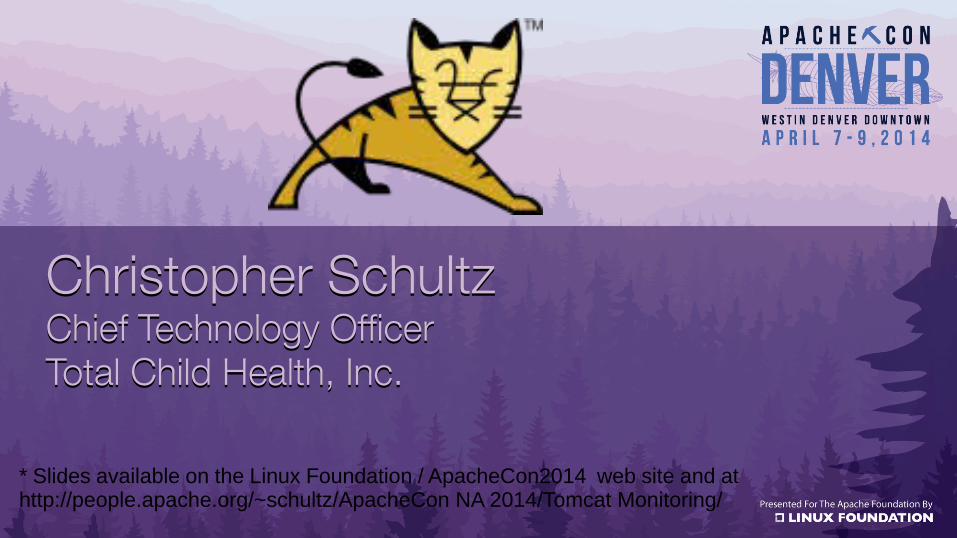
● Protocol and API for managing and monitoring– Access data via JMX “Mbeans”– Read and write bean attributes– Invoke operations– Receive notifications
● JVM exposes certain status● Tomcat exposes certain status
● Protocol and API for managing and monitoring– Access data via JMX “Mbeans”– Read and write bean attributes– Invoke operations– Receive notifications
● JVM exposes certain status● Tomcat exposes certain status
Monitoring JVMMonitoring JVM
● Heap status● Total, free, used memory● Garbage collection● GC pause times
● Heap status● Total, free, used memory● Garbage collection● GC pause times
Monitoring TomcatMonitoring Tomcat
● Status of connector● Status of request-processor thread pool● Status of data sources● Request performance
● Status of connector● Status of request-processor thread pool● Status of data sources● Request performance

JMX ToolsJMX Tools
● jconsole (JDK)● VisualVM (JDK, app bundle)● Most profilers (e.g. YourKit, etc.)● Custom tools using javax.management API
● jconsole (JDK)● VisualVM (JDK, app bundle)● Most profilers (e.g. YourKit, etc.)● Custom tools using javax.management API
Monitoring JVM: HeapMonitoring JVM: Heap
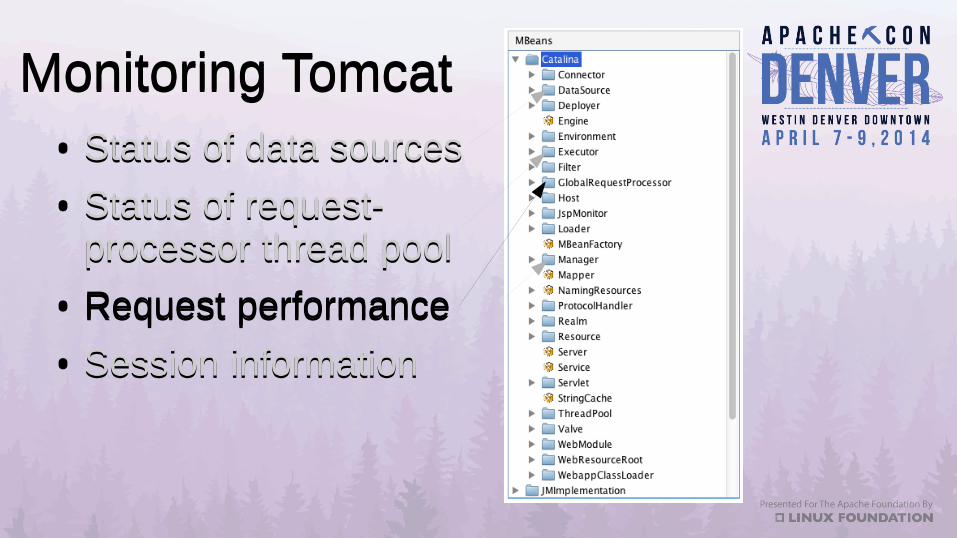
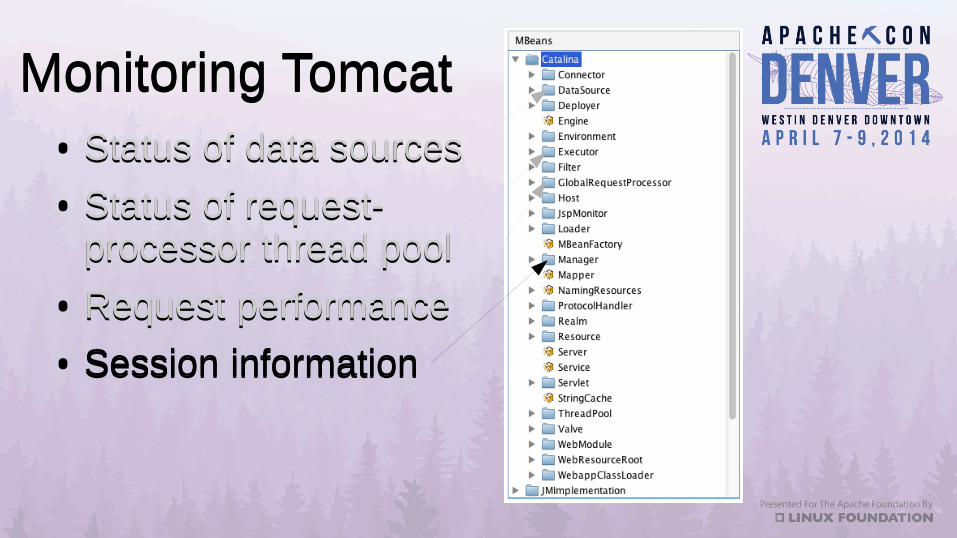
Monitoring TomcatMonitoring Tomcat● Status of data sources● Status of request-
processor thread pool● Request performance● Session information
● Status of data sources● Status of request-
processor thread pool● Request performance● Session information
Monitoring TomcatMonitoring Tomcat● Status of data sources● Status of request-
processor thread pool● Request performance● Session information
● Status of data sources● Status of request-
processor thread pool● Request performance● Session information
Monitoring Tomcat: RequestsMonitoring Tomcat: Requests
Monitoring Tomcat: RequestsMonitoring Tomcat: Requests
Monitoring Tomcat: RequestsMonitoring Tomcat: Requests
Monitoring TomcatMonitoring Tomcat● Status of data sources● Status of request-
processor thread pool● Request performance● Session information
● Status of data sources● Status of request-
processor thread pool● Request performance● Session information

Monitoring Tomcat: SessionsMonitoring Tomcat: Sessions
Monitoring TomcatMonitoring Tomcat● Status of data sources● Status of request-
processor thread pool● Request performance● Session information
● Status of data sources● Status of request-
processor thread pool● Request performance● Session information
Monitoring Tomcat: DataSourcesMonitoring Tomcat: DataSources
Monitoring TomcatMonitoring Tomcat● Status of data sources● Status of request-
processor thread pool● Request performance● Session information
● Status of data sources● Status of request-
processor thread pool● Request performance● Session information
Monitoring Tomcat: ThreadsMonitoring Tomcat: Threads
Monitoring Tomcat: ThreadsMonitoring Tomcat: Threads
Monitoring Tomcat: ThreadsMonitoring Tomcat: Threads
Monitoring Tomcat: ThreadsMonitoring Tomcat: Threads
Monitoring Your ApplicationMonitoring Your Application● Monitor Application Processes● Performance Metrics● On-the-fly re-configuration
● Monitor Application Processes● Performance Metrics● On-the-fly re-configuration
Monitoring Your ApplicationMonitoring Your Application● Write an MBean
– Create an Interface: FooMBean– Create an Implementation: Foo– Create an XML MBean descriptor
● Deploy package to Tomcat– Publish the MBean to the MBean server
● Query / invoke as necessary
* Example code will be available at http://people.apache.org/~schultz/ApacheCon NA 2014/Tomcat Monitoring/
Example MBeanExample MBean● Servlet Filter that captures total request
processing time– Timestamp prior to request– Timestamp after request– Add the delta to a JMX-accessible counter:
RequestStats

RequestStats MBeanRequestStats MBean● Write an MBean
public interface RequestStatsMBean { public long getProcessingTime(); public long getRequestCount(); public void resetCounters();}public class RequestStats implements RequestStatsMBean { [...] public void updateStats(long timestamp, ServletRequest request, long elapsed) { _totalElapsedTime.addAndGet(elapsed); _requestCount.incrementAndGet(); }
public long getProcessingTime(){ return _totalElapsedTime.get(); } public long getRequestCount() { return _requestCount.get(); } public void resetCounters() { _totalElapsedTime.set(0l); _requestCount.set(0l); }}
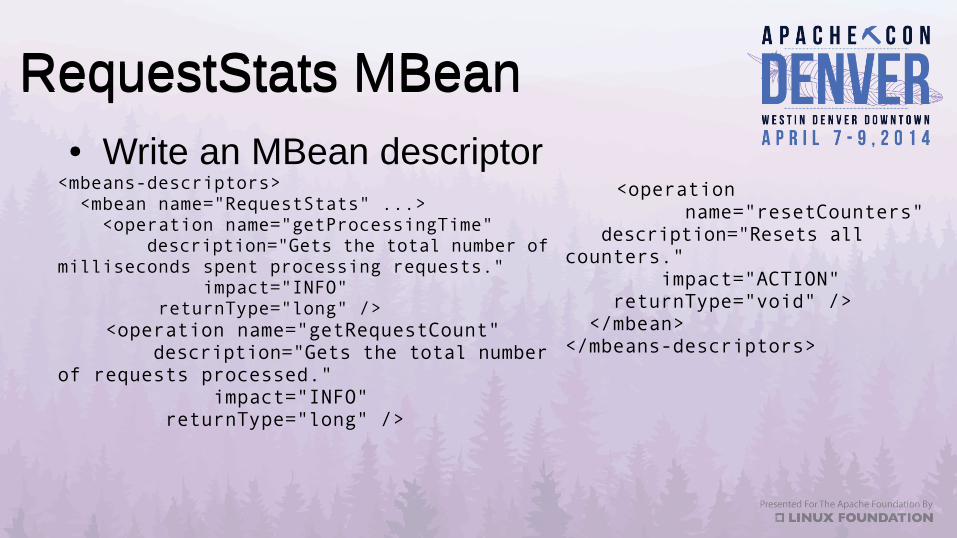
RequestStats MBeanRequestStats MBean● Write an MBean descriptor
<mbeans-descriptors> <mbean name="RequestStats" ...> <operation name="getProcessingTime" description="Gets the total number of milliseconds spent processing requests." impact="INFO" returnType="long" /> <operation name="getRequestCount" description="Gets the total number of requests processed." impact="INFO" returnType="long" />
<operation name="resetCounters" description="Resets all counters." impact="ACTION" returnType="void" /> </mbean></mbeans-descriptors>
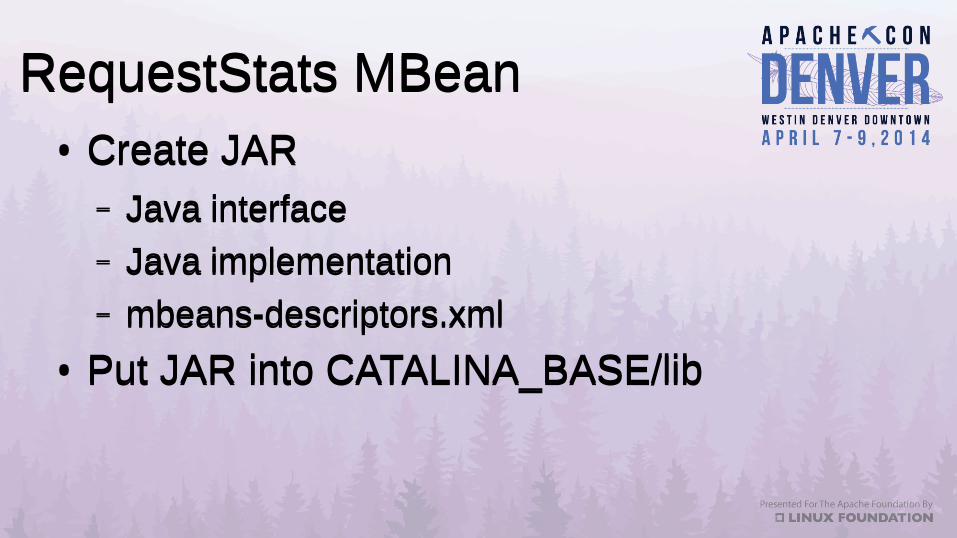
RequestStats MBeanRequestStats MBean● Create JAR
– Java interface– Java implementation– mbeans-descriptors.xml
● Put JAR into CATALINA_BASE/lib
● Create JAR– Java interface– Java implementation– mbeans-descriptors.xml
● Put JAR into CATALINA_BASE/lib
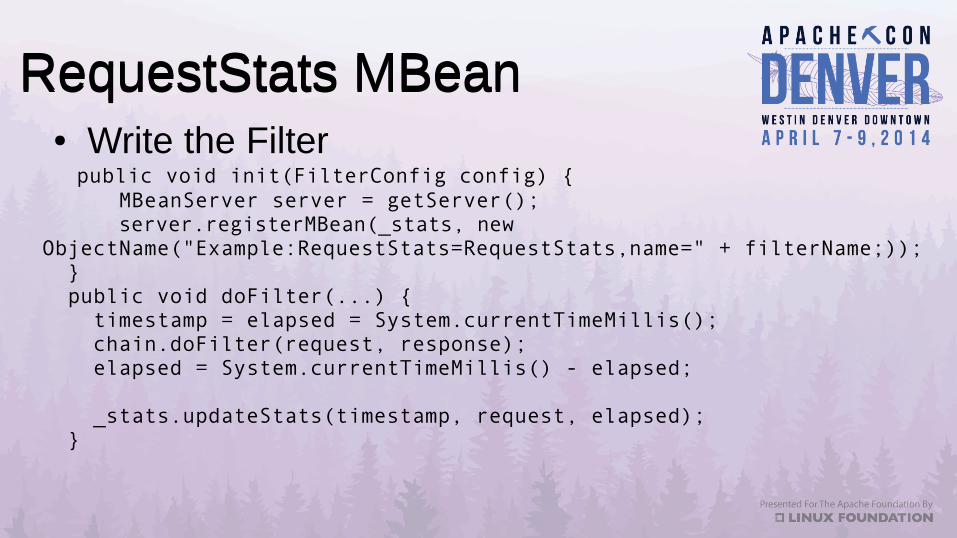
RequestStats MBeanRequestStats MBean● Write the Filter
public void init(FilterConfig config) { MBeanServer server = getServer(); server.registerMBean(_stats, new ObjectName("Example:RequestStats=RequestStats,name=" + filterName;)); } public void doFilter(...) { timestamp = elapsed = System.currentTimeMillis(); chain.doFilter(request, response); elapsed = System.currentTimeMillis() - elapsed;
_stats.updateStats(timestamp, request, elapsed); }
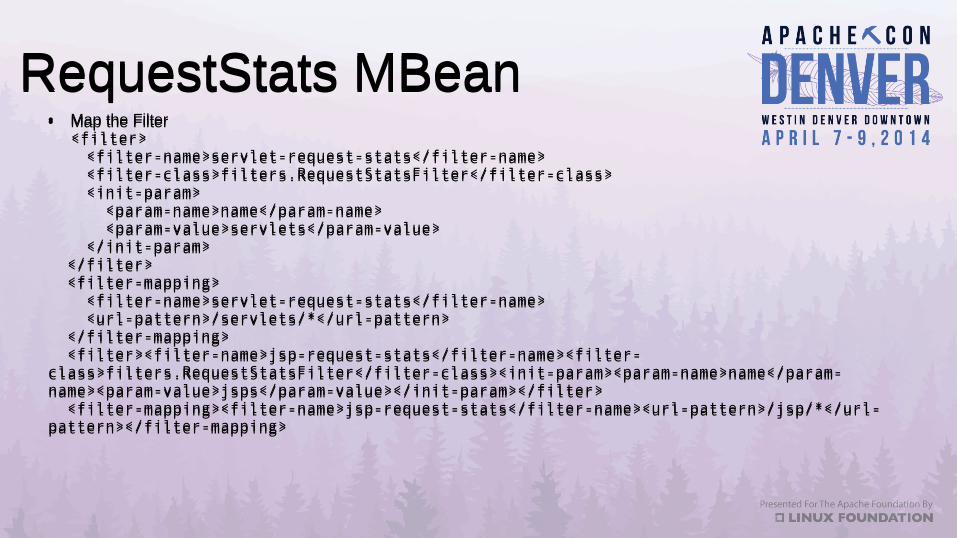
RequestStats MBeanRequestStats MBean● Map the Filter <filter> <filter-name>servlet-request-stats</filter-name> <filter-class>filters.RequestStatsFilter</filter-class> <init-param> <param-name>name</param-name> <param-value>servlets</param-value> </init-param> </filter> <filter-mapping> <filter-name>servlet-request-stats</filter-name> <url-pattern>/servlets/*</url-pattern> </filter-mapping> <filter><filter-name>jsp-request-stats</filter-name><filter-class>filters.RequestStatsFilter</filter-class><init-param><param-name>name</param-name><param-value>jsps</param-value></init-param></filter> <filter-mapping><filter-name>jsp-request-stats</filter-name><url-pattern>/jsp/*</url-pattern></filter-mapping>
● Map the Filter <filter> <filter-name>servlet-request-stats</filter-name> <filter-class>filters.RequestStatsFilter</filter-class> <init-param> <param-name>name</param-name> <param-value>servlets</param-value> </init-param> </filter> <filter-mapping> <filter-name>servlet-request-stats</filter-name> <url-pattern>/servlets/*</url-pattern> </filter-mapping> <filter><filter-name>jsp-request-stats</filter-name><filter-class>filters.RequestStatsFilter</filter-class><init-param><param-name>name</param-name><param-value>jsps</param-value></init-param></filter> <filter-mapping><filter-name>jsp-request-stats</filter-name><url-pattern>/jsp/*</url-pattern></filter-mapping>
RequestStats MBeanRequestStats MBean
RequestStats MBeanRequestStats MBean
Automated MonitoringAutomated Monitoring
● Remote Access● Large Scale● Constant
● Remote Access● Large Scale● Constant
Automated MonitoringAutomated Monitoring
● Remote Access● Large Scale● Constant● Need more tools!
● Remote Access● Large Scale● Constant● Need more tools!
Automated MonitoringAutomated Monitoring
● Nagios– S imple– Flexible– Well-deployed– No-cost community version available
● Nagios– Simple– Flexible– Well-deployed– No-cost community version available

Automated MonitoringAutomated Monitoring

Nagios MonitoringNagios Monitoring
● Plug-in architecture (i.e. arbitrary scripts)● Freely-available JMX plug-in: check_jmx$ ./check_jmx -U service:jmx:rmi:///jndi/rmi://localhost:1100/jmxrmi\
-O java.lang:type=Memory -A NonHeapMemoryUsage -K used\
-w 29000000 -c 30000000
JMX WARNING NonHeapMemoryUsage.used=29050880
● Plug-in architecture (i.e. arbitrary scripts)● Freely-available JMX plug-in: check_jmx$ ./check_jmx -U service:jmx:rmi:///jndi/rmi://localhost:1100/jmxrmi\
-O java.lang:type=Memory -A NonHeapMemoryUsage -K used\
-w 29000000 -c 30000000
JMX WARNING NonHeapMemoryUsage.used=29050880
Nagios MonitoringNagios Monitoring
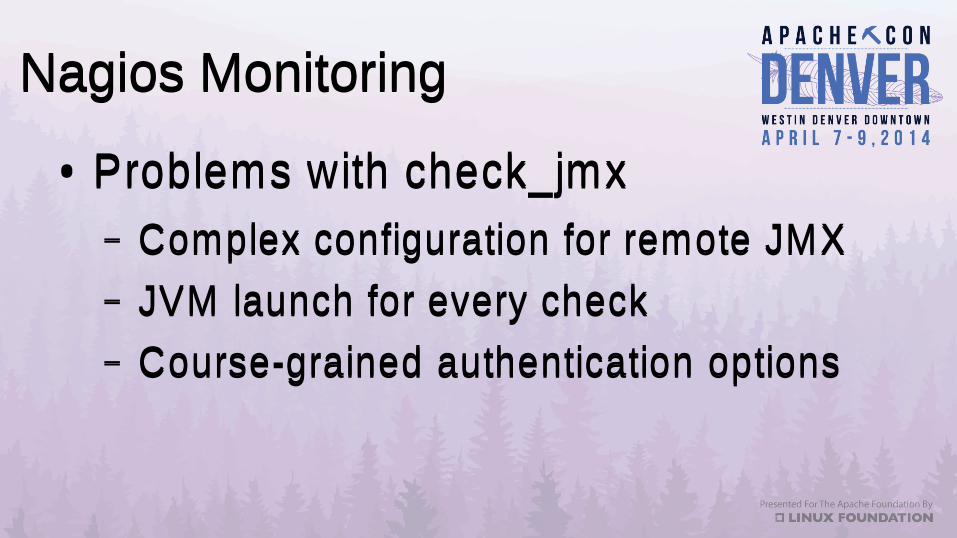
● Problems with check_jmx– Complex configuration for remote JMX– JVM launch for every check– Course-grained authentication options
● Problems with check_jmx– Complex configuration for remote JMX– JVM launch for every check– Course-grained authentication options
Nagios MonitoringNagios Monitoring
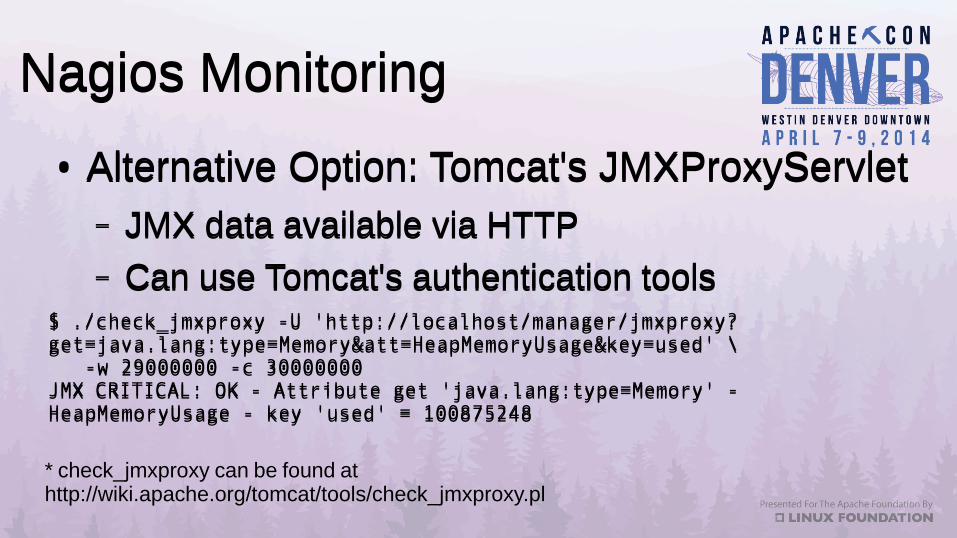
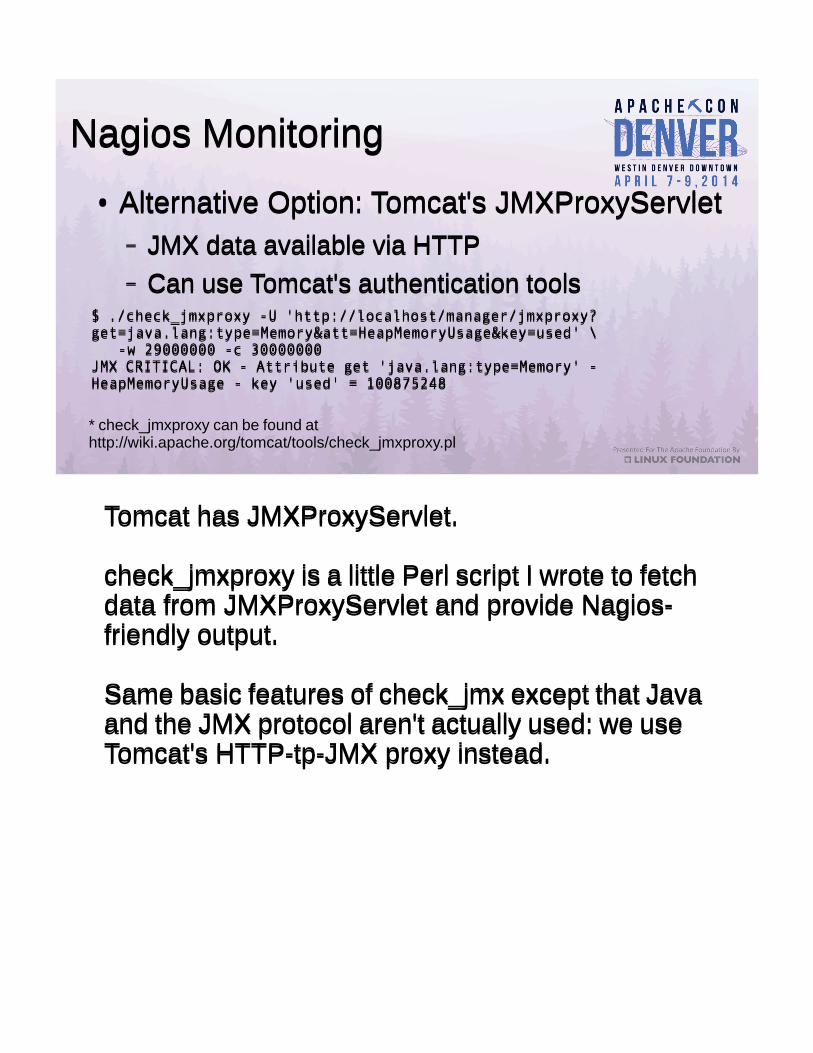
● Alternative Option: Tomcat's JMXProxyServlet– JMX data available via HTTP– Can use Tomcat's authentication tools
$ ./check_jmxproxy -U 'http://localhost/manager/jmxproxy?get=java.lang:type=Memory&att=HeapMemoryUsage&key=used' \ -w 29000000 -c 30000000JMX CRITICAL: OK - Attribute get 'java.lang:type=Memory' - HeapMemoryUsage - key 'used' = 100875248
* check_jmxproxy can be found at http://wiki.apache.org/tomcat/tools/check_jmxproxy.pl
Nagios MonitoringNagios Monitoring
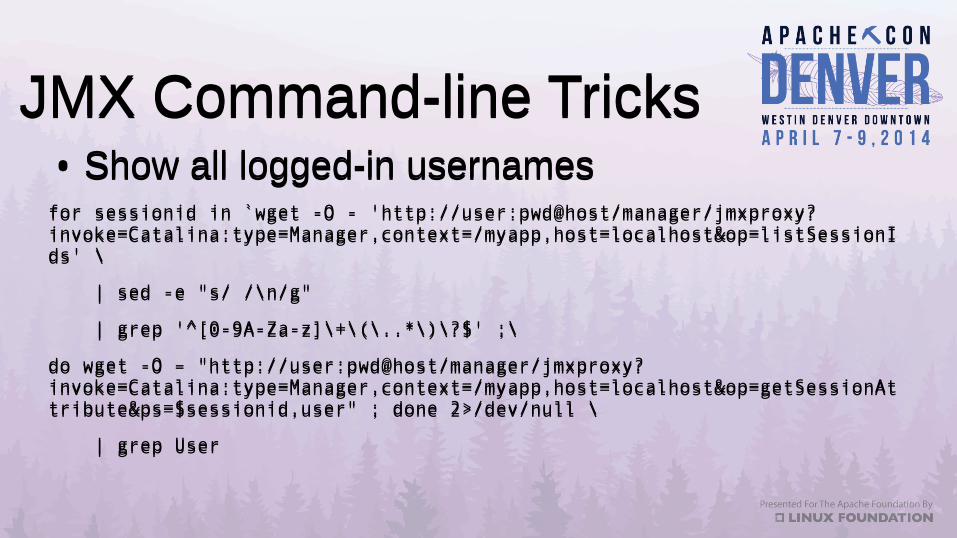
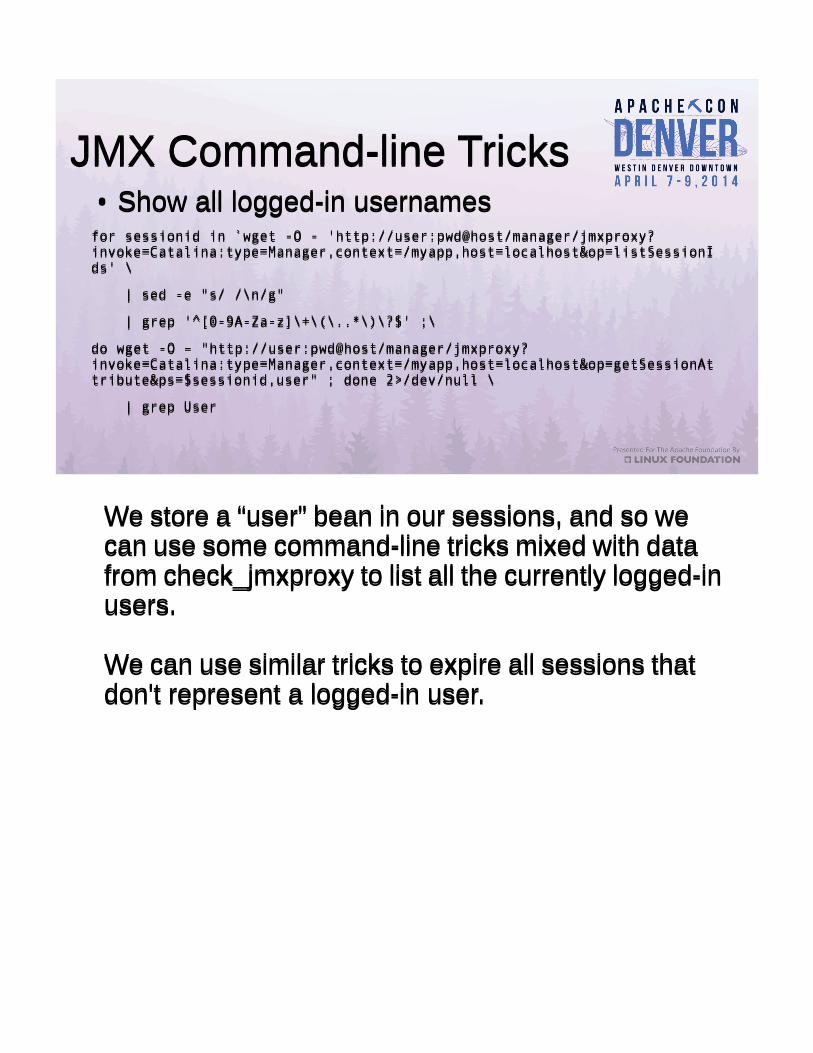
JMX Command-line TricksJMX Command-line Tricks● Show all logged-in usernamesfor sessionid in `wget -O - 'http://user:pwd@host/manager/jmxproxy?invoke=Catalina:type=Manager,context=/myapp,host=localhost&op=listSessionIds' \
| sed -e "s/ /\n/g"
| grep '^[0-9A-Za-z]\+\(\..*\)\?$' ;\
do wget -O – "http://user:pwd@host/manager/jmxproxy?invoke=Catalina:type=Manager,context=/myapp,host=localhost&op=getSessionAttribute&ps=$sessionid,user" ; done 2>/dev/null \
| grep User
● Show all logged-in usernamesfor sessionid in `wget -O - 'http://user:pwd@host/manager/jmxproxy?invoke=Catalina:type=Manager,context=/myapp,host=localhost&op=listSessionIds' \
| sed -e "s/ /\n/g"
| grep '^[0-9A-Za-z]\+\(\..*\)\?$' ;\
do wget -O – "http://user:pwd@host/manager/jmxproxy?invoke=Catalina:type=Manager,context=/myapp,host=localhost&op=getSessionAttribute&ps=$sessionid,user" ; done 2>/dev/null \
| grep User
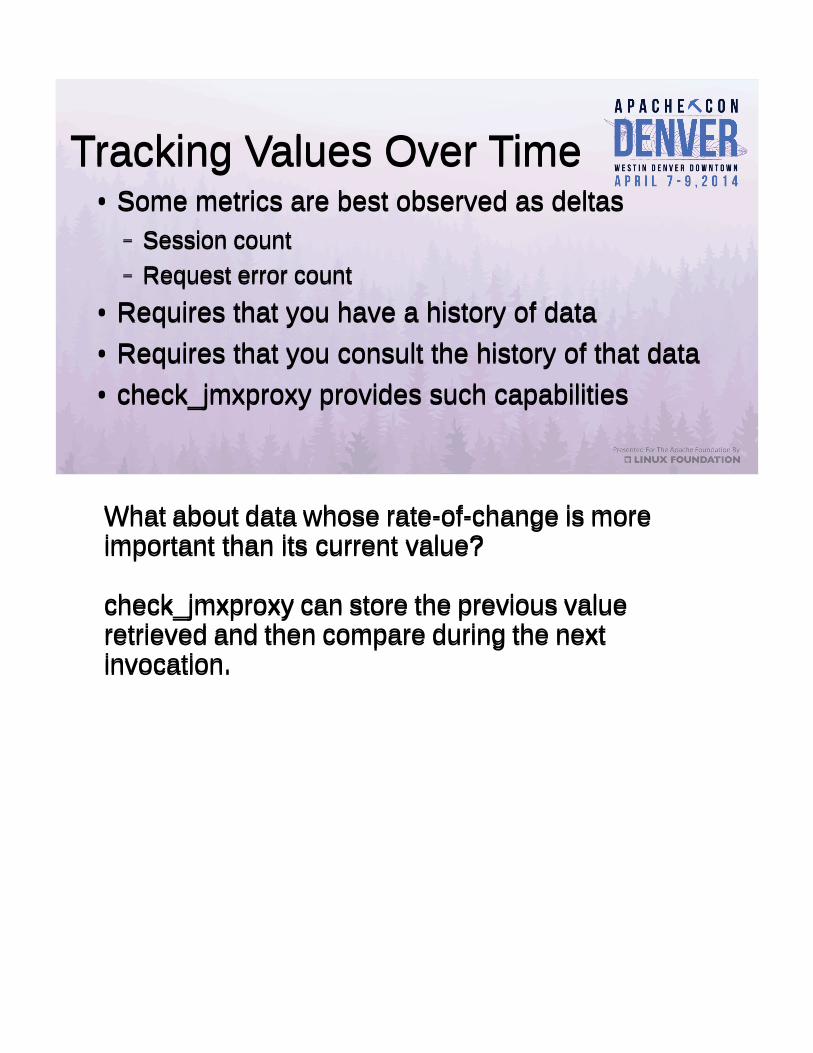
Tracking Values Over TimeTracking Values Over Time● Some metrics are best observed as deltas
– Session count– Request error count
● Requires that you have a history of data● Requires that you consult the history of that data● check_jmxproxy provides such capabilities
● Some metrics are best observed as deltas– Session count– Request error count
● Requires that you have a history of data● Requires that you consult the history of that data● check_jmxproxy provides such capabilities
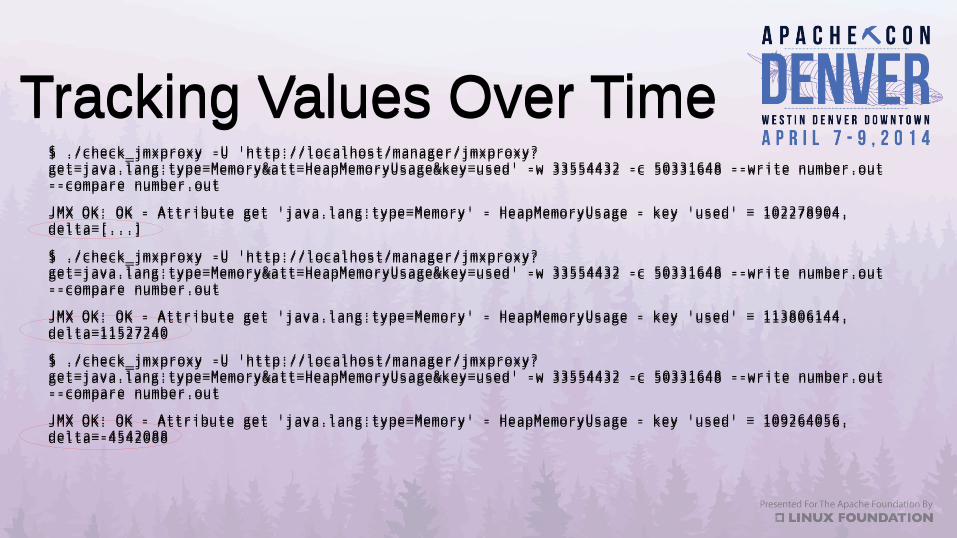
Tracking Values Over TimeTracking Values Over Time$ ./check_jmxproxy -U 'http://localhost/manager/jmxproxy?get=java.lang:type=Memory&att=HeapMemoryUsage&key=used' -w 33554432 -c 50331648 --write number.out --compare number.out
JMX OK: OK - Attribute get 'java.lang:type=Memory' - HeapMemoryUsage - key 'used' = 102278904, delta=[...]
$ ./check_jmxproxy -U 'http://localhost/manager/jmxproxy?get=java.lang:type=Memory&att=HeapMemoryUsage&key=used' -w 33554432 -c 50331648 --write number.out --compare number.out
JMX OK: OK - Attribute get 'java.lang:type=Memory' - HeapMemoryUsage - key 'used' = 113806144, delta=11527240
$ ./check_jmxproxy -U 'http://localhost/manager/jmxproxy?get=java.lang:type=Memory&att=HeapMemoryUsage&key=used' -w 33554432 -c 50331648 --write number.out --compare number.out
JMX OK: OK - Attribute get 'java.lang:type=Memory' - HeapMemoryUsage - key 'used' = 109264056, delta=-4542088
$ ./check_jmxproxy -U 'http://localhost/manager/jmxproxy?get=java.lang:type=Memory&att=HeapMemoryUsage&key=used' -w 33554432 -c 50331648 --write number.out --compare number.out
JMX OK: OK - Attribute get 'java.lang:type=Memory' - HeapMemoryUsage - key 'used' = 102278904, delta=[...]
$ ./check_jmxproxy -U 'http://localhost/manager/jmxproxy?get=java.lang:type=Memory&att=HeapMemoryUsage&key=used' -w 33554432 -c 50331648 --write number.out --compare number.out
JMX OK: OK - Attribute get 'java.lang:type=Memory' - HeapMemoryUsage - key 'used' = 113806144, delta=11527240
$ ./check_jmxproxy -U 'http://localhost/manager/jmxproxy?get=java.lang:type=Memory&att=HeapMemoryUsage&key=used' -w 33554432 -c 50331648 --write number.out --compare number.out
JMX OK: OK - Attribute get 'java.lang:type=Memory' - HeapMemoryUsage - key 'used' = 109264056, delta=-4542088
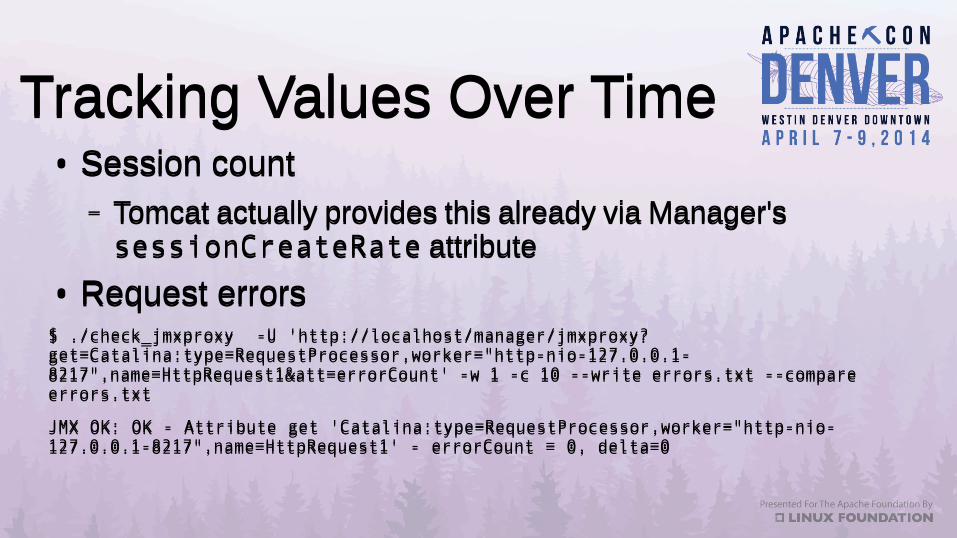
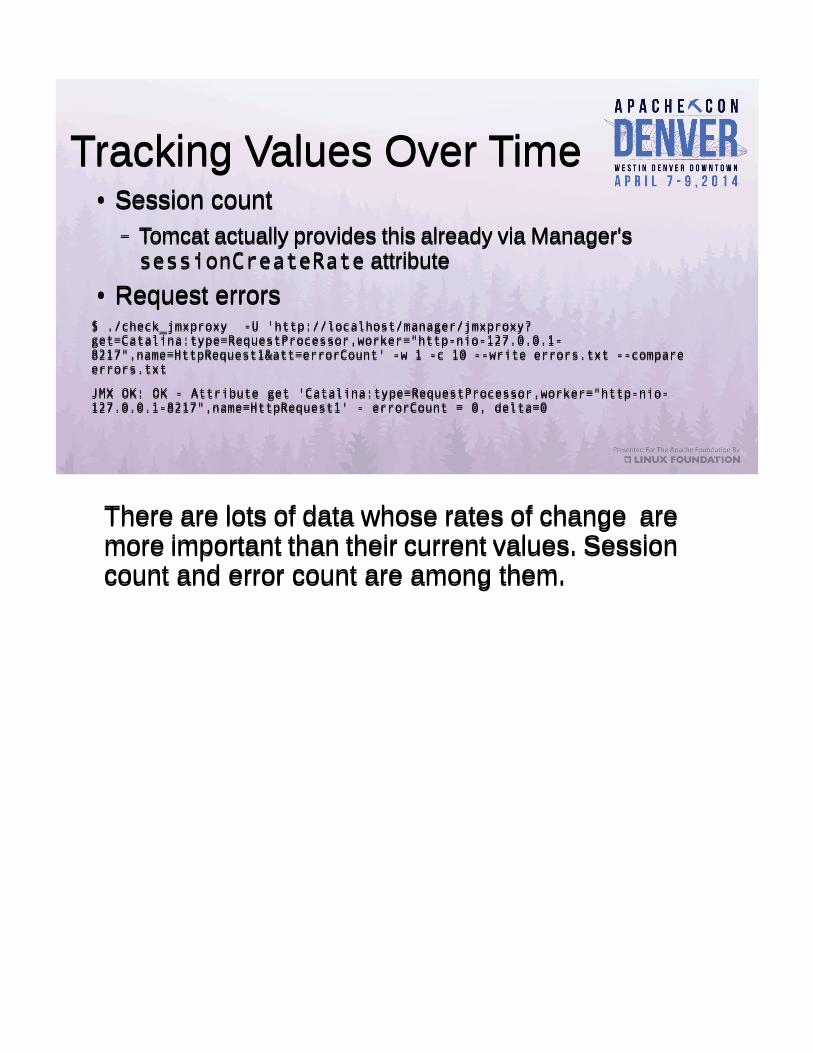
Tracking Values Over TimeTracking Values Over Time● Session count
– Tomcat actually provides this already via Manager's sessionCreateRate attribute
● Request errors$ ./check_jmxproxy -U 'http://localhost/manager/jmxproxy?get=Catalina:type=RequestProcessor,worker="http-nio-127.0.0.1-8217",name=HttpRequest1&att=errorCount' -w 1 -c 10 --write errors.txt --compare errors.txt
JMX OK: OK - Attribute get 'Catalina:type=RequestProcessor,worker="http-nio-127.0.0.1-8217",name=HttpRequest1' - errorCount = 0, delta=0
● Session count– Tomcat actually provides this already via Manager's sessionCreateRate attribute
● Request errors$ ./check_jmxproxy -U 'http://localhost/manager/jmxproxy?get=Catalina:type=RequestProcessor,worker="http-nio-127.0.0.1-8217",name=HttpRequest1&att=errorCount' -w 1 -c 10 --write errors.txt --compare errors.txt
JMX OK: OK - Attribute get 'Catalina:type=RequestProcessor,worker="http-nio-127.0.0.1-8217",name=HttpRequest1' - errorCount = 0, delta=0
Detecting OutOfMemoryDetecting OutOfMemory● Many sources of OOME
– Heap exhaustion– PermGen exhaustion– Hit thread limit– Hit file descriptor limit
● Many sources of OOME– Heap exhaustion– PermGen exhaustion– Hit thread limit– Hit file descriptor limit
Detecting OutOfMemoryDetecting OutOfMemory● Two types of heap OOME
– One thread generates lots of local references– All threads collaborate to generate globally-
reachable objects (e.g. session data)● Former is recoverable, latter is not● You want to be notified in any case
● Two types of heap OOME– One thread generates lots of local references– All threads collaborate to generate globally-
reachable objects (e.g. session data)● Former is recoverable, latter is not● You want to be notified in any case
Memory Pool ThresholdsMemory Pool Thresholds
Memory Pool ThresholdsMemory Pool Thresholds

Memory Pool ThresholdsMemory Pool Thresholds
Memory Pool ThresholdsMemory Pool Thresholds
Memory Pool ThresholdsMemory Pool Thresholds● Choice of how to detect exceeded-
threshold conditions– Polling using check_jmxproxy– Register a notification listener from Java
● Have that listener take some action
● Choice of how to detect exceeded-threshold conditions– Polling using check_jmxproxy– Register a notification listener from Java
● Have that listener take some action
Detect OutOfMemoryDetect OutOfMemory● Monitoring Memory Thresholds
– Set threshold on startup– Register a notification listener (callback)– Watch “exceeded” count (poll)– Report to monitoring software (Nagios)– Repeat for each memory pool you want to watch– Hope the JVM does not fail during notification– This is getting ridiculous
● Monitoring Memory Thresholds– Set threshold on startup– Register a notification listener (callback)– Watch “exceeded” count (poll)– Report to monitoring software (Nagios)– Repeat for each memory pool you want to watch– Hope the JVM does not fail during notification– This is getting ridiculous
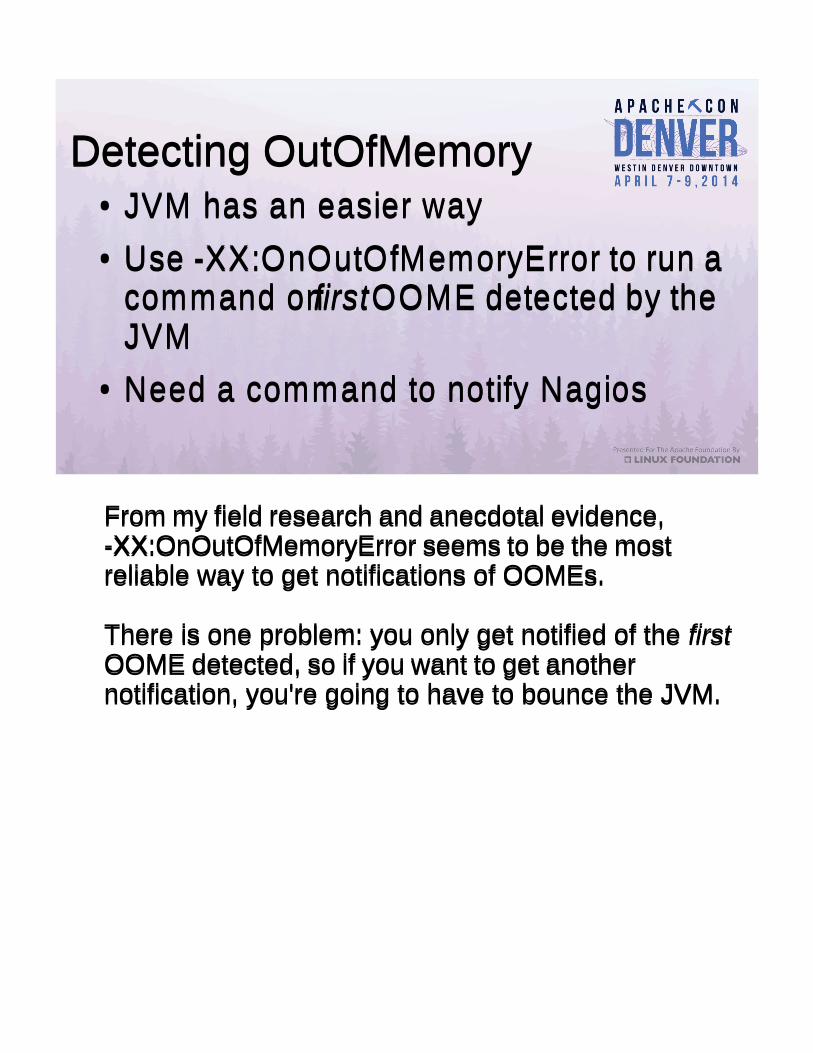
Detecting OutOfMemoryDetecting OutOfMemory● JVM has an easier way● Use -XX:OnOutOfMemoryError to run a
command on first OOME detected by the JVM
● Need a command to notify Nagios
● JVM has an easier way● Use -XX:OnOutOfMemoryError to run a
command on first OOME detected by the JVM
● Need a command to notify Nagios
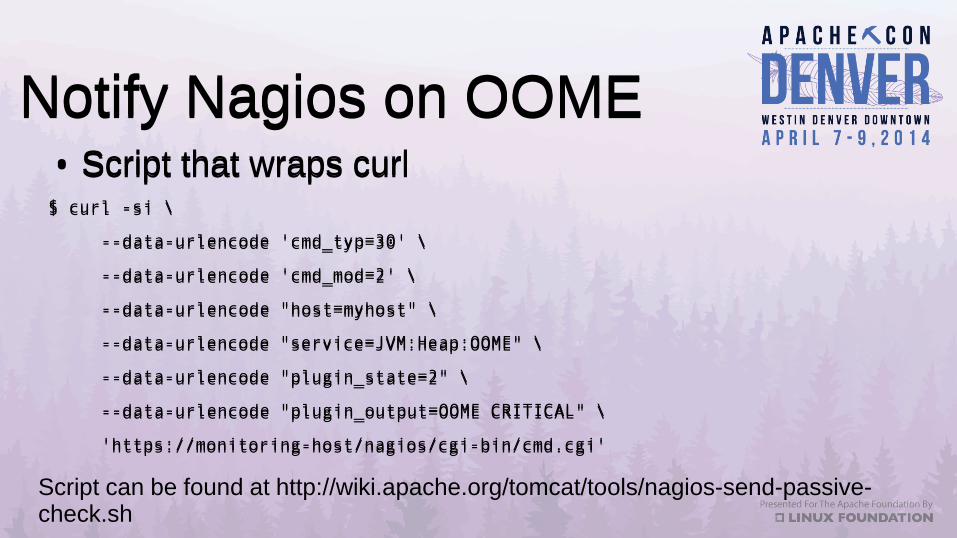
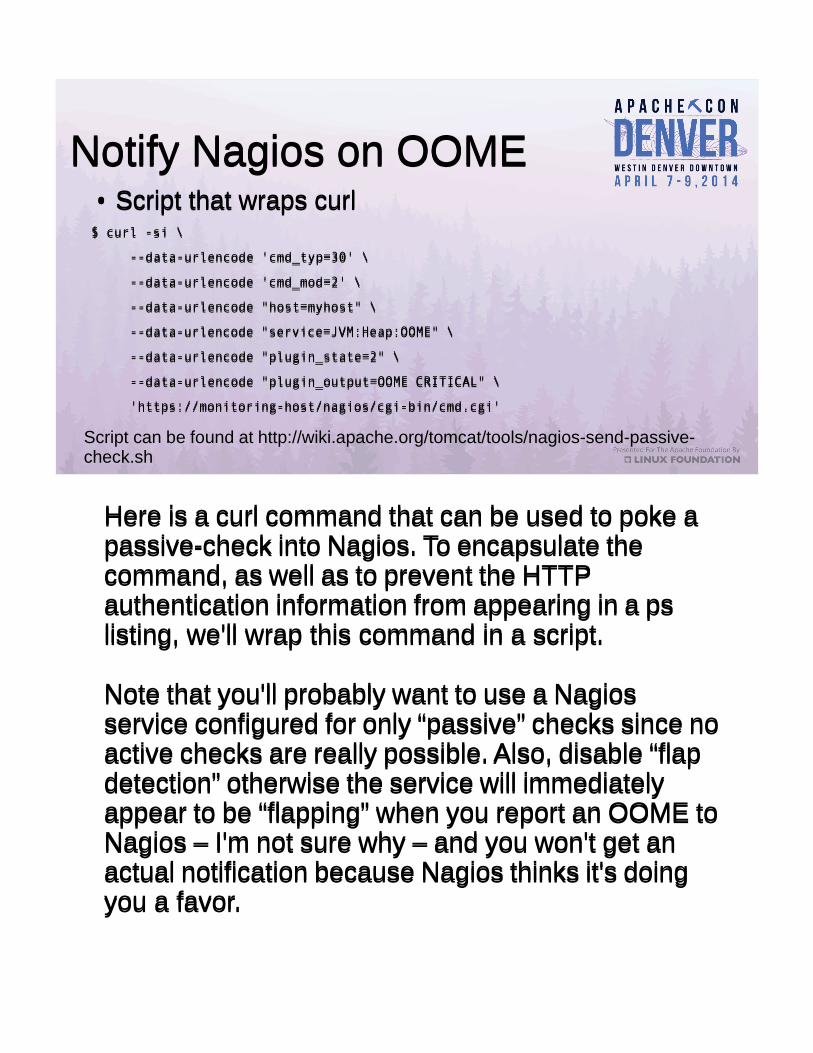
Notify Nagios on OOMENotify Nagios on OOME● Script that wraps curl$ curl -si \
--data-urlencode 'cmd_typ=30' \
--data-urlencode 'cmd_mod=2' \
--data-urlencode "host=myhost" \
--data-urlencode "service=JVM:Heap:OOME" \
--data-urlencode "plugin_state=2" \
--data-urlencode "plugin_output=OOME CRITICAL" \
'https://monitoring-host/nagios/cgi-bin/cmd.cgi'
● Script that wraps curl$ curl -si \
--data-urlencode 'cmd_typ=30' \
--data-urlencode 'cmd_mod=2' \
--data-urlencode "host=myhost" \
--data-urlencode "service=JVM:Heap:OOME" \
--data-urlencode "plugin_state=2" \
--data-urlencode "plugin_output=OOME CRITICAL" \
'https://monitoring-host/nagios/cgi-bin/cmd.cgi'
Script can be found at http://wiki.apache.org/tomcat/tools/nagios-send-passive-check.sh
Monitoring Tomcat with JMXMonitoring Tomcat with JMX● JMX Provides Monitoring and Management of JVMs● Tomcat exposes a great amount of information via JMX● Applications can expose anything to JMX via MBeans● JRE ships with tools for light JMX interaction● Practical use of JMX requires some additional tools
● JMX Provides Monitoring and Management of JVMs● Tomcat exposes a great amount of information via JMX● Applications can expose anything to JMX via MBeans● JRE ships with tools for light JMX interaction● Practical use of JMX requires some additional tools

ResourcesResources● Presentation Slides
http://people.apache.org/~schultz/ApacheCon NA 2014/Tomcat Monitoring/
● Nagios passive-check scripthttp://wiki.apache.org/tomcat/tools/nagios-send-passive-check.sh
● check_jmxproxyhttp://wiki.apache.org/tomcat/tools/check_jmxproxy.pl
● Special thanks to Christopher Blunck (MBeans info)http://oss.wxnet.org/mbeans.html
● Presentation Slideshttp://people.apache.org/~schultz/ApacheCon NA 2014/Tomcat Monitoring/
● Nagios passive-check scripthttp://wiki.apache.org/tomcat/tools/nagios-send-passive-check.sh
● check_jmxproxyhttp://wiki.apache.org/tomcat/tools/check_jmxproxy.pl
● Special thanks to Christopher Blunck (MBeans info)http://oss.wxnet.org/mbeans.html
Monitoring Tomcat with JMXMonitoring Tomcat with JMX
Christopher SchultzChief Technology OffcerTotal Child Health, Inc.
Christopher SchultzChief Technology OffcerTotal Child Health, Inc.
* Slides available on the Linux Foundation / ApacheCon2014 web site and at http://people.apache.org/~schultz/ApacheCon NA 2014/Tomcat Monitoring/
I'm essentially a DevOps CTO, and everything I'm presenting today has been something I've had to do in my own work in that regard. My own monitoring work is very much a work in progress.
This is an introduction to monitoring Tomcat and even JVM processes in general. Nothing I'm going to present is particularly earth-shattering or difficult to understand. And that's good news!
There is really no need to consider why monitoring is necessary, so let's just jump right in.
Java Management ExtensionsJava Management Extensions
● Protocol and API for managing and monitoring– Access data via JMX “Mbeans”– Read and write bean attributes– Invoke operations– Receive notifications
● JVM exposes certain status● Tomcat exposes certain status
● Protocol and API for managing and monitoring– Access data via JMX “Mbeans”– Read and write bean attributes– Invoke operations– Receive notifications
● JVM exposes certain status● Tomcat exposes certain status
Manage and monitor JVM processes.Everything is MBeansRead/write attributesInvoke operationsReceive notificationsBoth the JVM and Tomcat expose these types of things via JMX.
Manage and monitor JVM processes.Everything is MBeansRead/write attributesInvoke operationsReceive notificationsBoth the JVM and Tomcat expose these types of things via JMX.
Monitoring JVMMonitoring JVM
● Heap status● Total, free, used memory● Garbage collection● GC pause times
● Heap status● Total, free, used memory● Garbage collection● GC pause times
The JVM exposes a lot about its internal state. Here are some of the more interesting items.The JVM exposes a lot about its internal state. Here are some of the more interesting items.

Monitoring TomcatMonitoring Tomcat
● Status of connector● Status of request-processor thread pool● Status of data sources● Request performance
● Status of connector● Status of request-processor thread pool● Status of data sources● Request performance
Tomcat has a great deal of information available as well. Here's a sample of what's there.Tomcat has a great deal of information available as well. Here's a sample of what's there.

JMX ToolsJMX Tools
● jconsole (JDK)● VisualVM (JDK, app bundle)● Most profilers (e.g. YourKit, etc.)● Custom tools using javax.management API
● jconsole (JDK)● VisualVM (JDK, app bundle)● Most profilers (e.g. YourKit, etc.)● Custom tools using javax.management API
While JMX is an API + protocol, you don't need to know or understand either of them to benefit: tools already exist.
You can always write your own if you need something special.
While JMX is an API + protocol, you don't need to know or understand either of them to benefit: tools already exist.
You can always write your own if you need something special.
Monitoring JVM: HeapMonitoring JVM: Heap
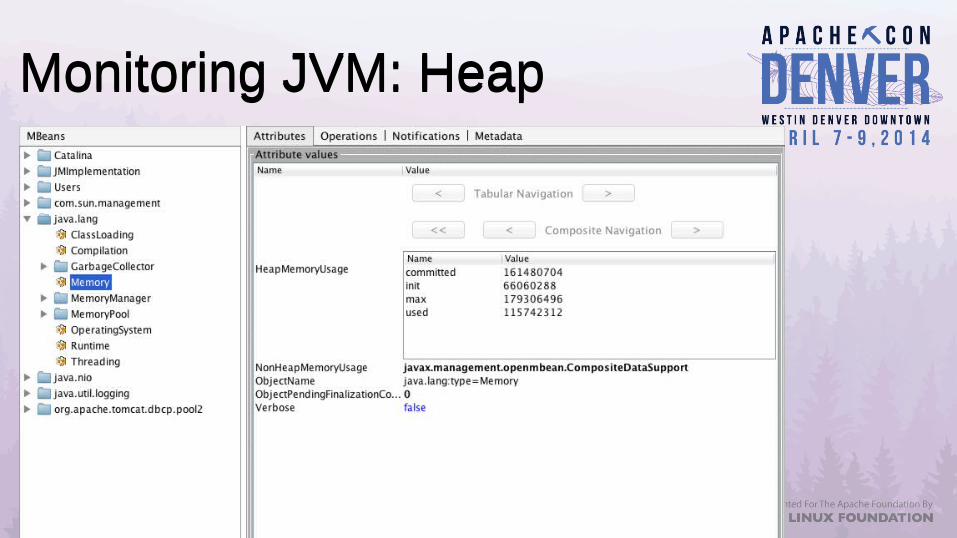
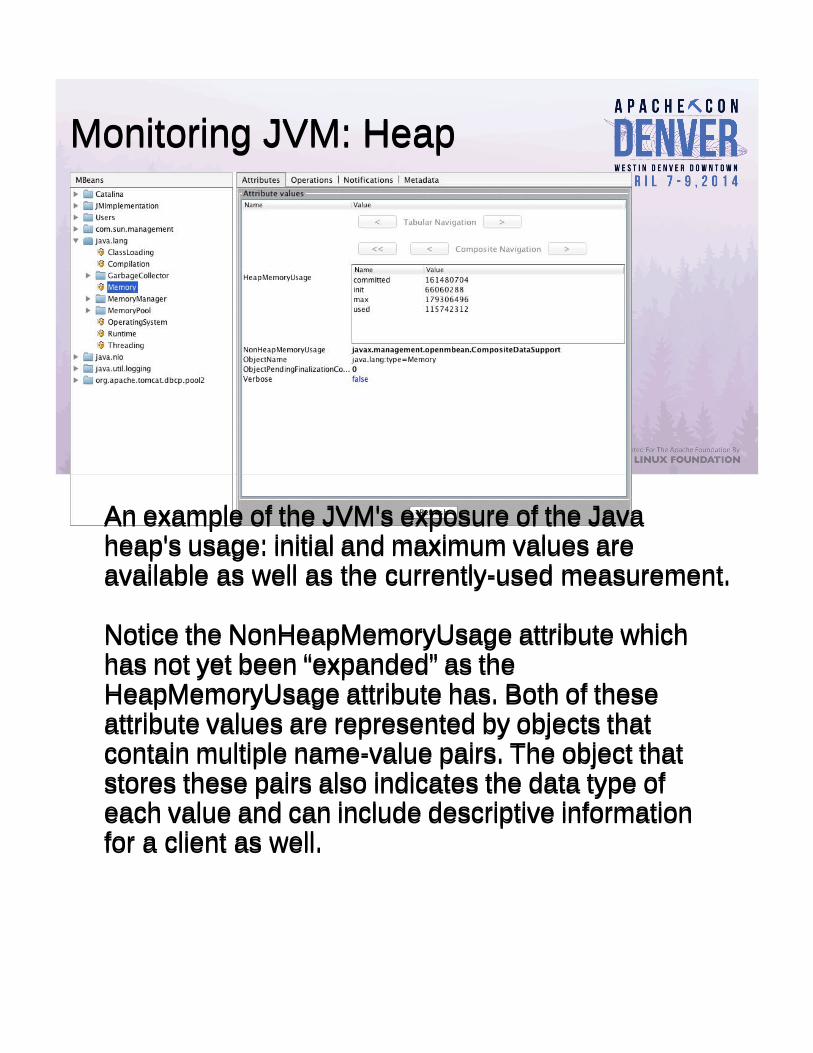
An example of the JVM's exposure of the Java heap's usage: initial and maximum values are available as well as the currently-used measurement.
Notice the NonHeapMemoryUsage attribute which has not yet been “expanded” as the HeapMemoryUsage attribute has. Both of these attribute values are represented by objects that contain multiple name-value pairs. The object that stores these pairs also indicates the data type of each value and can include descriptive information for a client as well.
Monitoring TomcatMonitoring Tomcat● Status of data sources● Status of request-
processor thread pool● Request performance● Session information
● Status of data sources● Status of request-
processor thread pool● Request performance● Session information
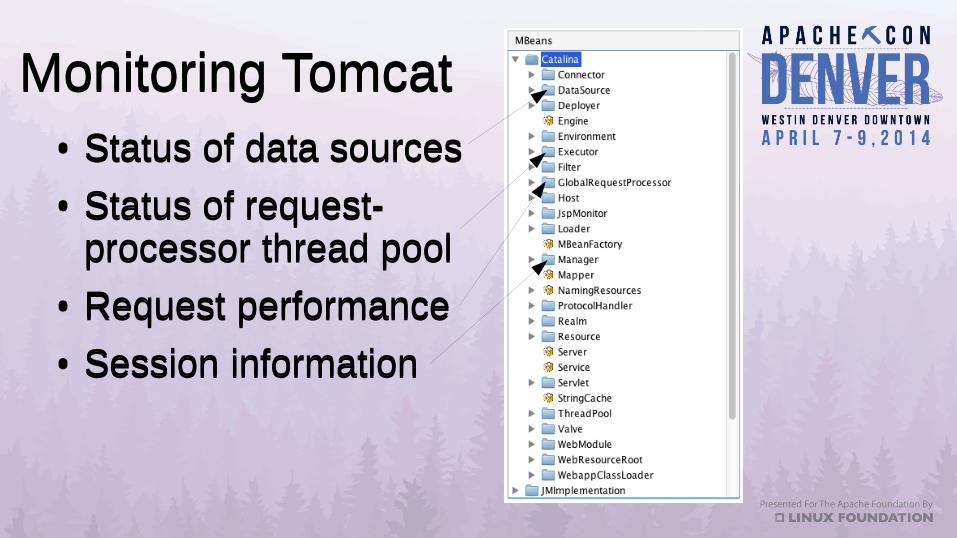
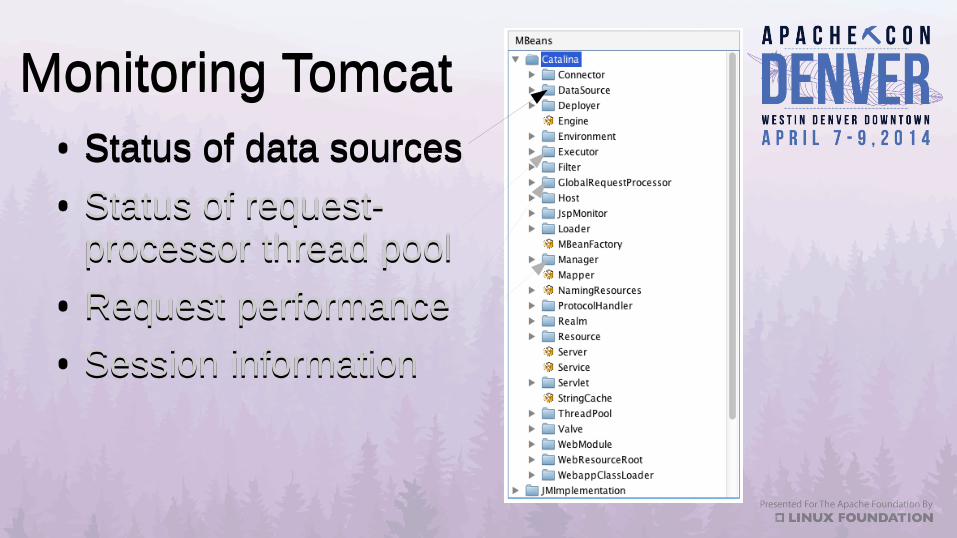
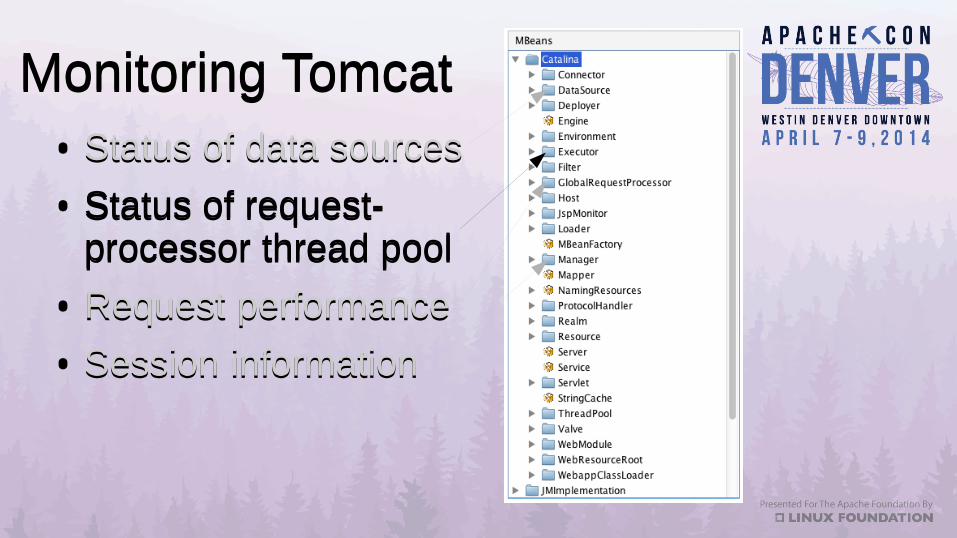
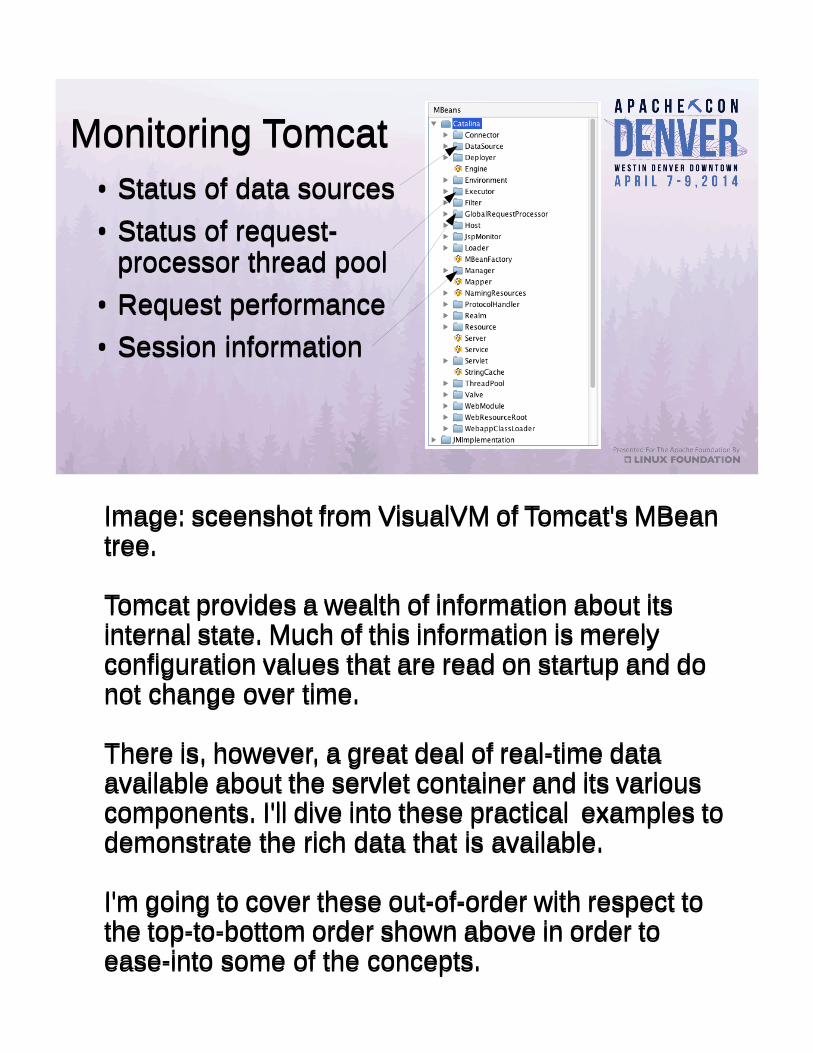
Image: sceenshot from VisualVM of Tomcat's MBean tree.
Tomcat provides a wealth of information about its internal state. Much of this information is merely configuration values that are read on startup and do not change over time.
There is, however, a great deal of real-time data available about the servlet container and its various components. I'll dive into these practical examples to demonstrate the rich data that is available.
I'm going to cover these out-of-order with respect to the top-to-bottom order shown above in order to ease-into some of the concepts.
Monitoring TomcatMonitoring Tomcat● Status of data sources● Status of request-
processor thread pool● Request performance● Session information
● Status of data sources● Status of request-
processor thread pool● Request performance● Session information
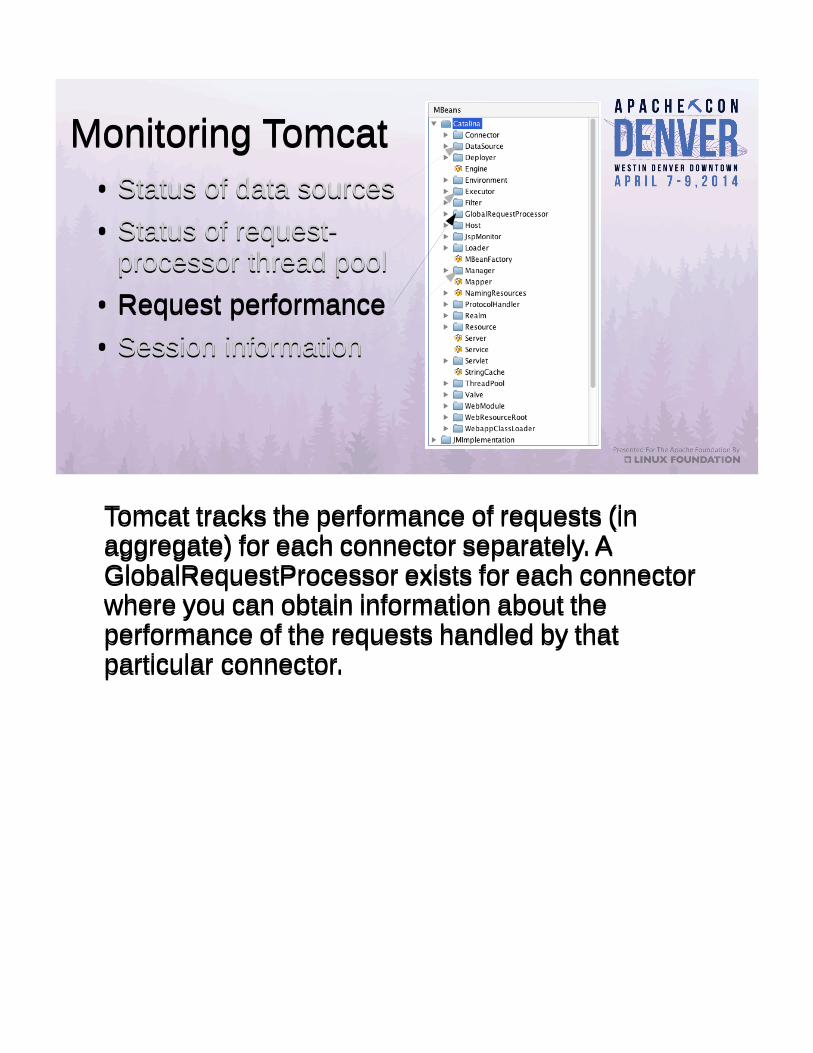
Tomcat tracks the performance of requests (in aggregate) for each connector separately. A GlobalRequestProcessor exists for each connector where you can obtain information about the performance of the requests handled by that particular connector.
Tomcat tracks the performance of requests (in aggregate) for each connector separately. A GlobalRequestProcessor exists for each connector where you can obtain information about the performance of the requests handled by that particular connector.

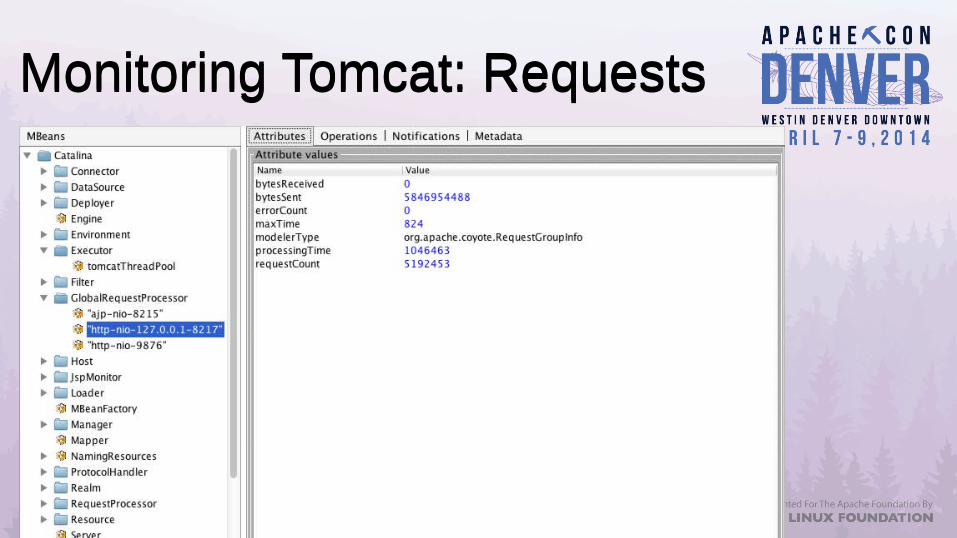
Monitoring Tomcat: RequestsMonitoring Tomcat: Requests
Here is a view of one of Tomcat's GlobalRequestProcessors. I happen to have 3 connectors configured, and you can tell them apart by their names which also indicate a lot about them: protocol, interface address, and port number will uniquely identify any connector's GlobalRequestProcessor.
These GlobalRequestProcessors keep track of metrics about requests such as the number of requests, the cumulative processing time of those requests, and the overall volume of data processed.
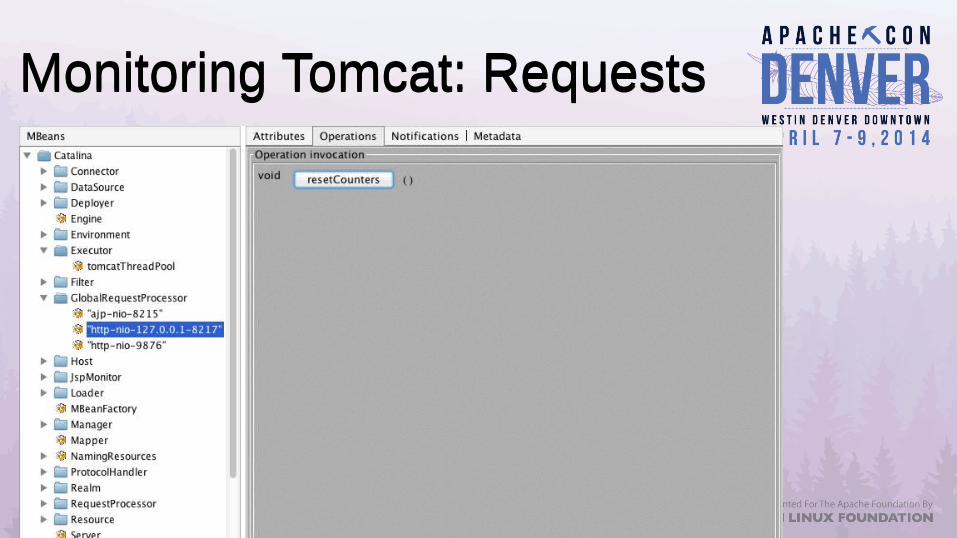
Monitoring Tomcat: RequestsMonitoring Tomcat: Requests
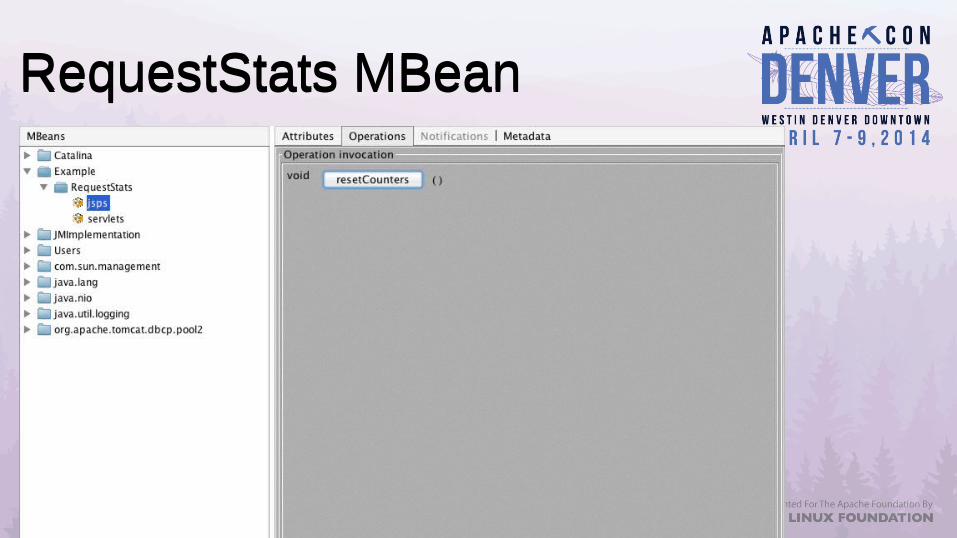
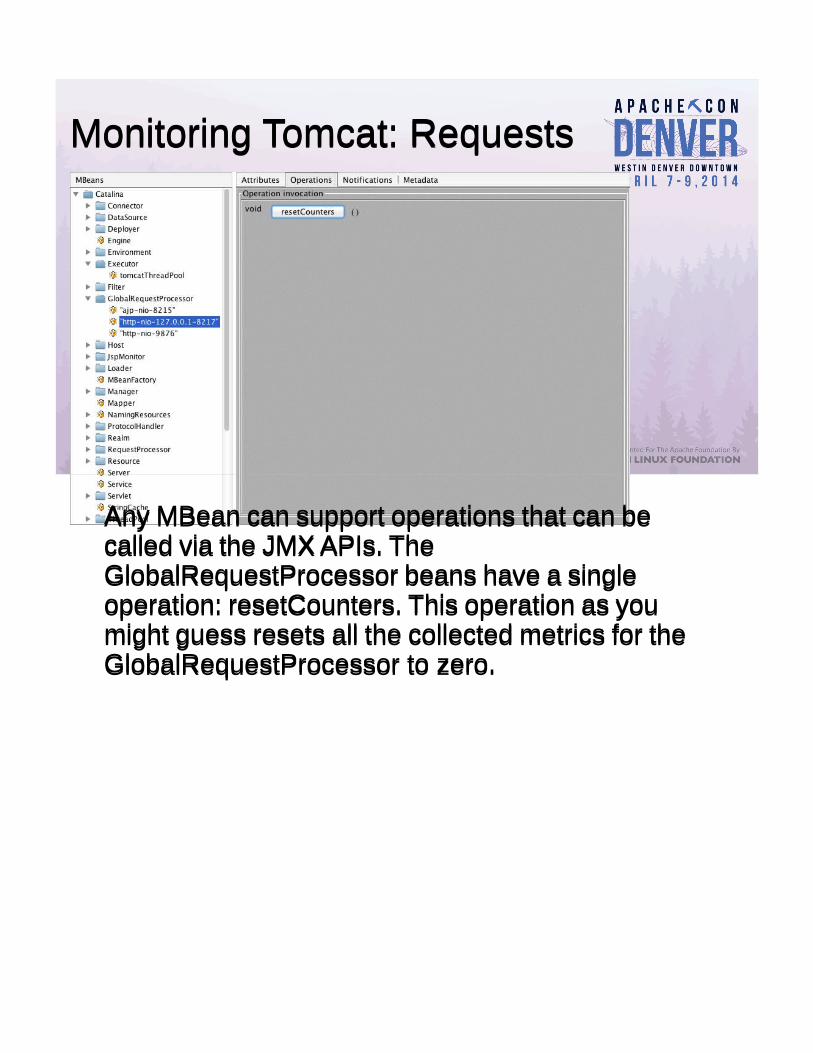
Any MBean can support operations that can be called via the JMX APIs. The GlobalRequestProcessor beans have a single operation: resetCounters. This operation as you might guess resets all the collected metrics for the GlobalRequestProcessor to zero.
Any MBean can support operations that can be called via the JMX APIs. The GlobalRequestProcessor beans have a single operation: resetCounters. This operation as you might guess resets all the collected metrics for the GlobalRequestProcessor to zero.
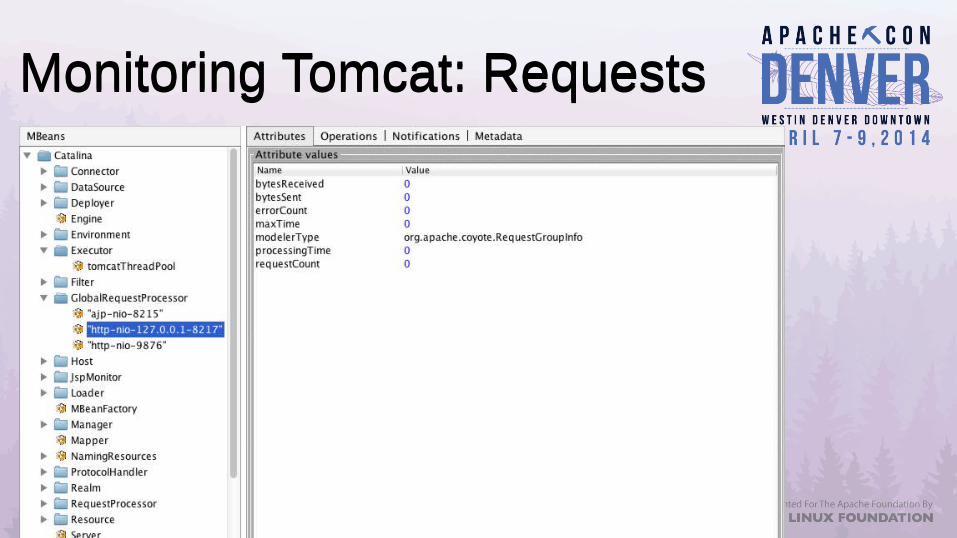
Monitoring Tomcat: RequestsMonitoring Tomcat: Requests
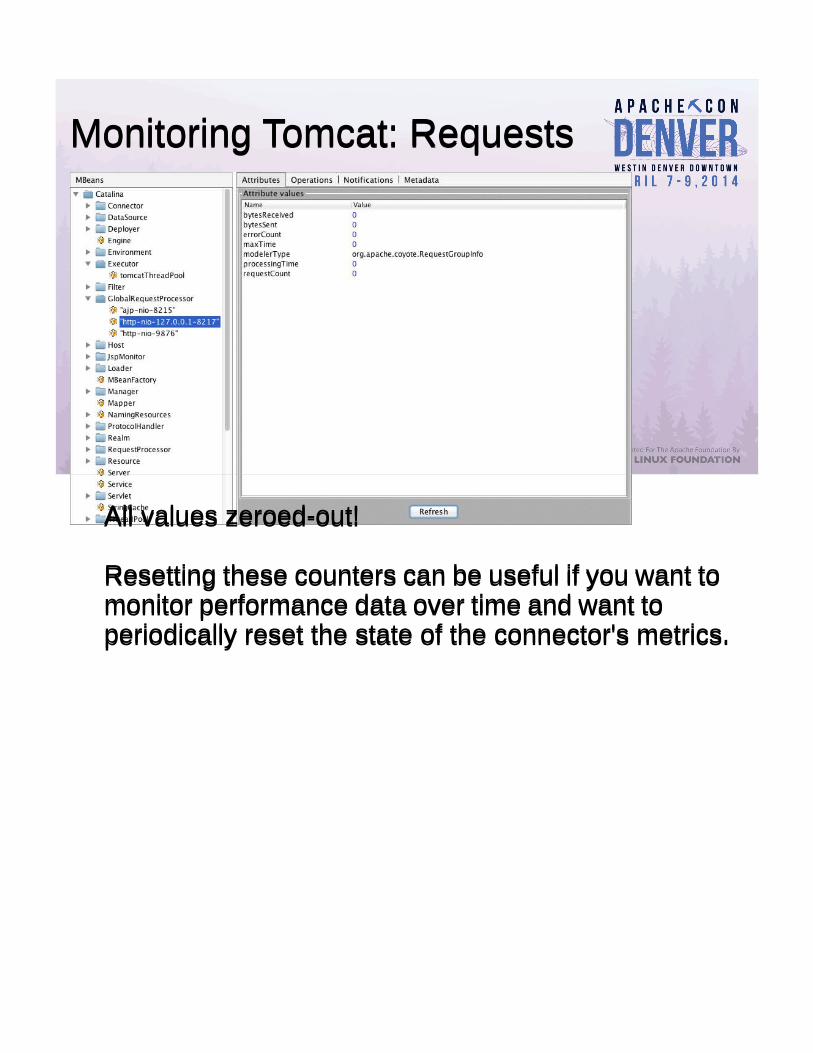
All values zeroed-out!
Resetting these counters can be useful if you want to monitor performance data over time and want to periodically reset the state of the connector's metrics.
All values zeroed-out!
Resetting these counters can be useful if you want to monitor performance data over time and want to periodically reset the state of the connector's metrics.
Monitoring TomcatMonitoring Tomcat● Status of data sources● Status of request-
processor thread pool● Request performance● Session information
● Status of data sources● Status of request-
processor thread pool● Request performance● Session information
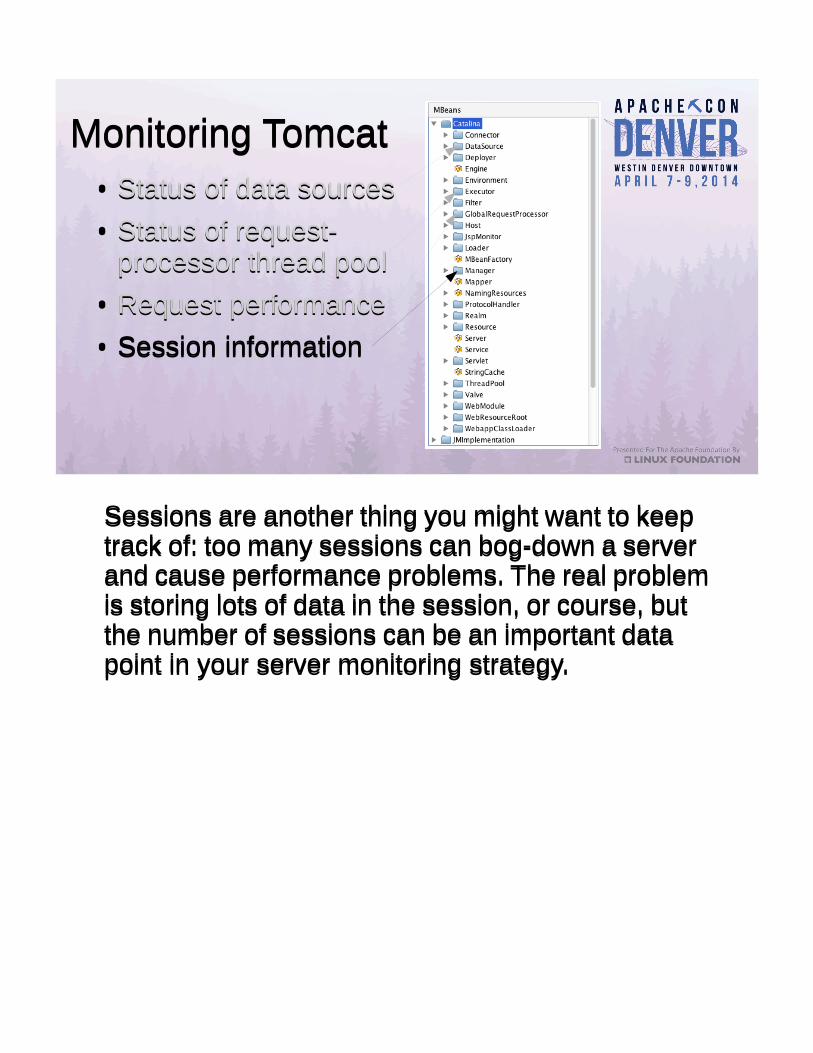
Sessions are another thing you might want to keep track of: too many sessions can bog-down a server and cause performance problems. The real problem is storing lots of data in the session, or course, but the number of sessions can be an important data point in your server monitoring strategy.
Sessions are another thing you might want to keep track of: too many sessions can bog-down a server and cause performance problems. The real problem is storing lots of data in the session, or course, but the number of sessions can be an important data point in your server monitoring strategy.
Monitoring Tomcat: SessionsMonitoring Tomcat: Sessions
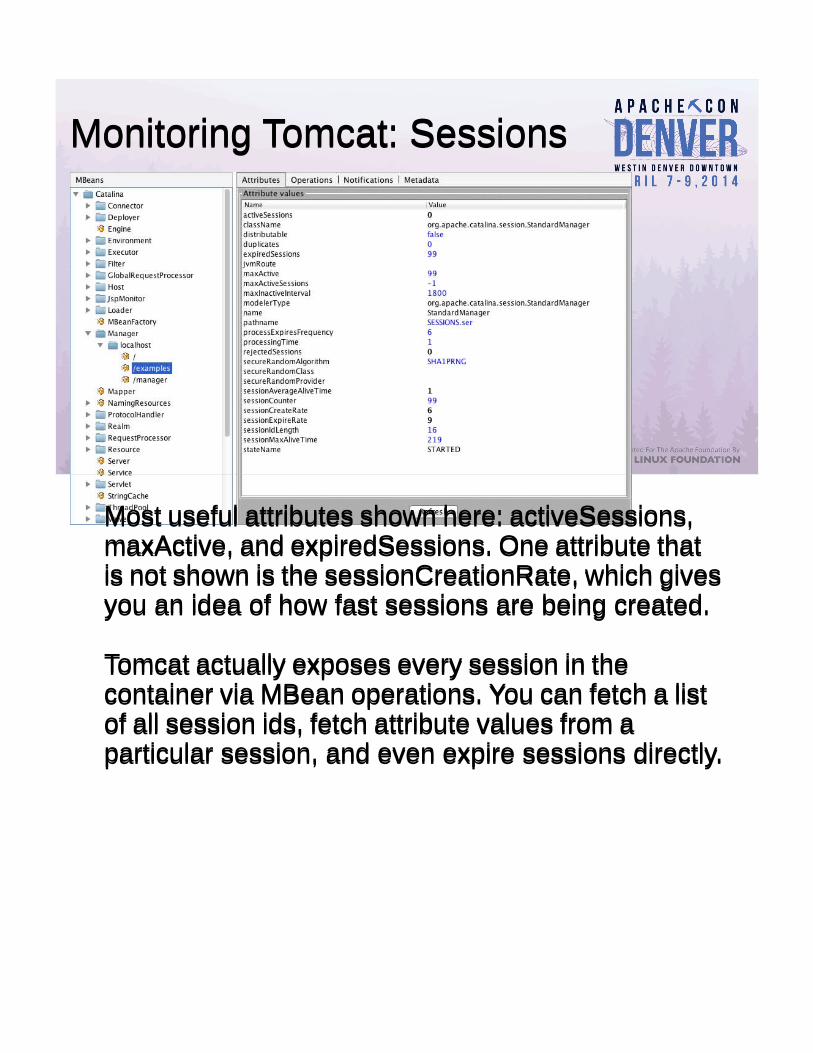
Most useful attributes shown here: activeSessions, maxActive, and expiredSessions. One attribute that is not shown is the sessionCreationRate, which gives you an idea of how fast sessions are being created.
Tomcat actually exposes every session in the container via MBean operations. You can fetch a list of all session ids, fetch attribute values from a particular session, and even expire sessions directly.
Monitoring TomcatMonitoring Tomcat● Status of data sources● Status of request-
processor thread pool● Request performance● Session information
● Status of data sources● Status of request-
processor thread pool● Request performance● Session information
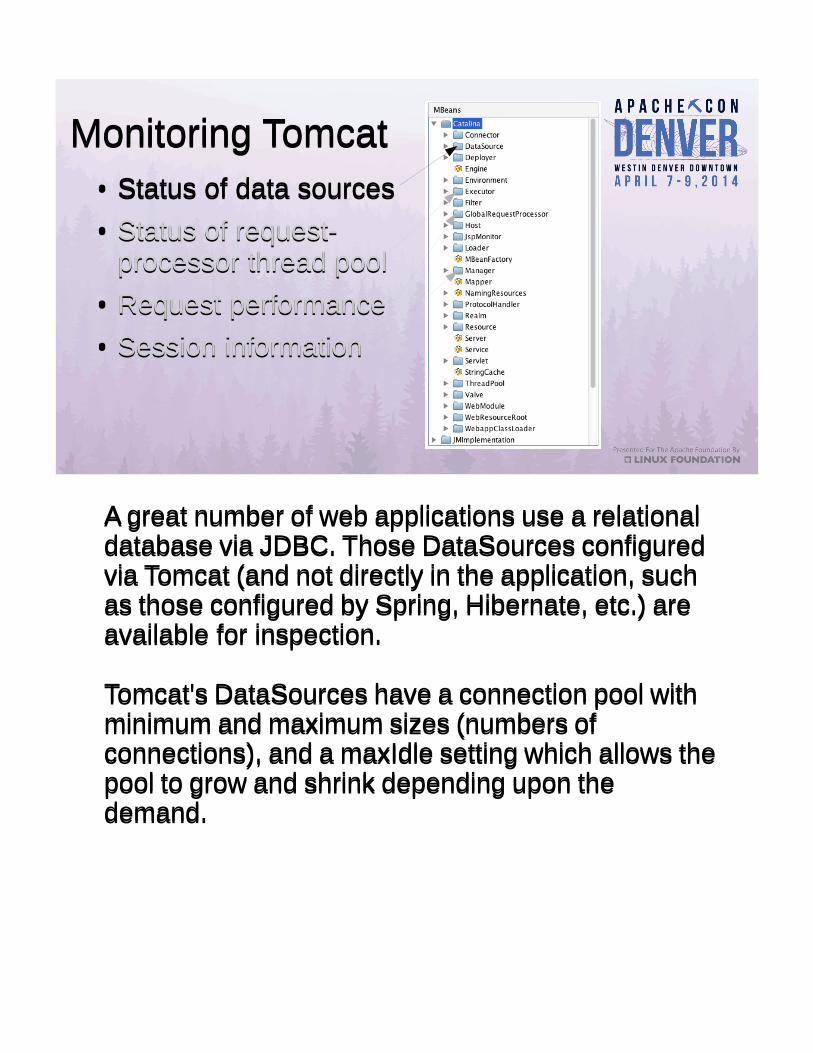
A great number of web applications use a relational database via JDBC. Those DataSources configured via Tomcat (and not directly in the application, such as those configured by Spring, Hibernate, etc.) are available for inspection.
Tomcat's DataSources have a connection pool with minimum and maximum sizes (numbers of connections), and a maxIdle setting which allows the pool to grow and shrink depending upon the demand.
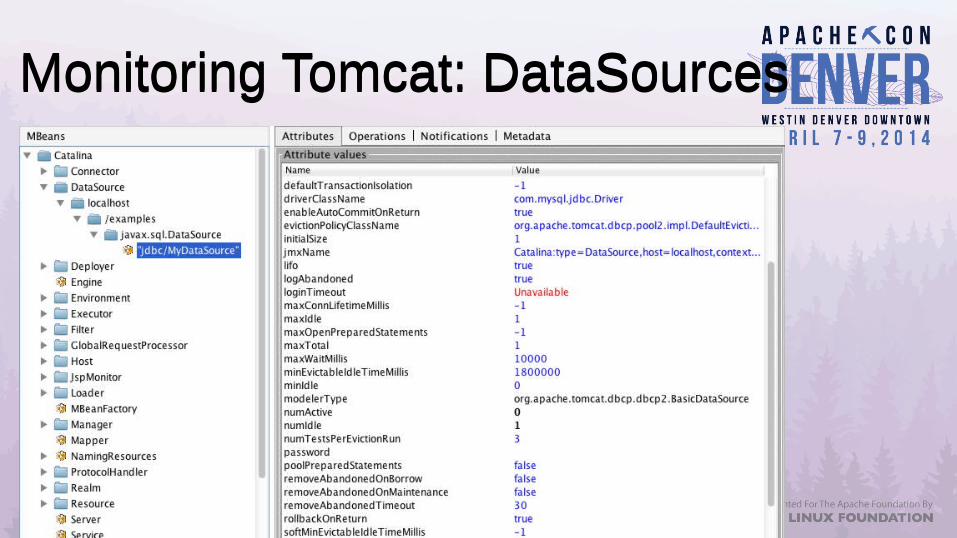
Monitoring Tomcat: DataSourcesMonitoring Tomcat: DataSources
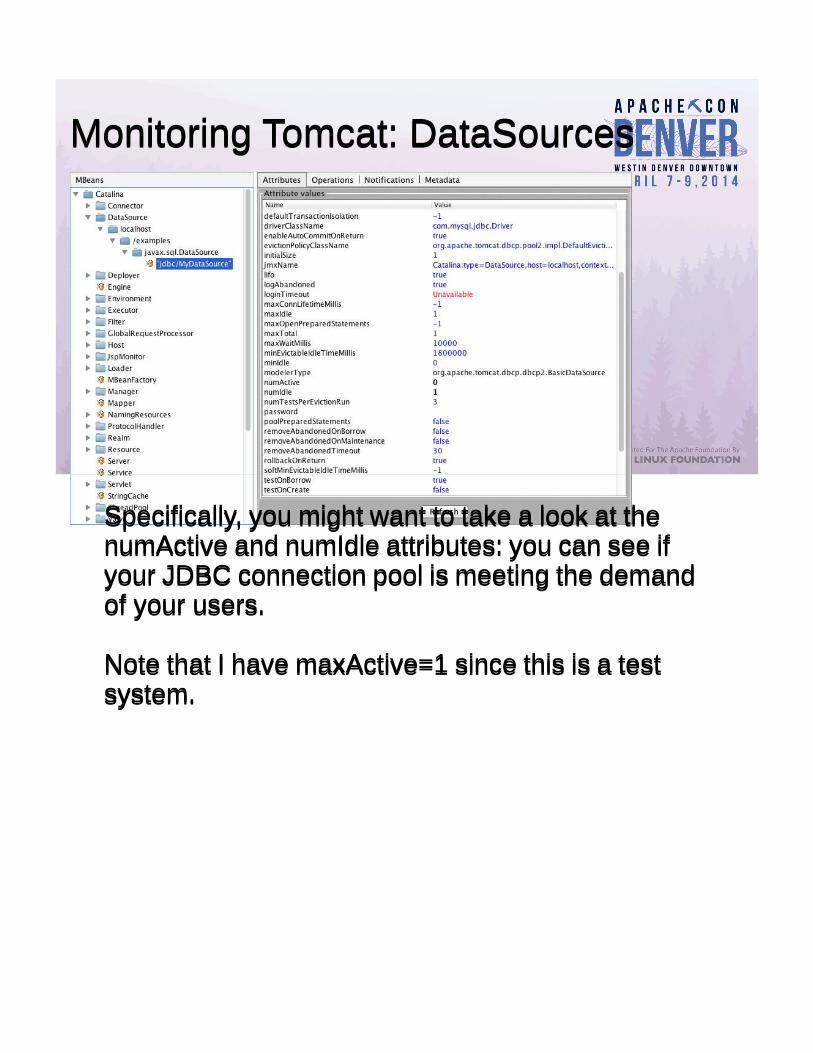
Specifically, you might want to take a look at the numActive and numIdle attributes: you can see if your JDBC connection pool is meeting the demand of your users.
Note that I have maxActive=1 since this is a test system.
Specifically, you might want to take a look at the numActive and numIdle attributes: you can see if your JDBC connection pool is meeting the demand of your users.
Note that I have maxActive=1 since this is a test system.
Monitoring TomcatMonitoring Tomcat● Status of data sources● Status of request-
processor thread pool● Request performance● Session information
● Status of data sources● Status of request-
processor thread pool● Request performance● Session information
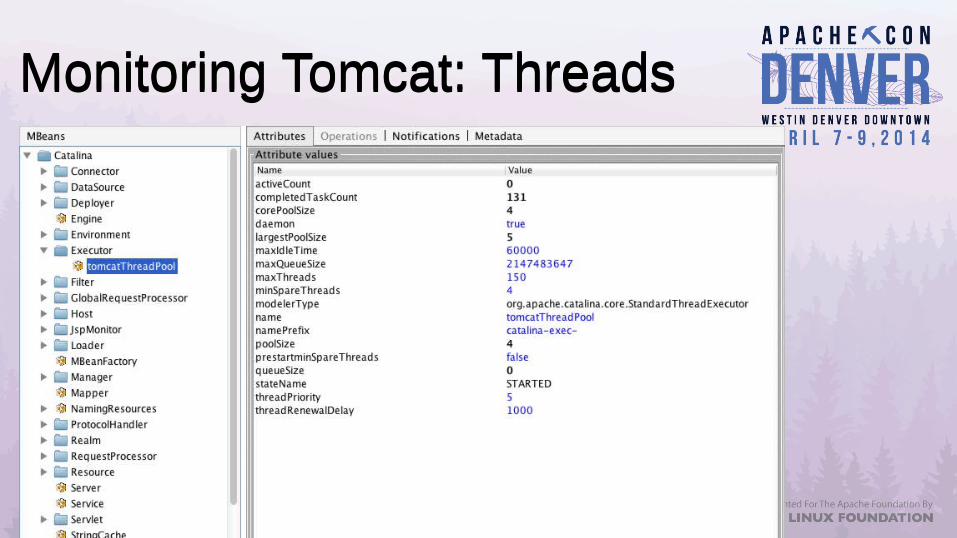
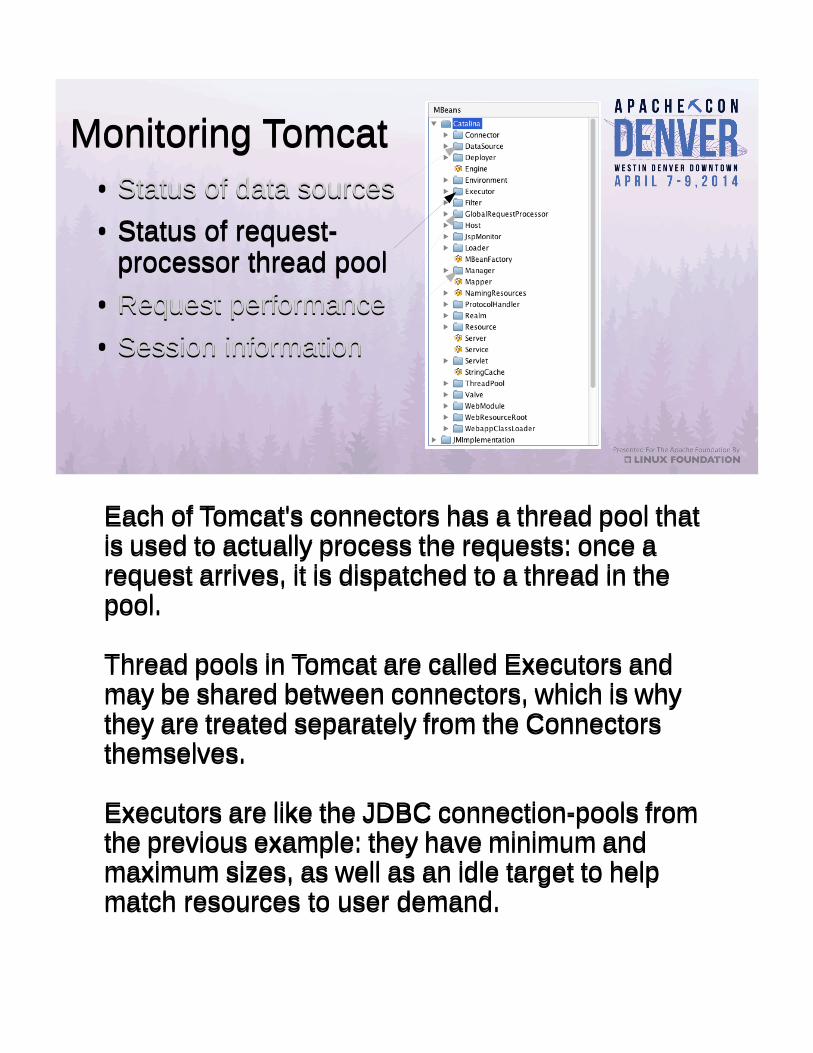
Each of Tomcat's connectors has a thread pool that is used to actually process the requests: once a request arrives, it is dispatched to a thread in the pool.
Thread pools in Tomcat are called Executors and may be shared between connectors, which is why they are treated separately from the Connectors themselves.
Executors are like the JDBC connection-pools from the previous example: they have minimum and maximum sizes, as well as an idle target to help match resources to user demand.
Monitoring Tomcat: ThreadsMonitoring Tomcat: Threads
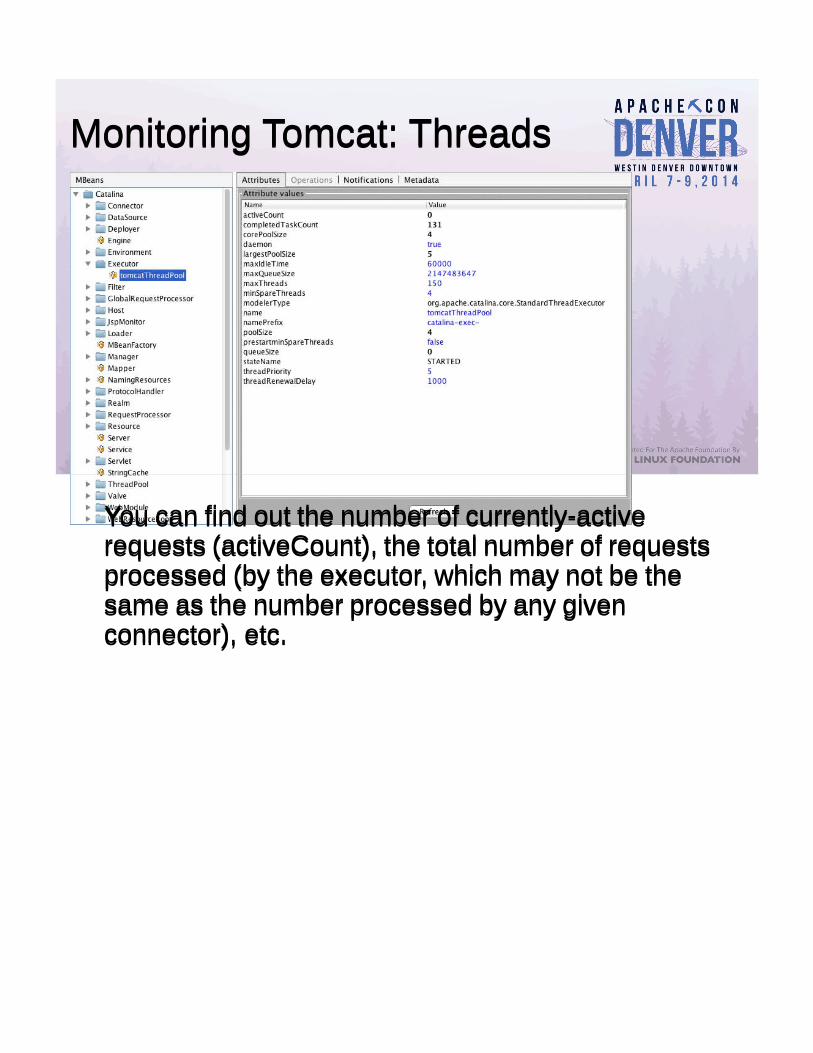
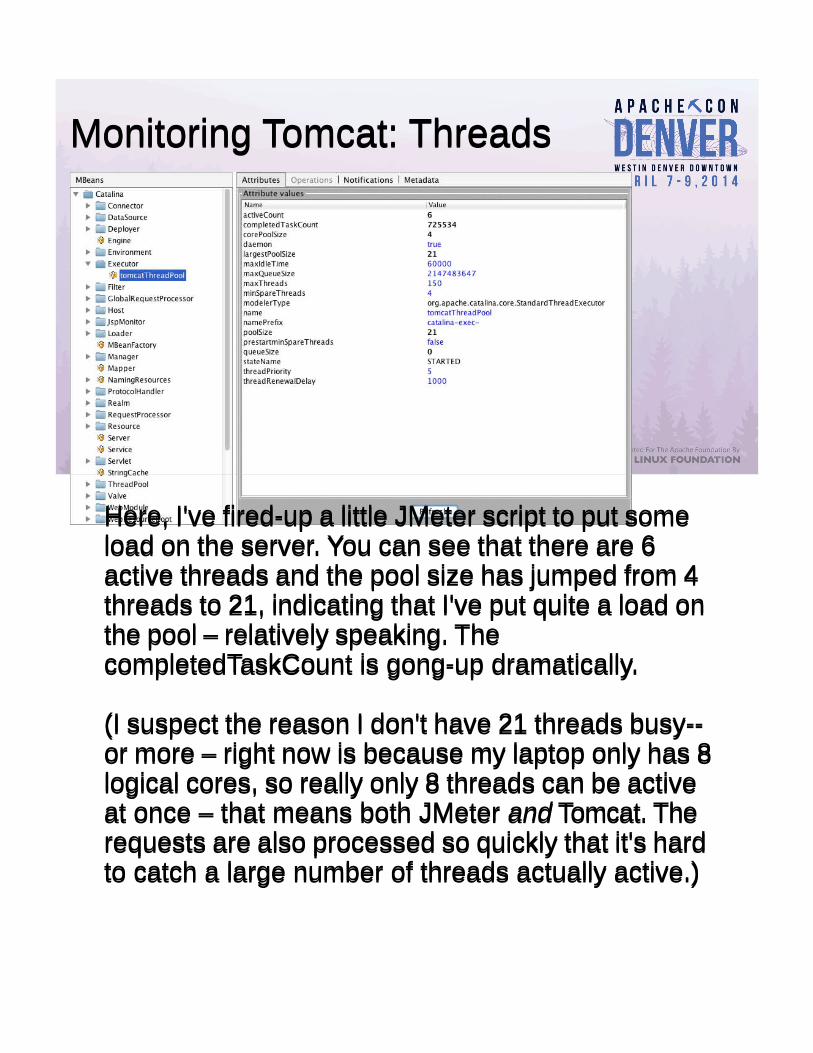
You can find out the number of currently-active requests (activeCount), the total number of requests processed (by the executor, which may not be the same as the number processed by any given connector), etc.
You can find out the number of currently-active requests (activeCount), the total number of requests processed (by the executor, which may not be the same as the number processed by any given connector), etc.
Monitoring Tomcat: ThreadsMonitoring Tomcat: Threads
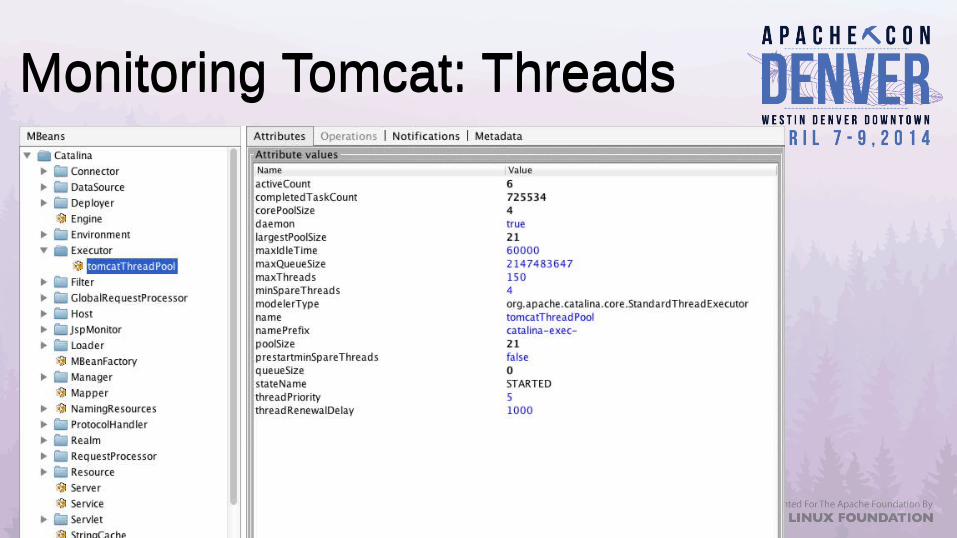
Here, I've fired-up a little JMeter script to put some load on the server. You can see that there are 6 active threads and the pool size has jumped from 4 threads to 21, indicating that I've put quite a load on the pool – relatively speaking. The completedTaskCount is gong-up dramatically.
(I suspect the reason I don't have 21 threads busy-- or more – right now is because my laptop only has 8 logical cores, so really only 8 threads can be active at once – that means both JMeter and Tomcat. The requests are also processed so quickly that it's hard to catch a large number of threads actually active.)
Monitoring Tomcat: ThreadsMonitoring Tomcat: Threads
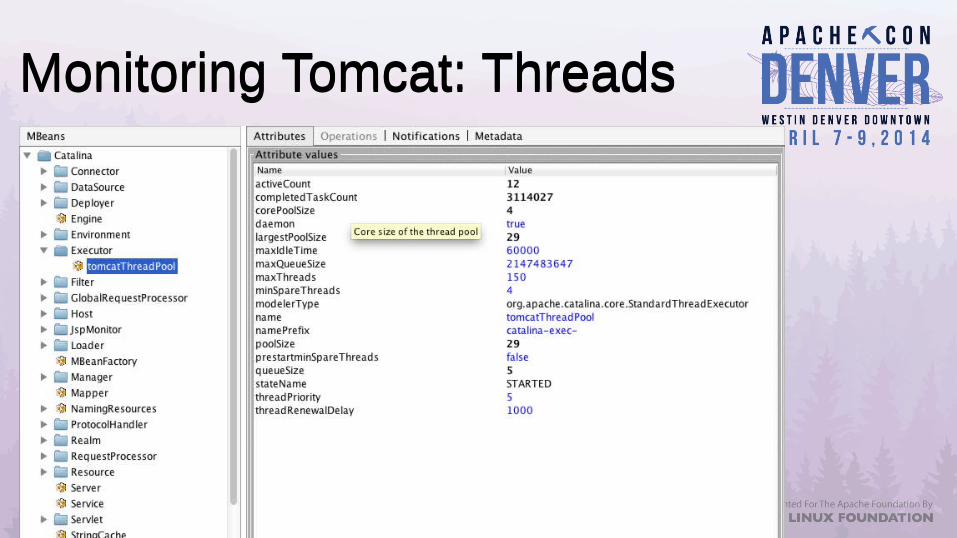
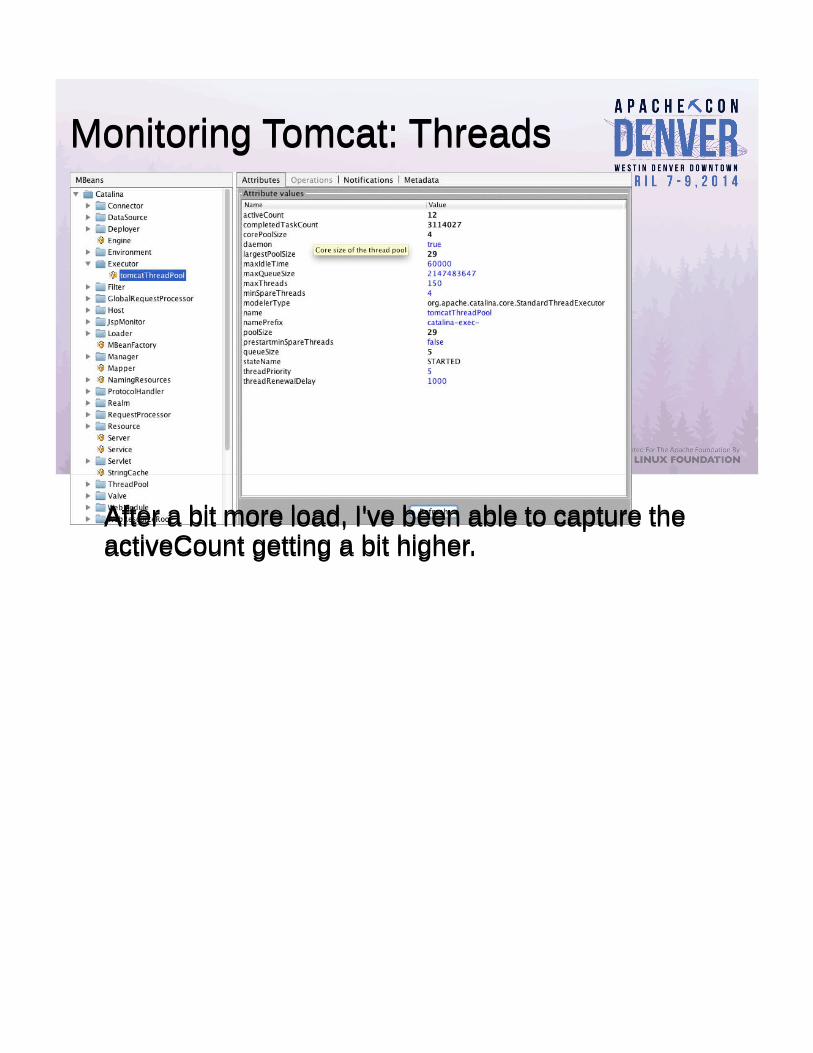
After a bit more load, I've been able to capture the activeCount getting a bit higher.After a bit more load, I've been able to capture the activeCount getting a bit higher.
Monitoring Tomcat: ThreadsMonitoring Tomcat: Threads
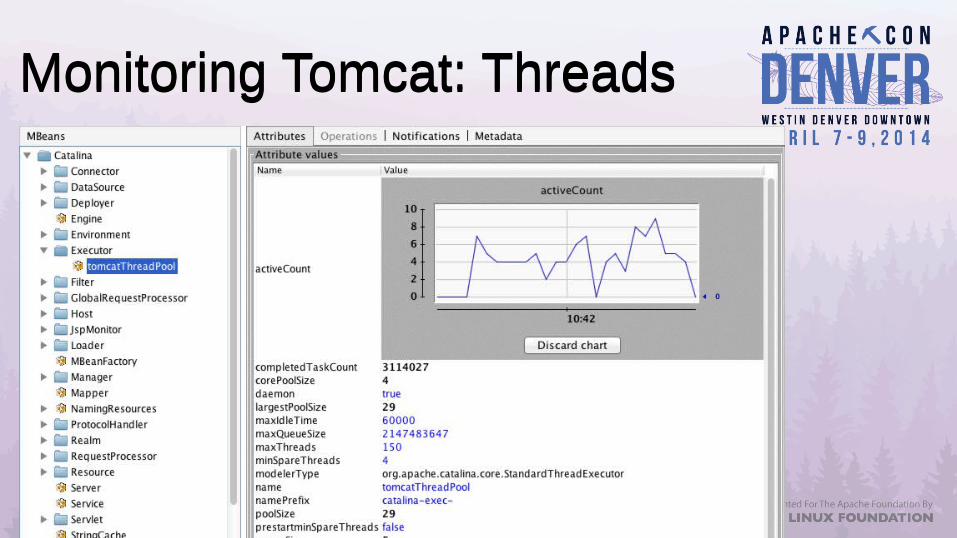
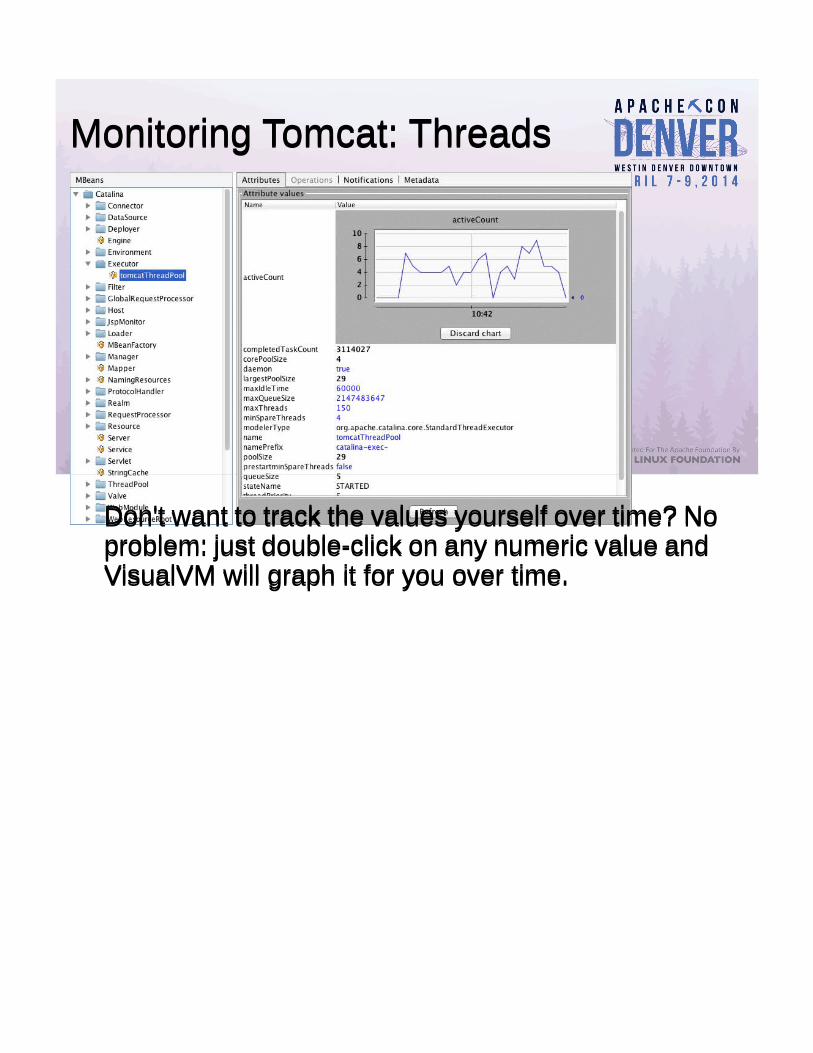
Don't want to track the values yourself over time? No problem: just double-click on any numeric value and VisualVM will graph it for you over time.
Don't want to track the values yourself over time? No problem: just double-click on any numeric value and VisualVM will graph it for you over time.

Monitoring Your ApplicationMonitoring Your Application● Monitor Application Processes● Performance Metrics● On-the-fly re-configuration
● Monitor Application Processes● Performance Metrics● On-the-fly re-configuration
So, the JVM and Tomcat expose information about themselves. That's great for monitoring the state of the JVM and the servlet container, but what about your own application's health?
You have caches, other data stores, complex objects, and a little bit of everything going on inside your own application. How can we peek under those covers?
Monitoring Your ApplicationMonitoring Your Application● Write an MBean
– Create an Interface: FooMBean– Create an Implementation: Foo– Create an XML MBean descriptor
● Deploy package to Tomcat– Publish the MBean to the MBean server
● Query / invoke as necessary
* Example code will be available at http://people.apache.org/~schultz/ApacheCon NA 2014/Tomcat Monitoring/
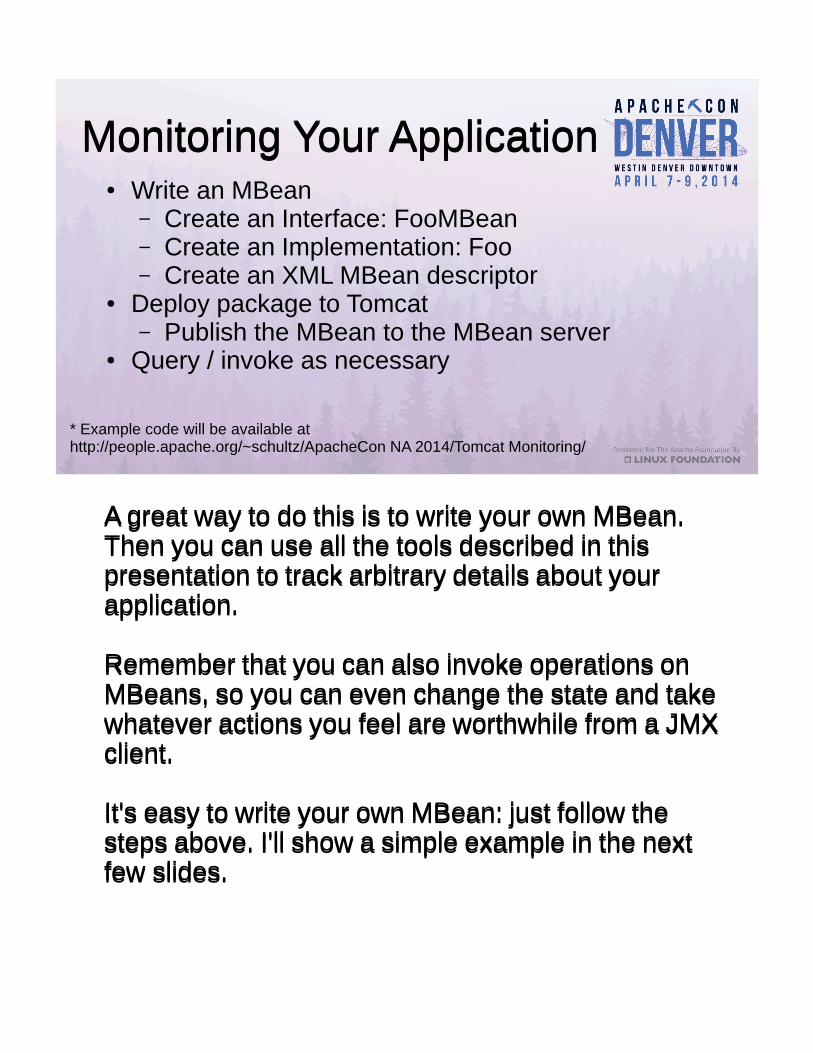
A great way to do this is to write your own MBean. Then you can use all the tools described in this presentation to track arbitrary details about your application.
Remember that you can also invoke operations on MBeans, so you can even change the state and take whatever actions you feel are worthwhile from a JMX client.
It's easy to write your own MBean: just follow the steps above. I'll show a simple example in the next few slides.
Example MBeanExample MBean● Servlet Filter that captures total request
processing time– Timestamp prior to request– Timestamp after request– Add the delta to a JMX-accessible counter:
RequestStats
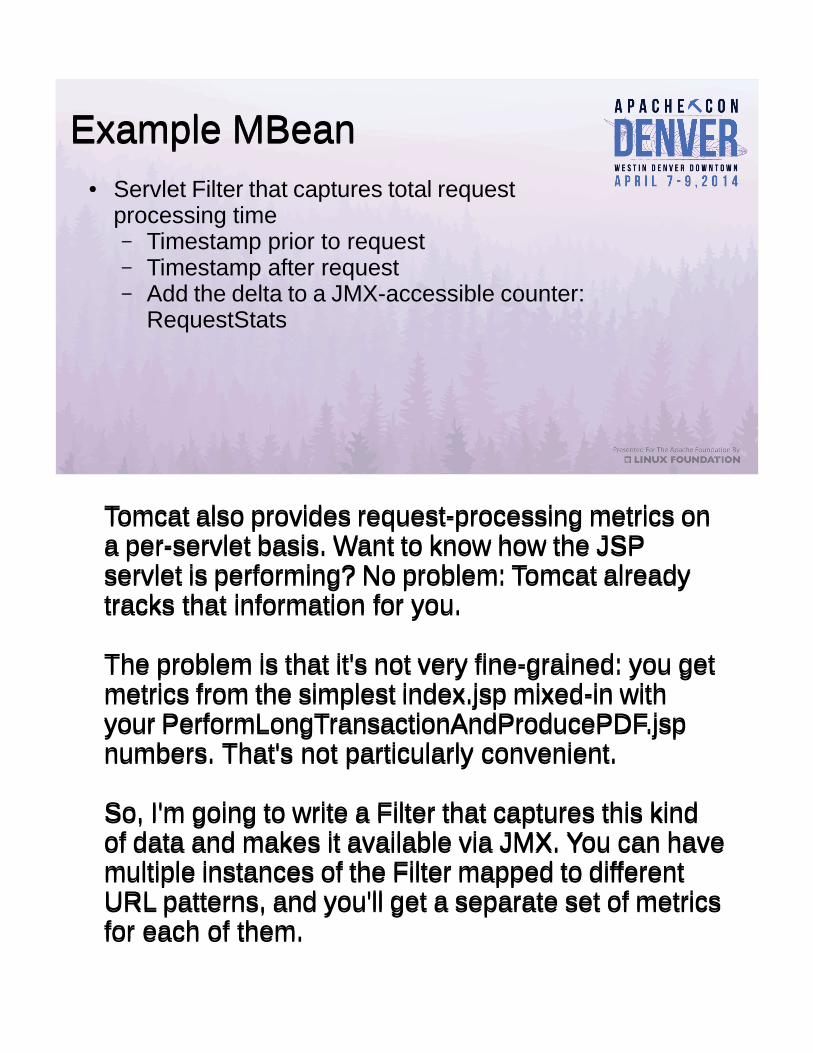
Tomcat also provides request-processing metrics on a per-servlet basis. Want to know how the JSP servlet is performing? No problem: Tomcat already tracks that information for you.
The problem is that it's not very fine-grained: you get metrics from the simplest index.jsp mixed-in with your PerformLongTransactionAndProducePDF.jsp numbers. That's not particularly convenient.
So, I'm going to write a Filter that captures this kind of data and makes it available via JMX. You can have multiple instances of the Filter mapped to different URL patterns, and you'll get a separate set of metrics for each of them.
RequestStats MBeanRequestStats MBean● Write an MBean
public interface RequestStatsMBean { public long getProcessingTime(); public long getRequestCount(); public void resetCounters();}public class RequestStats implements RequestStatsMBean { [...] public void updateStats(long timestamp, ServletRequest request, long elapsed) { _totalElapsedTime.addAndGet(elapsed); _requestCount.incrementAndGet(); }
public long getProcessingTime(){ return _totalElapsedTime.get(); } public long getRequestCount() { return _requestCount.get(); } public void resetCounters() { _totalElapsedTime.set(0l); _requestCount.set(0l); }}
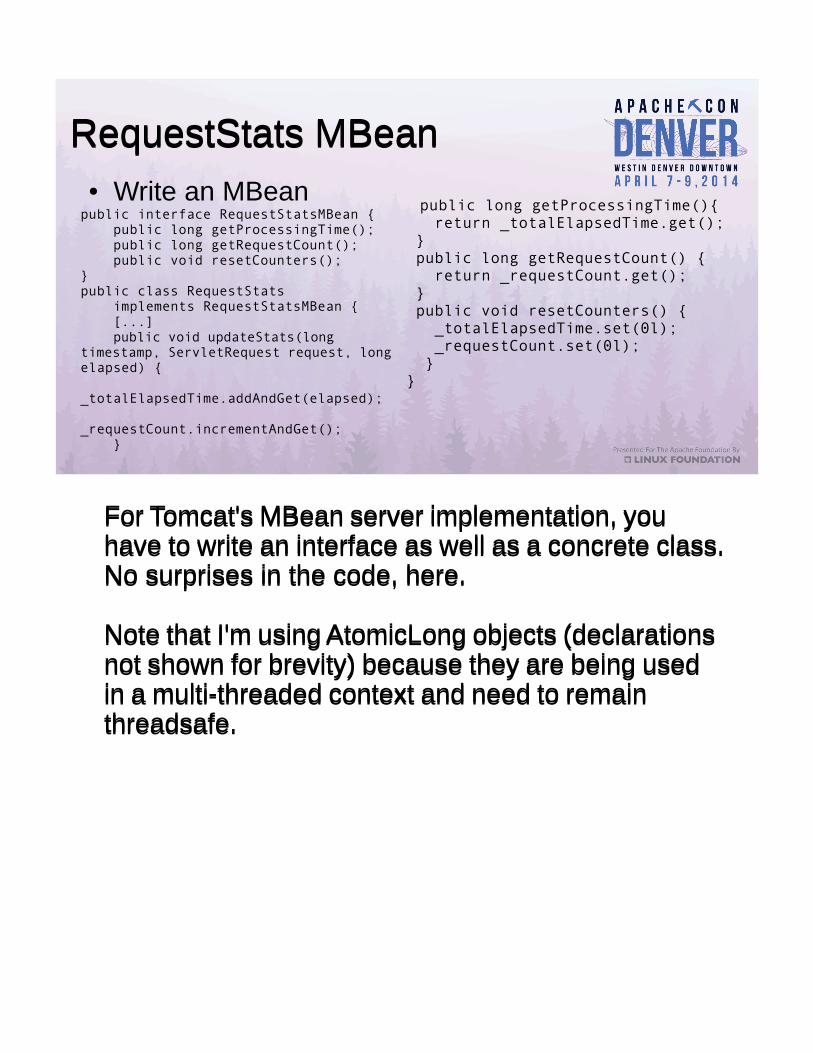
For Tomcat's MBean server implementation, you have to write an interface as well as a concrete class. No surprises in the code, here.
Note that I'm using AtomicLong objects (declarations not shown for brevity) because they are being used in a multi-threaded context and need to remain threadsafe.
For Tomcat's MBean server implementation, you have to write an interface as well as a concrete class. No surprises in the code, here.
Note that I'm using AtomicLong objects (declarations not shown for brevity) because they are being used in a multi-threaded context and need to remain threadsafe.

RequestStats MBeanRequestStats MBean● Write an MBean descriptor
<mbeans-descriptors> <mbean name="RequestStats" ...> <operation name="getProcessingTime" description="Gets the total number of milliseconds spent processing requests." impact="INFO" returnType="long" /> <operation name="getRequestCount" description="Gets the total number of requests processed." impact="INFO" returnType="long" />
<operation name="resetCounters" description="Resets all counters." impact="ACTION" returnType="void" /> </mbean></mbeans-descriptors>
Tomcat's documentation states that you must create an mbeans-descriptors.xml file and place it in the same package as your MBean interface, but I have found that it is not actually a requirement.
But, it's a good idea to write the descriptor because it documents what your attributes mean and what your and operations do. JMX clients can read this information and present it to the user. Documentation is always nice.
(I was unable to get Tomcat to read my mbeans-descriptors.xml file for some reason. Early-on in my work, I recall it working, but it stopped working at some point and I wasn't able to discover the cause.)
RequestStats MBeanRequestStats MBean● Create JAR
– Java interface– Java implementation– mbeans-descriptors.xml
● Put JAR into CATALINA_BASE/lib
● Create JAR– Java interface– Java implementation– mbeans-descriptors.xml
● Put JAR into CATALINA_BASE/lib
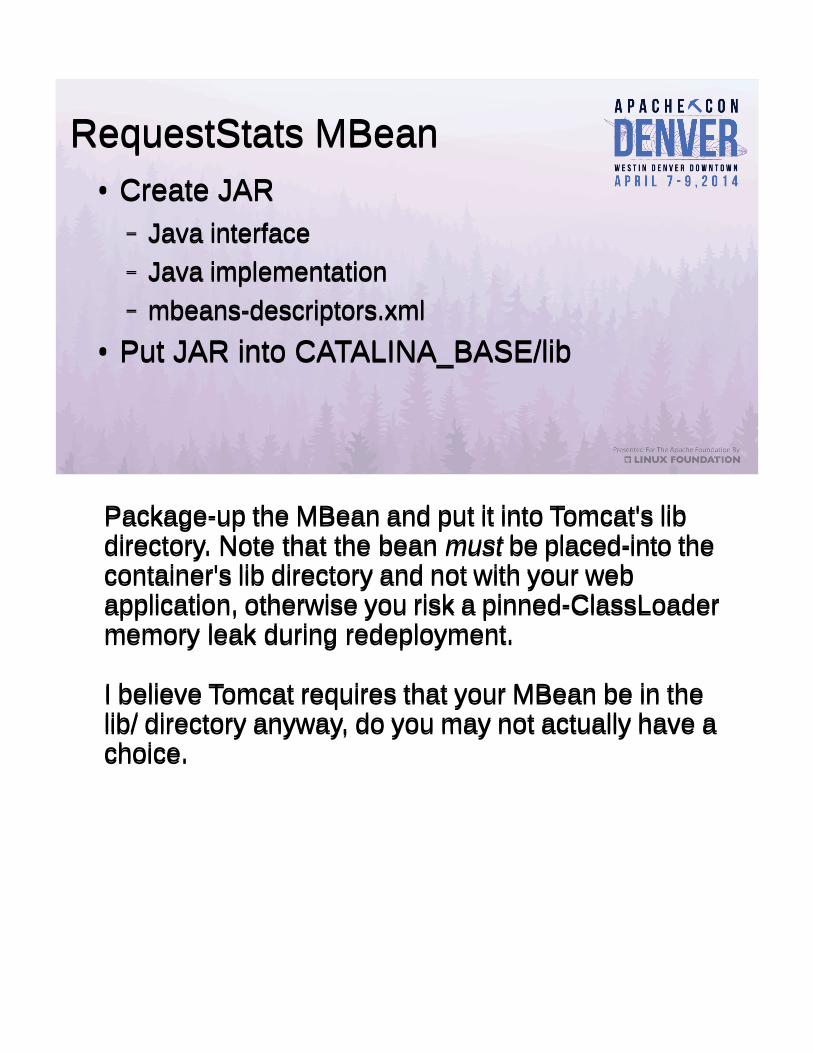
Package-up the MBean and put it into Tomcat's lib directory. Note that the bean must be placed-into the container's lib directory and not with your web application, otherwise you risk a pinned-ClassLoader memory leak during redeployment.
I believe Tomcat requires that your MBean be in the lib/ directory anyway, do you may not actually have a choice.
RequestStats MBeanRequestStats MBean● Write the Filter
public void init(FilterConfig config) { MBeanServer server = getServer(); server.registerMBean(_stats, new ObjectName("Example:RequestStats=RequestStats,name=" + filterName;)); } public void doFilter(...) { timestamp = elapsed = System.currentTimeMillis(); chain.doFilter(request, response); elapsed = System.currentTimeMillis() - elapsed;
_stats.updateStats(timestamp, request, elapsed); }
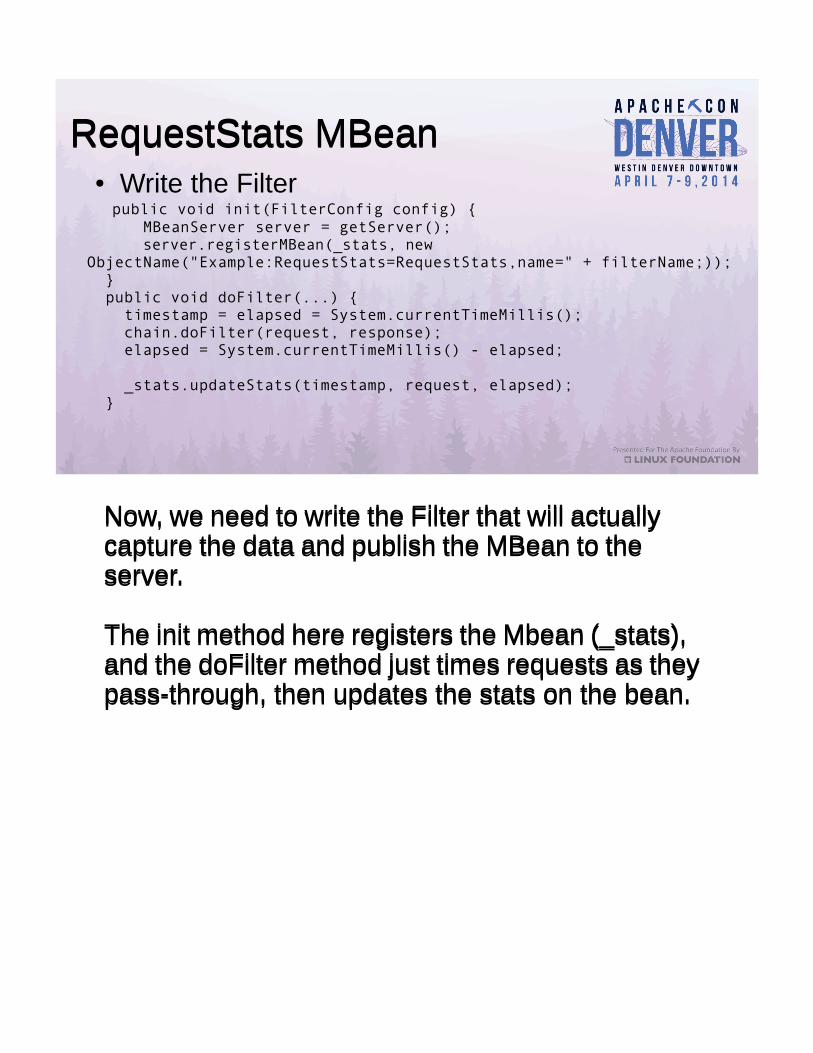
Now, we need to write the Filter that will actually capture the data and publish the MBean to the server.
The init method here registers the Mbean (_stats), and the doFilter method just times requests as they pass-through, then updates the stats on the bean.
Now, we need to write the Filter that will actually capture the data and publish the MBean to the server.
The init method here registers the Mbean (_stats), and the doFilter method just times requests as they pass-through, then updates the stats on the bean.
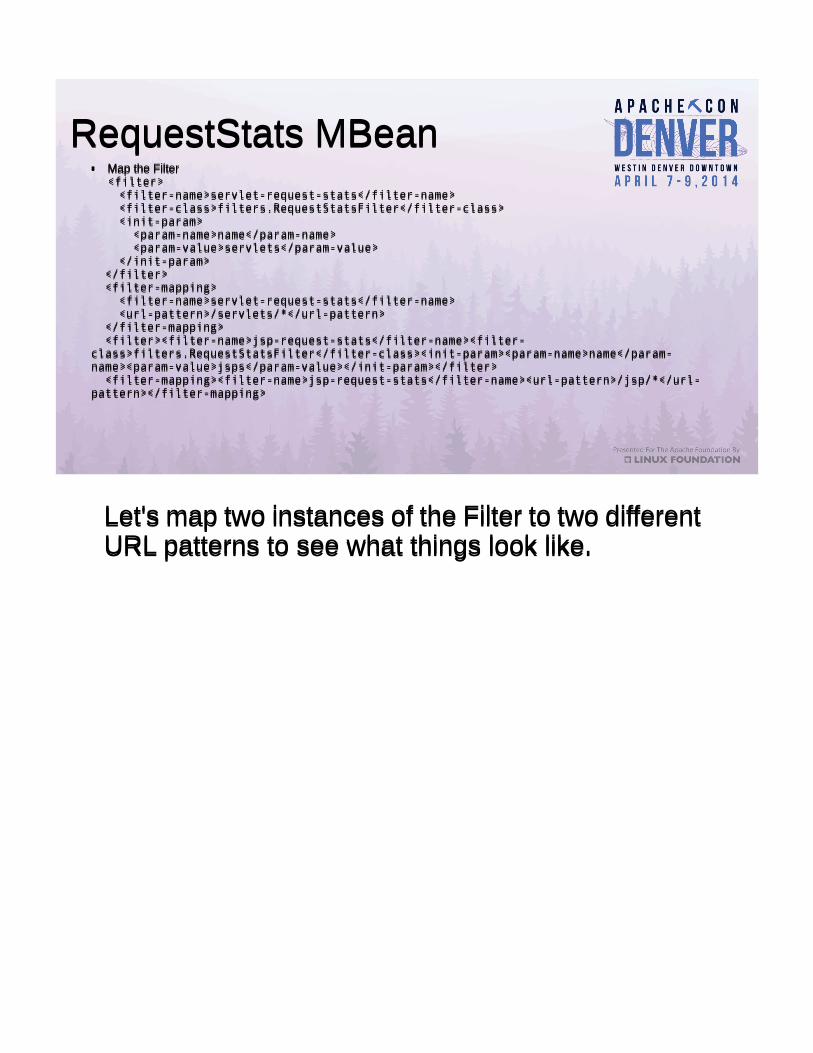
RequestStats MBeanRequestStats MBean● Map the Filter <filter> <filter-name>servlet-request-stats</filter-name> <filter-class>filters.RequestStatsFilter</filter-class> <init-param> <param-name>name</param-name> <param-value>servlets</param-value> </init-param> </filter> <filter-mapping> <filter-name>servlet-request-stats</filter-name> <url-pattern>/servlets/*</url-pattern> </filter-mapping> <filter><filter-name>jsp-request-stats</filter-name><filter-class>filters.RequestStatsFilter</filter-class><init-param><param-name>name</param-name><param-value>jsps</param-value></init-param></filter> <filter-mapping><filter-name>jsp-request-stats</filter-name><url-pattern>/jsp/*</url-pattern></filter-mapping>
● Map the Filter <filter> <filter-name>servlet-request-stats</filter-name> <filter-class>filters.RequestStatsFilter</filter-class> <init-param> <param-name>name</param-name> <param-value>servlets</param-value> </init-param> </filter> <filter-mapping> <filter-name>servlet-request-stats</filter-name> <url-pattern>/servlets/*</url-pattern> </filter-mapping> <filter><filter-name>jsp-request-stats</filter-name><filter-class>filters.RequestStatsFilter</filter-class><init-param><param-name>name</param-name><param-value>jsps</param-value></init-param></filter> <filter-mapping><filter-name>jsp-request-stats</filter-name><url-pattern>/jsp/*</url-pattern></filter-mapping>
Let's map two instances of the Filter to two different URL patterns to see what things look like.Let's map two instances of the Filter to two different URL patterns to see what things look like.
RequestStats MBeanRequestStats MBean
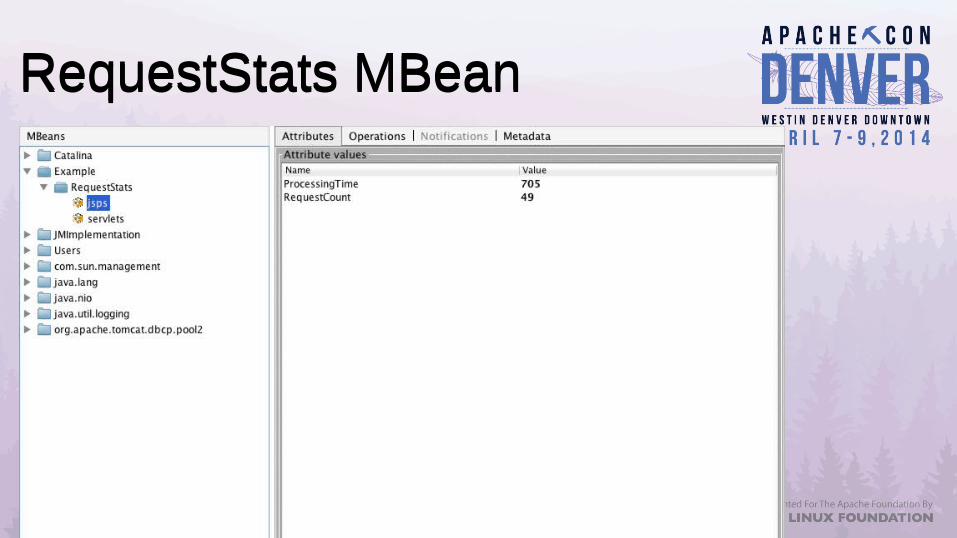
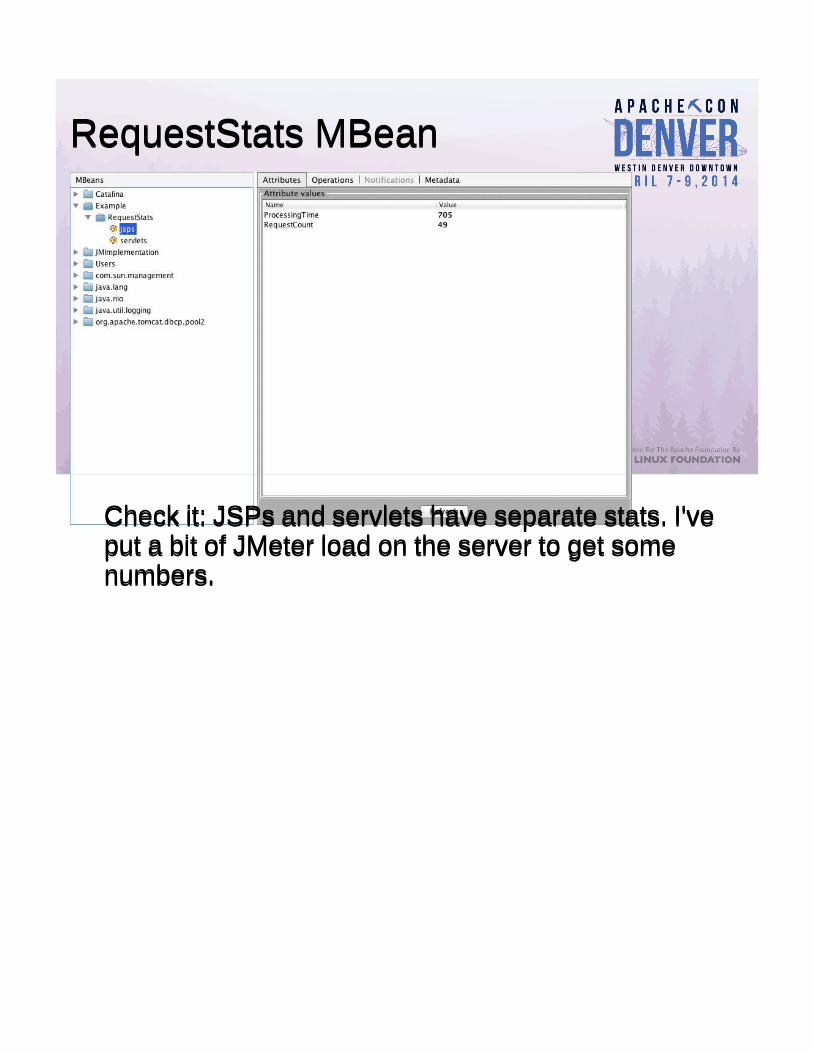
Check it: JSPs and servlets have separate stats. I've put a bit of JMeter load on the server to get some numbers.
Check it: JSPs and servlets have separate stats. I've put a bit of JMeter load on the server to get some numbers.
RequestStats MBeanRequestStats MBean
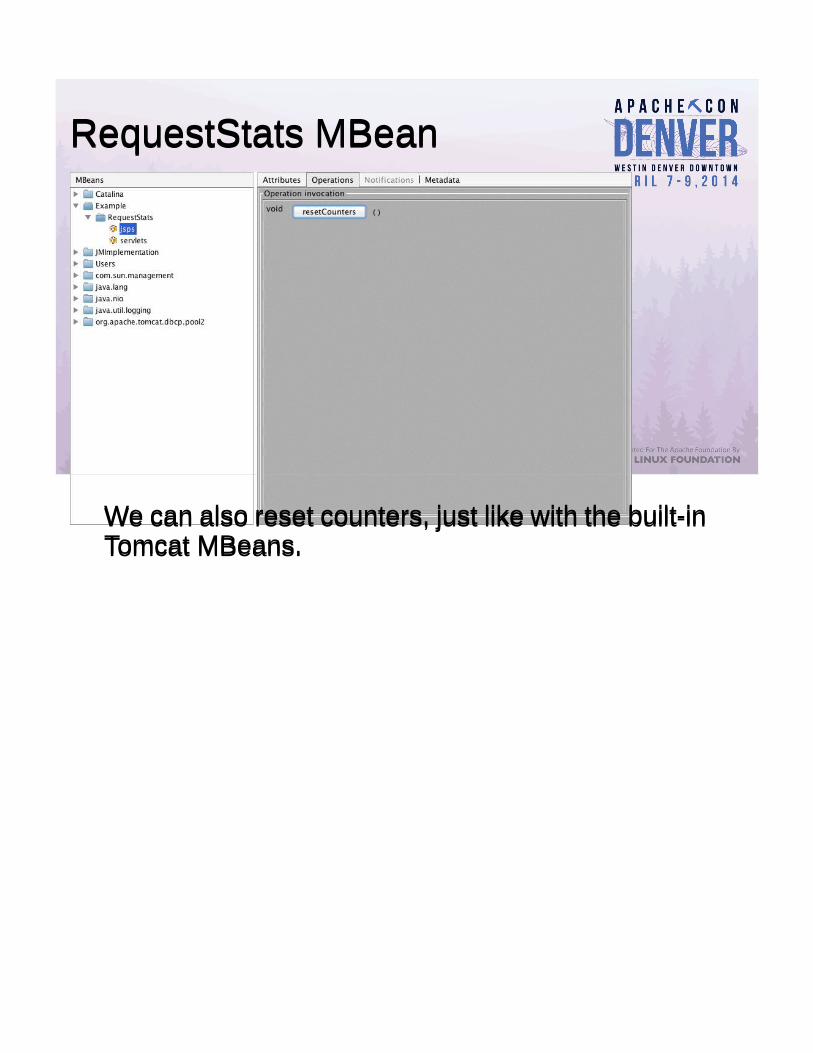
We can also reset counters, just like with the built-in Tomcat MBeans.We can also reset counters, just like with the built-in Tomcat MBeans.
Automated MonitoringAutomated Monitoring
● Remote Access● Large Scale● Constant
● Remote Access● Large Scale● Constant
All the examples thus far have used VisualVM which is a GUI interface. While that's fun for inspecting a single server and maybe doing some scouting for interesting data available, it's not going to work in the real world of production monitoring.
All the examples thus far have used VisualVM which is a GUI interface. While that's fun for inspecting a single server and maybe doing some scouting for interesting data available, it's not going to work in the real world of production monitoring.
Automated MonitoringAutomated Monitoring
● Remote Access● Large Scale● Constant● Need more tools!
● Remote Access● Large Scale● Constant● Need more tools!

Automated MonitoringAutomated Monitoring
● Nagios– S imp le– Flexible– Well-deployed– No-cost community version available
● Nagios– Simple– Flexible– Well-deployed– No-cost community version available
Let's use Nagios: a widely-deployed monitoring system.Let's use Nagios: a widely-deployed monitoring system.
Automated MonitoringAutomated Monitoring
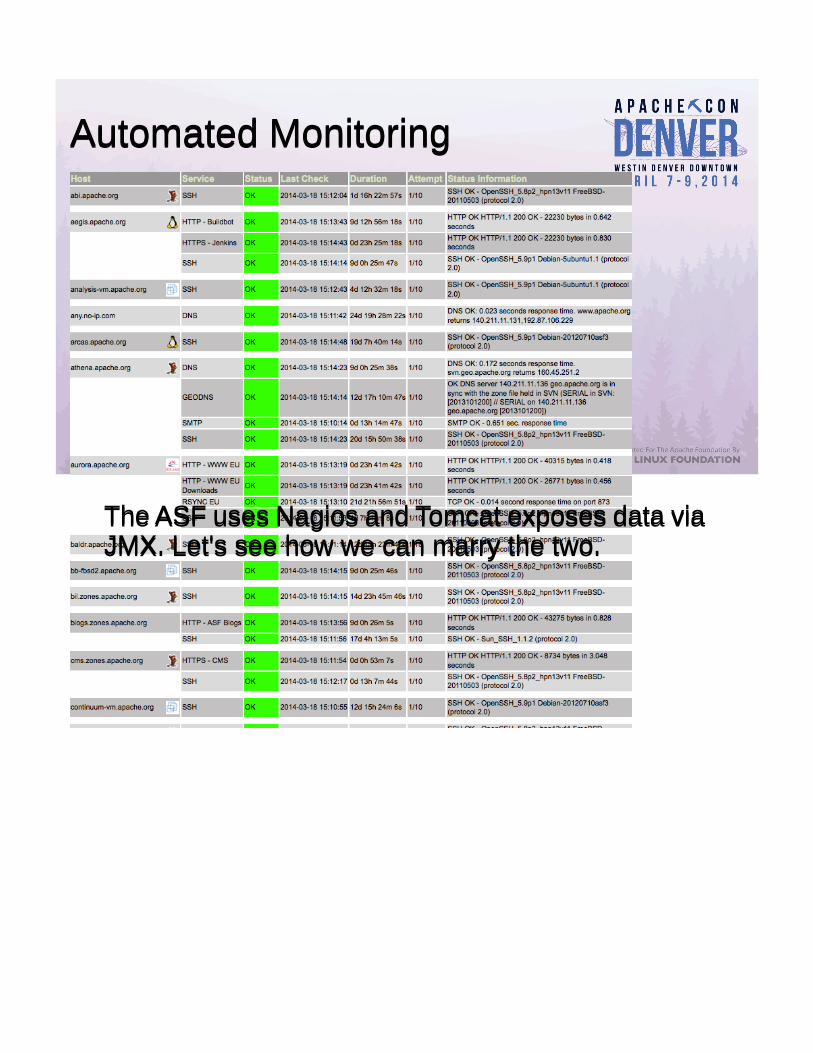
The ASF uses Nagios and Tomcat exposes data via JMX. Let's see how we can marry the two.The ASF uses Nagios and Tomcat exposes data via JMX. Let's see how we can marry the two.
Nagios MonitoringNagios Monitoring
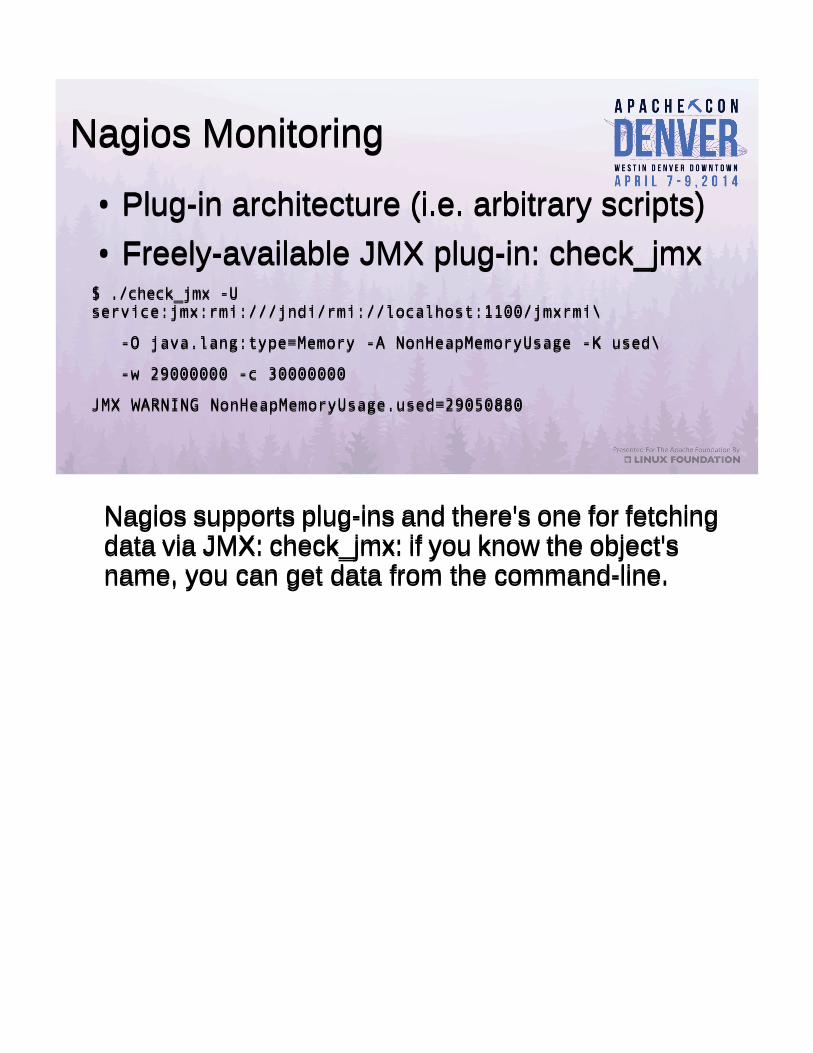
● Plug-in architecture (i.e. arbitrary scripts)● Freely-available JMX plug-in: check_jmx$ ./check_jmx -U service:jmx:rmi:///jndi/rmi://localhost:1100/jmxrmi\
-O java.lang:type=Memory -A NonHeapMemoryUsage -K used\
-w 29000000 -c 30000000
JMX WARNING NonHeapMemoryUsage.used=29050880
● Plug-in architecture (i.e. arbitrary scripts)● Freely-available JMX plug-in: check_jmx$ ./check_jmx -U service:jmx:rmi:///jndi/rmi://localhost:1100/jmxrmi\
-O java.lang:type=Memory -A NonHeapMemoryUsage -K used\
-w 29000000 -c 30000000
JMX WARNING NonHeapMemoryUsage.used=29050880
Nagios supports plug-ins and there's one for fetching data via JMX: check_jmx: if you know the object's name, you can get data from the command-line.
Nagios supports plug-ins and there's one for fetching data via JMX: check_jmx: if you know the object's name, you can get data from the command-line.
Nagios MonitoringNagios Monitoring
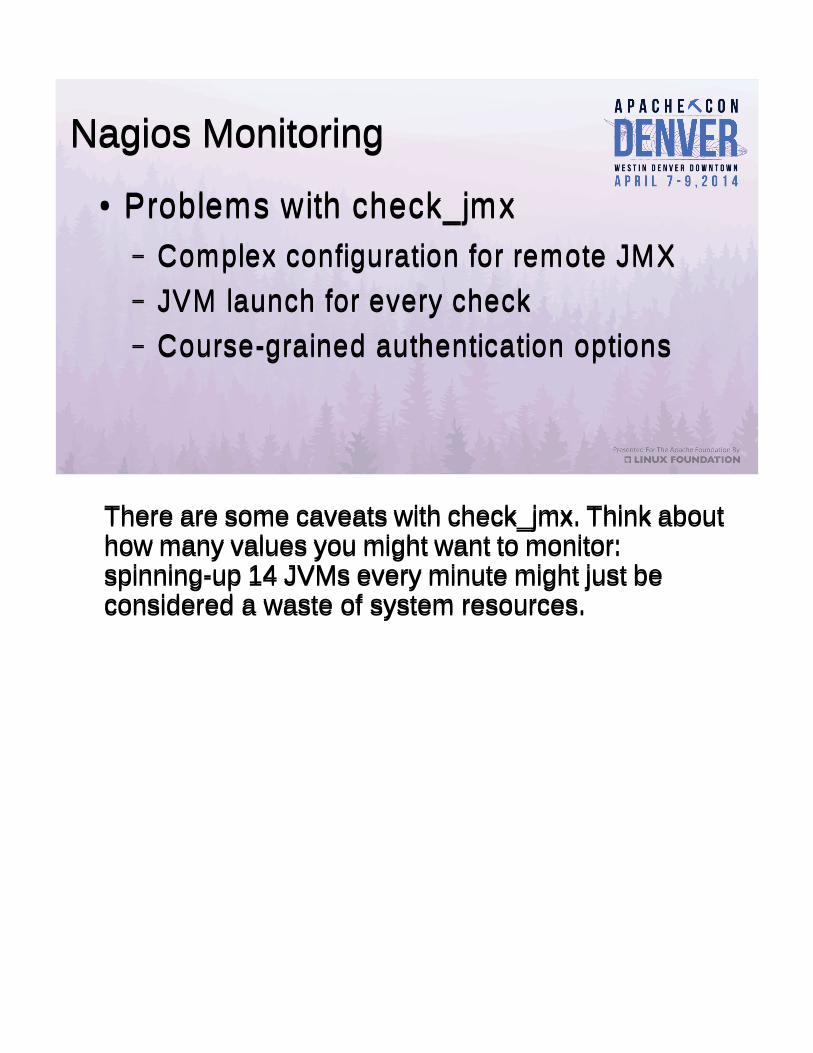
● Problems with check_jmx– Complex configuration for remote JMX– JVM launch for every check– Course-grained authentication options
● Problems with check_jmx– Complex configuration for remote JMX– JVM launch for every check– Course-grained authentication options
There are some caveats with check_jmx. Think about how many values you might want to monitor: spinning-up 14 JVMs every minute might just be considered a waste of system resources.
There are some caveats with check_jmx. Think about how many values you might want to monitor: spinning-up 14 JVMs every minute might just be considered a waste of system resources.
Nagios MonitoringNagios Monitoring
● Alternative Option: Tomcat's JMXProxyServlet– JMX data available via HTTP– Can use Tomcat's authentication tools
$ ./check_jmxproxy -U 'http://localhost/manager/jmxproxy?get=java.lang:type=Memory&att=HeapMemoryUsage&key=used' \ -w 29000000 -c 30000000JMX CRITICAL: OK - Attribute get 'java.lang:type=Memory' - HeapMemoryUsage - key 'used' = 100875248
* check_jmxproxy can be found at http://wiki.apache.org/tomcat/tools/check_jmxproxy.pl
Tomcat has JMXProxyServlet.
check_jmxproxy is a little Perl script I wrote to fetch data from JMXProxyServlet and provide Nagios-friendly output.
Same basic features of check_jmx except that Java and the JMX protocol aren't actually used: we use Tomcat's HTTP-tp-JMX proxy instead.
Tomcat has JMXProxyServlet.
check_jmxproxy is a little Perl script I wrote to fetch data from JMXProxyServlet and provide Nagios-friendly output.
Same basic features of check_jmx except that Java and the JMX protocol aren't actually used: we use Tomcat's HTTP-tp-JMX proxy instead.

Nagios MonitoringNagios Monitoring
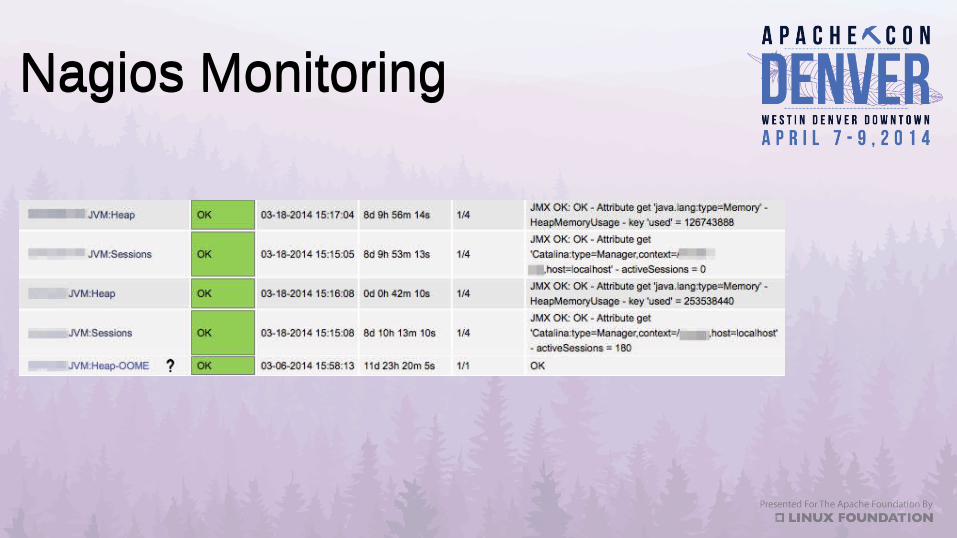
Here's a glance at some values sampled in a production setting. We'll talk about the OOME one later.
Here's a glance at some values sampled in a production setting. We'll talk about the OOME one later.
JMX Command-line TricksJMX Command-line Tricks● Show all logged-in usernamesfor sessionid in `wget -O - 'http://user:pwd@host/manager/jmxproxy?invoke=Catalina:type=Manager,context=/myapp,host=localhost&op=listSessionIds' \
| sed -e "s/ /\n/g"
| grep '^[0-9A-Za-z]\+\(\..*\)\?$' ;\
do wget -O – "http://user:pwd@host/manager/jmxproxy?invoke=Catalina:type=Manager,context=/myapp,host=localhost&op=getSessionAttribute&ps=$sessionid,user" ; done 2>/dev/null \
| grep User
● Show all logged-in usernamesfor sessionid in `wget -O - 'http://user:pwd@host/manager/jmxproxy?invoke=Catalina:type=Manager,context=/myapp,host=localhost&op=listSessionIds' \
| sed -e "s/ /\n/g"
| grep '^[0-9A-Za-z]\+\(\..*\)\?$' ;\
do wget -O – "http://user:pwd@host/manager/jmxproxy?invoke=Catalina:type=Manager,context=/myapp,host=localhost&op=getSessionAttribute&ps=$sessionid,user" ; done 2>/dev/null \
| grep User
We store a “user” bean in our sessions, and so we can use some command-line tricks mixed with data from check_jmxproxy to list all the currently logged-in users.
We can use similar tricks to expire all sessions that don't represent a logged-in user.
We store a “user” bean in our sessions, and so we can use some command-line tricks mixed with data from check_jmxproxy to list all the currently logged-in users.
We can use similar tricks to expire all sessions that don't represent a logged-in user.
Tracking Values Over TimeTracking Values Over Time● Some metrics are best observed as deltas
– Session count– Request error count
● Requires that you have a history of data● Requires that you consult the history of that data● check_jmxproxy provides such capabilities
● Some metrics are best observed as deltas– Session count– Request error count
● Requires that you have a history of data● Requires that you consult the history of that data● check_jmxproxy provides such capabilities
What about data whose rate-of-change is more important than its current value?
check_jmxproxy can store the previous value retrieved and then compare during the next invocation.
What about data whose rate-of-change is more important than its current value?
check_jmxproxy can store the previous value retrieved and then compare during the next invocation.

Tracking Values Over TimeTracking Values Over Time$ ./check_jmxproxy -U 'http://localhost/manager/jmxproxy?get=java.lang:type=Memory&att=HeapMemoryUsage&key=used' -w 33554432 -c 50331648 --write number.out --compare number.out
JMX OK: OK - Attribute get 'java.lang:type=Memory' - HeapMemoryUsage - key 'used' = 102278904, delta=[...]
$ ./check_jmxproxy -U 'http://localhost/manager/jmxproxy?get=java.lang:type=Memory&att=HeapMemoryUsage&key=used' -w 33554432 -c 50331648 --write number.out --compare number.out
JMX OK: OK - Attribute get 'java.lang:type=Memory' - HeapMemoryUsage - key 'used' = 113806144, delta=11527240
$ ./check_jmxproxy -U 'http://localhost/manager/jmxproxy?get=java.lang:type=Memory&att=HeapMemoryUsage&key=used' -w 33554432 -c 50331648 --write number.out --compare number.out
JMX OK: OK - Attribute get 'java.lang:type=Memory' - HeapMemoryUsage - key 'used' = 109264056, delta=-4542088
$ ./check_jmxproxy -U 'http://localhost/manager/jmxproxy?get=java.lang:type=Memory&att=HeapMemoryUsage&key=used' -w 33554432 -c 50331648 --write number.out --compare number.out
JMX OK: OK - Attribute get 'java.lang:type=Memory' - HeapMemoryUsage - key 'used' = 102278904, delta=[...]
$ ./check_jmxproxy -U 'http://localhost/manager/jmxproxy?get=java.lang:type=Memory&att=HeapMemoryUsage&key=used' -w 33554432 -c 50331648 --write number.out --compare number.out
JMX OK: OK - Attribute get 'java.lang:type=Memory' - HeapMemoryUsage - key 'used' = 113806144, delta=11527240
$ ./check_jmxproxy -U 'http://localhost/manager/jmxproxy?get=java.lang:type=Memory&att=HeapMemoryUsage&key=used' -w 33554432 -c 50331648 --write number.out --compare number.out
JMX OK: OK - Attribute get 'java.lang:type=Memory' - HeapMemoryUsage - key 'used' = 109264056, delta=-4542088
Let's watch heap memory usage over a few invocations.Let's watch heap memory usage over a few invocations.
Tracking Values Over TimeTracking Values Over Time● Session count
– Tomcat actually provides this already via Manager's sessionCreateRate attribute
● Request errors$ ./check_jmxproxy -U 'http://localhost/manager/jmxproxy?get=Catalina:type=RequestProcessor,worker="http-nio-127.0.0.1-8217",name=HttpRequest1&att=errorCount' -w 1 -c 10 --write errors.txt --compare errors.txt
JMX OK: OK - Attribute get 'Catalina:type=RequestProcessor,worker="http-nio-127.0.0.1-8217",name=HttpRequest1' - errorCount = 0, delta=0
● Session count– Tomcat actually provides this already via Manager's sessionCreateRate attribute
● Request errors$ ./check_jmxproxy -U 'http://localhost/manager/jmxproxy?get=Catalina:type=RequestProcessor,worker="http-nio-127.0.0.1-8217",name=HttpRequest1&att=errorCount' -w 1 -c 10 --write errors.txt --compare errors.txt
JMX OK: OK - Attribute get 'Catalina:type=RequestProcessor,worker="http-nio-127.0.0.1-8217",name=HttpRequest1' - errorCount = 0, delta=0
There are lots of data whose rates of change are more important than their current values. Session count and error count are among them.
There are lots of data whose rates of change are more important than their current values. Session count and error count are among them.
Detecting OutOfMemoryDetecting OutOfMemory● Many sources of OOME
– Heap exhaustion– PermGen exhaustion– Hit thread limit– Hit file descriptor limit
● Many sources of OOME– Heap exhaustion– PermGen exhaustion– Hit thread limit– Hit file descriptor limit
Let's talk about OutOfMemoryErrors. Of all monitoring questions I've heard about Java web applications, this one is always the first: how can I get notified about an OOME?
Let's talk about OutOfMemoryErrors. Of all monitoring questions I've heard about Java web applications, this one is always the first: how can I get notified about an OOME?
Detecting OutOfMemoryDetecting OutOfMemory● Two types of heap OOME
– One thread generates lots of local references– All threads collaborate to generate globally-
reachable objects (e.g. session data)● Former is recoverable, latter is not● You want to be notified in any case
● Two types of heap OOME– One thread generates lots of local references– All threads collaborate to generate globally-
reachable objects (e.g. session data)● Former is recoverable, latter is not● You want to be notified in any case
Let's focus on heap OOME for a moment.Let's focus on heap OOME for a moment.
Memory Pool ThresholdsMemory Pool Thresholds
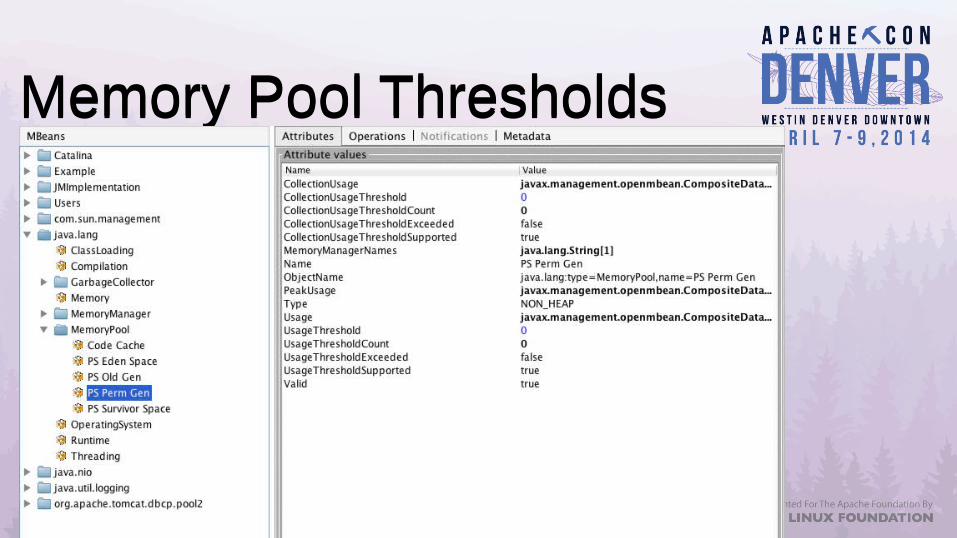
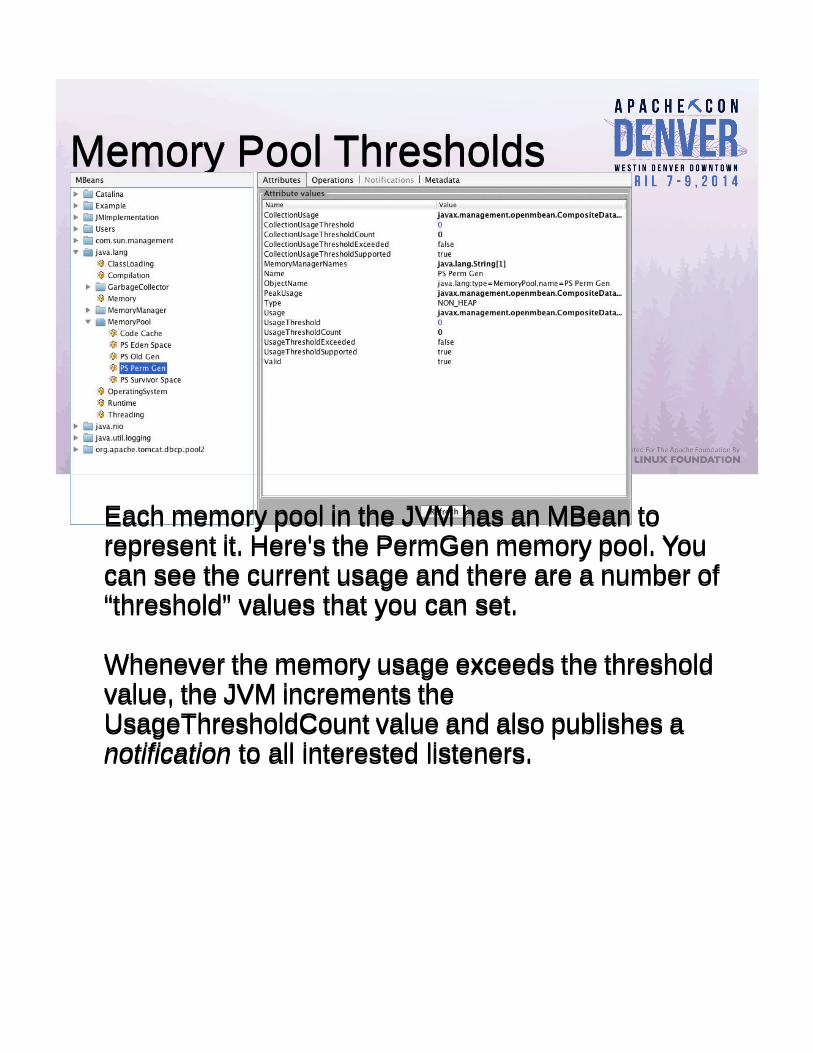
Each memory pool in the JVM has an MBean to represent it. Here's the PermGen memory pool. You can see the current usage and there are a number of “threshold” values that you can set.
Whenever the memory usage exceeds the threshold value, the JVM increments the UsageThresholdCount value and also publishes a notification to all interested listeners.
Memory Pool ThresholdsMemory Pool Thresholds
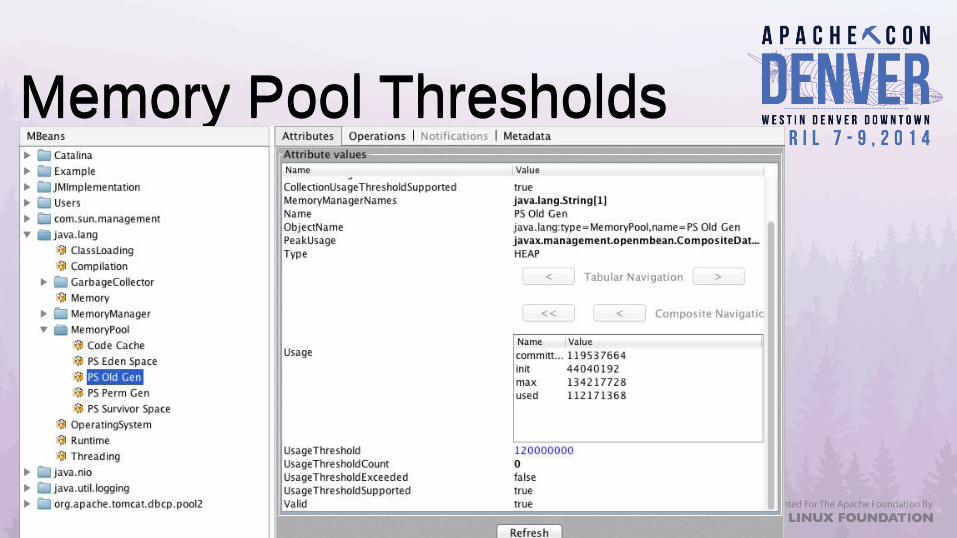
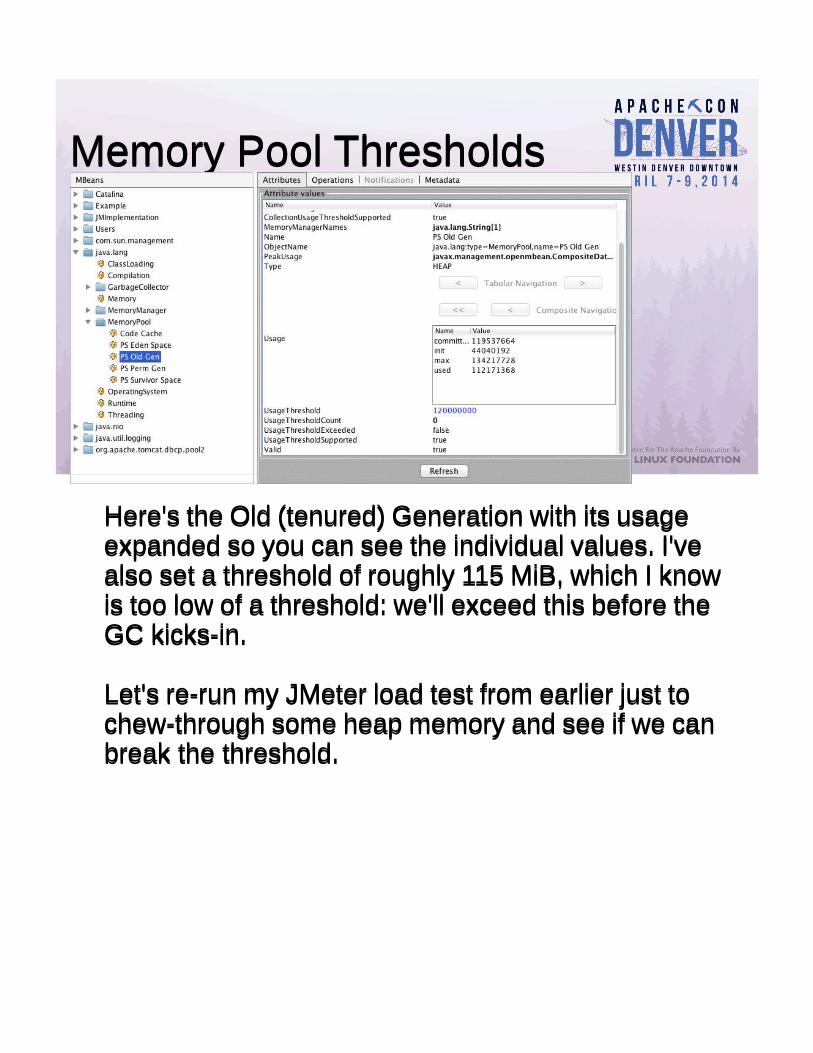
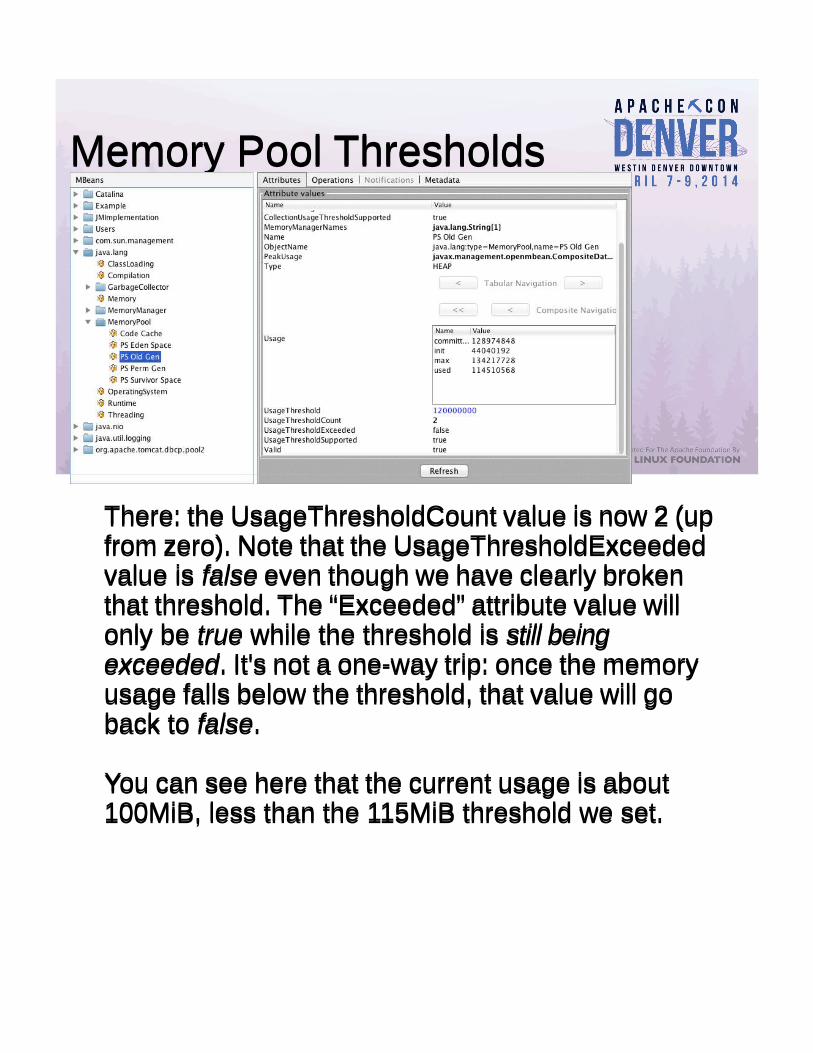
Here's the Old (tenured) Generation with its usage expanded so you can see the individual values. I've also set a threshold of roughly 115 MiB, which I know is too low of a threshold: we'll exceed this before the GC kicks-in.
Let's re-run my JMeter load test from earlier just to chew-through some heap memory and see if we can break the threshold.
Memory Pool ThresholdsMemory Pool Thresholds
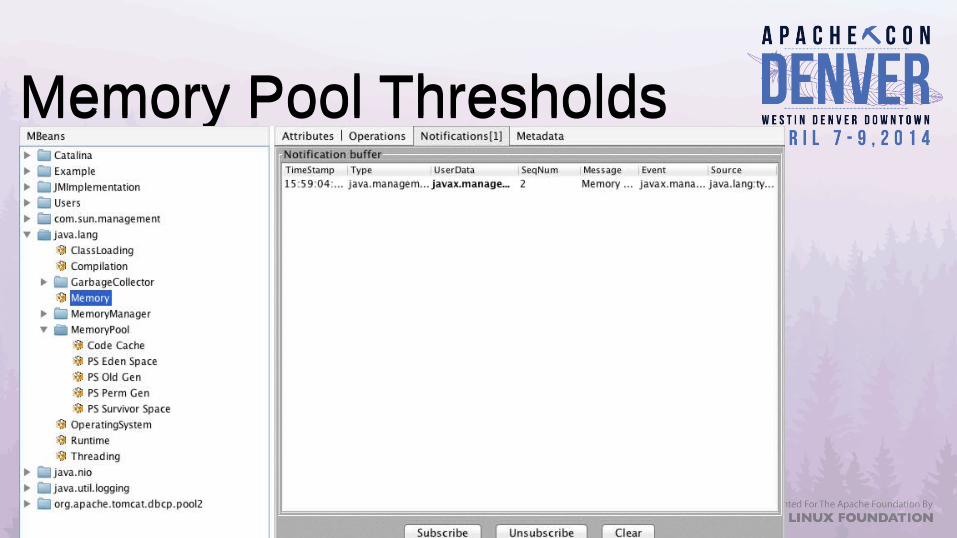
There: the UsageThresholdCount value is now 2 (up from zero). Note that the UsageThresholdExceeded value is false even though we have clearly broken that threshold. The “Exceeded” attribute value will only be true while the threshold is still being exceeded. It's not a one-way trip: once the memory usage falls below the threshold, that value will go back to false.
You can see here that the current usage is about 100MiB, less than the 115MiB threshold we set.
Memory Pool ThresholdsMemory Pool Thresholds
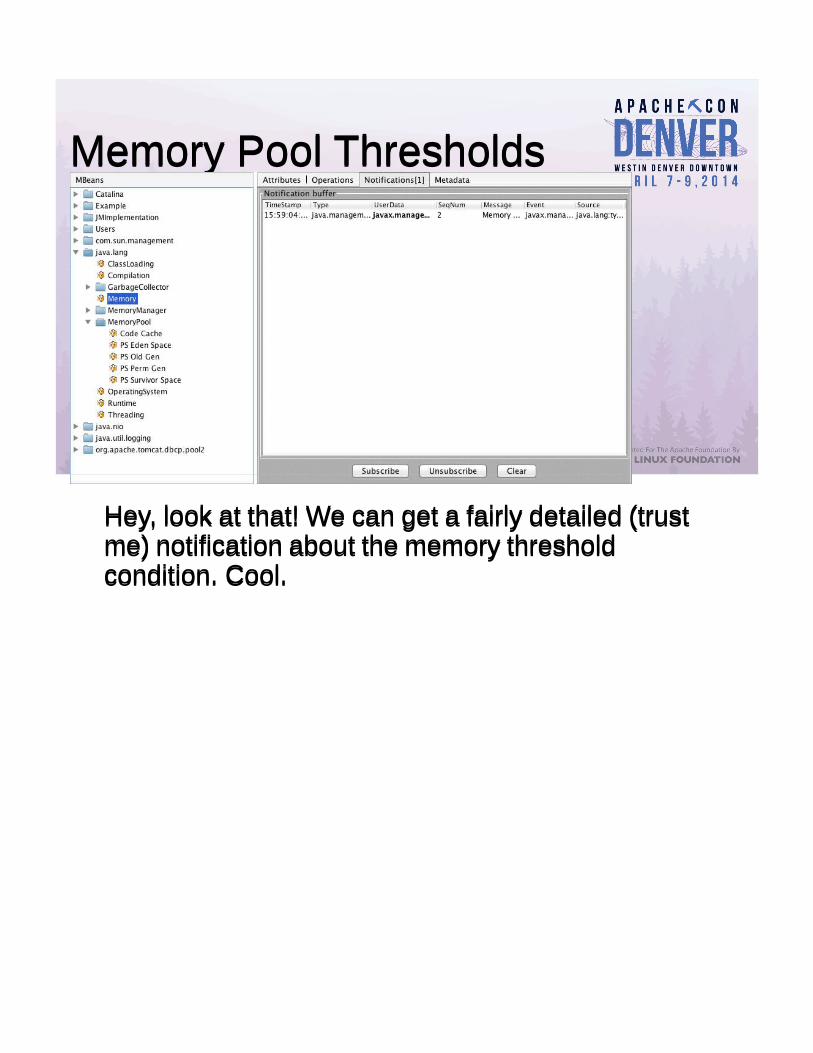
Hey, look at that! We can get a fairly detailed (trust me) notification about the memory threshold condition. Cool.
Hey, look at that! We can get a fairly detailed (trust me) notification about the memory threshold condition. Cool.
Memory Pool ThresholdsMemory Pool Thresholds● Choice of how to detect exceeded-
threshold conditions– Polling using check_jmxproxy– Register a notification listener from Java
● Have that listener take some action
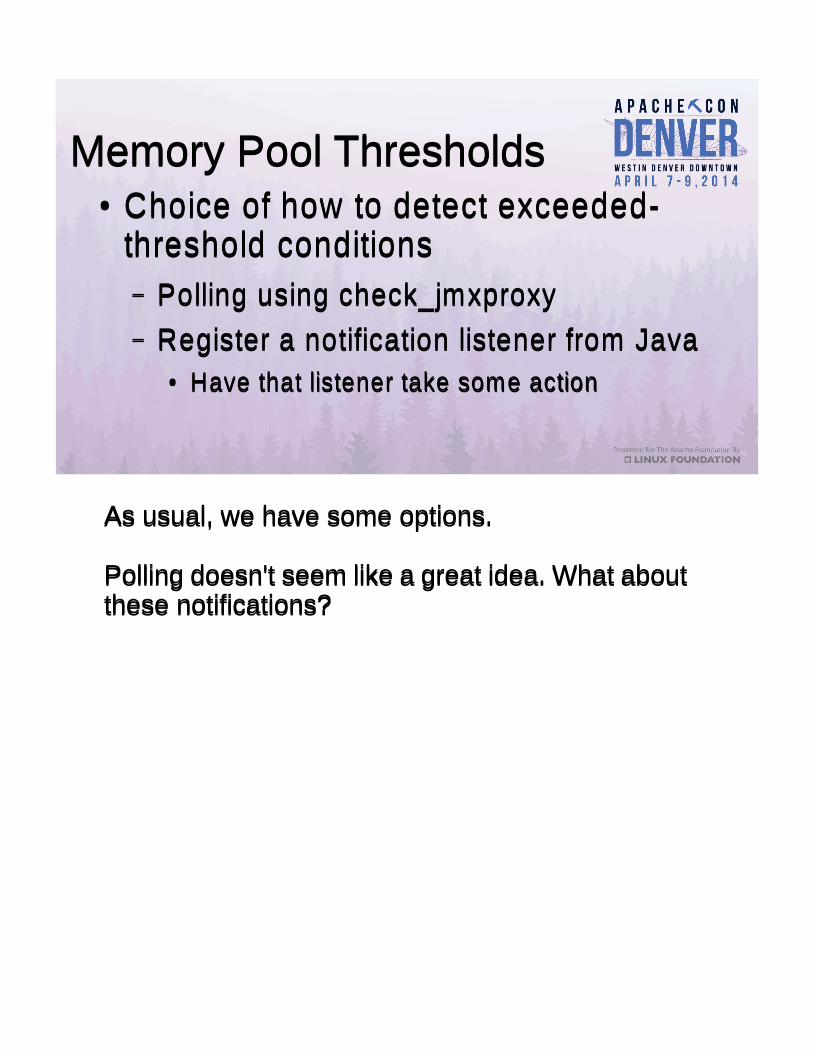
● Choice of how to detect exceeded-threshold conditions– Polling using check_jmxproxy– Register a notification listener from Java
● Have that listener take some action
As usual, we have some options.
Polling doesn't seem like a great idea. What about these notifications?
As usual, we have some options.
Polling doesn't seem like a great idea. What about these notifications?
Detect OutOfMemoryDetect OutOfMemory● Monitoring Memory Thresholds
– Set threshold on startup– Register a notification listener (callback)– Watch “exceeded” count (poll)– Report to monitoring software (Nagios)– Repeat for each memory pool you want to watch– Hope the JVM does not fail during notification– This is getting ridiculous
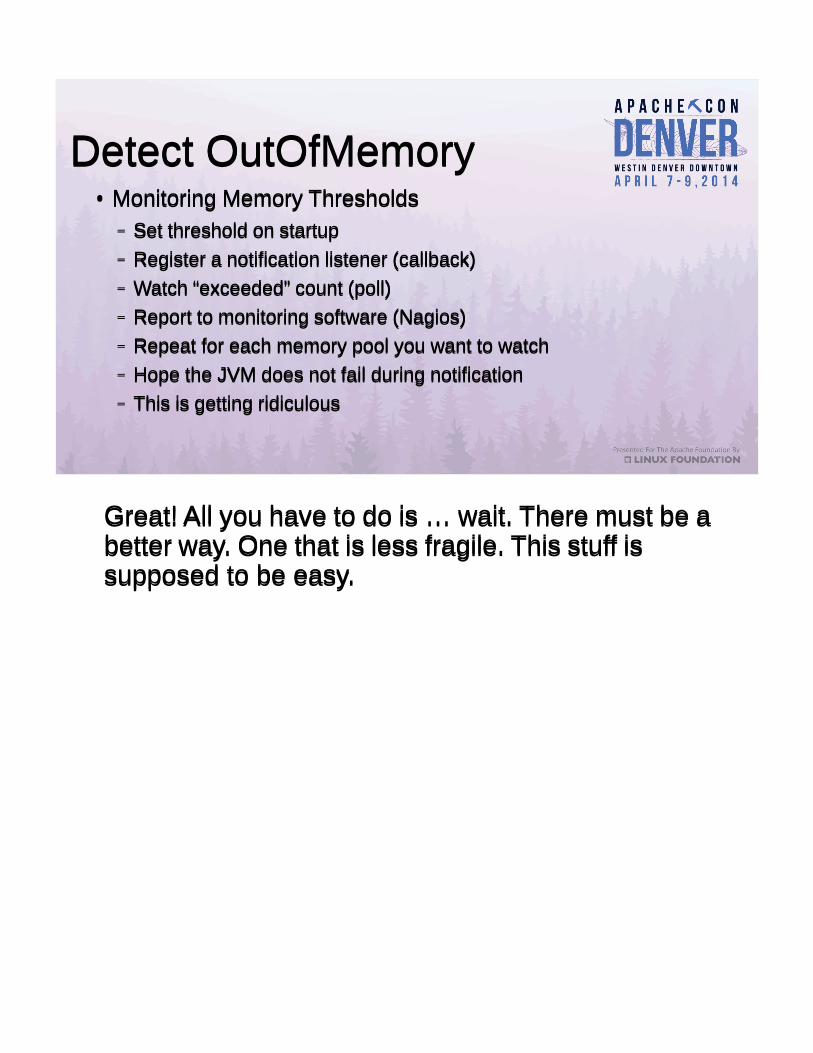
● Monitoring Memory Thresholds– Set threshold on startup– Register a notification listener (callback)– Watch “exceeded” count (poll)– Report to monitoring software (Nagios)– Repeat for each memory pool you want to watch– Hope the JVM does not fail during notification– This is getting ridiculous
Great! All you have to do is … wait. There must be a better way. One that is less fragile. This stuff is supposed to be easy.
Great! All you have to do is … wait. There must be a better way. One that is less fragile. This stuff is supposed to be easy.
Detecting OutOfMemoryDetecting OutOfMemory● JVM has an easier way● Use -XX:OnOutOfMemoryError to run a
command on first OOME detected by the JVM
● Need a command to notify Nagios
● JVM has an easier way● Use -XX:OnOutOfMemoryError to run a
command on first OOME detected by the JVM
● Need a command to notify Nagios
From my field research and anecdotal evidence, -XX:OnOutOfMemoryError seems to be the most reliable way to get notifications of OOMEs.
There is one problem: you only get notified of the first OOME detected, so if you want to get another notification, you're going to have to bounce the JVM.
From my field research and anecdotal evidence, -XX:OnOutOfMemoryError seems to be the most reliable way to get notifications of OOMEs.
There is one problem: you only get notified of the first OOME detected, so if you want to get another notification, you're going to have to bounce the JVM.
Notify Nagios on OOMENotify Nagios on OOME● Script that wraps curl$ curl -si \
--data-urlencode 'cmd_typ=30' \
--data-urlencode 'cmd_mod=2' \
--data-urlencode "host=myhost" \
--data-urlencode "service=JVM:Heap:OOME" \
--data-urlencode "plugin_state=2" \
--data-urlencode "plugin_output=OOME CRITICAL" \
'https://monitoring-host/nagios/cgi-bin/cmd.cgi'
● Script that wraps curl$ curl -si \
--data-urlencode 'cmd_typ=30' \
--data-urlencode 'cmd_mod=2' \
--data-urlencode "host=myhost" \
--data-urlencode "service=JVM:Heap:OOME" \
--data-urlencode "plugin_state=2" \
--data-urlencode "plugin_output=OOME CRITICAL" \
'https://monitoring-host/nagios/cgi-bin/cmd.cgi'
Script can be found at http://wiki.apache.org/tomcat/tools/nagios-send-passive-check.sh
Here is a curl command that can be used to poke a passive-check into Nagios. To encapsulate the command, as well as to prevent the HTTP authentication information from appearing in a ps listing, we'll wrap this command in a script.
Note that you'll probably want to use a Nagios service configured for only “passive” checks since no active checks are really possible. Also, disable “flap detection” otherwise the service will immediately appear to be “flapping” when you report an OOME to Nagios – I'm not sure why – and you won't get an actual notification because Nagios thinks it's doing you a favor.
Monitoring Tomcat with JMXMonitoring Tomcat with JMX● JMX Provides Monitoring and Management of JVMs● Tomcat exposes a great amount of information via JMX● Applications can expose anything to JMX via MBeans● JRE ships with tools for light JMX interaction● Practical use of JMX requires some additional tools
● JMX Provides Monitoring and Management of JVMs● Tomcat exposes a great amount of information via JMX● Applications can expose anything to JMX via MBeans● JRE ships with tools for light JMX interaction● Practical use of JMX requires some additional tools
Summary.Summary.
ResourcesResources● Presentation Slides
http://people.apache.org/~schultz/ApacheCon NA 2014/Tomcat Monitoring/
● Nagios passive-check scripthttp://wiki.apache.org/tomcat/tools/nagios-send-passive-check.sh
● check_jmxproxyhttp://wiki.apache.org/tomcat/tools/check_jmxproxy.pl
● Special thanks to Christopher Blunck (MBeans info)http://oss.wxnet.org/mbeans.html
● Presentation Slideshttp://people.apache.org/~schultz/ApacheCon NA 2014/Tomcat Monitoring/
● Nagios passive-check scripthttp://wiki.apache.org/tomcat/tools/nagios-send-passive-check.sh
● check_jmxproxyhttp://wiki.apache.org/tomcat/tools/check_jmxproxy.pl
● Special thanks to Christopher Blunck (MBeans info)http://oss.wxnet.org/mbeans.html
Resources.Questions?Resources.Questions?
Recommended